Article

A Conceptual Framework for Optimizing Performance in Sustainable Supply Chain Management and Digital Transformation towards Industry 5.0

by
Paul-Eric Dossou
1,2,*,
Esther Alvarez-de-los-Mozos
3 and
Pawel Pawlewski
4
1
Department of Technology and Societal Transition, Icam Site of Grand Paris Sud, 77127 Lieusaint, France
2
SPLOTT, AME, University of Gustave Eiffel, 77420 Champs-Sur-Marne, France
3
Department of Mechanics, Design and Industrial Management, University of Deusto, Avda Universidades 24, 48007 Bilbao, Spain
4
Faculty of Engineering Management, Poznan University of Technology, 60-965 Poznan, Poland
*
Author to whom correspondence should be addressed.
Mathematics 2024, 12(17), 2737; https://doi.org/10.3390/math12172737
Submission received: 4 June 2024 / Revised: 19 August 2024 / Accepted: 24 August 2024 / Published: 2 September 2024

Abstract

:
The economic growth of developed or emerging countries through globalization has prompted them to increase their supply chain performance. A large number of concepts, tools, and methodologies have been proposed in support of this performance improvement. They are mainly based on the use of classical optimization or enterprise modeling methods. However, environmental and social issues, not to mention digital transformation, are often ignored or not sufficiently integrated. Indeed, the world geopolitical situation, the increase in oil prices, and the commitment to protect our earth require the integration of sustainability aspects and Industry 4.0 concepts like digital twin and artificial intelligence in transforming the supply chain. This paper focuses on defining a conceptual framework to support sustainable supply chain management and digital transformation. It aims to exploit the sustainability and digital maturity of companies to transform their supply chains and enhance their performance to meet the challenges of Industry 5.0. Several practices related to sustainability, as well as two use cases on optimization and digital twin, are presented to illustrate this framework. Finally, based on the previous practices and use cases, an adapted framework for the supply chain manager to support the transition from Industry 4.0 to Industry 5.0 has been developed, as well as a performance dashboard.

1. Introduction

During the last two decades, the company supply chain has completely changed. Supply chain management corresponds to activity planning and management from suppliers to procurement, production, and distribution to customers [1]. The changes have varied because of internal or external logistics improvements, the geopolitical situation in the world, and globalization, which offers companies the possibility to increase their influence and markets. Classical optimization methods and tools have been developed. For instance, mathematical models such as nonlinear programming, mixed integer linear programming, or fuzzy logic are used in industry to optimize the supply chain [2]. Because of the versatility of the market, the variation in the cost of raw materials, and the price of the workforce, the objective of manufacturing cost reduction and profit increase becomes a priority for companies. However, the increase in fuel costs and the unstable events in the world have changed the situation by balancing internal supply chain costs and external costs. Optimization involves taking both into account in the transformation of the company’s supply chain.
The complexity of the issues and the validation of the solutions facilitate the implementation of Industry 4.0 methods and tools in supply chain performance. For instance, traffic flow prediction involves machine learning in addition to traditional statistical methods [3]. These hybrid and intelligent methods and models have defined and solved many complex problems, but they have also created the need for new technologies such as advanced robotics, big data, and the Internet of Things to be more efficient in helping companies optimize the supply chain. The use of these technologies in SMEs meets brakes such as the cost, the level of knowledge of the workers, safety, etc. In this case, the use of digital twins as an improvement tool becomes relevant because of the possibility of monitoring the supply chain in real time, but also because of the possibility of using simulation as a decision support tool to improve the company’s performance.
Finally, the introduction of sustainability as a criterion for supply chain optimization has recently been included in mathematical models due to increasingly demanding legislation and public awareness of planetary limits. This idea is in line with what is advocated by the Industry 5.0 concept. In fact, the aim of this concept is to create a more equitable and sustainable approach to production, taking into account the efficiency and profitability of manufacturing processes alongside the effects on employees and the environment [4]. In this context, several methods and tools have been developed. A multi-objective mixed-integer linear programming model for a sustainable closed-loop supply chain with recycling and remanufacturing that is able to optimize the product and component flow, the location of the plant, and the selection of the component suppliers has been developed in [5]. A framework interacting with the factors influencing transport sustainability indicators has been developed [6]. In [7], a hybrid approach has been developed to select sustainable suppliers and allocate orders based on quantitative and qualitative methods and intelligent algorithms such as fuzzy logic. A regression neural network with short-term memory is proposed for the prediction of short-term traffic flows [8]. To solve inventory management problems, a hybrid method combining a Bayesian neural network for the demand forecasting model with deep reinforcement learning for the planning model has been elaborated [9]. A method for associating economic and environmental aspects with supply chain performance improvement has been developed [10]. This multi-objective model focuses on supply chain cost minimization for the economic criteria and the minimization of environmental impact through life cycle assessment for the second criterion. Therefore, the existing literature shows the gradual incorporation of sustainability as a criterion in supply chain optimization models, but to our knowledge, there is a lack of models that address economic, social, and environmental issues in a combined way that adequately responds to the transition from a technology-centered Industry 4.0 to a human-centered Industry 5.0.
This paper aims to focus simultaneously on sustainable aspects in addition to triptych cost, lead time, and quality in supply chain performance improvement by exploiting new technologies and combining them with traditional methods. Special emphasis will be placed on using digital twins to sustainably optimize the supply chain.
The structure of the paper and its sections are shown in Figure 1. A detailed literature review presenting the methods and tools used in this paper is gathered in Section 2. In Section 3, a conceptual framework to support Industry 5.0 concepts is presented. Section 4 collects several sustainability practices and two use cases to illustrate and validate the previous concepts. The results of the practices and use cases from the previous section are summarized in Section 5. It also introduces a Supply Chain Management 5.0 framework and a dashboard. Finally, Section 6 discusses the conclusions and the most important future lines of research.

2. Related Work

This section explores the literature on sustainability, optimization, and digital twin to show what the added value of this paper will be and to find concepts and methods that can be combined to solve supply chain sustainable performance problems.

2.1. Literature Review on Sustainability

Sustainable development is a concept that was first portrayed in the Brundtland report to convey the idea of the reconciliation of economic, social, and environmental goals [11]. Indeed, the decisions made by a company and its supply chain should address the needs of all stakeholders from a triple bottom-line, long-term perspective.
There are a lot of decisions that affect the sustainability of the supply chain, such as how products are designed, what kind of materials are used, under what conditions they are manufactured and assembled, which criteria are employed to select suppliers, what transport modes are used to deliver products, or what is done with products at the end of their life cycle.
Currently, companies and supply chains are facing mounting pressure to reduce the carbon footprint of their activities due to increasing public awareness, tightening environmental regulations, and environmental management standards [12].
Communities demand that companies comply with human rights in their own factories and those of their suppliers, to pay fair wages to their employees or to pay fair taxes not only when they operate at a national level but also in an international context, often within the digital economy.
In terms of binding regulatory frameworks, the European Green Deal aims to achieve net zero greenhouse gas (GHG) emissions by 2050, decouple economic growth from resource use, and leave no person or place behind [13].
In relation to environmental management standards, they refer to frameworks that companies adopt voluntarily when they decide to put the environment at the center of their business strategy and go beyond the minimum legal compliance. The most recognized standards are [14] ISO14000, developed by the International Organization for Standardization, and EMAS, which applies to EU Member States. Today, there are a lot of companies that have been accredited to these standards, so they are less and less a competitive advantage and more and more a qualifying criterion.
Sustainability in the SC can be obtained by focusing on the sustainability of the three processes it comprises: procurement, production, and distribution [15].
Regarding the procurement process, it is usually one of the first processes that companies change for environmental reasons. This practice is often referred to as green procurement. Indeed, it is relatively easy, especially in competitive markets, to set strict environmental standards for suppliers by including them in the selection criteria. By doing so, companies can improve their own environmental performance by leveraging the efforts of their suppliers. Additionally, avoiding wider sourcing can reduce the demand for transport and, therefore, fuel consumption and carbon footprint.
In relation to the production process, it is very important to reduce the amount of waste generated by manufacturing activities that is sent to landfills, as well as to promote dematerialization by designing products with fewer materials. Furthermore, the carbon footprint of the production operations must be carefully measured and mitigated because it accounts for the majority of the embodied GHG emissions in a product. Finally, manufacturing companies should use design-for-longevity strategies to prolong product life and make repairs easy and inexpensive.
Finally, if we look at the distribution process, the most damaging activity is transport, which accounts for about a fourth of the EU’s total GHG emissions [16]. It can cause a number of externalities, such as air pollution, congestion, noise, accidents, or loss of biodiversity, and can seriously contribute to global warming and climate change. Due to their importance, we are going to focus on two important issues related to sustainability, i.e., decarbonizing transport and the circular economy.

2.1.1. Decarbonizing Transport

According to the ITF Transport Outlook 2021 [17], freight transport ton-km, which is a unit used to measure moving one ton over one kilometer, is expected to increase more than double by 2050.
The Kaya Identity [18] is a mathematical equation that states that the total amount of carbon dioxide emitted can be expressed as the product of four factors: human population, gross domestic product per capita [GDP/capita], energy intensity [Energy/GDP], and carbon intensity of energy consumed [GHG/Energy].
GHG emissions = Population × [GDP/Population] × [Energy/GDP] × [GHG/Energy]
McKinnon [19] adapts this framework to model the relationship between GHG emissions and the level of freight transport. In order to do so, we substitute tons-km for population, and we limit energy to that consumed by freight transport.
GHG emissions = GDP × [tonne-km)/GDP] × [Energy/tonne-km] × [GHG/Energy]
We are going to analyze the four key driving factors for GHG emissions:
  • GDP. This is related to economic production. Pope Francis [20] argues that a decrease in the pace of production and consumption can lead to another mode of progress and development where reuse, recovery, and recycling are encouraged. In addition, increasing the sharing economy and servitization trends, including access rather than ownership, can contribute to reducing the need for new primary materials.
  • Ton-km/GDP. It refers to the intensity with which the economy moves goods. In order to reduce this factor, freight transport must be decoupled from economic growth. Therefore, the distance traveled by vehicles that are empty or not completely full must be reduced. In order to achieve this goal, weight limitations for each type of vehicle should be relaxed, vehicle load factors should be raised, and empty running should be avoided.
  • Energy/tone-km. It is related to the energy intensity of freight transport. This element is related to energy efficiency, which means improving the amount of freight moved per energy consumed.
  • GHG/Energy. It refers to the carbon content of energy used in freight transport. Therefore, it involves shifting to lower-carbon energy sources, such as natural gas, hydrogen, biofuels, or electricity generated by renewables.
Internalizing the environmental costs of the aforementioned externalities means including the environmental costs of transport in the company budgets, applying the “polluter pays” principle. The Eurovignette Directive is an initiative of the European Commission to regulate road charges for heavy-goods vehicles. Therefore, these costs are no longer ignored in decision-making and can induce behavioral change.

2.1.2. Circular Economy

Currently, the planet is experiencing a serious tension between the ever-increasing need for natural resources for new products and the limited amount of them, which in some cases is close to exhaustion. On the other hand, the capacity of the planet to absorb residues is also restricted in terms of landfills available where waste can be disposed of. A possible solution to this problem is to imitate natural ecosystems and compose closed-loop or circular systems in which products, parts, or materials are reintroduced into the economic system and reused, remanufactured, or recycled so that both the requirements of raw materials and landfill capacity are relaxed [21].
Circular economy avoids linear systems according to the “take-make-dispose” approach and transforms them into closed-loop ones, where waste dumped in landfill sites or incinerated is minimized and products, parts, or materials are reintroduced in the economy and their value preserved. Therefore, products are made to last by reusing, repurposing, fixing, upgrading, and recycling as much as possible, thus moving from a “cradle to grave” to a “cradle to reincarnation” life cycle model [22].
As part of the Green Deal, in 2022, the European Commission launched the Circular Economy Action Plan, where it identified seven key areas that are crucial to reaching a circular economy [23].
The Table 1 provides data on current recycling rates obtained in the EU [24] and European legislation [25] applied to the key areas, which correspond to different waste streams. It is quite clear that the recycling rates for different waste streams vary significantly, ranging from 1% in the case of the textile industry to 90.5% in the automotive industry.
Although the European Union can be considered a forerunner of the application of waste management legislation, these data are still far from the desired targets for recyclability and vary widely throughout the EU. In addition, the European Commission has issued a proposal for a directive on corporate sustainability due diligence. This legislation represents a major advance in extending circular economy principles to green supply chain management.
In summary, significant progress is being made toward supply chain sustainability through public awareness, existing mandatory and voluntary environmental standards, and new business models that are beginning to focus on the environment. The following section looks at the contributions in terms of methods and tools in the field of optimization.

2.2. Literature Review on Optimization

The supply chain is described as “the activities, individuals, organization, information and resources involved in delivering a product or service from a supplier to a customer” [26]. As mentioned in the previous section, a company’s supply chain can be divided into three main processes: procurement, production, and distribution, with interrelationships with other functions such as accounting, information systems, etc., and with suppliers and customers. With the integration of sustainability as a criterion, supply chain optimization concepts are changing. In the literature, a supply chain can be considered a complex system comprising autonomous entities, value chain processes, and uncertainties [27,28]. Then, optimizing the supply chain involves the exploitation of numerous concepts, theories, methods, and tools. This section will present some of them.

2.2.1. Enterprise Modeling Methods

The supply chain corresponds to a global entity, and its optimization involves the transformation of each of its sub-systems. The system can be transformed through methodologies based on theories of systems [29,30,31,32]. Indeed, enterprise modeling methods allow for optimization the company supply chain. Three methodologies could be exploited in this frame:
  • CIMOSA [33] is an open systems architecture enterprise integration that includes a powerful enterprise modeling language and aims at model-based integration [34].
  • PERA [35] is a “detailed and pragmatic methodology covering the whole life cycle of an industrial project from inception to operation and even system disposal” [34].
  • The GRAI [36] methodology is based on a reference architecture describing the production manufacturing structure and how it can be managed. It also uses concepts and models to improve business performance through an efficient general approach. The GRAI methodology integrates the concepts of both previous methods by studying the company in detail during the transformation process [36]. Its originality is the analysis of the company through decisional, informational, process, functional, and physical views, studying in detail the enterprise.
These enterprise modeling methods require that they be combined with operational methods and tools to really increase company performance. The following subsections aim to focus on these operational optimization methods.

2.2.2. Methods and Tools Based on Operational Research Theories

The methods and tools based on operational research theories used for company supply chain optimization are numerous. They are generally used in each part of the supply chain. For instance, classical mathematical programming models are found in the literature to solve supply chain management and optimization problems focusing on production, processing, distribution, retailing, or marketing [37]. They can be classified into network design, location of facilities, vehicle routing, allocation of resources and capacity, allocation of markets and supply, mode of transport and allocation of transport capacity, etc. [38]. Linear programming, non-linear programming, multi-objective programming, stochastic programming, heuristics, algorithms, metaheuristics, and fuzzy programming are the methods used in these cases. For example, ref. [39] studies multi-period production planning using stochastic programming to maximize profit over a finite planning horizon; ref. [40] focuses on vehicle routing and uses fuzzy non-linear programming to minimize transport costs and product waste. For these methods and tools, the objectives are generally minimization of costs and maximization of profit, reduction of delay, and maximization of quality. Indeed, other criteria can be associated with and combined for the optimization process. Ref. [41] solves network design problems by using mixed integer linear programming to design supply chains that take into account economic, social, and environmental sustainability. Solutions to certain problems are difficult to find using traditional methods, but artificial intelligence tools can be used to find them.

2.2.3. Methods and Tools Based on Artificial Intelligence

When classical methods are not sufficient in terms of problem description or solution, artificial intelligence (AI) methods are applied to the supply chain. AI is defined as “an area of study in the field of computer science concerning the development of computers able to engage in human-line activities through processes such as learning, reasoning, and self-correction” [42]. It also corresponds to “computational methods that imitate human mental activities such as thinking, inference, classification, interpretation, estimation and decision making” [43]. Artificial intelligence is made up of different methods and tools, such as machine learning, expert systems, fuzzy logic, multi-agent systems, and deep learning. Machine learning, defined as statistical AI methods capable of making predictions and conclusions based on data [44], consists of three categories: supervised, unsupervised, and reinforcement learning. Supervised learning techniques (e.g., neural nets, deep learning) will be used to obtain the best function describing the pattern between input and labeled output variables [45]. Unsupervised learning methods make it possible to “self-discover and detect data with common features from an unlabeled data set and to reveal hidden patterns in the data” [46]. Reinforcement learning methods are used to teach a sequence of actions that perform specific tasks and define rewarded and punished actions. Deep learning methods are used to capture non-linear relationships between users and objects and to deal with different types of data sources, such as images and text [47]. All these methods and techniques are nowadays exploited to define complex supply chain problems and solve them. For example, deep learning is being used in CNC machining and monitoring systems for the development of machining monitoring systems [48] and for the detection of defects in manufacturing processes [49]. Deep reinforcement learning methods are being used in manufacturing systems to control robots [50], but also to take advantage of their self-learning capabilities to make precise and fast decisions when faced with dynamic and complex situations [51]. Multi-agent systems are used to optimize scheduling in cloud manufacturing [52] and real-time simulation [53].
These include uncertainty, robustness (the ability of a system to return to its original state or move to a new, more desirable state following a perturbation [54]), risk, and vulnerability (the extent to which a supply chain may be exposed to a specific or non-specific risk occurrence [55]). The focus of these methods is on the triptych of cost, lead time, and quality optimization, but sustainability aspects can also be integrated into the performance optimization process. The following subsection focuses on sustainability in the company’s supply chain optimization process.

2.2.4. Supply Chain Sustainable Optimization Methods

Sustainability covers economic, social, and environmental issues. The focus is on supply chain optimization through the use of sustainable approaches to supply chain transformation and the definition of appropriate assessments. For example, the use of a sustainable supplier selection and procurement tool allows suppliers to be identified and assessed on the basis of their sustainable performance, including social, environmental, and economic aspects [56]. In this case, a multi-criteria decision methodology is proposed, combining tools such as SMART, MEREC, and ROG-based ranking to improve the quality of supplier selection. Methods integrating these sustainable aspects are therefore based on multiobjective decision algorithms or multicriteria decision tools, as described in [57] using a sustainable supplier management tool, in [58] developing a robust sustainable supplier selection and awarding approach, in [59] presenting a green sustainable supplier selection and awards model, or in [60] with a hybrid method combining multicriteria and multiobjective decision concepts. The decision-making tool can also be found in other industrial sectors, such as transportation or production management, with a combination of classical optimization tools and intelligent algorithms. Commonly used techniques include lifecycle analysis, cost–benefit analysis, eco-assessment, optimizing modeling, dynamic modeling, metrics modeling, data analytics (big data analytics tools), and multi-criteria decision tools.
All these tools have their advantages, and it could be pertinent to develop an approach combining most of them to increase, in any specific case, the company’s supply chain performance. Indeed, new technologies help to make this happen. The following section will focus on using digital twins to improve performance.

2.3. Literature Review on the Digital Twin

Digital twins (DT) have become a hot topic in recent years, gaining traction in both academic research and industrial applications [61]. This technology aligns perfectly with the innovative spirit of Industry 4.0, as it leverages automation tools and data exchange methods common in modern manufacturing, including the Internet of Things (IoT), cloud computing, cyber-physical systems (CPS), big data analytics, simulation, and augmented reality [62,63]. The surge in DT research is reflected in the growing number of review publications across diverse application areas. These areas include the following:
  • Manufacturing [64,65,66];
  • Maintenance [67,68];
  • Supply chain management [69,70], including regenerative supply chains [71];
  • Construction [72];
  • Agriculture [73].
This is not an exhaustive list, but it highlights the wide-ranging potential of digital twins.
It is important to note that in supply chains, material flow conversion typically involves repackaging or changing the logistics unit rather than fundamental product transformation.
Several terms are used to describe different types of digital representations: digital model, digital shadow, and digital twin (DT). The key distinction lies in the flow of data between the physical object and its digital counterpart [74]. While some authors emphasize real-time operation and data exchange, others focus more broadly on the digital representation itself. Here is a breakdown of the terms based on data flow [75]:
  • Digital model: this is a static, digitized version of a physical object, planned or existing.
  • Digital shadow: this represents a digital version of an object with a one-way data flow.
  • Digital twin (DT): this is the most advanced representation, featuring a two-way, real-time data exchange between the physical object and its digital counterpart. Changes in one are automatically reflected in the other.
It is important to acknowledge that not all authors focus solely on the data flow aspect. Some consider the broader concept of digital representation itself.
Pinning down a single, universally accepted definition of a digital twin (DT) remains a challenge [64,65]. While some cite Michael Grieves, the originator of the term, who defines it as having three parts: physical products, virtual products, and a two-way data connection linking them [76], others propose their own variations [77].
In essence, there’s a lack of complete uniformity in how DTs are defined, particularly regarding the physical relationship and level of detail within the digital representation.
The concept of a single, perfect digital twin (DT) has been challenged by some. They argue that companies may need multiple DTs with varying levels of detail, depending on the task at hand. Even a simple product description or 3D model can be considered a basic DT, albeit with limited functionality. However, perfectly describing any object is impossible. An object’s parameters are theoretically infinite, so achieving complete accuracy is not feasible. The key lies in identifying a limited set of parameters relevant to the specific problem a DT is designed to solve. Building a DT goes beyond simply collecting real-time data from a physical object. This approach creates a “digital shadow,” a snapshot of the current state captured through big data. A true DT should be able to do the following:
  • Distinguish between valuable information and noise: Not all the data collected is relevant. A DT needs to filter out irrelevant data (“pollution”) to focus on what matters.
  • Incorporate rules and behavior models: a DT should represent the object’s behavior through a set of rules, enabling simulations of various scenarios.
  • Perform simulations and optimization: By simulating different scenarios, DTs can answer “what-if” questions and identify optimal configurations based on defined objectives. This functionality makes DTs invaluable decision-making tools.
In essence, DTs offer a level of detail and functionality tailored to specific needs, providing crucial insights for informed decision-making.
Material flow conversion can leverage complex mathematical models to describe the behavior of physical objects or processes with high accuracy. This approach is often referred to as computational modeling. In today’s world, digital twins (DTs) are frequently employed for this purpose, acting as virtual models defined by these intricate mathematical models [78,79].
Material flow control, on the other hand, takes a more situational and managerial approach, relying on simulation methods. Simulation is particularly valuable when the sequence and layout of manufactured products impact production system performance. Also, in the context of a supply chain, the essence of which is the flow of materials, creating a digital twin using simulation is particularly important. However, it should be clearly noted that the term “simulation” in the supply chain context refers primarily to computer simulation. This simulation involves describing the modeled objects, the principles of operation of these objects, and the relationships between them directly in a computer program. Model objects are similar (preferably identical) to the modeled real objects. The similarity of model and object structures is the most important feature of computer simulation. Working with a simulation model involves conducting a simulation experiment. The process occurring during the experiment is similar to the process occurring in a real object; therefore, examining the object through its simulation model involves examining the characteristics of the process occurring during the experiment. Formalizing the representation of the system involves adopting a discrete event schema as the standard approach. The process of system functioning over time is treated as a sequence of events occurring in the system in accordance with the principles of its operation. Three-dimensional visualization is important and necessary in this context. The concept of an event is assigned a specific meaning depending on the purpose of the modeling. Thus, the authors consciously omit simulations based on the Monte Carlo method, computational simulations based on mathematical models, or Petri nets.
The literature review shows the panel of formalisms, concepts, and methods that could be exploited for developing the appropriate tool for the company’s digital and sustainable digital transformation.

3. The Conceptual Framework

This section presents a conceptual framework designed to help implement Industry 5.0 concepts in the company’s supply chain. The company represents a system or an artifact. Its digital and sustainable transformation is represented as a bijective application from A to A that involves the combination of parameters associated with new technologies, sustainability, and organizational characteristics. To make this company improvement a success, a framework describing transformation steps is required.
For instance, [80] introduces a framework based on the use of vertical integration and horizontal integration concepts to realize the company transformation. Indeed, the sustainable aspects have not been included in this framework. Industry 5.0 goes a step further by putting humans at the center of business and thus responding to societal needs. The conceptual framework presented in this paper is in line with the expectations of Industry 5.0, focusing on sustainability as the core of the digital transformation of the company’s supply chain.
The following subsections present the main elements of the conceptual framework: firstly, the three-dimensional representation of the framework representation; then, the mathematical model supporting it; the structure of the performance assessment tool used to measure the company’s sustainable existing and future performance; and finally, the architecture of an intelligent support system tool.

3.1. The Three-Dimensional Representation

A three-dimensional representation has been chosen to illustrate the conceptual framework, which is based on the one presented in [81], in order to capture the three axes of the transformation (see Figure 2). Sustainability is described as the essence of the transformation, encompassing economic, social, and environmental aspects, as shown in the figure. The first axis is the physical transformation of the supply chain, including the changes that will increase the company’s performance. As mentioned in Section 2.1, there are three main parts of the supply chain that need to be optimized: procurement, manufacturing, and distribution. Each of these parts is physically transformable. The structure and process of this transformation are integrated into the framework through the physical transformation axis. The organizational and optimal axis includes the use of optimization, or organizational tools and methods, to transform the company’s supply chain. The third axis is based on the introduction of new technologies such as IoT or robotics (physical use) and information tools (ERP, big data, digital twin) in the optimization of the company’s supply chain. Through the three axes and the methods/tools associated with each, corporate supply chain optimization becomes a process of continuous improvement. The next sub-section presents the mathematical model used to transform the company.

3.2. The Mathematical Model

At this point, a theoretical mathematical model is described that responds to the needs of Industry 5.0. Indexes, parameters, and decision variables make up the mathematical model for improving business performance. The model’s indices are shown in Table 2. The parameters are described in Table 3 and correspond to environmental, social, and economic expectations. The decision variables defined in Table 4 are those optimized in the mathematical model. The mathematical model is then a hybrid model with objective functions to be optimized and constraints that are related to the specifics of the company in terms of the economic, social, and environmental dimensions of the company’s supply chain.
The economic performance is obtained by optimizing the first objective function:
M i n E P = i = 1 I N i X l i + j = 1 J N j X l j + k = 1 K N k X l k + i = 1 I N i X m i + j = 1 J N j X m j + k = 1 K N k X m k                                                                 + i = 1 I N i X n i + j = 1 J N j X n j + k = 1 K N k X n k + i = 1 I N i X w i + j = 1 J N j X w j + k = 1 K N k X w k
The associated constraints to this optimization are as follows:
i = 1 I N i X l i + j = 1 J N j X l j + k = 1 K N k X l k C l i = 1 I N i X m i + j = 1 J N j X m j + k = 1 K N k X m k Q m i = 1 I N i X n i + j = 1 J N j X n j + k = 1 K N k X n k L D n i = 1 I N i X w i + j = 1 J N j X w j + k = 1 K N k X w k D M w
The social performance corresponds to the second objective function optimization:
M a x S P = i = 1 I N i Y o i + j = 1 J N j Y o j + k = 1 K N k Y o k + i = 1 I N i Y p i + j = 1 J N j Y p j + k = 1 K N k Y p k + i = 1 I N i Y q i                                                         + j = 1 J N j Y q j + k = 1 K N k Y q k
The constraints that are limiting the domain of the objective function are as follows:
i = 1 I N i Y o i + j = 1 J N j Y o j + k = 1 K N k Y o k W B o i = 1 I N i Y p i + j = 1 J N j Y p j + k = 1 K N k Y p k H p i = 1 I N i Y q i + j = 1 J N j Y q j + k = 1 K N k Y q k T r q
The environmental performance involves the third objective function optimization (negative impact optimization):
M i n E n P = i = 1 I N i D r i + j = 1 J N j D r j + k = 1 K N k D r k + i = 1 I N i D s i + j = 1 J N j D s j + k = 1 K N k D s k + i = 1 I N i D t i                                                               + j = 1 J N j D t j + k = 1 K N k D t k + i = 1 I N i D u i + j = 1 J N j D u j + k = 1 K N k D u k + i = 1 I N i D v i                                                               + j = 1 J N j D v j + k = 1 K N k D v k
The constraints associated with this objective function are represented below:
i = 1 I N i D r i + j = 1 J N j D r j + k = 1 K N k D r k W s t r i = 1 I N i D s i + j = 1 J N j D s j + k = 1 K N k D s k W s i = 1 I N i D t i + j = 1 J N j D t j + k = 1 K N k D t k A t i = 1 I N i D u i + j = 1 J N j D u j + k = 1 K N k D u k E n u i = 1 I N i D v i + j = 1 J N j D v j + k = 1 K N k D v k E M v
The company’s supply chain optimization is then a combination of these three dimensions of sustainability. Indeed, the problem to solve in this company improvement is complex, and classical operational research methods are not sufficient. The company’s problem modeling through the use of the mathematical model has to be done with efficiency; the points to improve have to be detected, and the solution or propositions of improvement must be defined. Numerous aspects, such as the diversity of data to manage, the measure of the company state in terms of performance, the integration of optimization rules, and the complexity of the decisions to make, have to be considered to find the adapted solution. Most of these aspects of integration are realized through the development of an intelligent system to support the concepts presented. The following subsection focuses on the description of the company performance assessment structure to exploit in the intelligent tool.

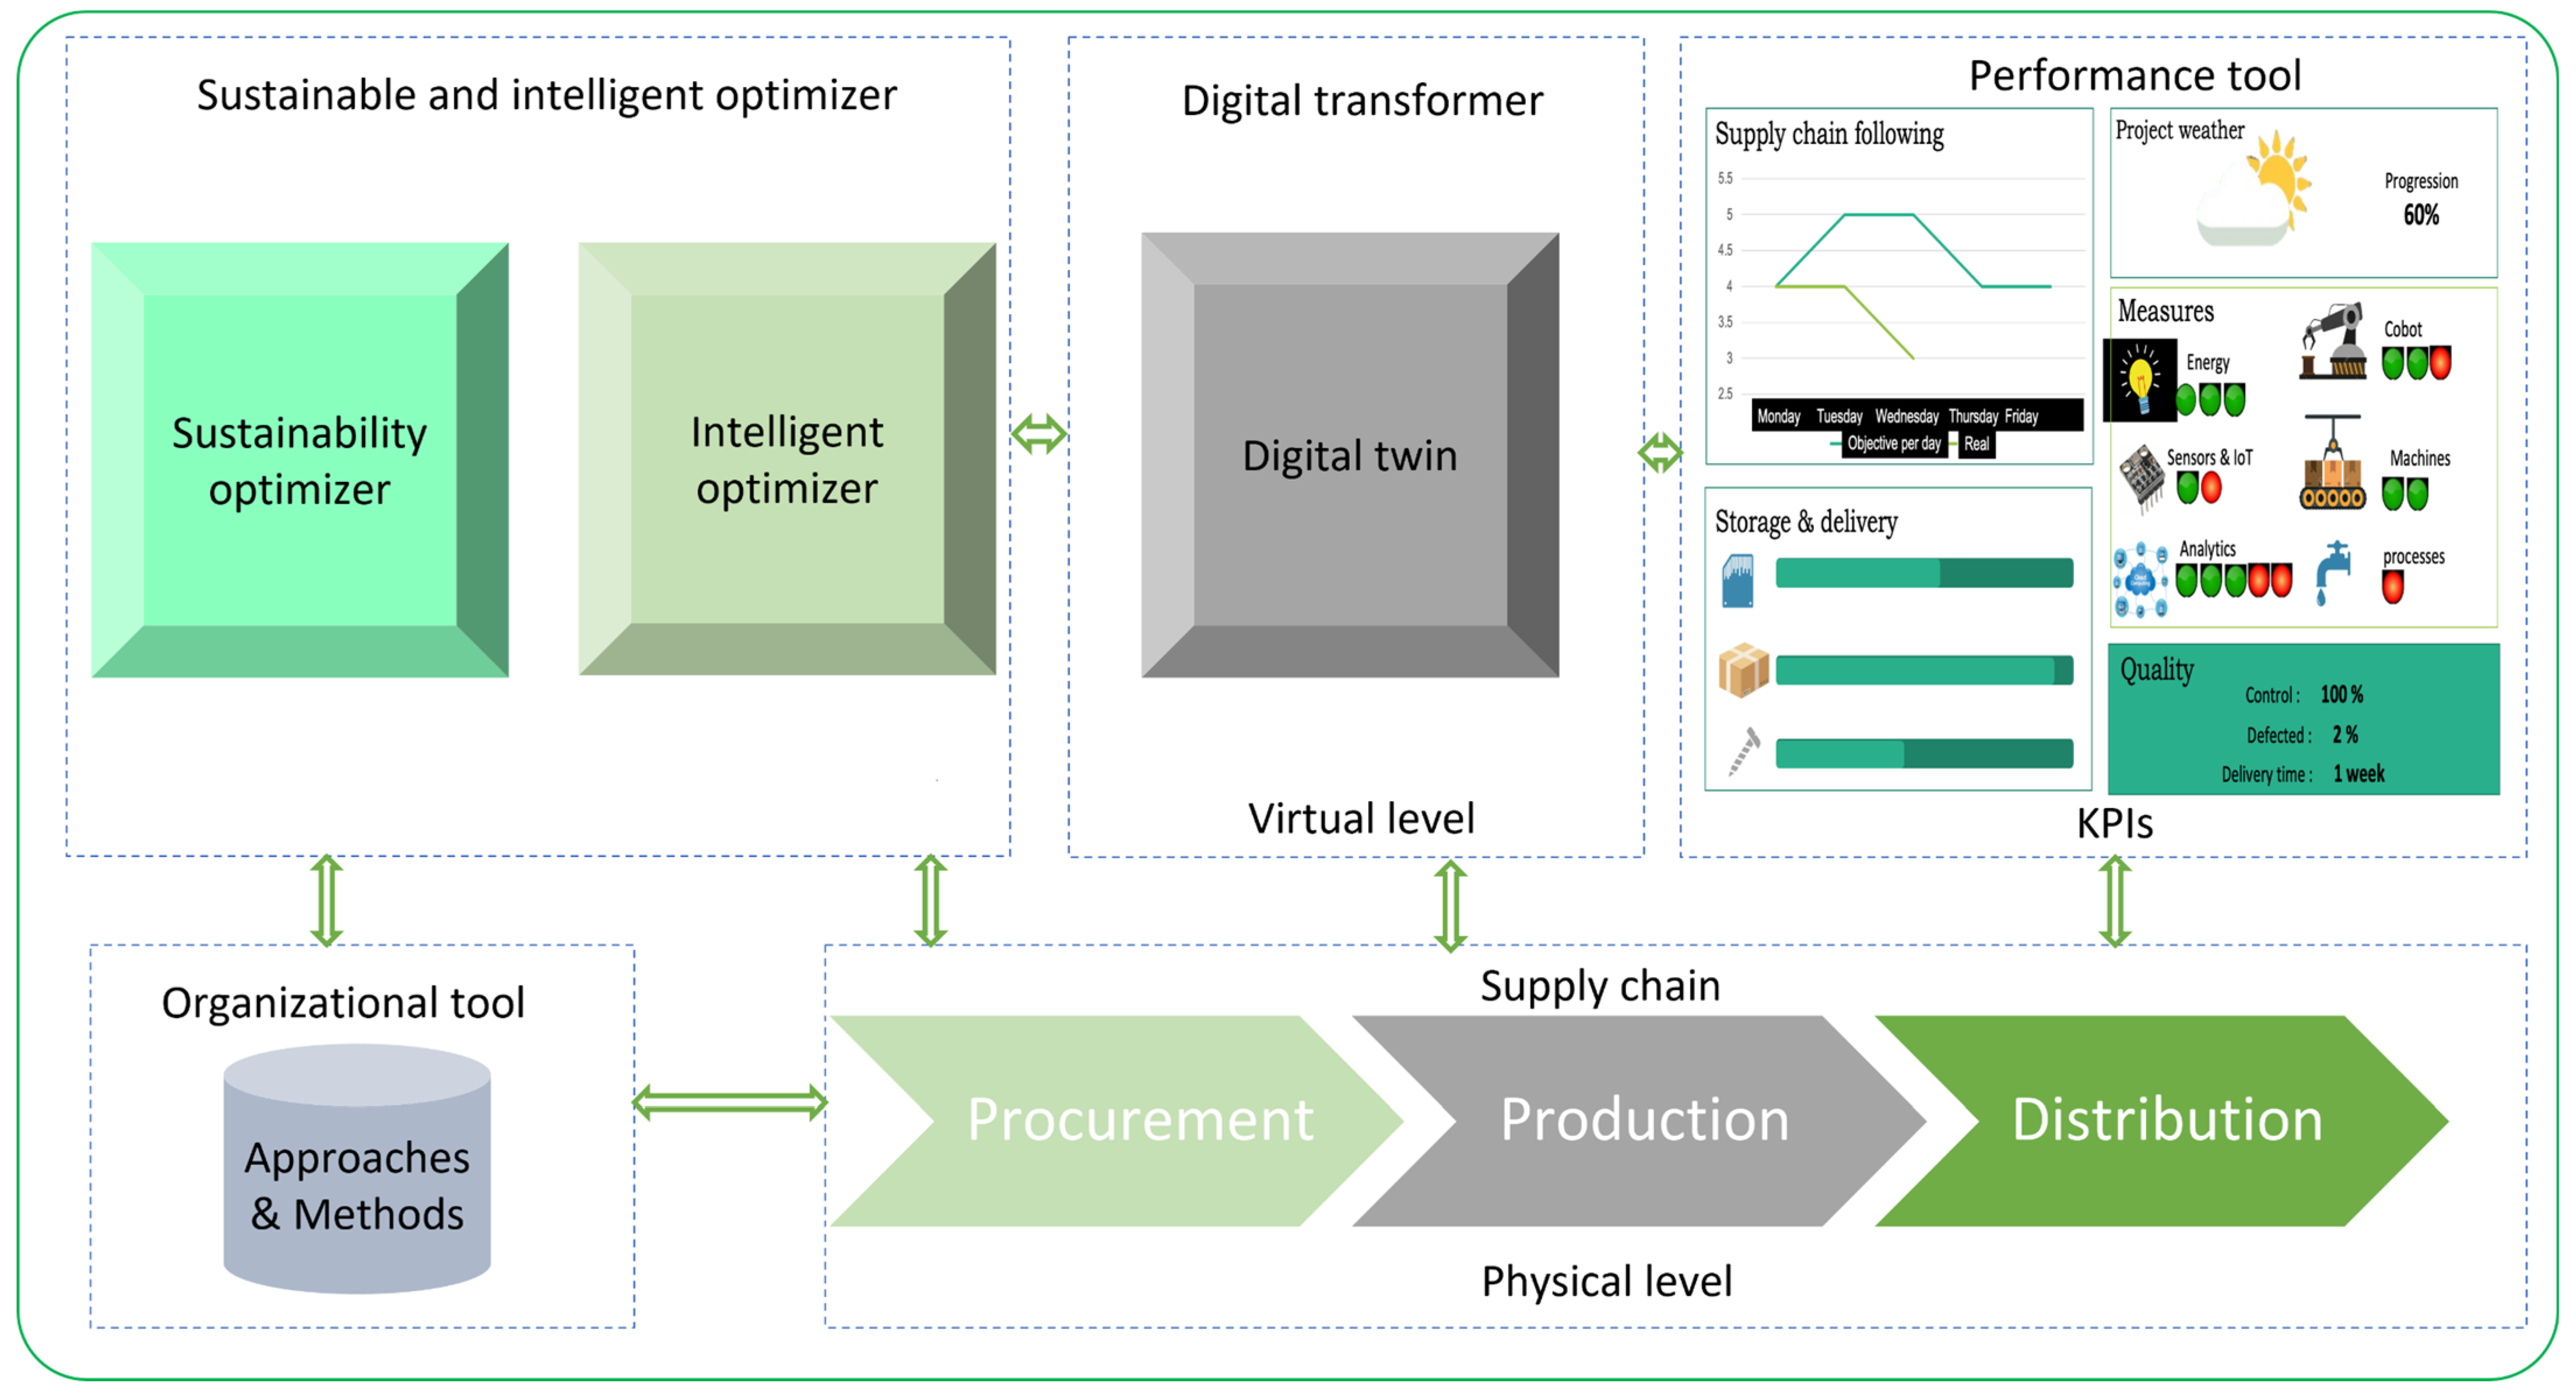
3.3. The Structure of the Performance Assessment Tool

Three axes are defined to structure the performance indicators of the performance assessment tool, i.e., sustainable transformation, digital transformation, and optimal transformation (see Figure 3).
The sustainable transformation axis contains indicators shared across four main criteria: economic, social, environmental, and circular aspects. The economic criterion is composed of three sub-criteria: cost, quality, and lead time, which are aspects to optimize. It is focusing on the measurement having a sense for the company supply chain managers. The economic impact could clearly be defined and measured with this package. The social criterion also contains three sub-criteria, such as health, well-being, and transport. Optimizing the supply chain requires a detailed study of each one. The environmental criterion is made up of five sub-criteria: waste, air, water, energy, and eco-management. Optimizing the supply chain according to this criterion involves a combination of the five aspects. The last criterion concerned with sustainability is circular economy concepts. This criterion is studied in the supply chain by focusing on the 6Rs concepts: reduce, reuse, recycle, redesign, recover, and remanufacture. Their use in supply chain processes allows them to take these aspects into account when optimizing the supply chain.
The digital transformation axis integrates three main criteria in supply chain optimization, i.e., physical technology tools, virtual technology tools, and information systems. The physical tools criterion corresponds to incorporating new technologies such as advanced robotics, IoT, immersive realities, additive manufacturing, and cyber-physical systems to optimize the supply chain. The virtual technology tools criterion focuses on emerging technologies like cloud computing, cybersecurity, big data/analytics, and digital twins to improve supply chain performance. The information systems criterion involves the exploitation of tools such as ERP, SCM, MES, CRM, and SIRH tools to improve the company’s supply chain performance.
The third axis, called optimal transformation, is mainly focused on mathematical optimization algorithms and tools through three criteria: classical tools, organizational tools, and intelligent tools. The classic tools criterion is a set of traditional algorithms that are commonly used for supply chain performance improvement. The organizational tools criterion covers the methods and tools used to structure and manage the business that could be applied to optimize the company’s supply chain. Finally, the criteria for intelligent tools integrate decision support tools and new algorithms such as machine learning, deep learning, and neural networks, which could be used to improve the performance of the company’s supply chain.
This paper proposes the use of an intelligent decision support tool, which includes artificial intelligence methods combined with classical optimization methods, to solve this problem.

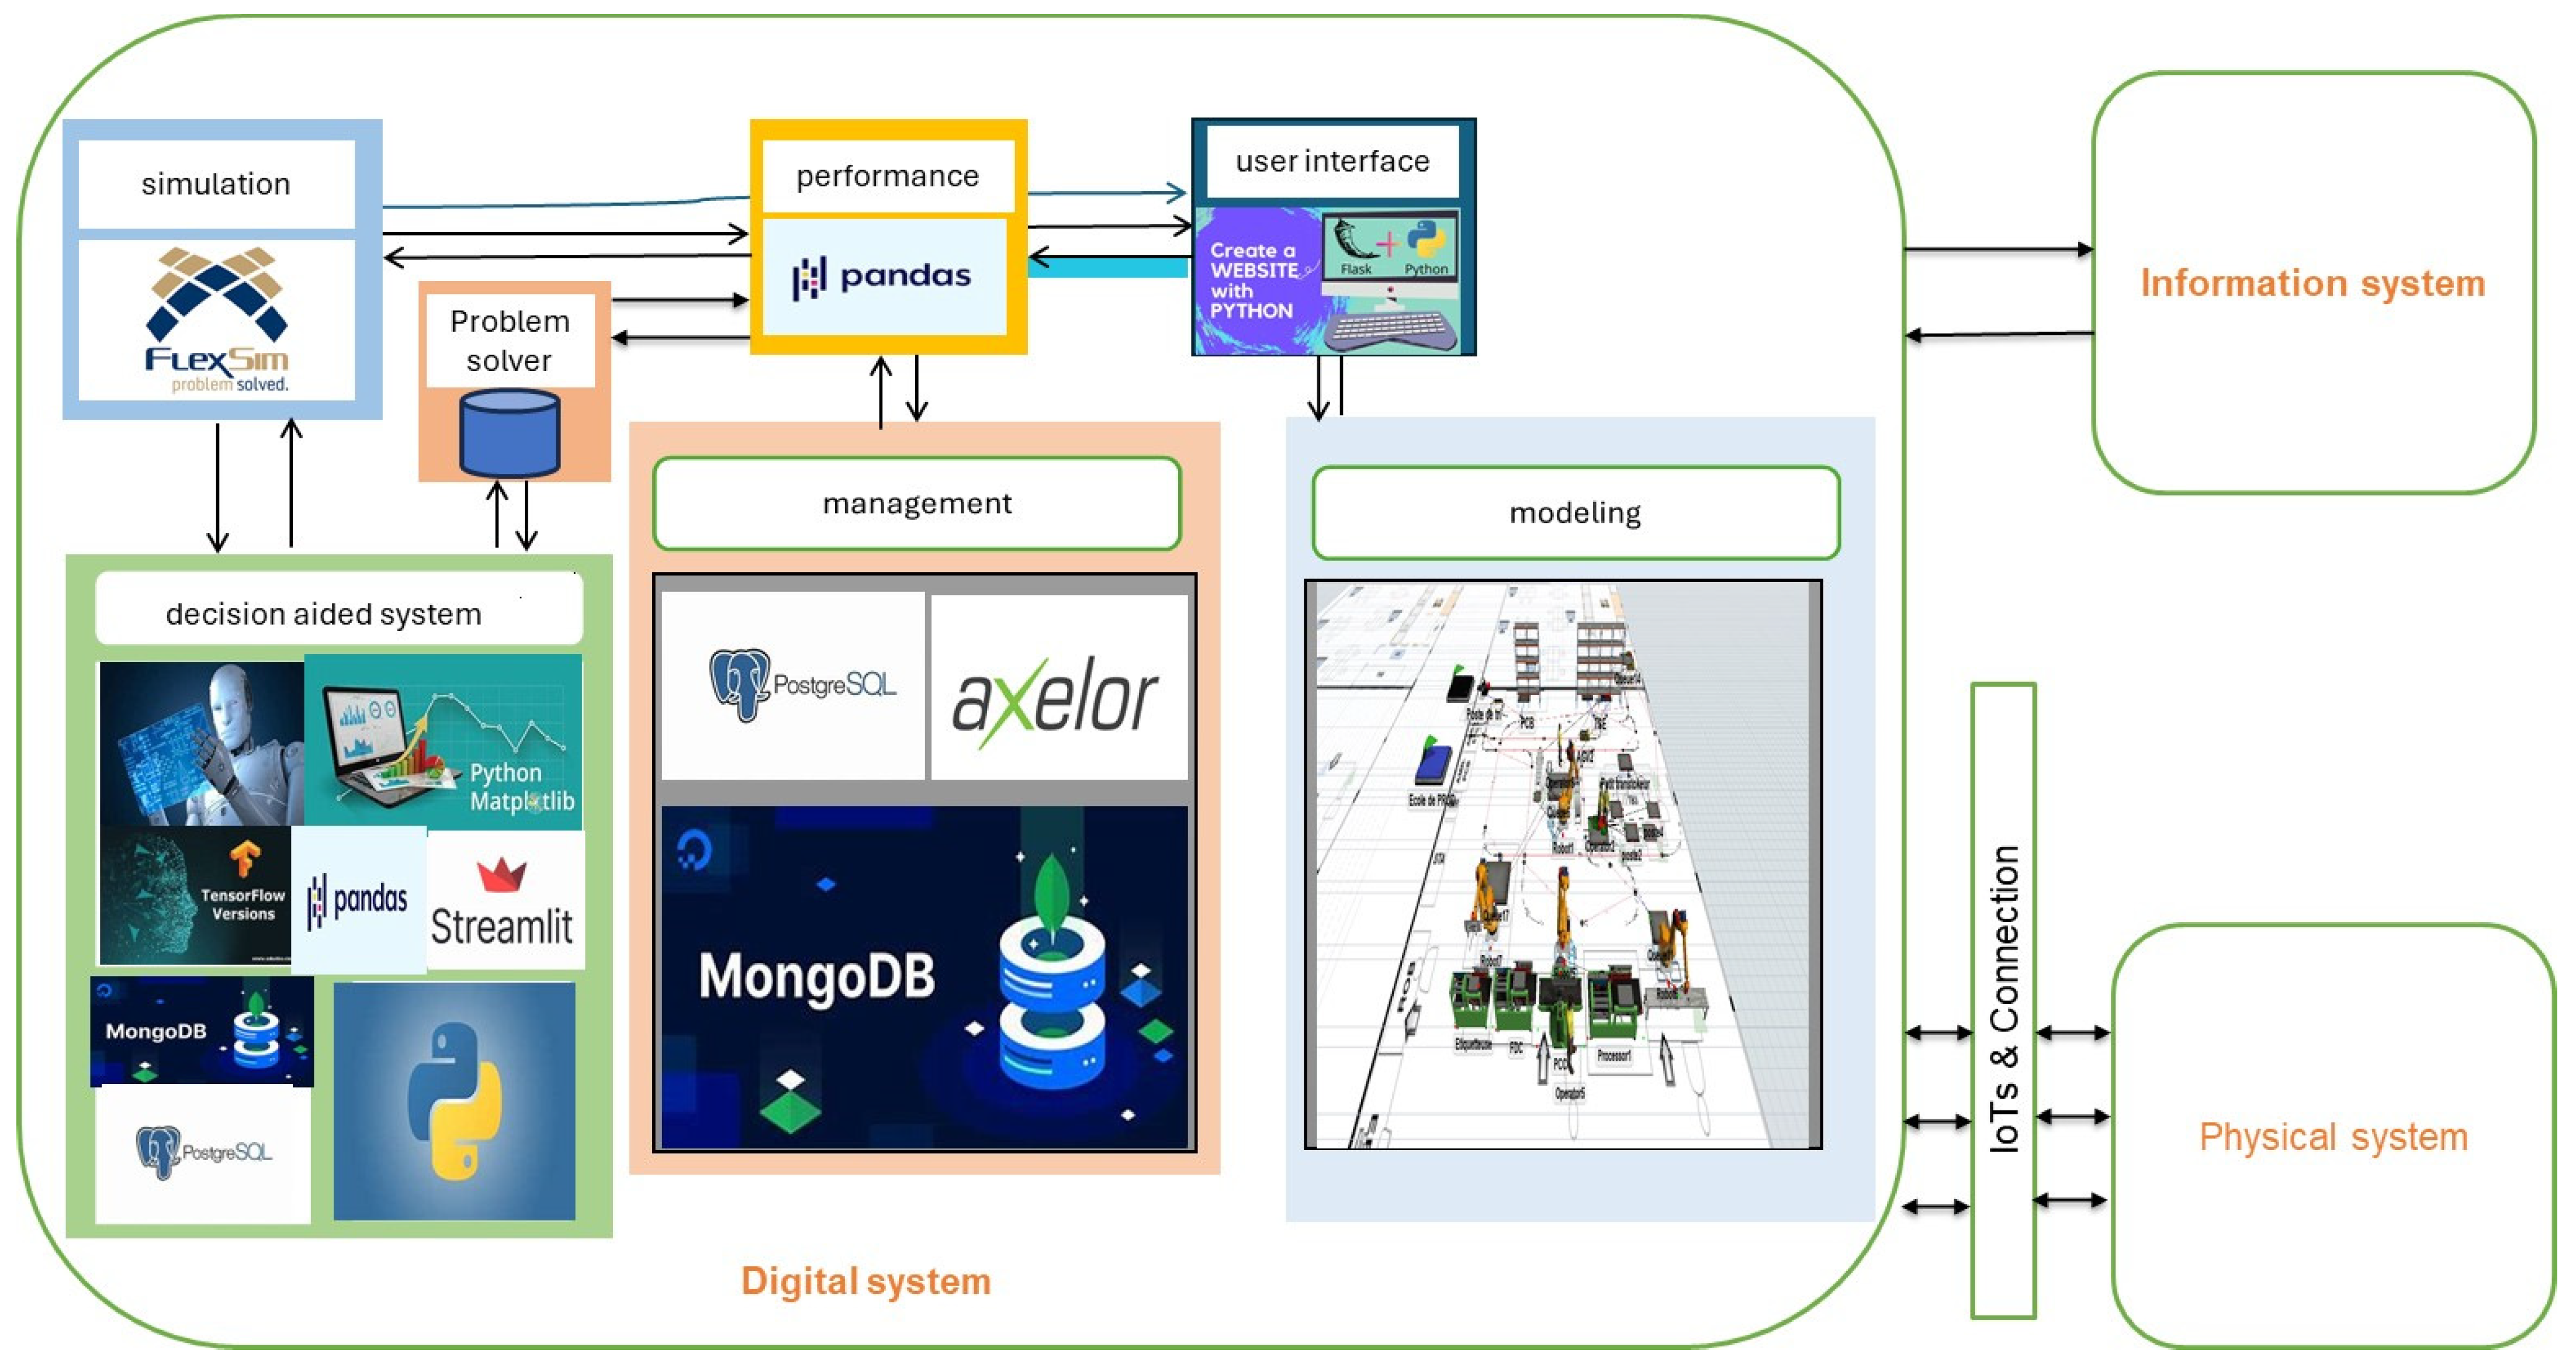
3.4. Intelligent Support System Tool Architecture

Figure 4 shows an architecture for tools developed to support sustainable supply chain performance optimization and digital transformation. Indeed, it is composed of a sustainable and intelligent optimizer, a digital transformer, an organizational tool, and a performance measurement tool acting on the physical supply chain.
Focusing on the methods and concepts required to make a process viable, the sustainable and intelligent optimizer module includes a sustainability optimizer. It includes rules, norms, practices, optimization algorithms, and approaches to the transformation. The intelligent optimizer is composed of classical optimization tools that exploit statistics and probability knowledge and integrate how to use the algorithms on each part of the supply chain to realize its transformation. It also exploits AI methods based on formalisms. The digital transformer is mainly focused on realizing the digital twin of the company’s supply chain, which will be used as a tool to help grow the business. As a company-specific digital twin builder, the digital transformer serves to elaborate the virtual system of the supply chain and uses formalisms like agent systems to define the digital twin and parameters to enable the transformation of the company’s supply chain. It is a decision-aided tool for people making digital and sustainable transformations in the company supply chain. The organization tool is concerned with ensuring that the internal organization of the supply chain is the most appropriate. It suggests tools and methods that can be used to facilitate this transformation. The performance measurement tool is an intelligent dashboard for measuring the health of the supply chain at every stage of the sustainable digital transformation. This intelligent support system tool is used to support the implementation of the previous concepts in the company’s sustainable and digital transformation. These theoretical concepts need to be adapted to the real context of the company, and this corresponds to the next step of the transformation methodology validation. A panel of small and medium-sized companies will be used in this phase. But, for preparing the conditions of the framework and its tool adoption, practices and use cases have been exploited. The following section illustrates how the concepts presented on sustainability, optimization, and digital twin as an improvement tool will be combined to increase business performance. The three examples focused only on a particular aspect of the company’s transformation.

4. Practices and Use Cases

This section presents various practices in relation to sustainability, as well as two use cases on optimization and digital twins, which illustrate their practical application in different sectors and fields.

4.1. Sustainability Practices

Although the first steps in sustainability were taken by public authorities, they were soon followed by a set of initiatives proposed by the private sector as part of their CSR strategies. In this section, we are going to classify several industrial practices associated with sustainability into the same two groups we considered in the Section 2.2 heading, i.e., decarbonizing transport and circular economy. Indeed, their link with the previous section corresponds to the environmental and circular aspects of exploitation in the framework and the performance indicator structure. The good practices give parameters to measure to respect expectations in this domain.

4.1.1. Good Practices in Decarbonizing Transport

According to the driving forces of GHG emissions, different business initiatives are going to be analyzed to address the last three. The first one, i.e., GDP, which is related to economic production, will be dealt with at the next heading, i.e., Section 4.1.2.
Reduce the transport intensity of the economy. The goal is to reduce the amount of unnecessary transportation while maintaining economic growth. The key initiatives are to reduce distances traveled, avoid empty runs, and de-speed logistics.
Minimizing the distance a product is transported can be achieved by using optimization algorithms to solve the vehicle routing problem. Furthermore, another common solution is to use 0-km solutions, and in particular, 0-km food, where food is produced, sold, and eaten locally [82].
One promising initiative to reduce empty running is horizontal collaboration, which makes it possible to combine loads from different loaders on the same vehicles. Nestlé and PepsiCo provide a noteworthy example of horizontal collaboration by creating a collaborative partnership and working with a logistics provider. These manufacturers have successfully optimized their delivery network, reducing costs and GHG emissions while simultaneously enhancing efficiency and customer responsiveness [83].
Finally, the World Economic Forum and Accenture identified several actions to decarbonize the supply chain, with deceleration of logistics being one of the highest ranked. This measure entails working with increased time windows, thus raising load factors, so that higher vehicle utilization is achieved [84].
Reduce the energy intensity of transport. This option refers to reducing the amount of energy needed to transport freight. This depends on the vehicle’s characteristics, driving behavior, and traffic conditions. Advances in vehicle technology, such as Euro 5 and Euro 6 vehicles, allow for lower exhaust emissions and improved fuel efficiency. Also, the incorporation of elements that improve the aerodynamic profiling of vehicles contributes to higher energy efficiency as well.
Reduce the carbon content of the energy. This block corresponds to using low-carbon energy sources or transferring freight to greener transport modes such as rail or water. Toyota Motor Europe has recently partnered with the Dutch-based VDL Groep to enter the zero-emission heavy-duty hydrogen truck market in Europe. For its part, the global logistics provider Geodis is a pioneer in multi-modal transportation, offering rail-road solutions. Furthermore, some cities, such as Paris or London, have long had low emission zones and are using inland waterway transport projects as an alternative to road transport. Finally, last-mile logistics uses electric vehicles or bicycles in combination with micro-hubs in many cities.

4.1.2. Good Practices in Circular Economy

According to the well-recognized ladder principle, different waste management activities are ranked according to the following order of preference: prevention, reuse, remanufacturing, recycling, incineration, and disposal [21]. The last two are excluded because they are the least interesting and are considered a solution of last resort once the previous ones have been discarded.
Next, several business models are defined, and some success stories related to them are presented.
  • Prevent. This business model corresponds to the prevention activity and entails the avoidance of waste. One well-known and remarkable example of this model is Xerox, which has pioneered this practice by designing products, packaging, and accessories that use resources efficiently, enhance durability, and reduce parts [85]. Another company worth mentioning is the renowned outdoor wear manufacturer Patagonia, which offers a lifetime guarantee and repairs items upon request [86].
  • Reuse. It is the reuse of the product for the same or a different application without significant further treatment. It mainly addresses specific types of products, such as vehicles, clothing, books, electronic equipment, or packaging. A widespread practice in supply chain management is pallet pooling, where pallets are shared and reused within a network of producers, manufacturers, distributors, retailers, transporters, and logistics service providers (LSP) [87].
  • Remanufacture. This means that the products or their components will be ready for use again after a period of refurbishment or repair. Dyson or Apple have expanded their market share by offering their refurbished products to people who are unwilling or unable to purchase their new products [88].
  • Recycle. This business model requires more additional treatment than the previous ones since products must be broken down into parts or subassemblies that can sometimes be reused or simply used as raw materials for similar or lower-quality products. Renault, a major French car manufacturer, has significantly reduced its consumption of raw materials by recycling its waste (steel, leather, polypropylene, or textile) [89].
  • Share. The collaborative economy, or sharing economy, consists of peer-to-peer (P2P) online platforms powered by digital technologies that provide temporary use of assets [90]. This business model is very resource-efficient, reduces the environmental impact of products, and has proven to be very successful. The main sectors that offer services via online collaborative platforms are transport (e.g., BlaBlaCar), accommodation (e.g., Airbnb), logistics (e.g., Saloodo), food (e.g., Blendhub), or anything you do not need (e.g., eBay).
  • Product as a Service (PaaS). In a servitized economy, there is a shift from selling products to providing services. This is the case of the pay-per-use model, where producers own products forever and charge customers for the use and maintenance of them. This model provides motivation for companies to design for the longevity of their products and, therefore, to reuse, remanufacture, or recycle them, whichever is more economical, thus enabling a circular economy [91]. Rolls-Royce, which was a pioneer of the “power-by-the-hour” model in the 1960s, or HP are manufacturing companies that are working with this business case [92].
In short, sustainability is a clear opportunity for new businesses and innovative job creation. Companies can benefit from these new business models by reducing their dependence on new primary resources and protecting them from price fluctuations, thus enhancing their profitability and long-term competitiveness. The parameters defined in this sub-section correspond to what will be checked and suggested in each company’s sustainable transformation. These parameters also correspond to those that have been integrated into the mathematical model and into the performance measurement structure. Both social and environmental parameters are directly impacting the mathematical model that has been proposed above. The final validation of these sustainability practices will be done with the panel of SMEs. The following examples focus on economic and digital aspects of the company’s transformation.

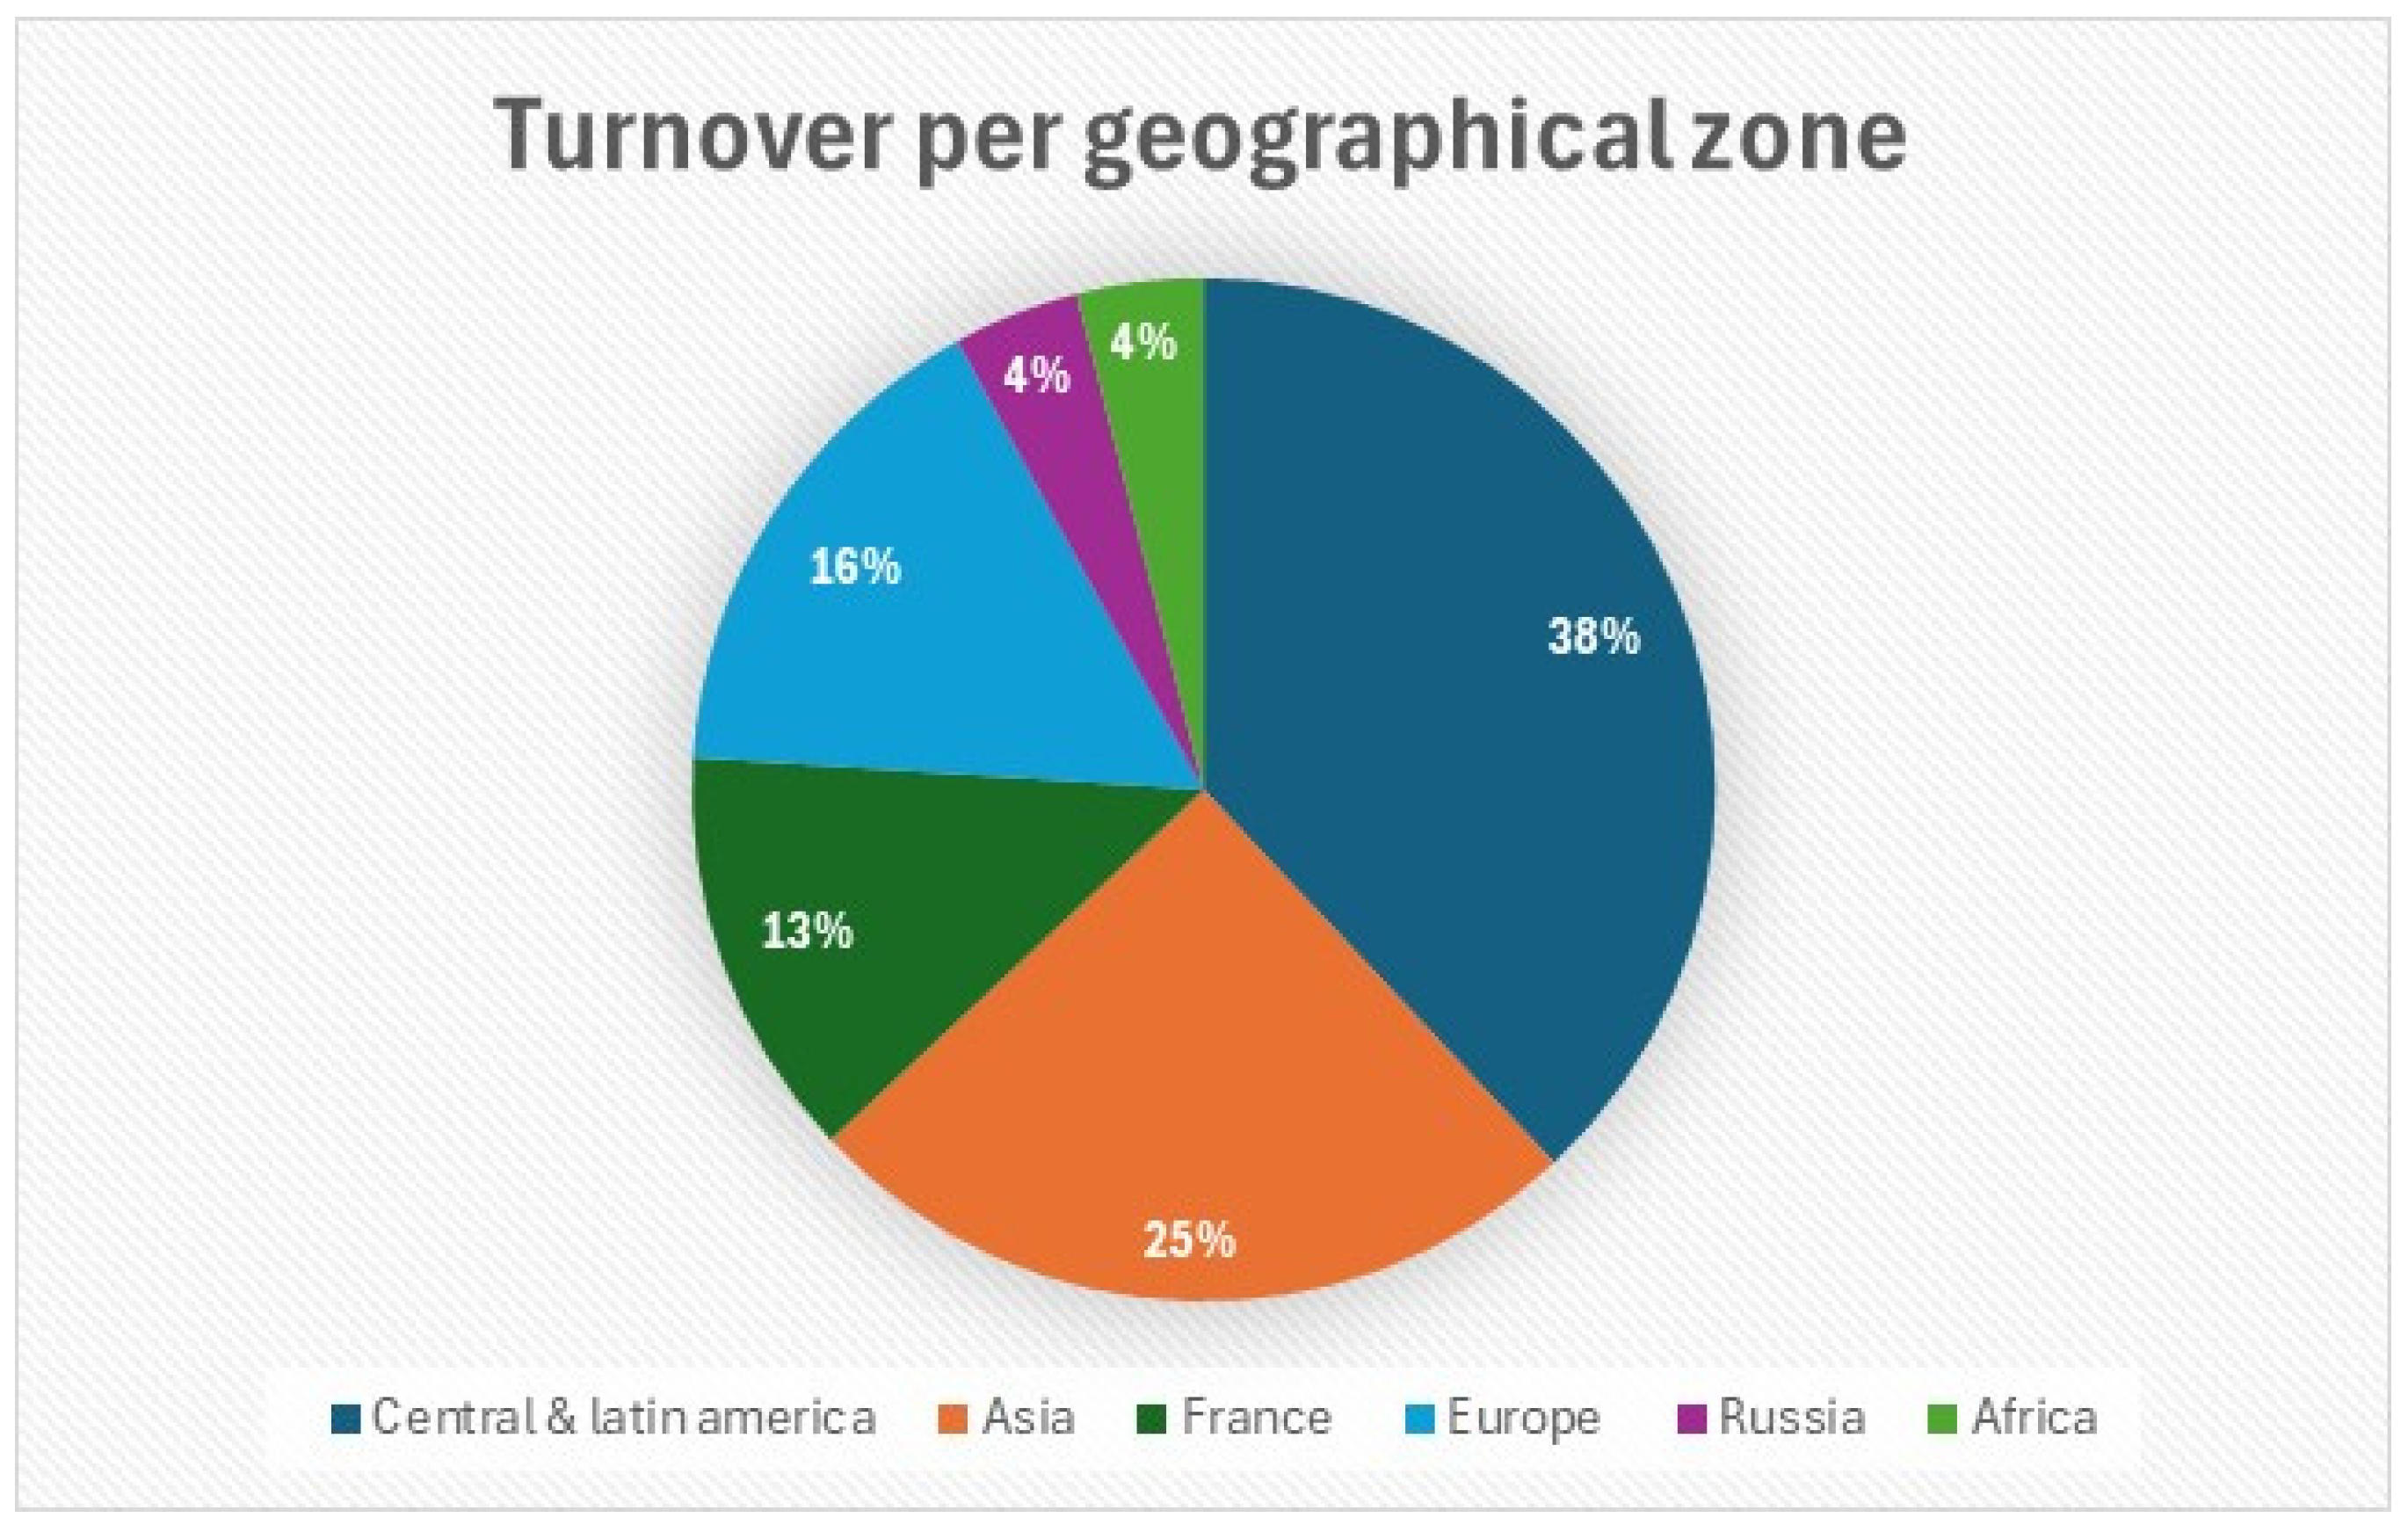
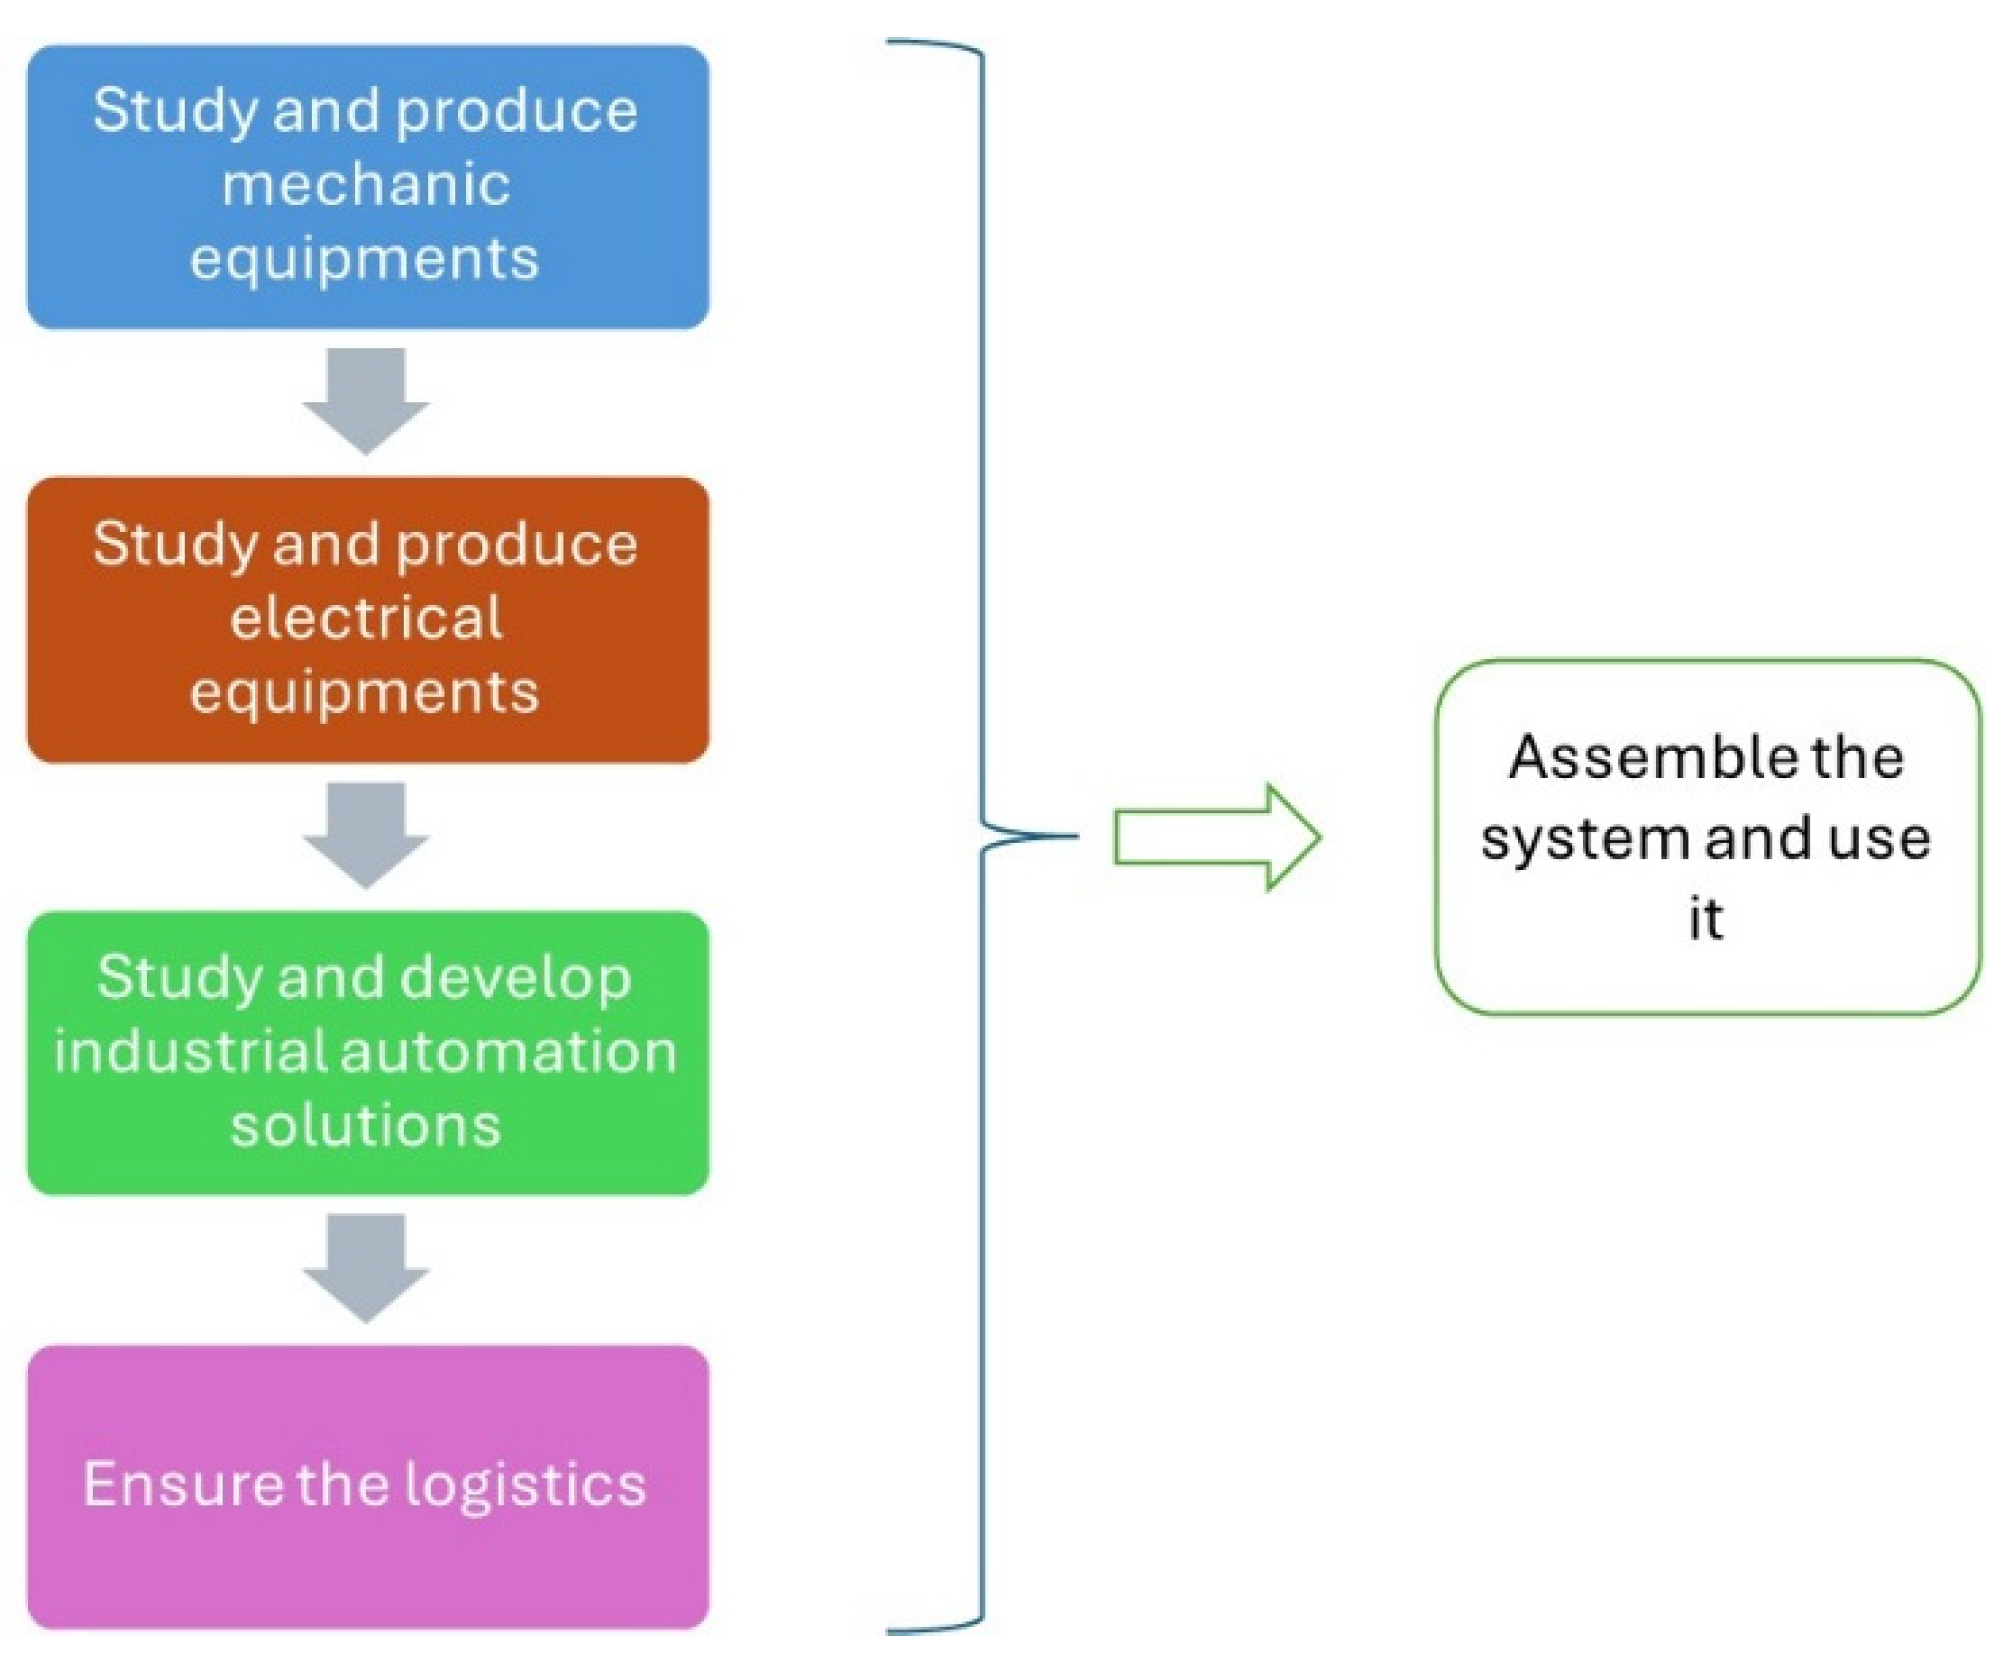
4.2. Use Case for Optimization

This section gives an example of a company in which the previous concepts have been tested to optimize its sustainable performance. The objective here is to cover the three aspects of company performance measurement. The company is composed of 1245 employees, working in collaboration with many suppliers and customers all over the world. This company is specialized in the elaboration and implementation of cheese powder production systems. The enterprise is able to design and provide the adapted engineering for children’s milk powder production. This product is composed of milk-derived powder ingredients (lactose, fructose, caseinate, etc.), which are mixed with liquid components. Then, the combination is atomized to obtain a complex powder. Vitamins and probiotic powder are added to the mixture to increase the product’s added value. The company manages the implementation of the complete process, from pulverulent management to dissolving ingredients, sterilization, atomization, and packaging. The turnover is about € 200 million and dispatched as presented in Figure 5, with major implementations in Singapore and Brazil. Some of the products are sold directly to customers, and others are managed by exploiting an international seller’s services.
The turnover per activity is represented in Figure 6 and is related to milk powder transport, which represents about 50% of the agrifood activity.
This study aims to help companies implement sustainable and digital systems. Indeed, this corresponds to the digital transformation of business processes through the integration of Industry 4.0 concepts and the exploitation of sustainable aspects, which are usually included in Industry 5.0. The board management organization is the following: The director is in charge of the company and coordinates all its activities. He manages the relationship with the board of customer companies. The customer manager aims to organize a satisfaction policy, find new prospects, and follow market evolution to optimize the company’s performance through the sale of its products. The industrial manager coordinates the implementation services, such as those performed by project managers, electrical managers, or automation managers, thus facilitating the operational actions of the leaders. The control and coordination of external orders are the responsibility of the procurement manager. He is in charge of supplier audits and relationships. The human resource manager is destined for the employee’s management. The financial manager has to follow accounting and anticipate financial activities. The information park is managed and maintained by the IT manager. The quality manager is focused on increasing product quality, integrating technological innovations to improve products, and controlling the system. The marketing manager defines the strategic approach with the director and focuses on new product innovation.
The activity of the company is the realization of installations for the management of powdery products. Raw materials are stored in three different ways depending on their use: silos, big bags, and bags. Two types of powder transport are used: mechanical transport of powder (screw under a tube or vibrating corridor) and pneumatic transport of powder in suction (vacuum pump, depressor) or discharge (booster). The entire installation is managed by a supervision system that automates all the equipment. The installations must be protected against explosions and meet the ATEX standard (a European standard aimed at identifying the risks of explosion and reducing them for the second time). Figure 7 shows the stages of the implementation process.
The project management implementation process includes functional tasks such as contract review, study and sizing of equipment, study and manufacture of electrical and mechanical equipment, production and validation of technical documentation, pre-shipment control, logistics management, assembly, and start-up.
After a modeling phase of the current situation, which led to the development of different models in accordance with the conceptual framework for sustainable digital transformation of the supply chain presented in Section 3, the performance measurement tool has been exploited to measure the company’s existing situation in terms of cost, time (lead time, procurement time, dispatching time), quality, level of digital maturity, and sustainability. The analysis of the existing situation made it possible to identify several points for improvement, such as the following:
  • Predict the results of a more reliable installation by implementing RPA (Robotic Process Automation) for the iterative processes of managing or processing information.
  • Improve the productivity of equipment manufacturing processes through the introduction of cobots and mobile robots for non-value-added operations and the concentration of human skills for value-added operations.
  • Reduce project margin drifts through the use of information systems and intelligent forecasting devices.
  • Streamline the operational set-up through the use of support devices such as immersive realities.
  • Optimize the logistics service both in terms of the management of the preceding and subsequent phases as well as that of the transport phase.
  • Improve the productivity of administrative and financial processes by implementing RPA and using big data, analytics, and cloud computing (SaaS information systems) to manage the company’s structured and unstructured data.
  • Optimize stocks by deploying an intelligent tool for managing store entries and exits.
  • Optimize the real-time management of information and decision-making through the implementation of an IoT network and an effective supervision system.
  • Improve the management of innovations and technical tools by focusing on a human-centered approach.
Some of the points to improve in the process are focused on sustainable aspects and digital concepts. The methodology described in Section 3 has been the basis for the improvement in the company’s performance. The sustainable (economic, social, and environmental) and digital criteria outlined above are integrated into the company’s performance measurement. For instance, an urbanization (transformation and improvement of the existing information system) of the company information system has been decided to complete the existing software tools of the company by integrating digital aspects such as the Internet of Things (state of the system) or immersive realities (predictive maintenance procedures), but also environmental and social aspects, including a decision-aided tool for the right human and environment-centered transformations.
The next section focuses on how to use the digital twin as a tool to optimize the company’s supply chain.

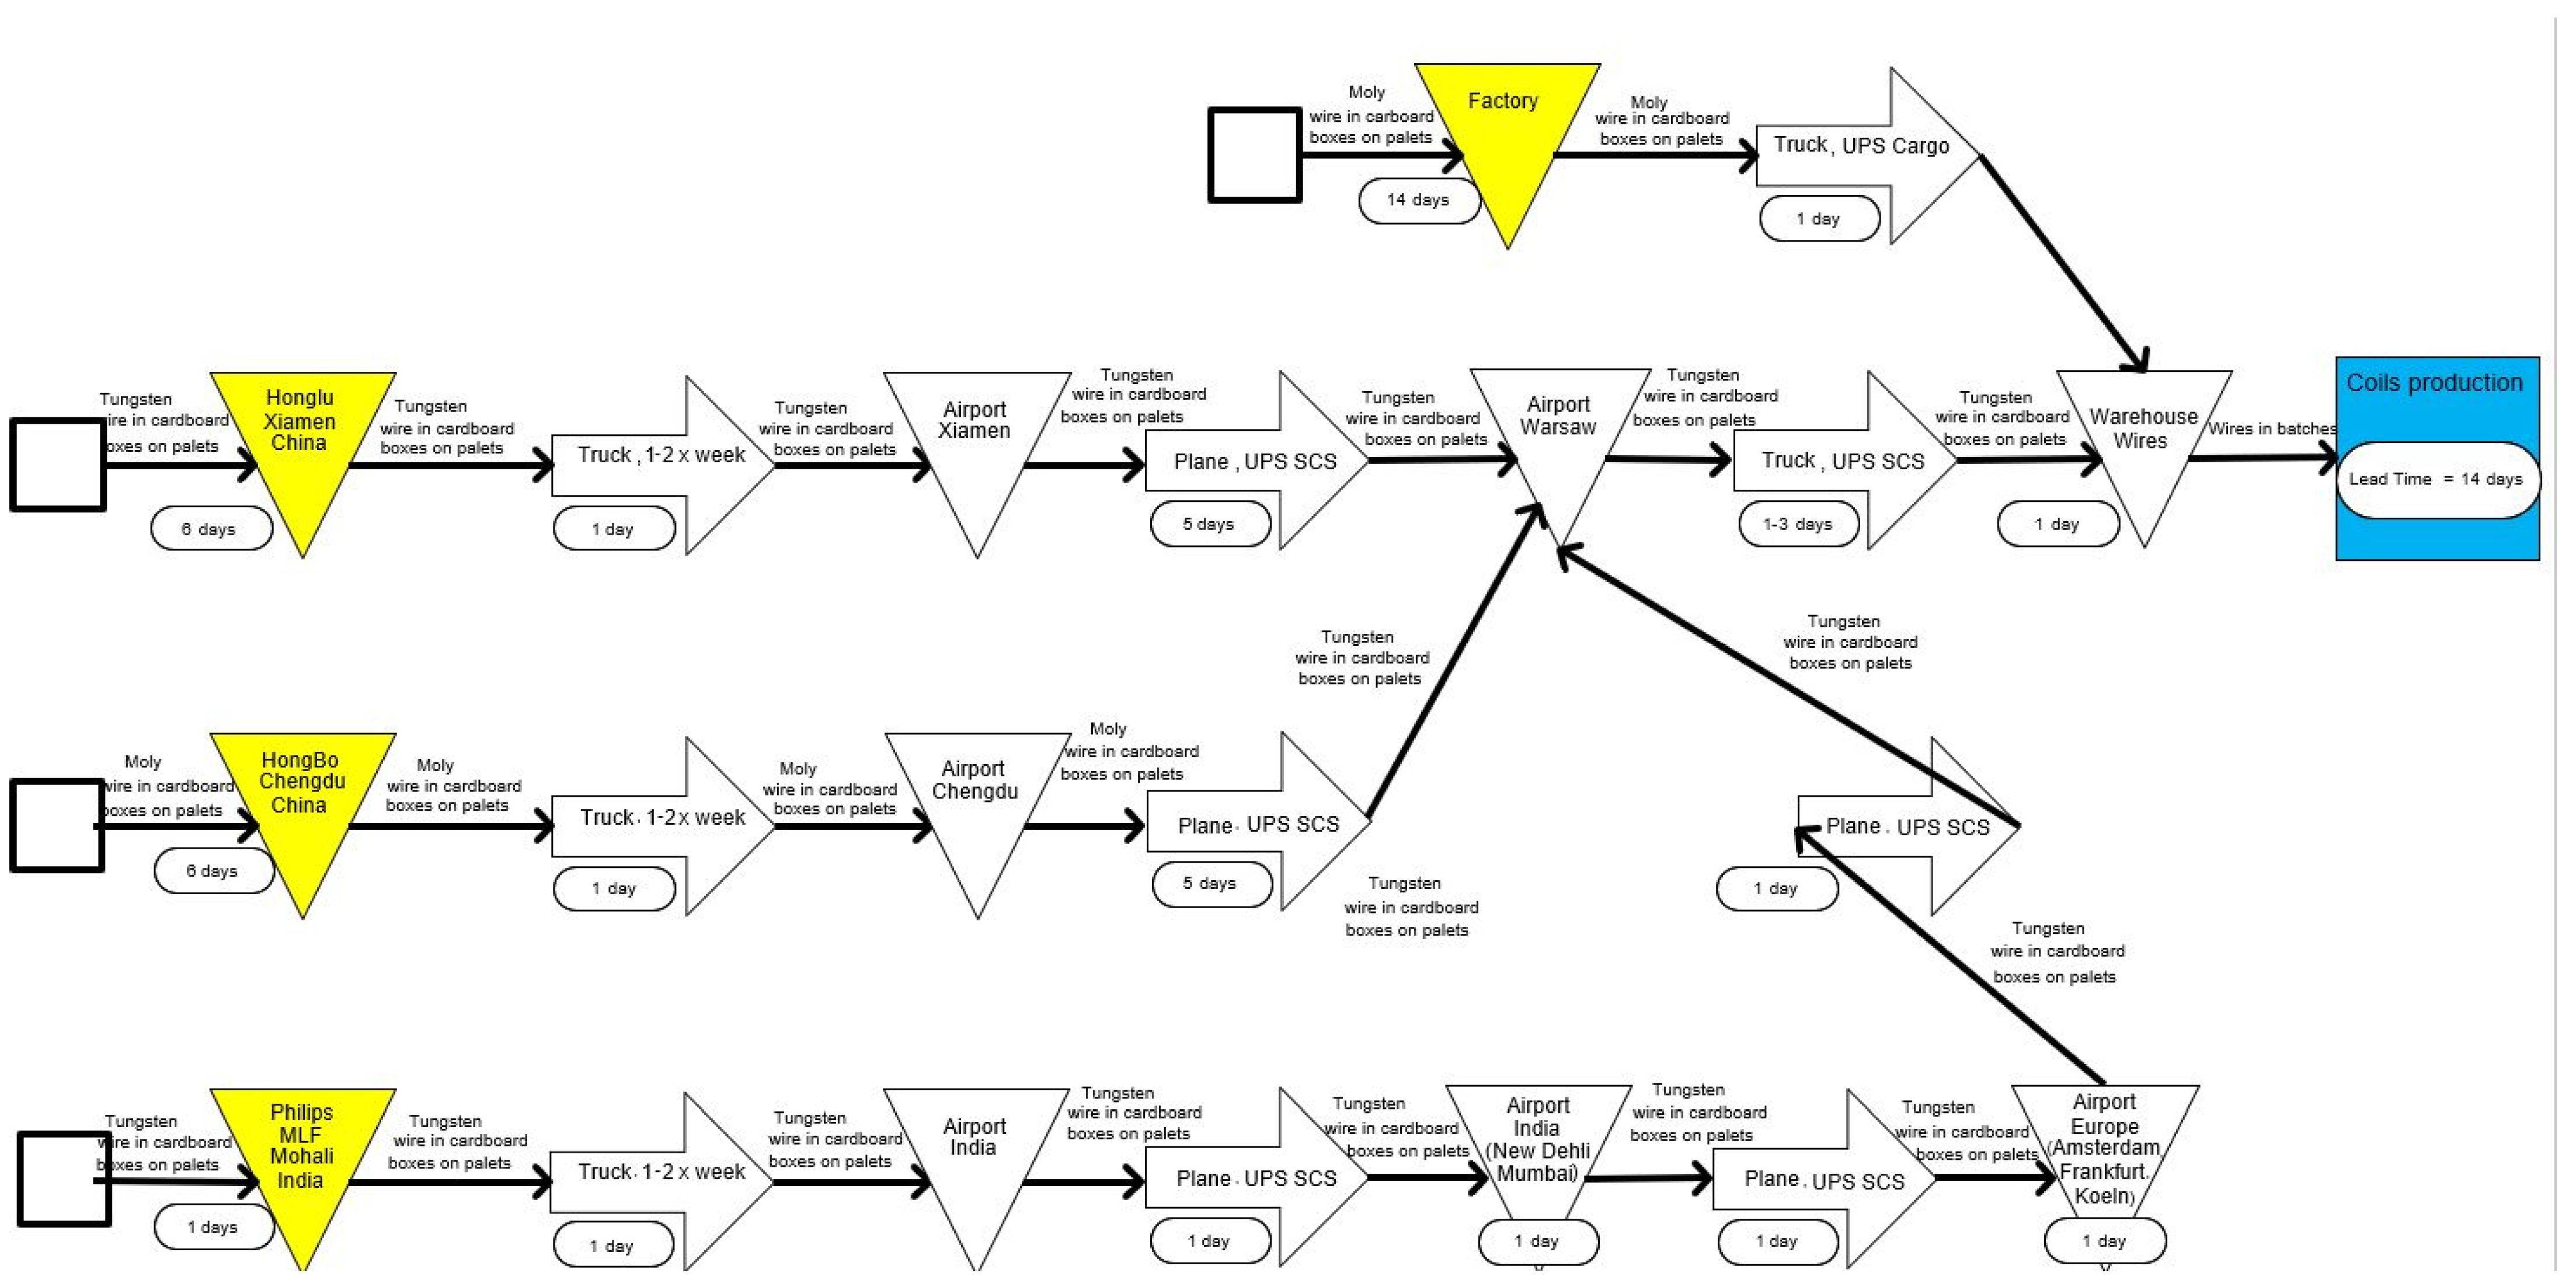
4.3. Use Case on the Digital Twin

The development of a digital twin for a company involves the definition of the virtual representation of its real system, the integration of data in real time (digital shadow), and the realization of the simulation tool and the decision-aided tool to measure the company’s performance and suggest improvement. The concepts associated with the digital transformer (digital twin builder) of the intelligent tool have been exploited for the following example: The objective is to define a digital twin that could contribute to the company’s supply chain performance. The system proposed is represented in Figure 8, with a specific focus on the digital system.
A system of IoTs and connectors allows for linking the physical supply chain to the digital system for acquiring data in real time. The information system is also connected to the virtual part to transfer management data. The digital system is composed of a user interface that manages interactions with the system. The modeling part is used to represent the existing system, integrating real-time data. The management module contributes to driving interactions with the information system. The performance module is focused on the sustainable and digital measurement of company performance by exploring the indicators and the structure presented in Section 3.3. The decision-aided system is composed of an expert system (rule base, fact base, and inference engine) that allows for the analysis of data from the company, the detection of inconsistencies, and the proposal of solutions to implement to increase the company’s performance. The problem solver is composed of classical and advanced algorithms (deep learning, neural networks, etc.) contributing to the definition of these adapted solutions. Then, the simulation module allows you to test the solution that has been chosen for decision-making. The global structure of this adapted, sustainable digital twin is being developed. This section is focused only on the simulation module and how the scenarios will increase the company’s performance.
Let us explore how a digital twin (DT) can be used for global supply chain analysis, focusing on inventory optimization. Inventory, expressed as a percentage of total Moving Annual Total (MAT) sales, is a key metric for supply chain performance. MAT refers to the total value of a variable, like sales, over the past year. Companies face a balancing act: reducing frozen capital by minimizing inventory levels while ensuring sufficient stock to support sustainable development. Maintaining high inventory levels requires operational warehouses, which consume resources and generate CO2 emissions. The ideal scenario minimizes both frozen capital and environmental impacts. This is where DT comes in. It can help identify the optimal inventory level that balances these competing goals.
The object of the research is a company operating on a global scale. The supply chain works in such a way that semi-finished products are delivered from New Delhi (India), Hongluzen (China), Shenzhen (China), Warsaw (Poland), and Piła (Poland). This is where they are assembled and final manufacturing operations take place, and then the finished final products are sent to Aachen (Germany) and Shenzhen (China).
In this chain, the opportunity to optimize the value of the inventory on each side of the chain links has been noticed in such a way as to bring significant savings to the company. In addition, the appropriate determination of stock levels for all materials must ensure the continuous availability of components needed for production. Optimization involves the following:
  • Causing a decrease in the value of inventory on each side, from sub-products to final products;
  • Improvement of cash flows within the company’s operations;
  • Reducing obsolete inventory;
  • Reducing the risk of shortages of materials and components in the End2End approach;
  • Optimize warehouse space utilization across the entire supply chain, freeing up valuable floor space for other purposes.
The following general objectives of the optimization project have been defined:
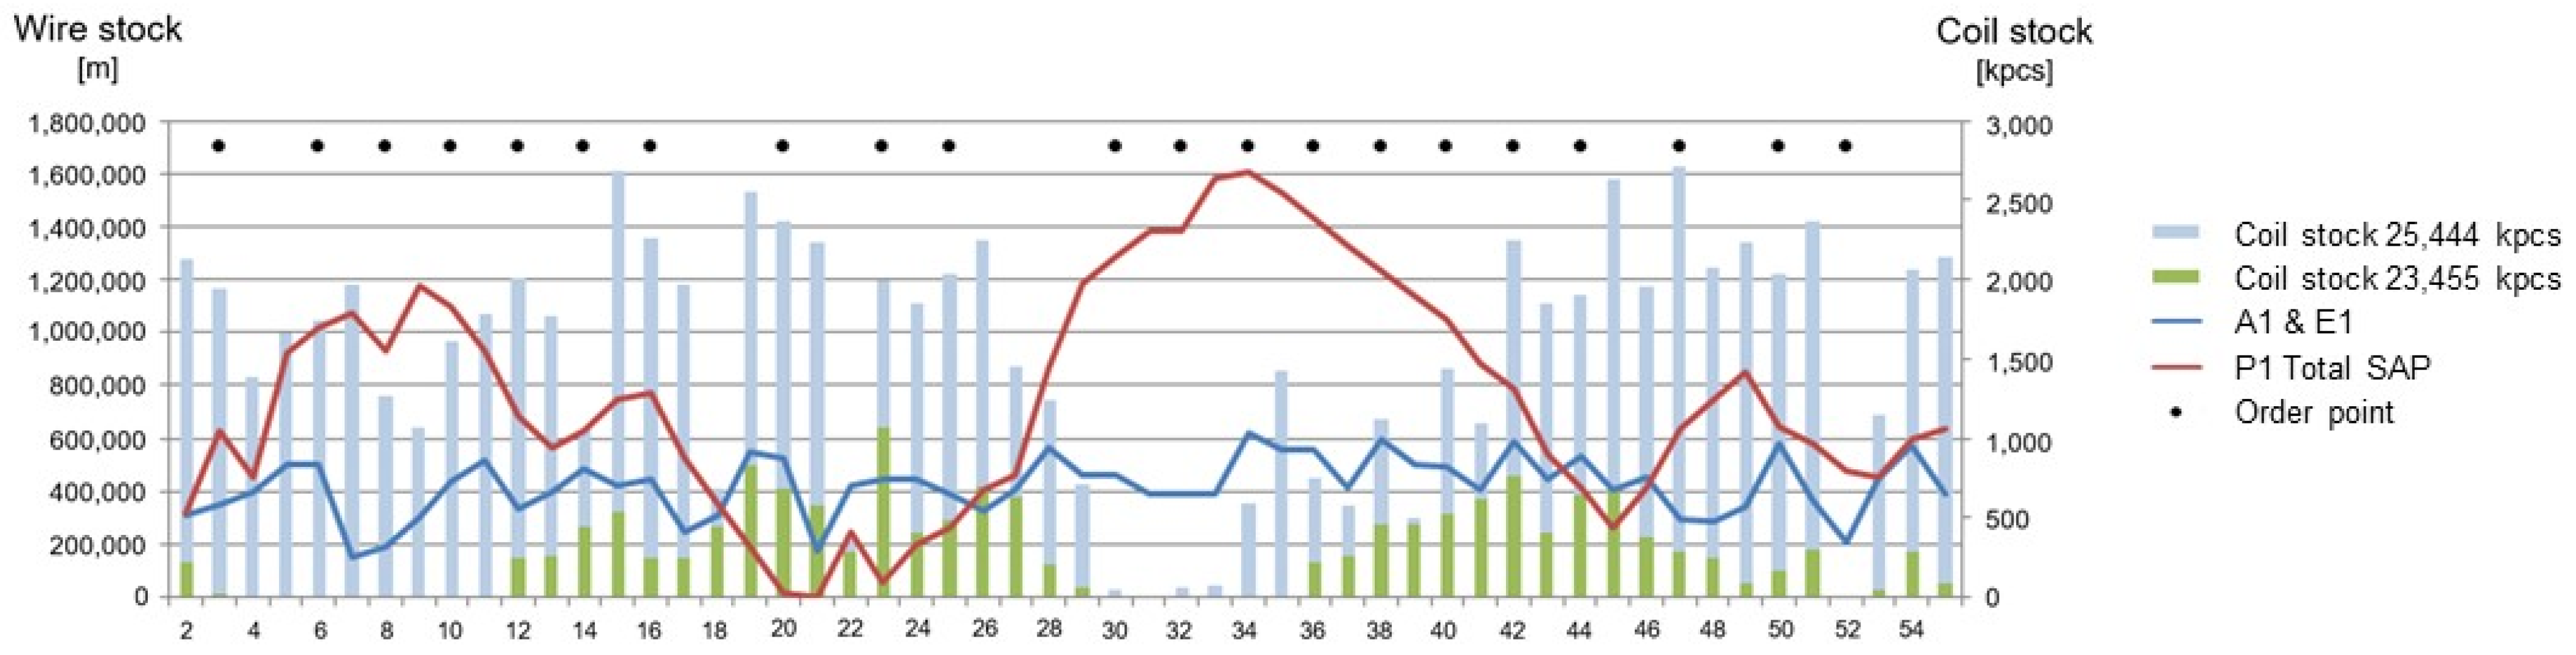
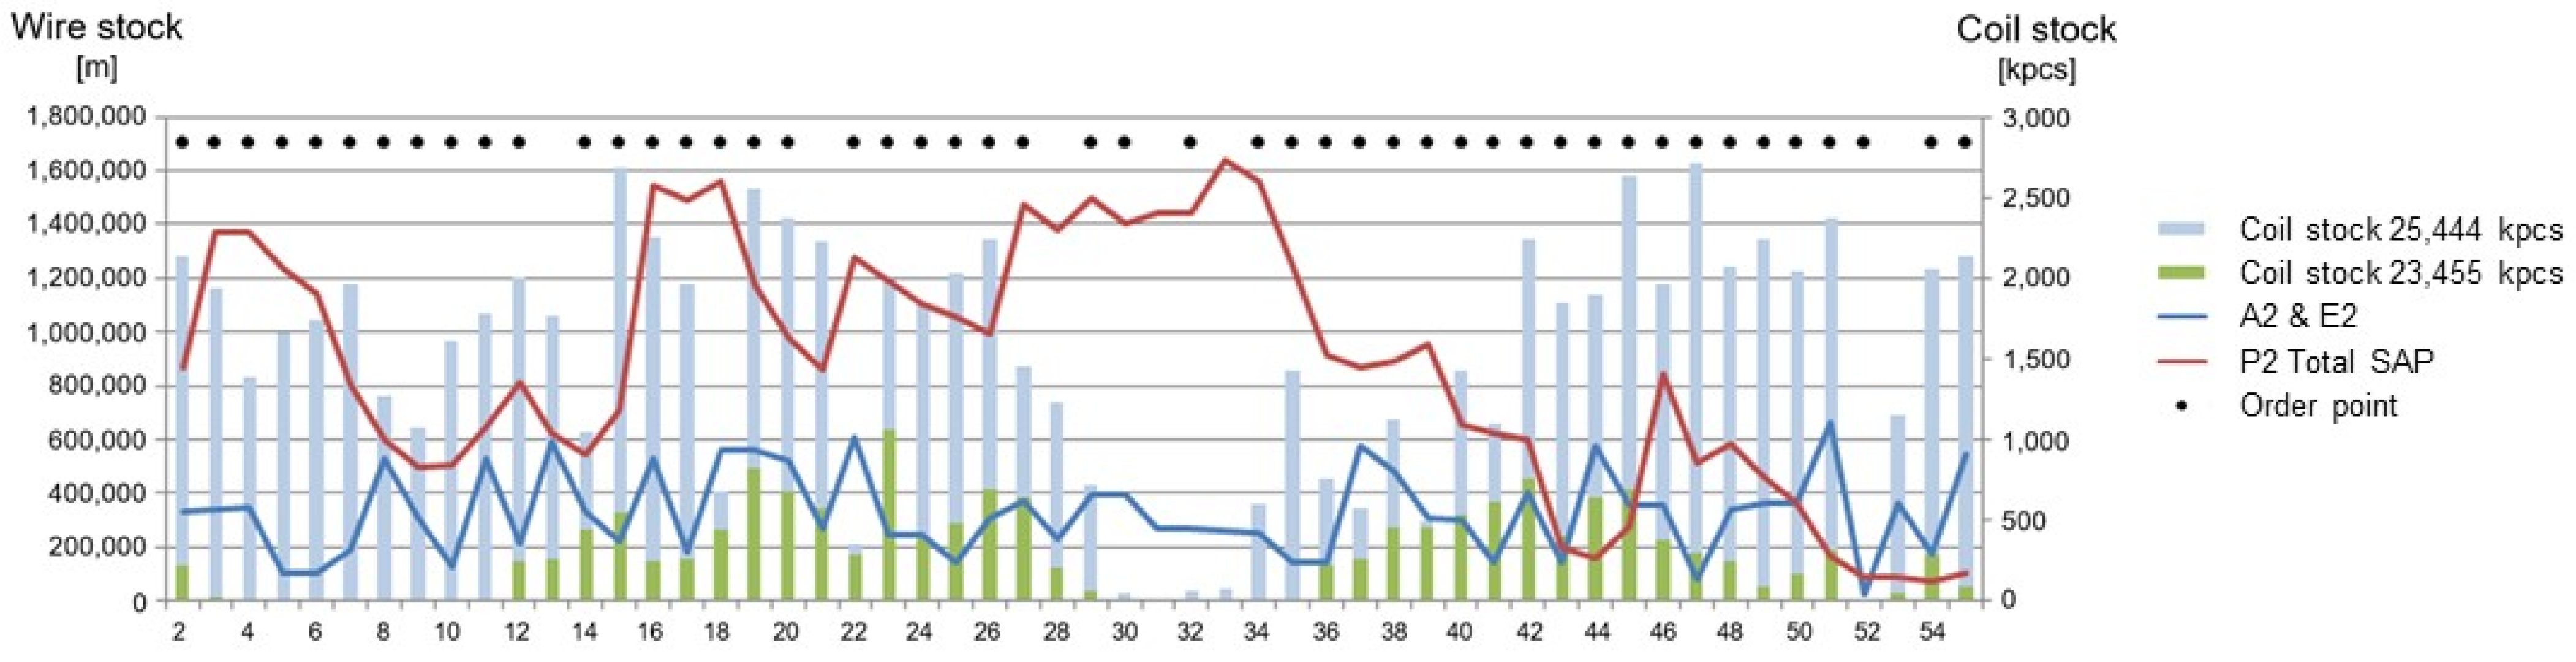
  • Preparation of several scenarios showing the possibility of reducing the value of inventories in the End2End approach using the digital twin solution;
  • Ensuring 100% availability of materials and components on both sides of the supply chain (wires, coils, torches);
  • Calculation and proposal of the EOQ—Economy Order Quantity indicator.
  • The main objective was defined for the conducted experiments—the preparation of a scenario showing the maximum possible reduction of inventories in the entire supply chain—to focus on semi-final products in Piła (Poland) while ensuring 100% availability of materials and components on both sides of the supply chain.
Figure 9 shows the flow of materials in the supply chain along with delivery times. In this chain, deliveries are carried out in the first phase by truck transport to airports (Xiamen, Chengdu), from where they fly by air cargo to Warsaw. In the case of deliveries from India, the air phase is divided into a flight to New Delhi, then Europe (Koeln, Frankfurt, or Amsterdam), where the air cargo is transshipped to Warsaw. The final phase for Piła is carried out by truck.
Figure 10 shows 3D visualizations of some chain links in a digital twin model. The simulation model was built in the discrete event simulation environment in FlexSim ver. 23.2.1 (www.flexsim.com, accessed on 11 July 2023).
Simulation experiments were performed for two cases: End2End and inventory level prediction. In the first case, analyses of products A1, A2, and E1, E2, the same semi-finished products identified by the symbols P1, P2, P3, and P4, were carried out. The experiments covered a period of 1 year of chain operation. The level of inventory in a given link in the supply chain was defined by a number representing the length of a given product in meters. Figure 11 shows the evolution of the stock level for products A1 and E1 using P1 semi-finished products, where the minimum stock level was 2,700,000 m and the average stock level calculated on the basis of company data for the year under review was 7,550,000 m. In this case, a limit value of 4,200,000 m was achieved in the simulation experiment, which ensures continuity of supply. Analyzing the course of the inventory, two increases in inventories were noticed: the first related to the date of the New Year in China (a case difficult to change) and the second increase, which was the basis for a successful attempt to reduce the level of inventories.
In the case of A2 and E2 products using the P2 semi-finished product (see Figure 12), when analyzing the annual data, three increases in the level of inventories were observed, which were not related to the dates of the holidays. The simulation experiment focused on trying to reduce these increases and resulted in a simulation of 330,000 m with an average of 878,000 m calculated from the company’s actual data.
In both cases (Figure 11 and Figure 12), the order points are marked with black dots at the top of the drawings. Similar experiments were performed for products using P3 and P4 intermediates. The results of the savings achieved are presented in Table 5. The presented results are the final summary results obtained after statistical analysis, which were expertly validated by experts of the international company on whose behalf the project was carried out.
Significant savings have been achieved. The conclusions of this project are a positive impulse for the company to undertake optimization activities using simulation technologies that create digital twins of the supply chain.
Leveraging digital twins and simulating various scenarios allows us to predict the following:
  • Safety stock level at our side.
  • Safety stock level at the supplier and customer sides.
  • Number of orders that must be placed per week/month/quarter.
  • Amount of material, which must be taken per order.
  • Exact time when the order must be placed.
The benefits of digital twin as the company’s digital transformation solution correspond to the following:
  • A quick analysis of stock values in the End2End approach (supplier—customer)
  • Easy recalculation of new stock levels at different sites based on new demand from customers.
  • A very good control of stock level value.
  • The possibility of reducing the stock value.
This digital twin use case exemplifies how it can be used as a company’s digital transformation tool.
This section shows how good practices could increase the company’s sustainable performance, the exploitation of the concepts and tools developed in this paper for optimizing a company, and the presentation of simulation contributions through scenarios in decision-making. Building on the insights from these best practices and use cases, the next section will delve deeper into the sustainable optimization framework outlined in Figure 11. This will equip Supply Chain Managers 5.0 with the necessary tools for successful supply chain transformation.

5. Results and Discussion

Section 4.1 on sustainability practices gives examples of how these initiatives could be exploited in the company’s supply chain’s sustainable digital transformation to increase its performance. Specifically, two main areas have been targeted, i.e., the circular economy and decarbonizing transport. The presented practices in the circular economy show that cutting-edge companies can develop new business models to reduce their raw material or component requirements, thus cutting their costs as well as their dependence on new primary resources. Furthermore, these sustainability practices have additional social benefits since they create new jobs and reduce the use of hazardous materials that can harm both people’s health and the environment. Finally, they relax the tension on the planet by alleviating the pressure on new material extraction for manufacturing processes as well as on landfill sites. Concerning good practices related to decarbonizing logistics, several measures have been compiled that are aimed at reducing the transport intensity of the economy, the energy intensity of transport, and the carbon footprint of energy.
Section 4.2 on optimization focuses on presenting a case that illustrates the use of Industry 4.0 concepts combined with sustainability to optimize and digitally transform the company’s supply chain performance.
Section 4.3. on the digital twin presents a zoom on one of the Industry 4.0 concepts to show how it could be an aided tool to optimize the company supply chain. The digital twin, more than a digital shadow focused on transmitting the physical data to the virtual system in real time, also integrates a decision-supporting tool to test scenarios and propose to the physical system the best organization to optimize its performance. This decision-aided tool is based on expert systems (knowledge as rules) and AI algorithms (deep learning) to solve problems. New technologies (IoTs) contribute to linking both systems and testing the company’s performance before investing in the physical system. In addition, it could provide scenarios of optimization results that will contribute to the company’s decision-making process.
Based on the results of these three parts, a framework has been developed (see Figure 13) to support the supply chain manager in becoming a Supply Chain Manager 5.0, as suggested by [93] for HR managers. This executive must integrate new technologies and tools to help transform the business and use sustainability as the core of the transformation, as described in Figure 13. The sustainable digital transformation of the supply chain has been described in three axes. Good structuring of decisions at the operational, tactical, and strategic levels corresponds to the decision transformation axis. The functional and physical transformations axis allows the manager to physically transform the supply chain processes. And the digital transformation axis integrates the physical supply chain, information systems, and new technologies that will improve business performance. The digital twin and the optimization use cases confirm the improvement in business performance through the transformation methodology.
Indeed, the Supply Chain Manager 5.0 described in the previous figure needs a dashboard to measure the performance of his/her service. Figure 14 represents an illustration of the performance dashboard structure required for sustainable, digital, and optimal supply chain management.
The main criteria of this dashboard are related to supply chain management and optimization fundamentals, ethics, sustainability, and digital supply chain management. The parameters to use for adjusting sustainable, digital, and optimal supply chain management are as follows:
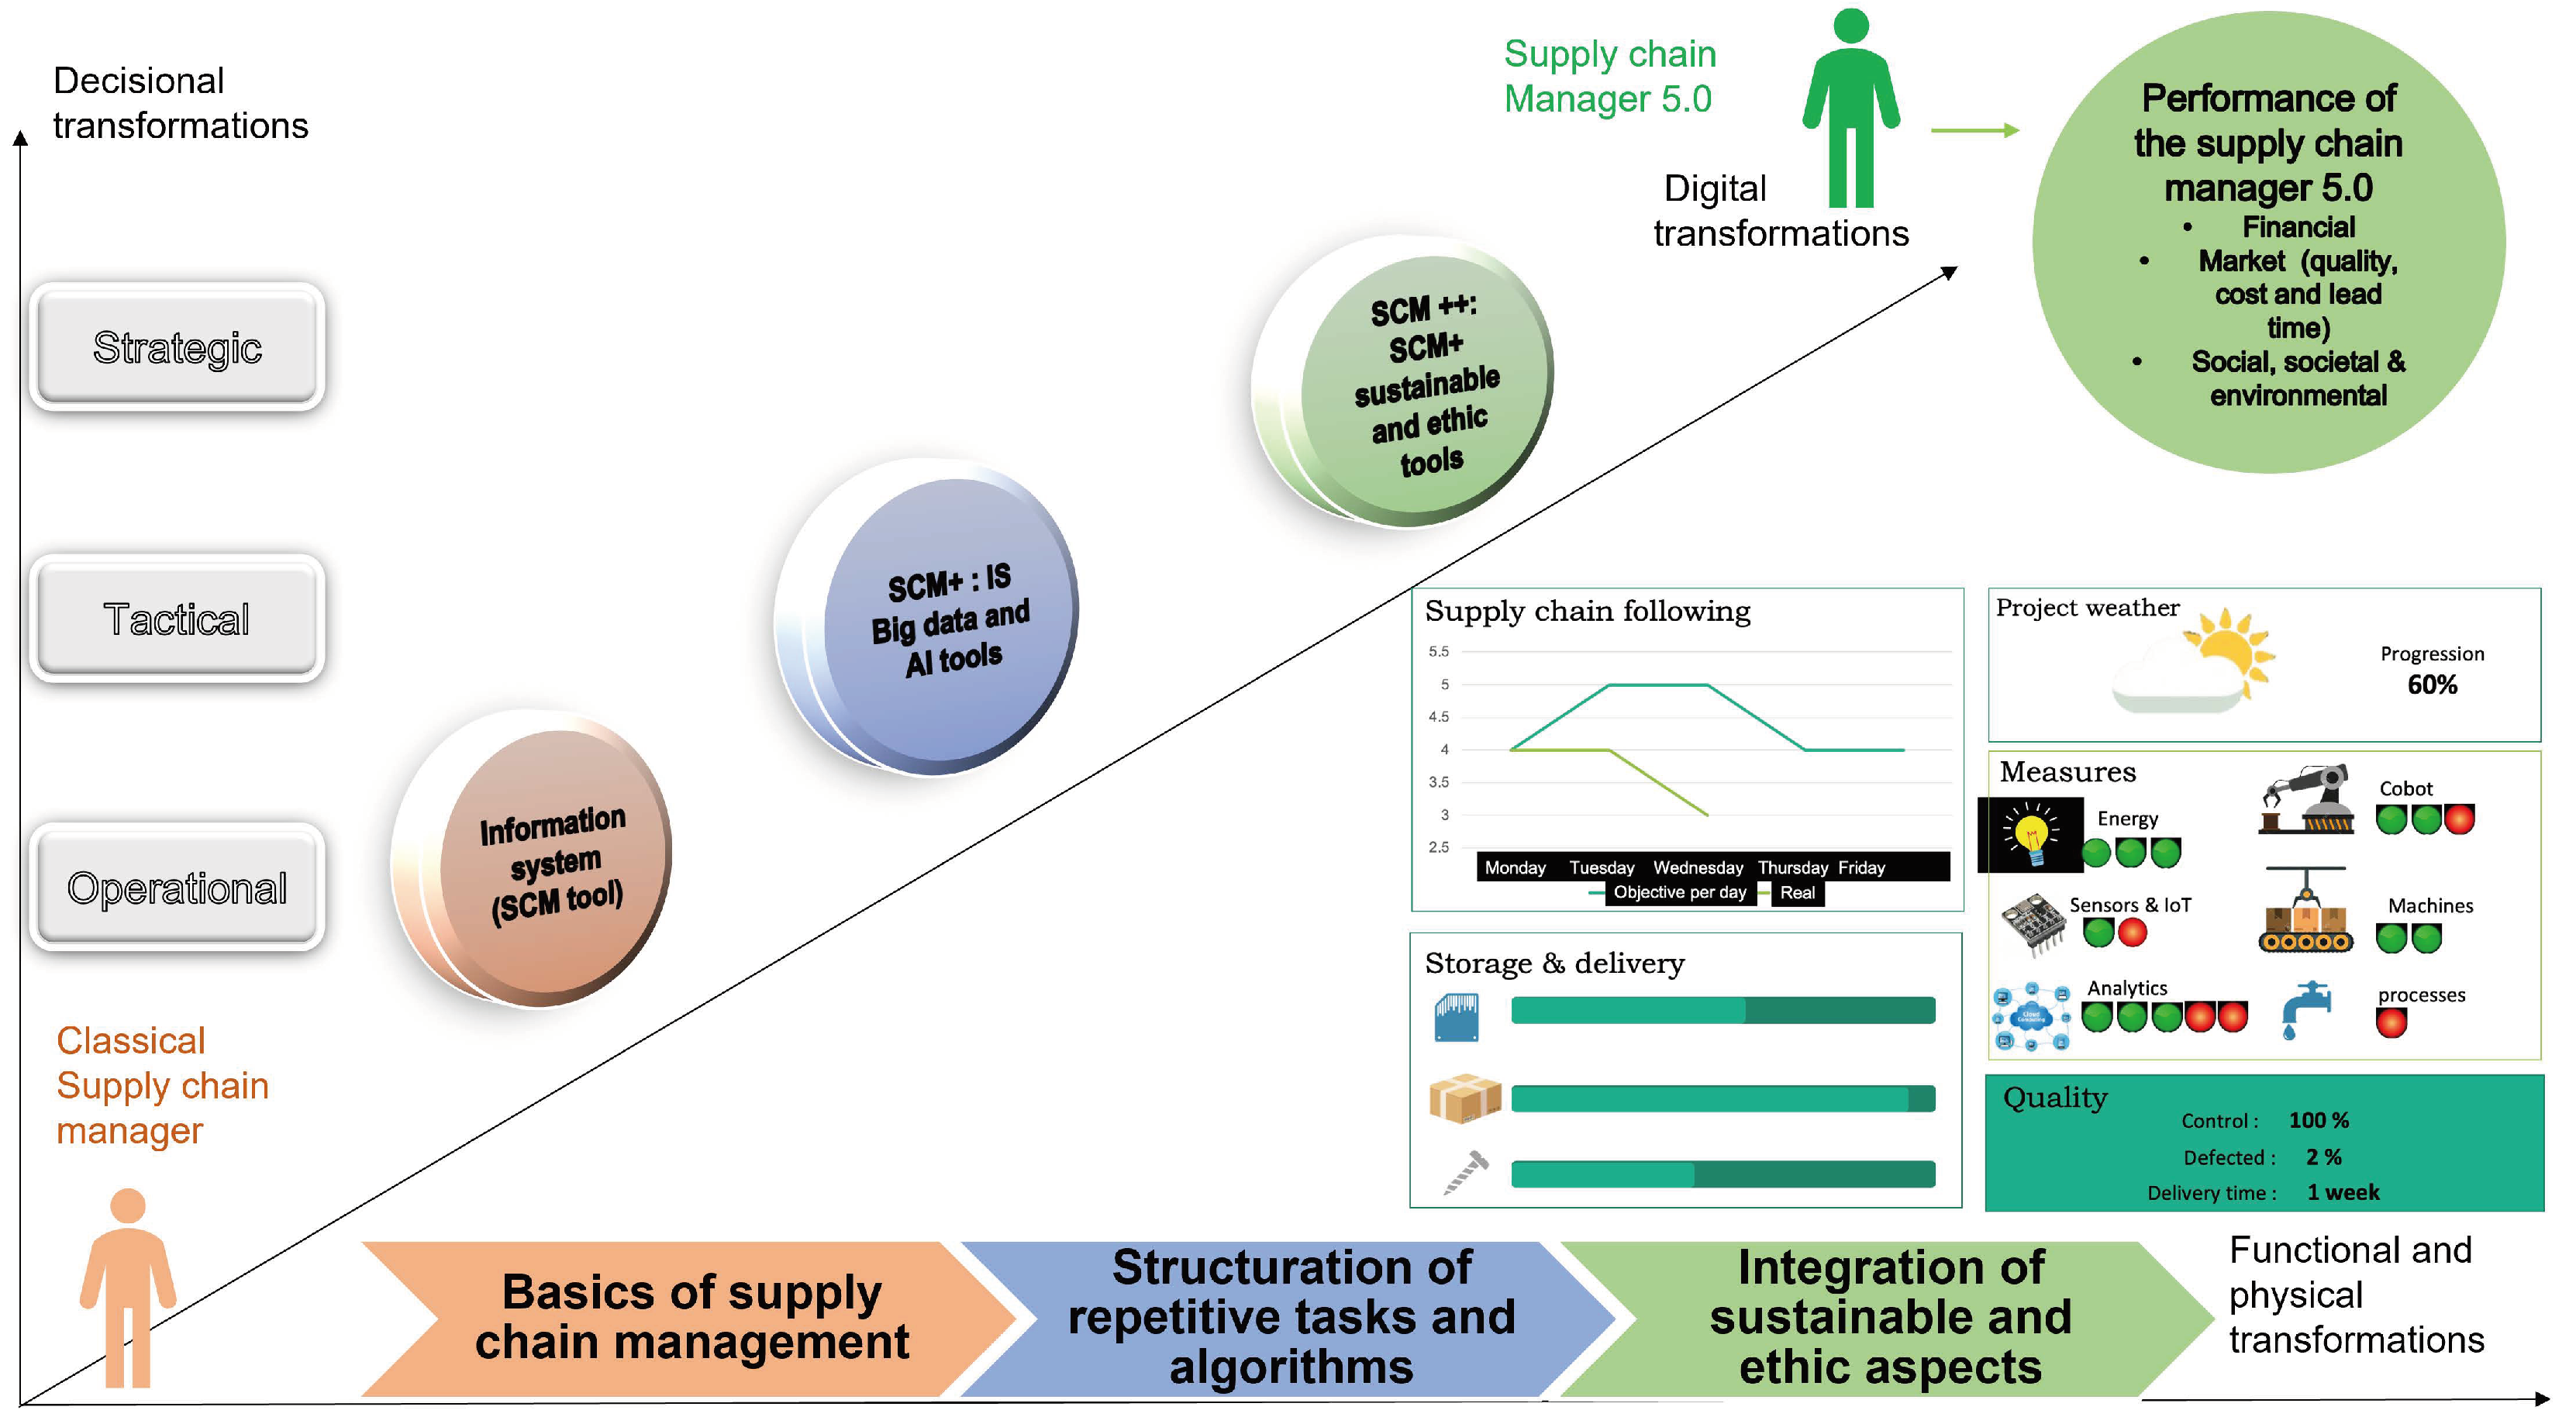
  • The planning and control, the global organization, the supply chain coordination, and its monitoring for the basics of supply chain management;
  • Justice, social responsibility exemplarity, mutual trust, and respect for others in the frame of ethics;
  • Social equity, preservation of the environment, and economic efficiency for sustainable management;
  • New technologies, agility, structural minding, and AI tool exploitation for digital supply chain management.
Good sustainability practices can provide parameters for implementing sustainable supply chain transformation.

6. Conclusions

Globalization means that companies have to solve problems in their supply chains such as transport optimization (traffic flow optimization, congestion management, last-mile deliveries), distribution reorganization (omnichannel or multichannel distribution), production management (process flow optimizations, quality cost and lead time optimizations), and procurement management (supplier relationship management, just-in-time procurement, cost reduction). But globalization has also induced an economic advantage for companies in emerging countries because of the low cost of labor. Indeed, the volatility of oil prices has changed the balance between production costs and distribution costs, but the changes are the same for all companies and have not decreased this advantage. Thus, the classical optimization tools that had been defined for solving the problems presented above are insufficient to solve the company’s new challenges. Industry 4.0 concepts such as AI, the Internet of Things, or digital twin appear as the solution to boost developed countries’ competitiveness and rebalance. Despite their success in large enterprises for their digital transformation to improve business performance, their utilization continues to be limited in SMEs because of factors such as cost, knowledge, and fear of new technologies.
The state of the art in sustainability, optimization, and digital twins is thoroughly reviewed in this paper. It also presents a conceptual framework to support sustainable supply chain management and digital transformation. Indeed, this framework considers that classical optimization methods have to be completed with the use of new technologies and guided by sustainability aspects to adapt company optimization to the new global context that involves taking care of the planet and people. Then, the company’s sustainable and digital transformation will improve business performance by guiding it through each step of its transformation in accordance with the company’s economic capacity, social expectations, and environmental objectives. The mathematical model covering environmental, social, and economic perspectives is described in the paper. The resolution of this multi-criteria model required the use of advanced algorithms (AI techniques) in addition to classical ones to find the most accurate solution to the SME problem.
Several examples of this methodology and tool exploitation have also been introduced. The first focuses on describing sustainability best practices to improve business performance. These practices help reduce the need for new primary resources, improve air quality, congestion, and fuel consumption, while increasing customer and community satisfaction. Moreover, this possibility reinforces the brand image of the firms in the eyes of the customers, allowing companies and their supply chains to enhance sales, market share, and profitability. The second example aims to show the exploitation of the concepts and methodology that have been presented in the paper. Each step of the company’s transformation was illustrated through this example. The third example shows the use of the digital twin to improve business performance. Specifically, it explains how the digital twin can be used to solve a particular problem in the company’s supply chain processes.
Finally, based on the results of the previous three examples, the structure of a performance measurement tool to evaluate supply chain managers’ decisions was presented. It provides an adapted framework and performance dashboard to support Supply Chain Manager 5.0. These global concepts have been introduced in Section 5 and will be co-created, detailed, and tested by a panel of supply chain managers who will agree to contribute to this definition. The next step of this research will be to develop an open tool integrating all the concepts presented in this paper, available to companies wishing to use the optimization methodology to transform their supply chain processes.

Author Contributions

Conceptualization, P.-E.D., E.A.-d.-l.-M. and P.P.; Methodology, P.-E.D., E.A.-d.-l.-M. and P.P.; Software, P.-E.D.; Formal analysis, P.-E.D., E.A.-d.-l.-M. and P.P.; Resources, P.-E.D., E.A.-d.-l.-M. and P.P.; Writing—original draft, P.-E.D., E.A.-d.-l.-M. and P.P.; Supervision, P.-E.D. and E.A.-d.-l.-M. All authors have read and agreed to the published version of the manuscript.

Funding

This research received no external funding but was issued through the collaboration between the authors on their own research.

Data Availability Statement

Data are contained within the article.

Conflicts of Interest

The authors declare no conflicts of interest.

References

  1. De Meyer, A.; Cattrysse, D.; Rasinmäki, J.; Orshoven, J.V. Methods to optimize the design and management of biomass-for-bioenergy supply chains: A review. Renew. Sustain. Energy Rev. 2014, 31, 657–670. [Google Scholar] [CrossRef]
  2. Rajeev, A.; Pati, R.K.; Padhi, S.S.; Govindan, K. Evolution of sustainability in supply management: A literature review. J. Clean. Prod. 2017, 162, 299–314. [Google Scholar] [CrossRef]
  3. Li, L.; Liao, H.; Zhou, J.; Wang, Y. Sustainability and optimization methods under uncertainties in closed-loop supply chain. Comput. Ind. Eng. 2022, 171, 108396. [Google Scholar] [CrossRef]
  4. Madsen, D.Ø.; Berg, T.; Di Nardo, M. Bibliometric Trends in Industry 5.0 Research: An Updated Overview. Appl. Syst. Innov. 2023, 6, 63. [Google Scholar] [CrossRef]
  5. Guo, Y.; Shi, Q.; Guo, C.; Li, J.; You, Z.; Wang, Y. Designing a sustainable remanufacturing closed-loop supply chain under hybrid uncertainty: Cross-efficiency sorting multi-objective optimization. Comput. Ind. Eng. 2022, 172, 108639. [Google Scholar] [CrossRef]
  6. Richardson, B.C. Sustainable transport: Anais frameworks. J. Transp. Geogr. 2005, 13, 29–39. [Google Scholar] [CrossRef]
  7. Alegoz, M.; Yapicioglu, H. Supplier selection and order allocation decisions under quantity discount and fast service options. Sustain. Prod. Consum. 2019, 18, 179–189. [Google Scholar] [CrossRef]
  8. Wang, T.; Bao, X.; Clavera, I.; Hoang, J.; Wen, Y.; Langlois, E.; Zhang, S.; Zhang, G.; Abbeel, P.; Ba, J. Benchmarking model-based reinforcement learning. arXiv 2019, arXiv:1907.02057. [Google Scholar] [CrossRef]
  9. Demizu, T.; Fukawaza, Y.; Morita, H. Inventory management of new products in retailers using model-based deep reinforcement learning. Expert Syst. Appl. 2023, 229, 120256. [Google Scholar] [CrossRef]
  10. Garcia-Velasquez, C.; Defryn, C.; Van der Meer, Y. Life cycle optimization of the supply chain for biobased chemicals with local biomass resources. Sustain. Prod. Consum. 2023, 36, 540–551. [Google Scholar] [CrossRef]
  11. Brundtland, G.H. Our Common Future. In Brundtland Report; Oxford University Press: Oxford, UK, 1987. [Google Scholar]
  12. McKinnon, A. Environmental sustainability A new priority for logistics managers. In Green Logistics. Improving the Environmental Sustainability of Logistics, 3rd ed.; McKinnon, A., Browne, M., Piecyk, M., Whiteing, A., Eds.; Kogan Page: London, UK, 2015; pp. 3–26. [Google Scholar]
  13. Green Deal. Available online: https://commission.europa.eu/strategy-and-policy/priorities-2019-2024/european-green-deal_en (accessed on 1 July 2023).
  14. ISO. ISO 14000—Management Environnemental. Available online: https://www.iso.org/fr/iso-14001-environmental-management.html (accessed on 15 April 2022).
  15. McIntyre, K. Delivering sustainability through supply chain management. In Global Logistics New Directions in Supply Chain Management, 7th ed.; Waters, D., Rinsler, S., Eds.; Kogan Page: London, UK, 2010; pp. 244–258. [Google Scholar]
  16. European and Environmental Agency. Transport and Mobility. 2023. Available online: https://www.eea.europa.eu/en/topics/in-depth/transport-and-mobility (accessed on 4 July 2023).
  17. ITF Transport Outlook 2021; OECD Publishing: Paris, France, 2021; Available online: https://www.oecd-ilibrary.org/transport/itf-transport-outlook-2021_16826a30-en (accessed on 4 July 2023).
  18. Kaya, Y. Impact of Carbon Dioxide Emission Control on GNP Growth: Interpretation of Proposed Scenarios (Energy and Industry Subgroup); Intergovernmental Panel on Climate Change: Paris, France, 1990. [Google Scholar]
  19. McKinnon, A. Climate change: The nature and scale of the challenge. In Decarbonising Logistics. Distributing Goods in a Low Carbon World, 1st ed.; Kogan Page Publishers: London, UK, 2018; pp. 1–28. [Google Scholar]
  20. Pope Francis. Laudato Si: On Care for Our Common Home [Encyclical]. 2015. Available online: https://www.vatican.va/content/francesco/en/encyclicals/documents/papa-francesco_20150524_enciclica-laudato-si.html (accessed on 11 July 2023).
  21. Dickoff, H.; Steven, M. Networks in Reverse Logistics. In Supply Chain Management and Reverse Logistics; Dickoff, H., Lackes, R., Reese, J., Eds.; Springer: Berlin, Germany, 2004; pp. 163–180. [Google Scholar]
  22. Circular Economy: Definition, Importance and Benefits, News European Parliament. Available online: https://www.europarl.europa.eu/news/en/headlines/economy/20151201STO05603/circular-economy-definition-importance-and-benefits (accessed on 7 July 2023).
  23. How the EU Wants to Achieve a Circular Economy by 2050, News European Parlament. Available online: https://www.europarl.europa.eu/news/en/headlines/society/20210128STO96607/how-the-eu-wants-to-achieve-a-circular-economy-by-2050 (accessed on 7 July 2023).
  24. EUROSTAT. Available online: https://ec.europa.eu/eurostat (accessed on 11 July 2023).
  25. CEAP A New Circular Economy Action Plan. For a Cleaner and More Competitive Europe. 2020. Available online: https://eur-lex.europa.eu/legal-content/EN/TXT/?qid=1583933814386&uri=COM:2020:98:FIN (accessed on 11 July 2023).
  26. Rahbari, M.; Khamseh, A.A.; Mohammadi, M. Robust optimization and strategic analysis for agri-food supply chain under pandemic crisis: Case study from an emerging economy. Expert Syst. Appl. 2023, 225, 120081. [Google Scholar] [CrossRef] [PubMed]
  27. Badakhshan, E.; Ball, P. A simulation-optimization approach for integrating physical and financial flows in a supply chain under economic uncertainty. Oper. Res. Perspect. 2023, 10, 100270. [Google Scholar] [CrossRef]
  28. Spiegler, V.L.M.; Naim, M.M.; Towill, D.R.; Wikner, J. A technique to develop simplified and linearised models of complex dynamic supply chain systems. Eur. J. Oper. Res. 2016, 251, 888–903. [Google Scholar] [CrossRef]
  29. Boulding, K.E. General Systems Theory—The Skeleton of Science. In Facets of Systems Science. International Federation for Systems Research International Series on Systems Science and Engineering; Springer: Boston, MA, USA, 1991; Volume 7. [Google Scholar] [CrossRef]
  30. Yoshikawa, H. Introduction to General Design Theory. Intelligent Manufacturing Systems; Milacic, V.R., Ed.; Elsevier: Amsterdam, The Netherlands, 1988. [Google Scholar]
  31. Tomiyama, T. A design process model that unifies General Design Theory and Empirical Findings. In Design Engineering Technical Conferences; ASME: New York, NY, USA, 1995; Volume 2. [Google Scholar]
  32. Suh, N.P. Design and Operation of Large Systems. J. Manuf. Syst. 1995, 14, 203–213. [Google Scholar] [CrossRef]
  33. Jorysz, H.R.; Vernadat, F.B. CIM-OSA, part 1: Total enterprise modelling and the function view. Int. J. Comput. Integr. Manuf. 1990, 3–4, 144–156. [Google Scholar] [CrossRef]
  34. Kosanke, K. CIMOSA—Overview and status. Comput. Ind. 1995, 27, 101–109. [Google Scholar] [CrossRef]
  35. Williams, T.J. The PURDUE enterprise reference architecture. Comput. Ind. 1994, 24, 141–158. [Google Scholar] [CrossRef]
  36. Chen, D.; Vallespir, B.; Doumeingts, G. GRAI integrated methodology and its mapping onto generic enterprise reference architecture and methodology. Comput. Ind. 1987, 33, 87–394. [Google Scholar] [CrossRef]
  37. Ge, H.; Nolan, J.; Gray, R.; Goetz, S.; Han, Y. Supply chain complexity and risk mitigation—A hybrid optimization-simulation model. Int. J. Prod. Econ. 2016, 179, 228–238. [Google Scholar] [CrossRef]
  38. Esteso, A.; Alemany, M.M.E.; Ortiz, A. Conceptual framework for designing agri-food supply chains under uncertainty by mathematical programming models. Int. J. Prod. Res. 2018, 56, 4418–4446. [Google Scholar] [CrossRef]
  39. Ali, S.S.; Barman, H.; Kaur, R.; Tomaskova, H.; Roy, S.K. Multi-product multi echelon measurements of perishable supply chain: Fuzzy non-linear programming approach. Mathematics 2021, 9, 2093. [Google Scholar] [CrossRef]
  40. Boyabatl, O.; Nasiry, J.; Zhou, Y. Crop planning in sustainable agriculture: Dynamic farmland allocation in the presence of crop rotation benefits. Manag. Sci. 2019, 65, 2060–2076. [Google Scholar] [CrossRef]
  41. Yakavenka, V.; Mallidis, L.; Vlachos, D.; Lakovou, E.; Eleni, Z. Development of a multi-objective model for the design of sustainable supply chains: The case of perishable food products. Ann. Oper. Res. 2020, 294, 593–621. [Google Scholar] [CrossRef]
  42. Bermejo, B.; Juiz, C. Improving Cloud/Edge Sustainability through Artificial Intelligence: A Systematic Review. J. Parallel Distrib. Comput. 2023, 176, 41–54. [Google Scholar] [CrossRef]
  43. Shehab, M.; Abualigah, L.; Al Hamad, A.; Alabool, H.; Alshinwan, M.; Khazawneh, A.M. Moth-flame optimization algorithm: Variants and applications. Neural Comput. Appl. 2020, 32, 9859–9884. [Google Scholar] [CrossRef]
  44. Rebala, G.; Ravi, A.; Churiwala, S. An Introduction to Machine Learning; Springer: Cham, Switzerland, 2019. [Google Scholar] [CrossRef]
  45. Yüksel, N.; Börklü, H.R.; Sezer, H.K.; Canyurt, O.E. Review of artificial intelligence applications in engineering design perspective. Eng. Appl. Artif. Intell. 2023, 118, 105697. [Google Scholar] [CrossRef]
  46. Bertolini, M.; Mezzogori, D.; Neroni, M.; Zammori, F. Machine learning for industrial applications: A comprehensive literature review. Expert Syst. Appl. 2021, 175, 114820. [Google Scholar] [CrossRef]
  47. Chen, X.; Yao, L.; McAuley, J.; Zhou, G.; Wang, X. Deep reinforcement learning in recommender systems: A survey and new perspectives. Knowl.-Based Syst. 2023, 264, 110335. [Google Scholar] [CrossRef]
  48. Nasir, V.; Sassani, F. A review on deep learning in machining and tool monitoring: Methods, opportunities, and challenges. Int. J. Adv. Manuf. Technol. 2021, 115, 2683–2709. [Google Scholar] [CrossRef]
  49. Yang, J.; Li, S.; Wang, Z.; Dong, H.; Wang, J.; Tang, S. Using deep learning to detect defects in manufacturing: A comprehensive survey and current challenges. Materials 2020, 13, 5755. [Google Scholar] [CrossRef]
  50. Mohammed, M.Q.; Chung, K.L.; Chyi, C.S. Review of Deep Reinforcement Learning-based Object Grasping: Techniques, Open Challenges, and Recommendations. IEEE Access 2020, 8, 3027923. [Google Scholar] [CrossRef]
  51. Li, C.; Zheng, P.; Yin, Y.; Wang, B.; Wang, L. Deep reinforcement learning in smart manufacturing: A review and prospects. CIRP J. Manuf. Sci. Technol. 2023, 40, 75–101. [Google Scholar] [CrossRef]
  52. Liu, Z.; Guo, Y. A hybrid approach to integrate machine learning and process mechanics for the prediction of specific cutting energy. CIRP Ann. 2018, 67, 57–60. [Google Scholar] [CrossRef]
  53. Zhou, L.; Zhang, L.; Ren, L.; Wang, J. Real-time scheduling of cloud manufacturing services based on dynamic data-driven simulation. IEEE Trans. Ind. Inform. 2019, 15, 5042–5051. [Google Scholar] [CrossRef]
  54. Christopher, M.; Peck, H. Building the resilient supply chain. Int. J. Logist. Manag. 2004, 15, 1–14. [Google Scholar] [CrossRef]
  55. Heckmann, I.; Comes, T.; Nickel, S. A critical review on supply chain risk—Definition, measure and modeling. Omega 2015, 52, 119–132. [Google Scholar] [CrossRef]
  56. Keshavarz-Ghorabaee, M. Sustainable Supplier Selection and Order Allocation Using an Integrated ROG-Based Type-2 Fuzzy Decision-Making Approach. Mathematics 2023, 11, 2014. [Google Scholar] [CrossRef]
  57. Moheb-Alizadeh, H.; Handfield, R. Sustainable supplier selection and order allocation: A novel multi-objective programming model with a hybrid solution approach. Comput. Ind. Eng. 2019, 129, 192–209. [Google Scholar] [CrossRef]
  58. Hosseini, S.; Morshedlou, N.; Ivanov, D.; Sarder, M.D.; Barker, K.; Khaled, A.A. Resilient supplier selection and optimal order allocation under disruption risks. Int. J. Prod. Econ. 2019, 213, 124–137. [Google Scholar] [CrossRef]
  59. Duan, C.-Y.; Liu, H.-C.; Zhang, L.-J.; Shi, H. An Extended Alternative Queuing Method with Linguistic Z-numbers and Its Application for Green Supplier Selection and Order Allocation. Int. J. Fuzzy Syst. 2019, 21, 2510–2523. [Google Scholar] [CrossRef]
  60. Mohammed, A.; Harris, I.; Govindan, K. A hybrid MCDM-FMOO approach for sustainable supplier selection and order allocation. Int. J. Prod. Econ. 2019, 217, 171–184. [Google Scholar] [CrossRef]
  61. Zhao, G.; Cao, X.; Xiao, W.; Zhu, Y.; Cheng, K. Digital twin for NC machining using complete process information expressed by StEP-NC standard. In Proceedings of the 2019 4th International Conference on Automation, Control and Robotics Engineering (CACRE2019); Association for Computing Machinery: New York, NY, USA, 2019. [Google Scholar] [CrossRef]
  62. Matthews, T. LibGuides: Web of Science Platform: Web of Science: Summary of Coverage. 2021. Available online: https://clarivate.libguides.com/librarianresources/coverage (accessed on 11 July 2023).
  63. Tay, S.I.; Lee, T.C.; Hamid, N.Z.A.; Ahmad, A.N.A. An overview of industry 4.0: Definition, components, and government initiatives. J. Adv. Res. Dyn. Control. Syst. 2018, 10, 14–1379. [Google Scholar]
  64. Cimino, C.; Negri, E.; Fumagalli, L. Review of digital twin applications in manufacturing. Comput. Ind. 2019, 113, 103130. [Google Scholar] [CrossRef]
  65. He, B.; Bai, K.-J. Digital twin-based sustainable intelligent manufacturing: A review. Adv. Manuf. 2021, 9, 1. [Google Scholar] [CrossRef]
  66. Kritzinger, W.; Karner, M.; Traar, G.; Henjes, J.; Sihn, W. Digital Twin in manufacturing: A categorical literature review and classification. IFAC-Pap. 2018, 51, 11–1016. [Google Scholar] [CrossRef]
  67. Aivaliotis, P.; Georgoulias, K.; Alexopoulos, K. Using digital twin for maintenance applications in manufacturing: State of the Art and Gap analysis. In Proceedings of the 2019 IEEE International Conference on Engineering, Technology and Innovation (ICE/ITMC), Valbonne Sophia-Antipolis, France, 17–19 June 2019; pp. 1–5. [Google Scholar] [CrossRef]
  68. Errandonea, I.; Beltrán, S.; Arrizabalaga, S. Digital Twin for maintenance: A literature review. Comput. Ind. 2020, 123, 103316. [Google Scholar] [CrossRef]
  69. Marmolejo-Saucedo, M.; Hurtado-Hernandez, M.; Suarez-Valdes, R. Digital Twins in Supply Chain Management: A Brief Literature Review. In Intelligent Computing and Optimization; Vasant, P., Zelinka, I., Weber, G.-W., Eds.; Springer International Publishing: Cham, Switzerland, 2020; pp. 653–661. [Google Scholar] [CrossRef]
  70. Orozco-Romero, A.; Arias-Portela, C.Y.; Marmolejo-Saucedo, J.A. The Use of Agent-Based Models Boosted by Digital Twins in the Supply Chain: A Literature Review. Adv. Intell. Syst. Comput. 2020, 1072, 642–652. [Google Scholar] [CrossRef]
  71. Chen, Z.; Huang, L. Digital twins for information-sharing in remanufacturing supply chain: A review. Energy 2021, 220, 119712. [Google Scholar] [CrossRef]
  72. Hu, C.; Gao, W.; Xu, C.; Ben, K. Study on the application of digital twin technology in complex electronic equipment. Lect. Notes Electr. Eng. 2020, 589, 123–137. [Google Scholar] [CrossRef]
  73. Sreedevi, T.R.; Santosh Kumar, M.B. Digital Twin in Smart Farming: A Categorical Literature Review and Exploring Possibilities in Hydroponics. In Proceedings of the 2020 Advanced Computing and Communication Technologies for High Performance Applications (ACCTHPA), Cochin, India, 2–4 July 2020; pp. 120–124. [Google Scholar] [CrossRef]
  74. Fuller, A.; Fan, Z.; Day, C.; Barlow, C. Digital Twin: Enabling Technologies, Challenges and Open Research. IEEE Access 2020, 8, 108952–108971. [Google Scholar] [CrossRef]
  75. Haag, S.; Anderl, R. Automated Generation of as-manufactured geometric Representations for Digital Twins using STEP. Procedia CIRP 2019, 84, 1082–1087. [Google Scholar] [CrossRef]
  76. Grieves, M. Digital Twin, Manufacturing Excellence Through Virtual Factory Replication. White Pap. 2014, 1, 1–7. [Google Scholar]
  77. Van der Valk, H.; Haße, H.; Möller, F.; Arbter, M.; Henning, J.-L.; Otto, B. A taxonomy of digital twins. In Proceedings of the 26th Americas Conference on Information Systems, AMCIS 2020, Virtual, 15–17 August 2020. [Google Scholar]
  78. Grigoriev, S.N.; Sinopalnikov, V.A.; Tereshin, M.V.; Gurin, V.D. Control of parameters of the cutting process on the basis of diagnostics of the machine tool and workpiece. Meas. Tech. 2012, 55, 555–558. [Google Scholar] [CrossRef]
  79. Okunev, A.P.; Borovkov, A.I.; Karev, A.S.; Lebedev, D.O.; Kubyshkin, V.I.; Nikulina, S.P.; Kiselev, A.A. Digital Modeling and Testing of Tractor Characteristics. Russ. Eng. Res. 2019, 39, 453–458. [Google Scholar] [CrossRef]
  80. Stock, T.; Seliger, G. Opportunities of Sustainable Manufacturing in Industry 4.0. Procedia CIRP 2016, 40, 536–541. [Google Scholar] [CrossRef]
  81. Dossou, P.-E.; Laouénan, G.; Didier, J.-Y. Development of a Sustainable Industry 4.0 Approach for Increasing the Performance of SMEs. Processes 2022, 10, 1092. [Google Scholar] [CrossRef]
  82. Grigoriev, S.N.; Dolgov, V.A.; Nikishechkin, P.A.; Dolgov, N.V. Information model of production and logistics systems of machine-building enterprises as the basis for the development and maintenance of their digital twins. IOP Conf. Ser. Mater. Sci. Eng. 2020, 971, 3. [Google Scholar] [CrossRef]
  83. Liu, W.; Zhang, W.; Dutta, B.; Wu, Z.; Goh, M. Digital twinning for productivity improvement opportunities with robotic process automation: Case of greenfield hospital. Int. J. Mech. Eng. Robot. Res. 2020, 2, 258–263. [Google Scholar] [CrossRef]
  84. Trotta, D.; Garengo, P. Industry 4.0 key research topics: A bibliometric review. In Proceedings of the 2018 7th International Conference on Industrial Technology and Management (ICITM), Oxford, UK, 7–9 March 2018; pp. 113–117. [Google Scholar] [CrossRef]
  85. Carrefour Launches Its “Zero-km” Commitment to Help Local Producers. Available online: https://www.carrefour.com/en/news/carrefour-launches-its-zero-kilometre-commitment-help-local-producers (accessed on 17 July 2023).
  86. Supply Chain Analysis Nestlé & PepsiCo: Step Changing Performance with Horizontal Collaboration. Available online: https://supplychainanalysis.igd.com/presentations/presentation-viewer/t/nestlé--pepsico-step-changing-performance-with-horizontal-collaboration/i/10290 (accessed on 17 July 2023).
  87. WEF World Economic Forum and Accenture. Supply Chain Decarbonization. The Role of Logistics and Transport in Reducing Supply Chain Carbon Emissions. Available online: https://www3.weforum.org/docs/WEF_LT_SupplyChainDecarbonization_Report_2009.pdf (accessed on 17 July 2023).
  88. Xerox Prevent and Manage Waste. Available online: https://www.xerox.com/en-us/about/ehs/reduce-waste (accessed on 13 July 2023).
  89. Patagonia Our Footprint. Available online: https://www.patagonia.com/our-footprint/ (accessed on 13 July 2023).
  90. Chep What is Pallet Pooling and What Are the Advantages. Available online: https://www.chep.com/be/en/what-is-pallet-pooling (accessed on 17 July 2023).
  91. Dyson Renewed. Available online: https://www.dyson.com/outlet (accessed on 17 July 2023).
  92. Le Moigne, R. Quelles stratégies pour les entreprises? In L’économie Circulaire Stratégies Pour un Monde Durable, 2nd ed.; Dunod: Malakoff, France, 2018; pp. 169–191. [Google Scholar]
  93. Dossou, P.E.; Helali, S. Manager de manière éthique et responsible. In Managementor; Barabel, M., Meier, O., Eds.; Dunod: Malakoff, France, 2022. [Google Scholar]
Figure 1. Structure of the paper (source: own work).
Mathematics 12 02737 g001
Figure 2. The 3D representation of the conceptual framework (adapted from [81]) for the supply chain sustainable digital transformation (source: own work).
Mathematics 12 02737 g002
Figure 3. The performance measurement indicator’s structure (source: own work).
Mathematics 12 02737 g003
Figure 4. Intelligent support system tool architecture (source: own work).
Mathematics 12 02737 g004
Figure 5. Turnover per geographical zone (source: own work).
Mathematics 12 02737 g005
Figure 6. Turnover per activity (source: own work).
Mathematics 12 02737 g006
Figure 7. The project management implementation process (source: own work).
Mathematics 12 02737 g007
Figure 8. Architecture of a company digital system (source: own work).
Mathematics 12 02737 g008
Figure 9. Supply chain flow prepared for digital twin (source: own work).
Mathematics 12 02737 g009
Figure 10. Visualization of 3D digital twin model built on supply chain flow diagram (source: own work).
Mathematics 12 02737 g010
Figure 11. Visualization of the evolution of the stock level for products A1 and E1 using P1 semi-finished products (source: own work).
Mathematics 12 02737 g011
Figure 12. Visualization of the evolution of the stock level for products A2 and E2 using P2 semi-finished products (source: own work).
Mathematics 12 02737 g012
Figure 13. Framework (adapted from [93]) for the Supply Chain Manager 5.0 (source: own work).
Mathematics 12 02737 g013
Figure 14. The performance dashboard (adapted from [93]) of the Supply Chain Manager 5.0. (source: own work).
Mathematics 12 02737 g014
Table 1. Recycling rates for different waste streams and EU strategies/directives.
Waste StreamRecycling RateStrategy/Directive
Plastics32.5%EU Strategy for Plastics in the Circular Economy
Textiles1%EU Strategy for Textiles
E-waste<40%WEEE Directive
Food20% 1EU Farm-to-Fork Strategy
Water and nutrients90% 2Water Framework Directive
Packaging64%Packaging and Packaging Waste Directive
Batteries
and vehicles
47%
90.5%
Batteries and Accumulators Directive
End-of-Life Vehicles Directive
Buildings and construction50%Energy Performance of Buildings Directive
1 It refers to food waste. 2 Data comes from urban waste water.
Table 2. Indices.
Table 2. Indices.
Index Description
iIndex of the procurement processes, i varying from 1 to I
jIndex of the manufacturing processes, j varying from 1 to J
kIndex of the distribution processes, k varying from 1 to K
lIndex of the cost criterion
mIndex of the quality criterion
nIndex of the lead time criterion
wIndex of the digital maturity degree criterion
oIndex of well-being criterion
pIndex of health criterion
qIndex of transport criterion
rIndex of waste criterion
sIndex of water criterion
tIndex of air criterion
uIndex of energy criterion
vIndex of environmental management criterion
Table 3. Parameters.
ParametersDescription
NiNumber of procurement processes
NjNumber of manufacturing processes
NkNumber of distribution processes
ClCost minimization limit
QmQuality maximization limit
LDnLead time minimization limit
DMwDigital maturity degree maximization limit
WBoWell-being maximization limit
HpHealth maximization limit
TrqTransport minimization limit
WstrWaste minimization limit
WsWater minimization limit
AtAir pollution minimization limit
EnuEnergy minimization limit
EMvEnvironmental management maximization limit
Table 4. Variables.
Table 4. Variables.
Decision Variables Description
XliUnit Procurement cost
XljUnit Manufacturing cost
XlkUnit Distribution cost
XmiUnit Procurement quality
XmjUnit Manufacturing quality
XmkUnit Distribution quality
XniUnit Procurement lead time
XnjUnit Manufacturing lead time
XnkUnit Distribution lead time
XwiUnit Procurement digital maturity degree
XwjUnit Manufacturing digital maturity degree
XwkUnit Distribution digital maturity degree
YoiUnit Procurement well-being
YojUnit Manufacturing well-being
YokUnit Distribution well-being
YpiUnit Procurement health
YpjUnit Manufacturing health
YpkUnit Distribution health
YqiUnit Procurement transport
YqjUnit Manufacturing transport
YqkUnit Distribution transport
DriUnit Procurement waste
DrjUnit Manufacturing waste
DrkUnit Distribution waste
DsiUnit Procurement water
DsjUnit Manufacturing water
DskUnit Distribution water
DtiUnit Procurement air
DtjUnit Manufacturing air
DtkUnit Distribution air
DuiUnit Procurement energy
DujUnit Manufacturing energy
DukUnit Distribution energy
DviUnit Procurement environmental management
DvjUnit Manufacturing environmental management
DvkUnit Distribution environmental management
Table 5. Summary of results from conducted experiments along with savings amounts.
Semi-Finished ProductMin stock Level (Meters)Real Average StockSimulated Average Stock Level (Meters)Exceeded Stock Value kEuro
A1270,0007550,0004200,0004824.00
E170,000878,000330,0002220.00
A212,60080,00039,0001110.00
E250,000191,500108,5003170.00
Total11,324.00
Disclaimer/Publisher’s Note: The statements, opinions and data contained in all publications are solely those of the individual author(s) and contributor(s) and not of MDPI and/or the editor(s). MDPI and/or the editor(s) disclaim responsibility for any injury to people or property resulting from any ideas, methods, instructions or products referred to in the content.

