Article

A Novel Brillouin and Langevin Functions Dynamic Model for Two Conflicting Social Groups: Study of R&D Processes

by
Ekaterina V. Orlova
Department of Economics and Management, Ufa University of Science and Technology, Ufa 450076, Russia
Mathematics 2024, 12(17), 2788; https://doi.org/10.3390/math12172788
Submission received: 8 June 2024 / Revised: 22 August 2024 / Accepted: 6 September 2024 / Published: 9 September 2024
(This article belongs to the Special Issue Study on Convergence of Nonlinear Dynamical Systems)

Abstract

:
We consider a two-group social conflict under the corporates’ research and development (R&D) business processes. Conflict participants are divided into two groups depending on their attitude to new ideas, technologies, and behavioral style for R&D creative problems—innovators and adapters. We reveal the contradiction that arises between the need to include both types of employees in one project team and their objectively antagonistic positions regarding the methods and approaches to R&D processes. The proposed research methodology is based on a modern post-non-classical paradigm formed on the principles of coherence, interdisciplinarity, openness, and nonlinearity, as well as a sociophysical approach to the social conflicts modeling. We use the general theories of magnetism, paramagnetism, and functions of P. Langevin and L. Brillouin to describe the dynamics of group participants’ preferences regarding the style of conflict behavior. The analogy of paramagnetism, consisting in the orienting effect of the magnetic field, is used to describe social groups interactions that have not only their own interests, but are also influenced by the opinions of opposite social groups. A two-dimensional, four-parameter map represents the dynamics of group conflict. Modeling results show that regardless of the initial states and with certain parameters of intra-group and intergroup interactions, the trajectories eventually converge to an attractor (limit cycle) in a two-dimensional space. No non-periodic or chaotic modes are identified in the two-group conflict, which determines the controllability of the described conflict. The results of the simulation experiments are used as decision support and contradictions resolution aimed at forming the required modes of the corporates’ research and development business processes and ensuring the group participants’ cohesion and depolarization. The results of testing the model at an industrial enterprise are presented.

1. Introduction

Conflict is a constantly existing, intractable type of social relationship. It is a property of social systems, a condition for their functioning, and a source of development. The basis of the conflict is the contradiction between the goals and interests of the participants. Social conflicts are embedded in socio-economic, industrial, and political systems, and they are quite complex.
The production of innovation is becoming the most important condition for organizational development. When studying innovations’ creation, implementation, and diffusion, it is necessary to take into account structures of social systems, group norms, decision-making models, and organizational changes that appear in these social systems as a result of the innovations’ introduction. In the framework of the adaptation–innovation theory [1,2], participants in the innovation process are differentiated depending on their attitude to new ideas, technologies, and different styles of thinking about solving new creative problems. There are two behavioral (creative) types of individuals depending on their inclination to innovate—innovators and adapters. At the same time, balanced project teams (groups) including employees of both types are required for effective innovative activities of an organization. Meanwhile, the mutual perception of each other’s characteristics by group members can be characterized as follows.
Adapters are perceived by innovators as conformist, inflexible, predictable, safe, and risk averse. Innovators are perceived by adapters as impractical, irritating, and unsafe with an appetite for risk. The more diverse a group is in problem-solving styles, the more complex the relationships in the team can be. The more group members understand and appreciate the advantages of style diversity, the more effectively the group is in new projects or solving non-standard problems. A dialectical contradiction arises, consisting in the fact that, on the one hand, in order to solve complex problems, it is necessary to have project teams, which should include employees with both innovative and adaptive types, and on the other hand, the presence of such employees in one team inevitably gives rise to conflict situations due to their antagonistic positions in relation to the approaches, methods, and tools for solving problems. Therefore, the problem of conflicts modeling and management in such teams is relevant and both theoretically and practically significant.
Modern tools for the social modeling of conflict processes include two classes of models. These are descriptive models based on data-driven methods (statistical methods, extrapolation methods, machine learning methods, and big data analytics methods). In such models, the main attention is paid to the analysis and empirical generalization of large volumes of data obtained in the course of observing the development of events in society and people’s behaviors in social groups to construct analytical models [3,4,5,6]. The second group of models describes conflict dynamics, and they are aimed at studying cause-and-effect relationships and patterns of conflict development in social groups. In this case, methods based on mathematical modeling of social processes are used—simulation, game modeling, and sociophysics models [7,8,9,10]. The most effective approach is based on the use of knowledge about the system under study and is configured (adapted) taking into account the empirical data generated by it [11,12,13,14,15,16].
This paper develops an approach to the study of conflict dynamics, in which the process is analyzed not only from the point of view of changes in its states, but also the processes of the transformation of the relationships of the conflict participants in the process of their joint functioning. The conflict dynamics are investigated as a systemic process of changing various behavioral styles of its participants under various internal and external factors. A formalization of the relations’ transformation and participants’ behavioral styles is implemented on the basis of a dynamic model that allows for structuring and localizing the tasks of conflict management.
The purpose of this paper is to develop a model of interaction between two groups of subjects in the innovation (research and development, R&D) process, describing the dynamics of their conflict behavior. The research objectives are as follows:
  • To conduct a critical analysis of existing approaches and methods for modeling social conflicts.
  • To develop a sociophysical model of the conflict dynamics between two groups of participants in the R&D process. Participants in each group interact with each other within their group through mean field interactions [10,17]. We add a depolarization field similar to the magnetic field of the Brillouin model [18], under which the tendency (preference) of group participants to select a conflict resolution method (from extreme competition to close cooperation) is formed.
  • To study various types of dynamics of the simulated conflict system and the structure of its phase space.
  • To explore various scenarios based on realistic assumptions about the conflict behavior of groups.
The article is structured as follows. The second section discusses behavioral styles in conflict, presents a two-dimensional model of conflict regulation, and identifies the behavioral style of each participant by the level of attention to their interests and the interests of the opponent. The third section is devoted to a critical analysis of social conflict models. The fourth section presents a new formulation of the problem of modeling conflict interaction by a subject of two groups in the R&D process. The fifth section provides a detailed analysis of the developed model in various scenario conditions and gives recommendations for achieving equilibrium dynamics.

2. Literature Review

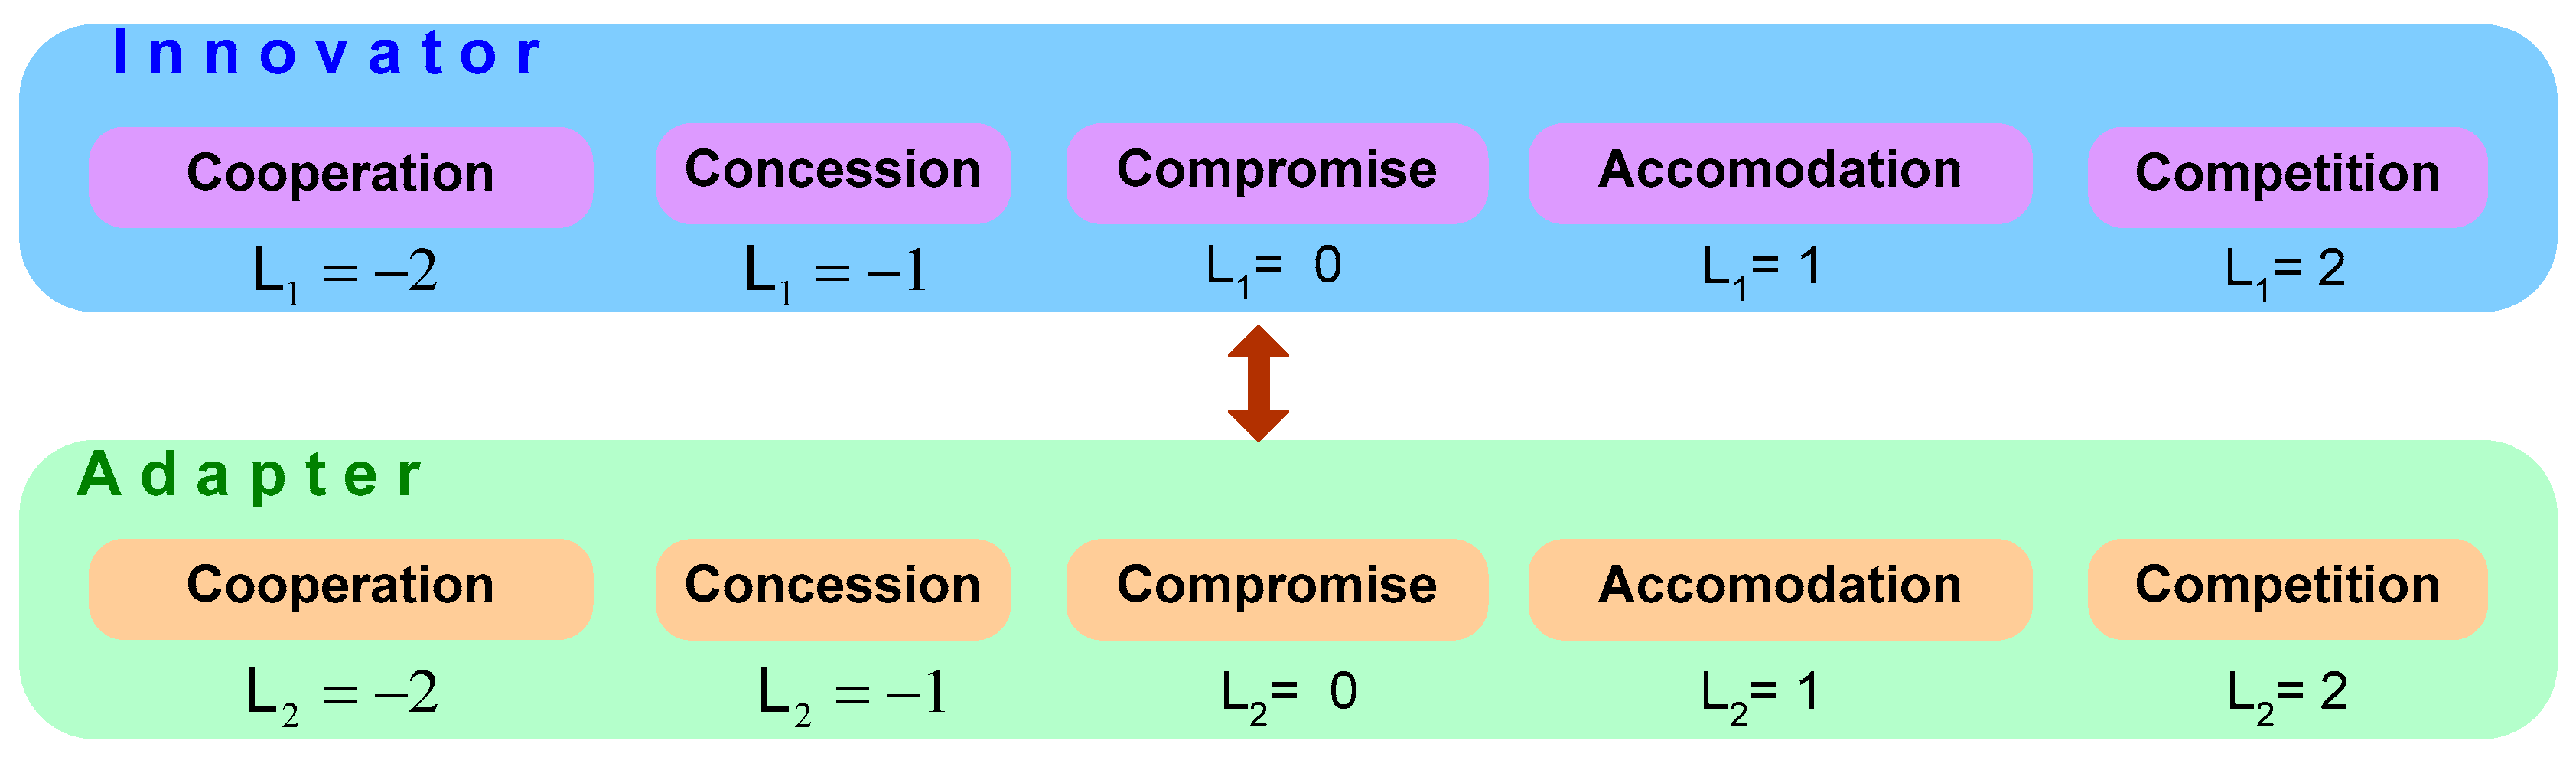
2.1. Behavioral Styles in Conflict

A complex system of social relations determines the emergence of contradictions associated with divergent goals, ideas, and views. When solving a problem having business or personal significance for different parties of social interactions, these contradictions can sharply escalate, causing a conflict. In this sense, conflict as an acute way of resolving contradictions determines the development of any system that helps to provide new ideas, values, discoveries, and organizational (economic, personal) changes. The clash of (conflicting) interests helps to create something new in various spheres and scales of manifestation. Generalized directions of development of scientific ideas in the field of conflictology are given in the specialized literature on philosophy, psychology, and sociology of conflict [19]. Tactical methods of behavior in conflict according to the Tomas–Kilman methodology and test [20] include two basic styles of human behavior in conflict (predisposition to conflict behavior)—competition and adaptation—and three derivative styles of conflict regulation—avoidance, compromise, and cooperation.
Each style of behavior is identified by the level of attention to one’s own interests and to the interests of the opponent during the conflict. Such a two-dimensional model of conflict regulation is based on the idea that the participants in the conflict interaction should not strive to avoid the conflict but competently manage it. The style of competition is determined by whether the participants in the conflict go for open confrontation. In this case, one side tries to satisfy only its interests to the detriment of the interests of the opponent. The participants are not ready to listen to the opponent and cooperate with them, but they try to put maximum pressure on the opponent. It should be noted that there are situations in which the use of this behavioral tactic is justified, for example, when protecting the interests of the organization from external pressure.
Competition is also useful in emergency situations, when one party to the conflict must quickly take the initiative in order to ensure the goals of the organization are met. The competing style of behavior can be effective in the short term. However, for long-term projects, this style is not constructive, since the losing participant will feel more disadvantaged, which can lead to a split within the team of the organization as a whole.
The opposite of the competitive style is the concessions style, which consists in adjusting one participant in the conflict to the interests of his opponent, even if they contradict his own interests. A predisposition to this behavioral style reflects an attempt to maintain relations with the opponent, even to the detriment of one’s own interests. This style is advisable to use if the subject is not worth exacerbating the relations of the participants and aggravating the conflict situation. If the subject of the conflict is important for both participants, this style becomes ineffective. Partial concession is useful in protracted conflicts, in which it is possible to make a concession to the opponent if this helps to resolve the main problem of the conflict. Here, concession is a tactical move to achieve a strategically important goal.
The accommodation style is useful as a temporary solution to the problem; it allows for establishing a temporary equilibrium. Avoidance, or evasion, as a type of behavior in a conflict situation is characterized by the fact that the interests of neither participant are satisfied; there is no desire for cooperation, as well as for satisfying one’s needs. This type of behavior has different forms of manifestation (postponement, change of topic) and is useful in situations where the subject of the conflict is not important for both participants, does not directly affect their interests, and is effective in order to gain time to make more important decisions. The weak point of this type of behavior is that when it is used, further establishment of long-term trusting relationships between the participants becomes problematic, since the accumulation of unresolved conflicts can evolve over time into a deeper, more complex conflict process in the organization.
The compromise style of behavior in a conflict is characterized by the fact that both participants are ready to make concessions, pushing aside less important goals for the sake of satisfying a more significant goal. It is applicable to simple and small-scale conflict situations. A distinction is made between passive compromise, in which the participants refuse active interaction, and active compromise, which is implemented on the basis of concluding agreements and accepting certain obligations by the parties in the conflict.
Cooperation as a type of behavior in a conflict is both the most difficult and the most effective from the standpoint of further gain for each participant. Using this type of behavior, participants do not avoid or adapt to each other; they search for a solution that satisfies the interests of the parties without any concessions. It is a universal style with an open dialogue of participants, however, in situations in which it is impossible to find a solution that is optimal for all participants due to concessions of some in the interests of others.

2.2. Models for Describing Social Conflicts

The modeling of social processes and the dynamics of social development is implemented in the following conventional directions: (1) models of historical (socio-economic) processes, in which the competing dynamics of alternative types of social activity are modeled; here, the structure of society, the share of a certain social category, and its change over time are modeled; (2) models describing the behavioral states of members of social groups that interact with other groups, and their behavior is determined by cohesion within the group and the degree of depolarization of groups.
A quantitative description of historical processes and social dynamics was carried out within the framework of a research program [21]. In the framework of this program, a mathematical description of multi-temporal social dynamics of historical processes was proposed [22]. The use of mathematical and computer models as a tool for studying the mechanisms that shape the dynamics of society seems to be a promising means of explaining social processes and forecasting them for designing future social development. In the context of competitive interactions of alternatives in social dynamics, one can consider the sociological theory of generations, which describes generational archetypes and behavior patterns that repeat in a series of generations [23]. Some fundamental foundations of the mechanism of the evolution of ethnic groups are revealed by the theory of ethnogenesis [24], which identifies passionaries—active, energetic people who are ready to sacrifice even their lives for the sake of implementing their plans, ideas, and projects. In society, there are also subpassionaries, for whom, on the contrary, the personal is more important than the public; if possible, they lead a parasitic lifestyle. The middle position is occupied by people who harmoniously combine personal and public interests (harmonics). People with different socio-psychological characteristics are in demand for different tasks of economic development. This is confirmed by the theory of innovation [25], which substantiates that about ten percent are interested in the development and promotion of new technologies, and it is their strategy that is close to the passionary mode of action. The remaining ninety percent are ready to invest efforts in ensuring stability, preserved relationships, and refusing the new. Their mode of action is similar to harmonics and subpassionaries.
The modeling of conflict behavior in economic and social systems is implemented on the basis of game-theoretic tools. Let us note only some of the large number of applications of game theory for studying various types of conflicts.
In economic systems, the phenomenon of competition in various markets is described—auctions, price competition markets—within the framework of which the problems of effective organization and regulation of markets are considered [26]. The modeling of the evolution of behavior in biological and social systems is considered in the Lotka–Volterra models [27], which is a paradigm for describing competition in population dynamics based on the interaction of two species of the predator–prey type. The issues of the endogenous formation of target functions of individuals and the cooperative behavior in recurring conflict situations of interaction between the parties are considered.
Voting models [28], describing the strategic behavior of voting participants, consider the problems of the manipulability of voting rules, achieving equilibrium. Models of political competition describe the coalitions. Corruption models [29] study possible ways to prevent corruption and form an optimal corruption control strategy based on control mechanisms. Conflict-managed processes in the field of environmental protection and the use of non-renewable resources are considered in Ref. [30] and described by differential games.
In a number of studies of the nonlinear dynamics of systems of different types (physical, chemical, biological, economic), it was established that the dynamic chaos regime is a typical phenomenon. Chaotic properties appear in a wide variety of systems, and if chaos is not detected, then the reasons for this can be either the existence of chaos in a small parametric space or outside the permissible parameter values. Recently, a direction in nonlinear dynamics associated with the study of the problems of predictability of the behavior of chaotic systems, control of their dynamics, and stabilization of chaos has been intensively developing. We are talking about the possibilities, through small impacts, to significantly influence the dynamics of chaotic systems, stabilize their behavior, and transfer their trajectories from the chaotic regime to the required periodic operating mode. Research in the field of chaos management as applied to the analysis of the dynamics of economic systems and conflicts was carried out, for example, in [31,32,33,34,35].
Social conflicts have been the focus of research for several decades. Groups in conflict differ in their interests, identity, values, and beliefs. With a relatively long duration of conflict, exceeding the lifespan of a generation, these conflicts are considered intractable and refractory [36]. Intractable conflicts are protracted, difficult to resolve, difficult to manage, and may lead to episodes of violence [37]. Depending on the context and scale of the conflict, as well as the potential negative consequences, the tools for managing such conflicts include diplomacy, mediation, propaganda, legal procedures, and attempts to establish a peaceful dialogue between the parties. A useful set of tools for developing management strategies and management decisions in complex and intractable situations are proposed in [38,39,40,41,42], which is based on sociophysical models. Modeling various aspects of protracted conflicts based on sociodynamics and sociophysics is presented in [8,9,10,43,44,45].
Understanding the methods of conflict resolution can provide insight into how conflict actors react to each other. In [39], the idea was proposed that different types of conflicts between two actors can be viewed in terms of cooperation or competition between them in achieving their goals. A new look at this idea was provided in the works of [46,47,48,49]; these ideas were developed using the theory and methods of dynamic systems. Attractors are defined as stable states that such interactions lead to.
In the theory of escalation and de-escalation of conflict [50,51], the functions of actors’ response to the actions of the opposite party are used. The functions change as the conflict develops through its stages—escalation, de-escalation—and describe how the aggression of one actor depends on the level of aggression of another, explained by social and psychological characteristics, as well as the previous dynamics of the conflict development.
In Refs. [9,52], the emotional (behavioral) state of two authors is modeled, which depends on the feedback (positive or negative) from another actor and the strength of the actors’ resistance to changing their state, as well as the level of actors’ resistance to changes in the absence of influence from the other actor. The dynamics of interaction between actors is described, which depends on their influence on each other based on the construction of systems of differential equations.

2.3. Types of Social Conflict Participants in R&D Business Processes

In [1,2], an adaptation-innovation theory is proposed, which differentiates participants in the innovation process depending on their attitude to new ideas and technologies and explains the differences in the thinking style of various individuals when they solve new creative problems. Two behavioral (creative) styles of individuals are distinguished depending on their propensity for innovation—innovators and adapters.
Based on empirical studies of the creative styles of employees of the organization according to the M. Kirton scale (Kirton Adaption-Innovation Inventory, KAI) (only pairwise comparisons of employees based on their survey are used; the scale reflects the degree of expression of characteristics to which the categories of “better” or “worse” are not applicable), he found that the average values of the style indicator on this KAI scale statistically significantly differ between men and women, as well as between professional groups. The value of such differentiation of behavioral styles depending on the complexity and type of tasks being solved is that such differentiation allows for the formation of balanced project teams (groups) taking into account the following features of behavioral styles:
  • For solving operational tasks, employees with an adaptive behavioral style are more useful, since they ensure the stability of the organization; for solving strategic tasks—employees with an innovative style, ensuring a breakthrough development style;
  • For solving routine problems and tasks, employees with an adaptive style are more effective; for solving problems in crisis situations—with an innovative style;
  • Employees with an adaptive style offer acceptable and relevant solutions to problems, employees with an innovative style offer many ideas that are not obvious and not always directly acceptable for solving the problem;
  • Employees with an adaptive style prefer to include new data in the existing structure (context) of the problem, and employees with an innovative style use new data to change the existing structure (paradigm).
The mutual perception of each other’s characteristics by group members can be characterized as follows. Adaptors are perceived by innovators as conformist, inflexible, predictable, safe, and risk-averse. Innovators are perceived by adaptors as impractical, irritating, dangerous, and risk-averse. The more diverse a group is in problem-solving styles, the more complex the relationships within the team can be. The more group members understand and appreciate the benefits of style diversity, the more effectively the group works on new projects or solves non-standard problems. If an employee with a relatively more adaptive style joins a team with a more innovative style, he or she can “copy” the behavior of the majority, but it is difficult for him or her to change his or her creative thinking style within a short period of time. Therefore, being in the same team with such antagonistic styles can lead to psychological discomfort, conflict situations, and, as a result, a decrease in work efficiency. At the same time, employees with both creative styles are necessary for the effective functioning of an organization. The smaller the range of creative (behavioral) styles among the organization’s employees, the more limited the list of problems that need to be solved. At the same time, the wider the range of creative styles, the more problems arise in the interaction of project team members, and more efforts are required from managers to resolve them. The diversity of problems, on the one hand, requires the formation of a multidisciplinary project team, and on the other hand, increases the complexity of team management, as it increases the likelihood of conflicts in the team.
The more diverse the group is in creative problem-solving styles, the more complex the relationships in the team can be. The more the group members understand and appreciate the advantages of the diversity of styles, the more effective the management of emerging conflict situations, and the more effectively the project team works to solve both routine and non-standard problems.
Figure 1 schematically shows the types of conflict participants and their behavioral styles that are used.
Thus, we highlight the dialectical contradiction: on the one hand, to solve complex problems, it is necessary to have project teams that should include employees with both innovative and adaptive types, and on the other hand, the presence of such employees in one team inevitably gives rise to conflict situations due to the antagonistic positions regarding to approaches, methods, and tools for solving problems.

3. Research Methodology

3.1. Sociophysical Approach to Resolving Contradictions: Principles and Methods

The proposed research methodology is based on the post-non-classical paradigm of describing the scientific world picture, the main principles of which are as follows:
  • Openness: the social system is open since it exchanges matter, energy, and information with the external environment;
  • Nonlinearity: the presence of a spectrum of different development options, and such multivariance is combined with the probabilistic and rhythmic (wave) nature of the social processes and systems. Different phases of system development are distinguished: (1) the linear phase as a unidirectional change that reveals a clear pattern, and it can be accurately calculated and on this basis a forecast for the future can be made; (2) the nonlinear phase represents critical states characterized by the possibility of only a probabilistic forecast of a set of future possible states;
  • Coherence as self-consistency of complex social processes and systems;
  • Interdisciplinarity: social processes are considered on the basis of different scientific disciplines. Self-organization theory identifies a single algorithm for transition from less complex and disordered states to more complex and ordered ones. The theoretical basis is the theory of coordinated processes by G. Haken and nonequilibrium thermodynamics by I. Prigogine. Self-organization in the theory of nonlinear dynamic systems is identified with the ability of systems to behave in a diverse, complex, and adequate manner to external influences, which are interpreted as a jump (bifurcation) of the system from one state to another; evolutionism. Evolution in global evolutionism differs from the similar concept of change and development, and it is associated with the emergence of new parameters or systems. Development is associated with the emergence of new features in the system.
The methodology is based on the sociophysical approach to the study of social conflicts and their modeling; it uses the critical-dialectical method of analyzing the contradictions of social groups as a source of change. It is the historical method of studying social phenomena in time and determining the connection between the past, present, and future; the method of systemic analysis of conflict as a complex self-developing process in time; and the method of systemic synthesis of resolving social contradictions in the process of developing and implementing innovations in an organization.
A feature of the proposed approach to the study of the dynamics of conflict is that the process is analyzed not only from the point of view of changing its states, but also from the processes of transforming the relationships of the participants in the conflict in the process of their joint functioning. The dynamics of the conflict are studied as a systemic process of changing various styles of behavior of its participants under the pressure of various internal and external factors. It is proposed to implement the formalization of the processes of transformation of relations and behavioral styles of participants on the basis of a dynamic model that allows for structuring and localizing the tasks of conflict management. In this formulation, conflict management in an organization is reduced to managing the relationships of the conflicting parties.

3.2. Elements of the Theory of Paramagnetism, Langevin, and Brillouin Functions

We use the general theory of magnetism and the theory of paramagnetism by P. Langevin and L. Brillouin [53,54,55,56,57,58] to assess magnetization, associating it with the degree of inclination (preference) and the involvement of participants of a certain group and choose some method of conflict resolution (from extreme competition to close cooperation). The choice of the theory of paramagnetism as an analogue for describing the conflict interaction of two groups is due to the following circumstances. It is known that any substance placed in a magnetic field of strength H acquires a certain magnetic moment M, or becomes magnetized. The magnetic field strength inside a magnet B consists of the strength of the external, magnetizing field and the strength created by the atoms (molecules) of the magnetized substance. The resulting intensity is the induction B = μ 0 H + μ 0 M , where M is the magnetic moment of the substance (magnetization) placed in a magnetic field of intensity H, =4π × 10−7 H/m is the magnetic permeability of vacuum.
The theory of magnetism considers the influence of an external magnetic field and internal interactions between individual atomic carriers of magnetism in a substance on its magnetic properties. The action of an external magnetic field on the magnetic moments of atomic carriers generates two effects—diamagnetic and paramagnetic effects.
The diamagnetic effect is formed due to the inductive action of an external magnetic field on molecular currents. Due to the Larmor precession of electron orbits in the field, an additional magnetic moment arises in each atom, directed against the external field that creates it, which determines the negative sign of the diamagnetic susceptibility. Diamagnetism is inherent in all atoms, ions, and molecules, as well as their collectives—bodies (liquids and crystals). Therefore, all bodies are diamagnetic, and their diamagnetism is often masked, overlapping with a stronger positive paramagnetic effect caused by the influence of the external magnetic field and internal interactions. Such an effect can arise in cases where members of social groups who are active make decisions based on their own goals and attitudes, and are able to defend their own position based on the cohesion of participants within the groups. In cases where the atomic formations from which a given substance is built have their own resulting magnetic moments (spin, orbital, or both), these moments experience the orienting effect of the external magnetic field, due to which additional magnetization is created in the body, directed along the external field. This is the reason for the appearance of positive paramagnetic susceptibility (in cases where this effect exceeds the negative diamagnetic effect). This effect occurs in active social systems and groups, whose members have their own activity and purposefulness but are at the same time subject to the influence and opinion of another group, and the strength of such commitment is less than the strength of intra-group solidarity and cohesion.
The diamagnetic effect is associated with internal motions of electrons in the shell. Diamagnetic susceptibility does not depend on temperature, since the effect of thermal motion and collisions between atoms, as long as it does not deform the orbits very strongly (i.e., the electron shell is not excited), will be very insignificant. On the contrary, the orientation of atomic magnetic moments in a paramagnet (establishment of atomic magnetic order along the external magnetizing field) will be destroyed by chaotic thermal motion, which will manifest itself in the dependence of paramagnetic susceptibility on temperature. It is the presence of internal interactions between carriers of magnetic order that lead to various effects and different behaviors of matter depending on external conditions (magnetic field, temperature, pressure), as well as on the structure of the matter itself. For example, ferromagnets significantly enhance the effect of an external magnetic field, and the dependence of the magnetization of a ferromagnet on the strength of the applied external magnetic field has the form of a loop. Analogues of the hysteresis loop (processes of magnetization (demagnetization) of substances taking into account the lag or delay associated with the history of the sample of the substance) are well known and are used in the description of social systems.
For example, the level of expended educational (propaganda) work (tension) can be correlated with the level of involvement in a new idea (magnetization) of a subject who is the bearer of public opinion, a certain social group, a team of an enterprise. Some lag is found, which is associated with the fact that persuasion (including with the supposed destructive consequences) is not always successful. Such persuasion depends on moral values, education, culture, and ethical norms dominating in the social group. A new stage of public opinion formation can be correlated with the history of subjects, their experience. It is found that the “reference point” of the time of formation of a new opinion shifts relative to the previous one, which is a characteristic of the system itself and its current state. In game theory, hysteresis is manifested in the fact that small differences in one or more parameters of interacting social systems lead these systems to opposite statistical equilibria. Despite small initial differences, systems require enormous efforts to move from one equilibrium state to another. The economic causes of hysteresis, or long-term inflexibility, are ambiguous. The reasons may be incomplete knowledge of the evolution of the system, the existence of several equilibrium states in the system, or the influence of institutional factors.
Therefore, it is necessary to take into account not only the coexistence of two main magnetic phenomena arising under the influence of an external magnetic field—diamagnetism and paramagnetism—but also to keep in mind the disorienting effect of thermal motion. In the case of systems in which the interaction between atomic carriers of magnetism can be neglected, the problem is reduced to calculating the two specified competing effects at different values of the external magnetic field and temperature.
As a social temperature, one can take the variability in the individual preferences of participants in social groups. Low values of social temperature are characteristic of established situations, while in conditions of rapid and frequent changes in the preferences of social groups, high levels of social temperature can be recorded. Examples of conflicts with a low social temperature are conflicts in which the opponents do not change under the influence of external influences. On the contrary, in a conflict with a high social temperature, the conflicting groups are in constant change, including under the influence of another group. Thus, the used analogy of paramagnetism, consisting in the orienting action of a magnetic field, can be used to describe social interactions of groups that not only have their own interests, but are also subject to the influence of opinions and attitudes from another social group. The task is to model the involvement of participants in the conflict interaction of innovators and adapters in the form of a change in their behavioral styles (see Section 2), taking into account their own attitudes and target guidelines, as well as the effect on each of these groups of opinions and behavior of participants in the opposite group.
The theoretical basis for paramagnetism was provided by the P. Langevin, and the magnetic saturation at low temperatures was determined. The ideas of Langevin’s theory are as follows. At zero temperature, the magnetic moment of an atom μ under the influence of an external magnetic field tends to orient itself in the direction of this field. In the absence of opposing forces (or at a temperature of absolute zero), the measurement of the magnetic moment of a sample with N carriers has the form μ S = N μ , where N is the number of carriers of the magnetic moment, and μ S is the magnetic moment of the sample.
At a temperature different from zero, thermal motion tends to counteract the orienting action of the magnetic field, and a dynamic equilibrium is established between the two opposing forces, determined by the Boltzmann law, according to which for the actual magnetic moment (magnetization) μ ¯ we obtain μ ¯ = μ S L α , where L is the Langevin function: L α = c t h z 1 α , α = μ S H R T is the ratio of the energy of the magnetic moment in an external magnetic field to the thermal energy, and R is the Rietberg constant for an ideal gas.
A. Brillouin continued P. Langevin’s theory of paramagnetism, introducing spatial quantization, and obtained the formula for magnetization: μ ¯ = μ S B J α , where B J α is the Brillouin function. The Brillouin function depends on the quantum number J (characterizing the state of an object) and is expressed as follows: B J α = J + 1 2 J c t h J + 1 2 J α 1 2 J c t h α 2 J . The Brillouin function is usually applied in the context where α is a real variable and J is a positive integer or half-integer value.
There is a set of non-interacting magnetic moments taking all possible orientations in space according to the Boltzmann distribution. The orientation of the spin along the magnetic field is proportional to the Boltzmann factor. In the quantum interpretation of paramagnetism, due to spatial quantization, they can take only some discrete directions. For the component of the magnetic moment of matter M along the magnetic field, we have [56,57]: M = g μ B J z , where J z takes the values: J, J − 1, −J. The average magnetization in an external magnetic field B will be equal to
M = N g μ B J z = J J J z exp g μ B k B T B J z J z = J J exp g μ B k B T B J z = N g μ B J J + 1 2 J c t h J + 1 2 J α 1 2 J c t h α 2 J = N g μ B J B J α ,  
where α = g μ B k B T B J is a dimensionless quantity; B J α is the Brillouin function; g is a quantity called the spectroscopic splitting factor (g-factor), and for a free electron g = 2.0023; μ B is the Bohr magnetron, μ B = 9.274 × 10⁻²⁴ J/T; B is the magnetic field strength inside the magnet, consisting of the strength of the external, magnetizing field and the strength created by the atoms (molecules) of the magnetized substance; k B is the Boltzmann constant, k B = 1.38 × 10⁻²³ J/K; T is the temperature of the sample. The magnetization of paramagnetic substances changes in accordance with the Brillouin function, which changes from 0 in the absence of a field to 1 in an infinitely large field.

3.3. Statemant of the Problem

A conflict between two groups is considered. The first group represents innovators in the broad sense, and the second group represents adapters (performers, implementers) of already created innovations. The essence of the conflict lies in the resolution of divergent interests of the participants of the two groups. Behavioral reactions of participants of two conflict groups are modeled. Each group of participants has its own individual attitude S to the methods of conflict resolution or tactics of behavior in a conflict. This discrete variable can change for the participants of the first group from L 1 , which characterizes the behavioral style of interaction associated with cooperation, openness to negotiations, to L 1 , which characterizes the strategy of competition, a commitment to prolonging the conflict. Similarly, for the participants of the second group, preferences for the method of conflict resolution vary from L 2 to L 2 . The value S = 0 demonstrates the average commitment of group members to find a solution (compromise) to the conflict. This attitude S to the choice of the method of conflict resolution is what we call involvement in the conflict, or predisposition to conflict behavior; see Figure 1.
Participants interact with each other in time both within their group and with participants of other groups. Each participant within their group strives to convince others to accept their point of view and is also subject to similar efforts of other participants. The intensity of such intra-group interactions will be denoted by j 1 and j 2 . Participants of a group are influenced by the positions of participants of another group. The intensity of intergroup interactions of participants of the first group on participants of the second group and vice versa is denoted by k 12 and k 21 .
The intra-group and intergroup interactions of innovators and adapters are schematically shown in Figure 2.
In the process of interaction, participants take into account the opinions of participants in the opposite group; the average value of the involvement of participants at time t is equal to S 1 and S 2 . The values S , S 1 , and S 2 differ in that S reflects the average preference for the method of conflict resolution in the absence of intra-group and intergroup interactions. The appearance of interactions of participants within and between groups changes the average preference of groups.
In any group, the positions of individuals are also influenced by the average preferences of other groups. For a member of group n, the individual intra-group intensity of defending his position is equal to S j n S n . When interacting with members of another group, when participants consider the position of the opposite group, their intergroup interaction intensity is proportional to their own average preference without interactions S , the average preference of members of the opposite group, and the intergroup interaction intensity of the groups. Thus, for members of the first group, the interaction intensities are equal to S k 12 S 2 , and for members of the second group, — S k 21 S 1 .
The values of intra-group social interactions S j n S n are analogous to the intrinsic magnetic moment of substances, which are conceptualized as “negative susceptibility”, or the energy of “protection” of the group position of the participants in the conflict. The values of the intergroup intensity of the participants in the social conflict S k 12 S 2 and S k 21 S 1 are analogous to the external magnetic field affecting substances. Intergroup intensity is conceptualized as “positive receptivity”.
Let us study the resulting force of interaction between groups under the influence of intergroup and intra-group communications for the first group (innovators) as S j 1 S 1 + S k 12 S 2 , and for the second group (adapters) as S j 2 S 2 + S k 21 S 1 . The components of these relationships have opposite signs in direction, so let us consider the case of S j 1 S 1 = S k 12 S 2 . This corresponds to the situation in which the force of protecting the group position for innovators (group 1) is equal to the impact of the position of the group of adapters (group 2). Then, the average preference of group 1 participants when exposed to the influence of group 2 participants is directly proportional to the average preference of group 2 participants, increased by the intergroup intensity (force of impact) and inversely proportional to the intensity of protecting their own position, which is S 1 = k 12 S 2 j 1 . That is, group 1 participants adapt to the interests of group 2 participants. The higher the force of their intra-group cohesion and unity, the less effective such external influence. This is similar for group 2 participants when exposed to the influence of group 1 participant. However, the values (conviction, focus on results, professionalism) of the participants can be both more stable and less stable. Therefore, the study of the dynamics of preferences in the context of intra- and intergroup communications and different initial positions (opinions of group participants) regarding the method of conflict resolution should take these features into account.
Similarly to the average magnetization of a substance in an external magnetic field (see Section 3.2), we write out the values of average preferences S 1 and S 2 for the first and second conflict groups, taking the resulting interaction of groups under the influence of intergroup and intra-group communications for the first group as S j 1 S 1 + S k 12 S 2 , and for the second group as S j 2 S 2 + S k 21 S 1 .
A dynamic model of the evolution of involvement in the conflict (the dynamics of preferences regarding the style of conflict behavior) is formed taking into account the assumption that the intensity of interaction includes the product of the preference at the current moment of time by the preference at an earlier moment of time, i.e., a delay is introduced. The average preferences of group participants S 1 t + 1 and S 2 t + 1 at a moment of time t + 1 are proportional to the exponential intensities of interactions of participants within groups and between groups:
S 1 t + 1 = S = L 1 L 1 S exp S j 1 S 1 t + k 12 S 2 t S = L 1 L 1 exp S j 1 S 1 t + k 12 S 2 t ,   S 2 t + 1 = S = L 2 L 2 S exp S j 2 S 2 t + k 21 S 1 t S = L 2 L 2 exp S j 2 S 2 t + k 21 S 1 t .
In model (1), S takes values from L 1 to L 1 with a step of 1—for the first group—and from L 2 to L 2 with a step of 1—for the second group. The model also takes into account that the states S 1 t and S 2 t of the participants of groups, and at time t, it is reflected in the states of S 1 t + 1 and S 2 t + 1 with a certain delay, which is associated with the comprehension (reflection) of information by the participants of group interactions.
Let us rewrite Formula (2) taking into account equality (1) using the Brillouin function:
S 1 t + 1 = L 1 B L 1 z 1 = L 1 L 1 + 1 2 L 1 c t h L 1 + 1 2 L 1 z 1 1 2 L 1 c t h z 1 2 L 1 ,   S 2 t + 1 = L 2 B L 2 z 2 = L 2 L 2 + 1 2 L 2 c t h L 2 + 1 2 L 2 z 2 1 2 L 2 c t h z 2 2 L 2 ,  
where
z 1 = j 1 S 1 t + k 12 S 2 t ,   z 2 = j 2 S 2 t + k 21 S 1 t ,  
Putting expressions (3) into Equation (2), we obtain
S 1 t + 1 = L 1 L 1 + 1 2 L 1 c t h L 1 + 1 2 L 1 j 1 S 1 t + k 12 S 2 t 1 2 L 1 c t h 1 2 L 1 j 1 S 1 t + k 12 S 2 t S 2 t + 1 = L 2 L 2 + 1 2 L 2 c t h L 2 + 1 2 L 2 j 2 S 2 t + k 21 S 1 t 1 2 L 2 c t h 1 2 L 2 j 2 S 2 t + k 21 S 1 t .
The system of Equation (5) determines the dynamics of average group preferences for the method of conflict resolution, taking into account intergroup and intra-group interactions of participants, as well as previous preferences of both the group itself and its opponent, in the form of a four-parameter mapping with parameters j 1 , j 2 , k 12 , and k 21 .
The result of solving the system of Equation (5) is finding the values of its parameters that ensure the convergence of the positions of the conflict participants. In this case, the equality of the positions of the group participants can be both in the area of conflict resolution, that is, the choice of strategies close to cooperation, and the insolvability of this conflict, characterized by competitive strategies of the group participants. For the positions of cooperation, negative values of behavioral styles are a characteristic, as well as its zero value, reflecting a compromise strategy, while the positions of competition are characterized by positive values of behavioral styles. Therefore, in order to favorably resolve the conflict, it is necessary to find such a ratio of the model parameters that will ensure the convergence of the trajectory of the system under study in the area of negative and zero values.

4. Empirical Results and Discussion

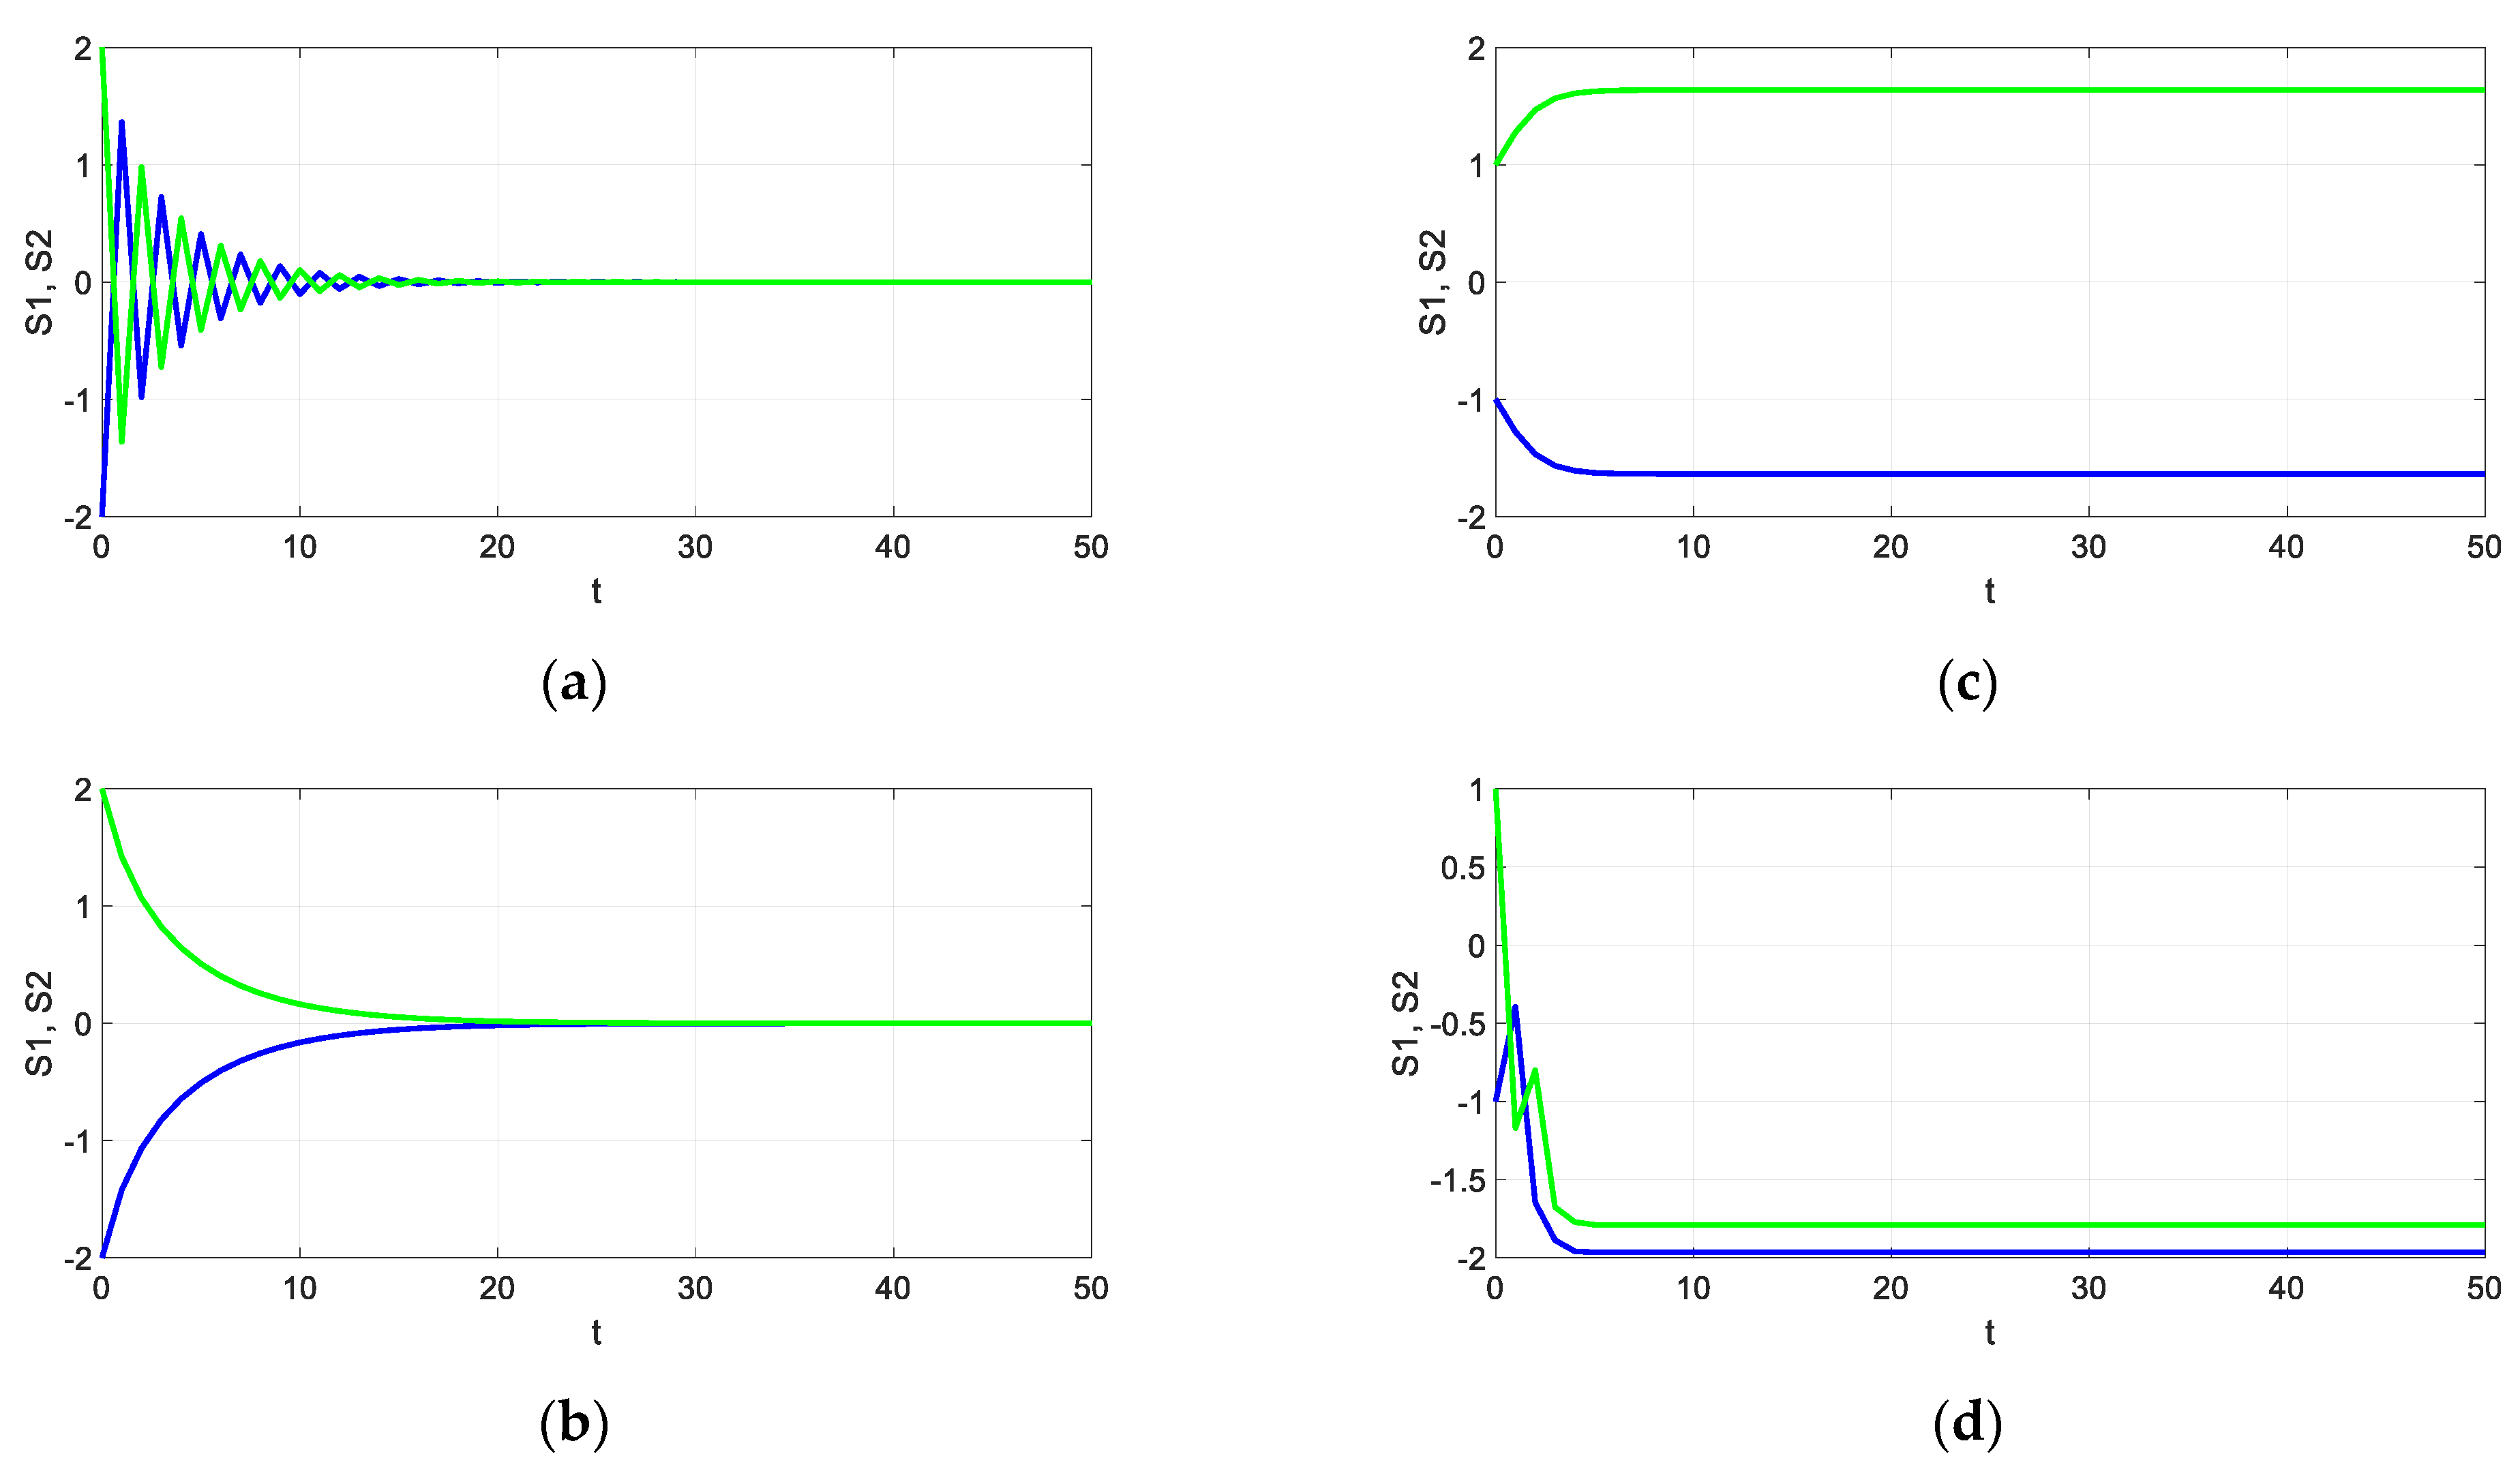
4.1. Modeling and Situational Analysis

We conducted a series of simulation experiments with model (5). The first group consisted of members reflecting pro-innovation views (innovators), and the second group consisted of members with an anti-innovation position (adapters). We used the possible behavioral styles of conflict resolution corresponding to the states of each group participant, which is equal to five, in accordance with the tactical methods of behavior in the Thomas–Kilmann conflict (Figure 1); therefore, L 1 = L 2 = 2 . The system dynamics is considered in the parameter space and can have disordered and ordered phases. The study of the conflict interaction of groups was carried out for the following situations:
  • The groups are not connected to each other; k 12 = k 21 = 0 .
  • Intergroup interactions have different signs for the two groups; k 12 k 21 < 0 .
  • There are no connections between group participants or they are low; j 1 = j 2 = 0 .
  • Connections within and between groups are different from zero.
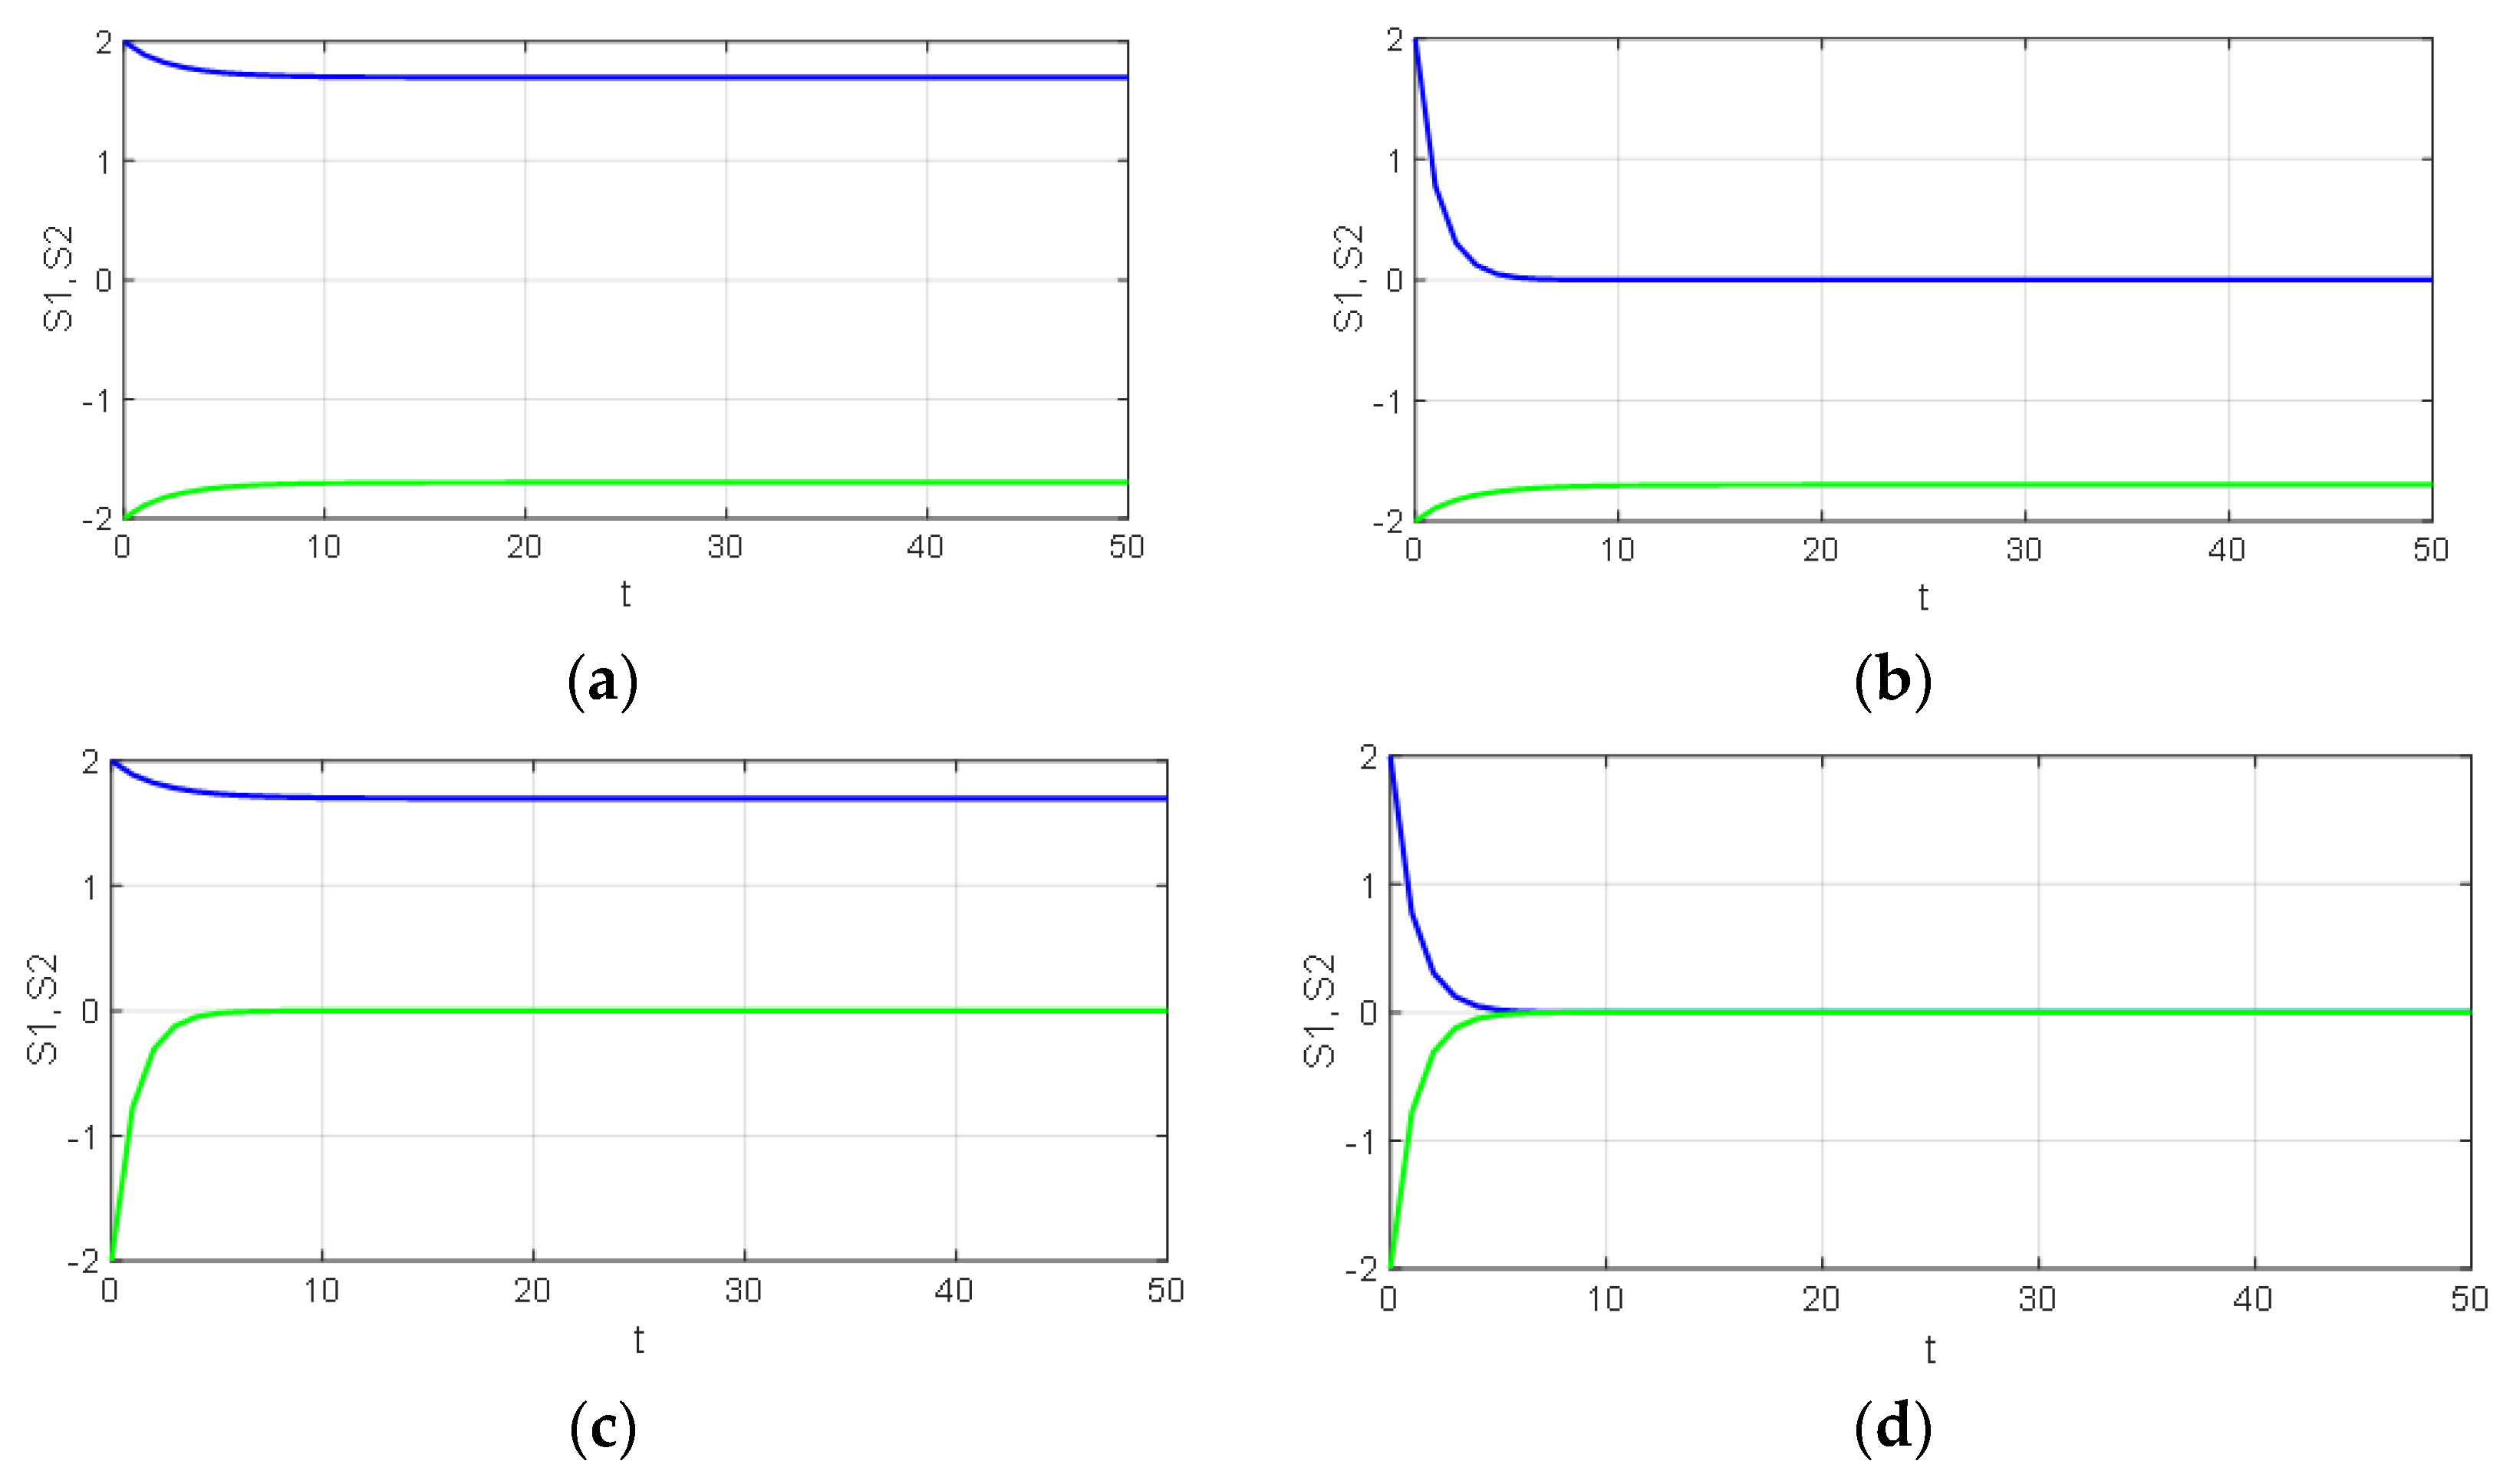
  • Situation 1. k 12 = k 21 = 0 ; there are no intergroup communications, that is, the networks of innovators and adapters are not connected.
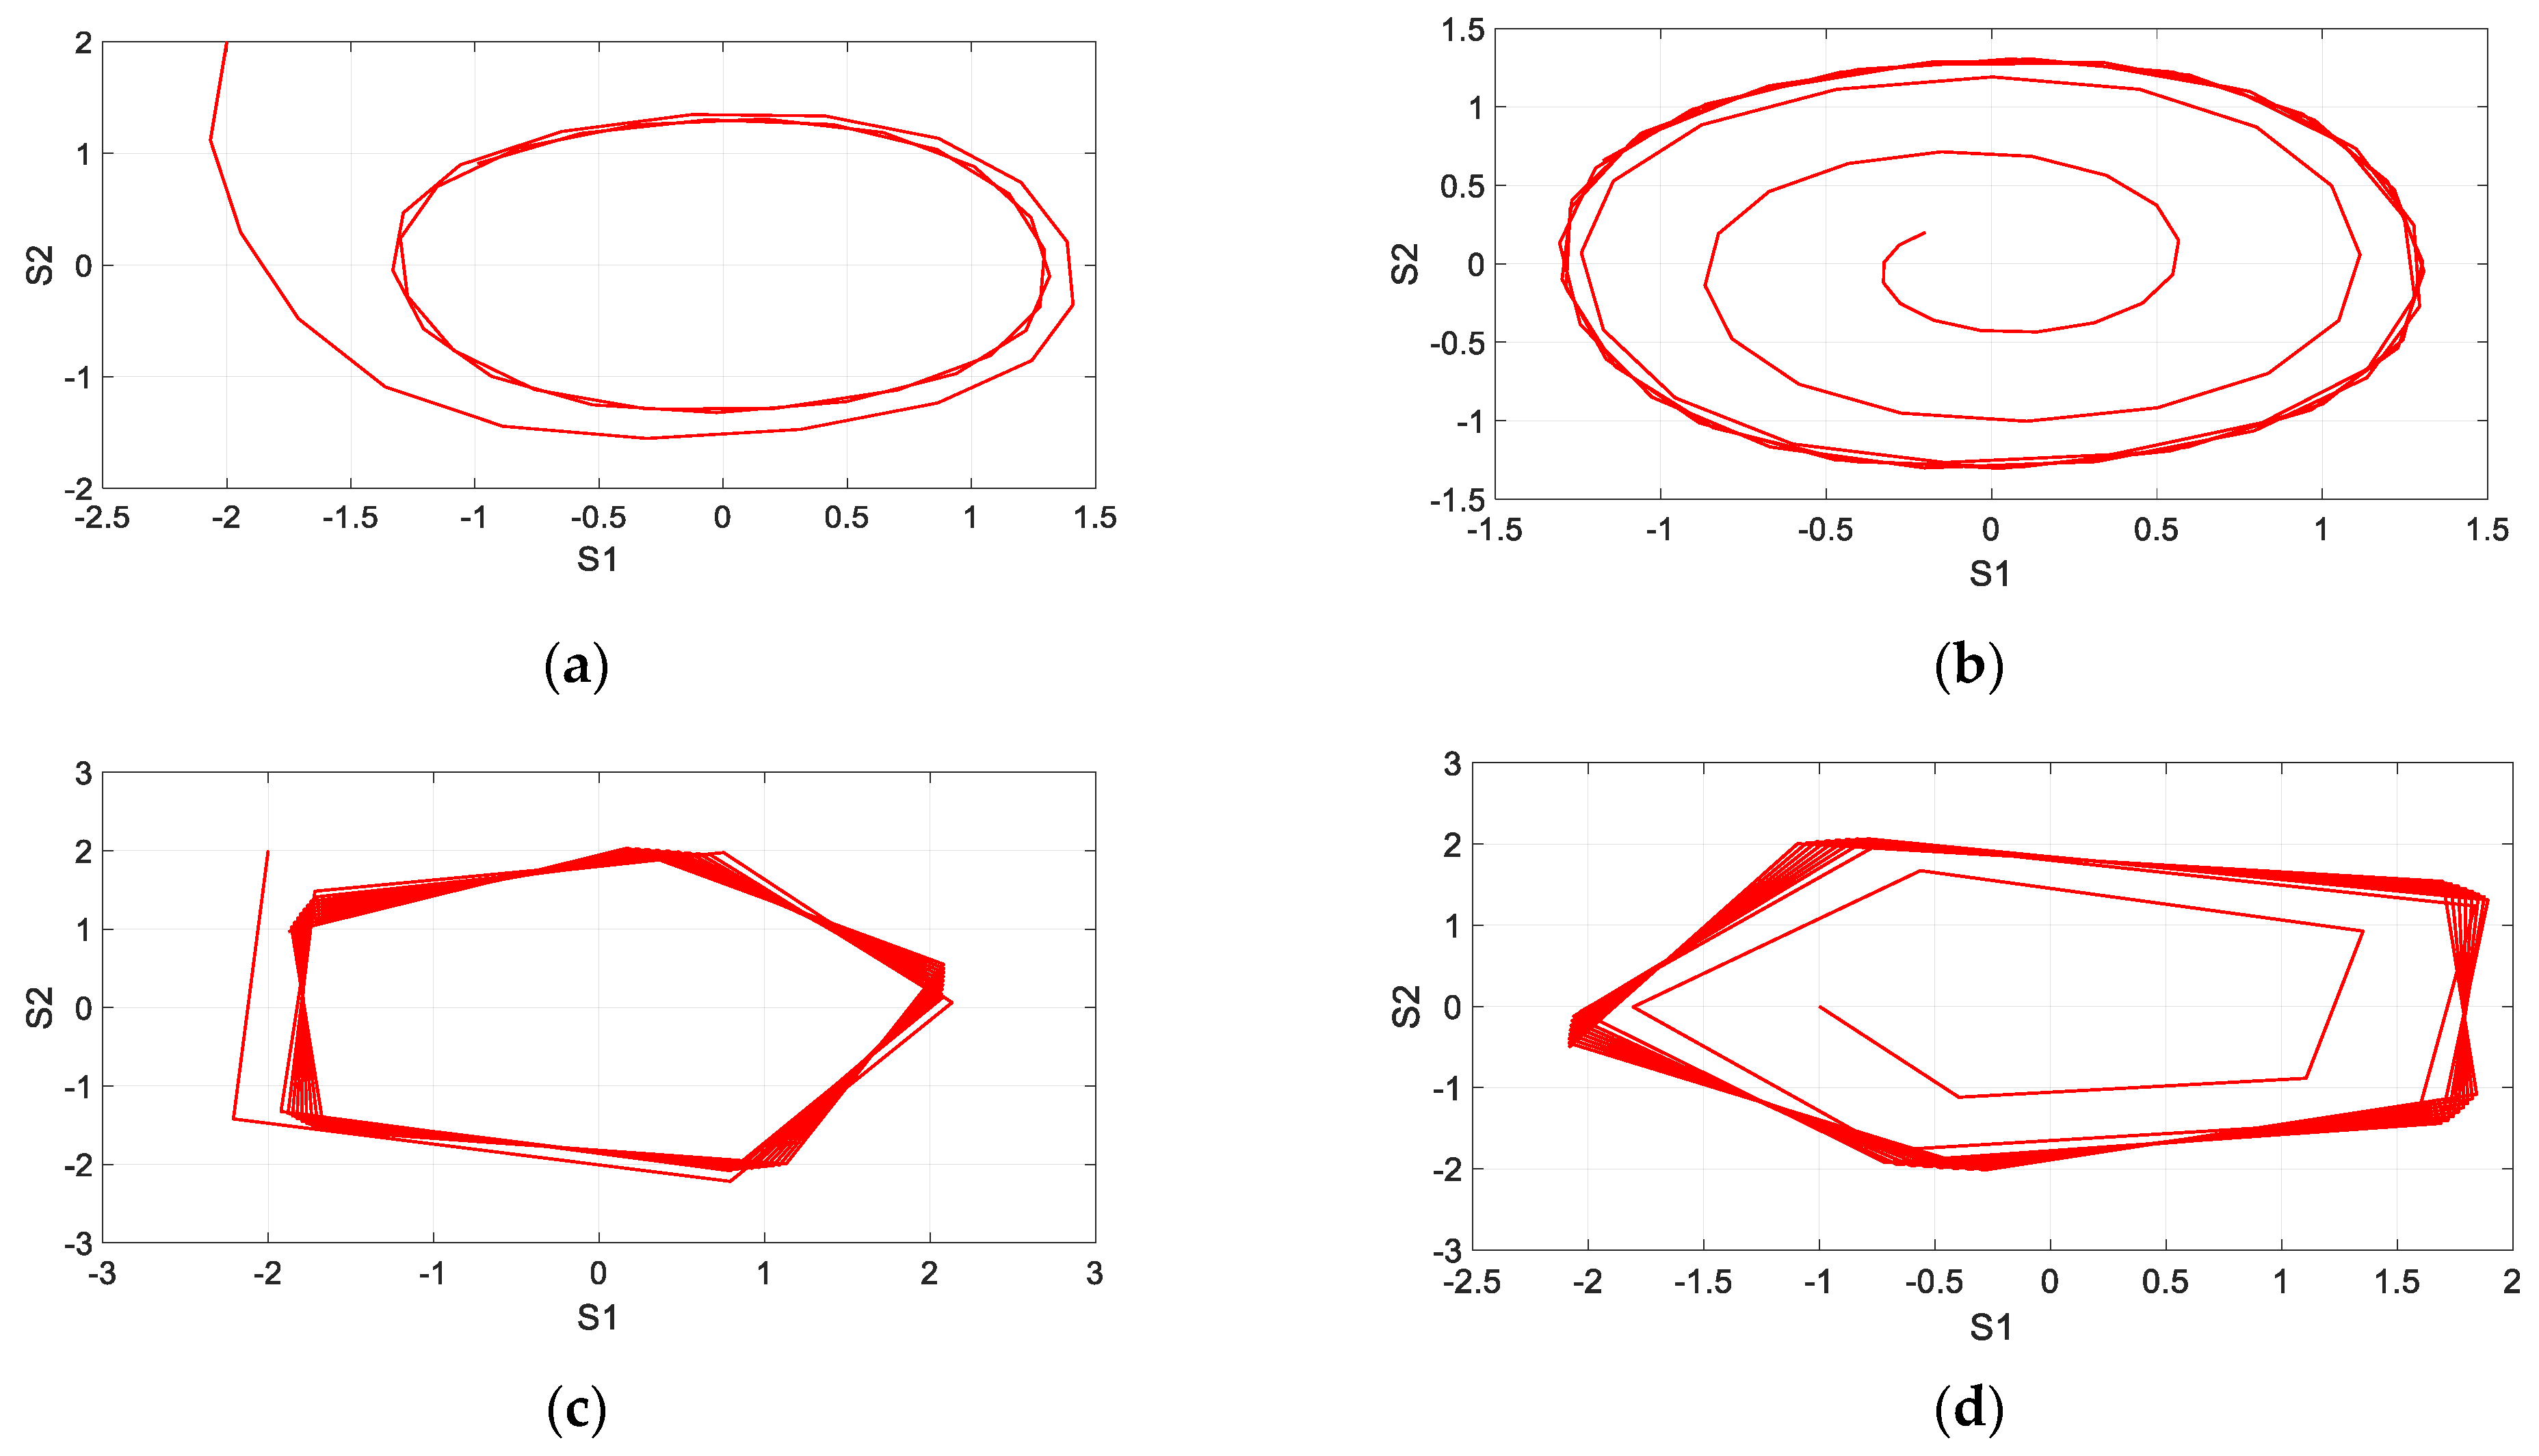
Figure 3a–d shows the interactions of participants in groups of innovators and adapters with different intra-group connections—with both strong intra-group connections (Figure 3a); weak intra-group connections not exceeding the critical value of 0.25 (Figure 3d); and interactions with one strong intra-group connection (above the critical value of 0.25) and one weak one (Figure 3b,c). The critical value of intergroup connections of 0.25 indicates that in order for the positions of the groups to converge, it is necessary that both intergroup connections be below the value of 0.25. This is established numerically. Note that here and below, intra-group and intergroup relationships are expressed in absolute values.
This type of situation can be characterized by rather protracted conflicts, in which even attempts to discuss issues with members of the opposition group are not welcomed or are even considered a sign of wavering in one’s own position. In this case, as demonstrated in Figure 3, the lower the coherence of the members of each group, the easier it is to persuade both groups to a compromise position.
  • Situation 2.
Interactions of groups with multidirectional intergroup connections, where members of one group try to strengthen the positions of members of the opposite group while members of the second group try to weaken the positions of members of the first group, are shown in Figure 4. Such interactions are typical for situations in which members of opposing groups react negatively to the positions of members of the other group. Instead of converging, the groups’ positions are characterized by a long-term, lagged oscillation from combativeness to conciliatory positions. Such dynamics can arise in meetings and round tables, which generate debates among group members.
The situations in Figure 4a lead to conflicts of the separation from the group type. It characterize the oscillatory dynamics of the system with opposite intergroup ties of the groups, regardless of the closeness of ties within the conflicting groups. When k 12 < 0 , members of the adapter group call on members of the innovator group to adapt and refuse to develop innovations, and the compromise wing of the adapter group feeds the members of the innovator group who are very active. When k 21 > 0 , the radical (extreme) wing of the innovator group strengthens the radical wing of the executor group, while the moderate wing of the first group helps the moderate second group. Strengthening intergroup ties with weak intra-group ties only increases the frequency of oscillations, but the trajectories of the groups do not converge. The described oscillatory dynamics do not change even when the initial conditions change (Figure 4a). Strengthening intergroup ties with weak intra-group ties only increases the frequency of oscillations, but the trajectories of the two groups do not converge. The system demonstrates convergence to zero (Figure 4b), which is to the desire to find a compromise solution only at low values of intra-group ties and average intergroup ties.
The dynamics of the group conflict in the plane S 1 ,   S 2 are shown in Figure 5, which shows the attractor for any initial conditions. The dynamics of the conflict for situation 2 with different initial conditions are characterized by an attractor—a limit cycle. Even in the presence of opposite initial positions of the parties ( S 1 = 2 ,   S 2 = 2 ), the dynamic system tends to the attractor—a limit cycle—and does not demonstrate chaotic dynamics. The limit cycle is an isolated closed trajectory in the phase space of the dynamic system (4) representing periodic motions. In the vicinity of the limit cycle, the phase trajectories either move away from it (unstable limit cycle) or approach it indefinitely—“wind” around it (stable limit cycle).
By changing the initial conditions (Figure 5a–d), the difference between the attitudes of group members to the methods of conflict resolution will not grow exponentially quickly (as would be the case under chaotic dynamics) and will not decrease to zero, as happens when the system is stabilized at a fixed point. The limit cycle means that the differences between the attitudes of group members to the method of conflict resolution, starting from different initial conditions, fluctuate over time and depend on other parameters of intergroup and intra-group communications.
  • Situation 3.
With zero intra-group connections, we observe an oscillatory behavior of the system if the parameters k 12 and k 21 have the same positive signs; see Figure 6a–c. In this case, the participants of both groups try to persuade the participants of the opposite group to accept their position and beliefs. As the connections between the groups increase (Figure 6a–c), the evolution of the system develops from damped oscillations and rapid achievement of a compromise (Figure 6a,b), and then it continuously passes into stable oscillations of an increasing period and smoothly changes to a stable non-zero value for S 1 ,   S 2 (Figure 6c).
If the parameters k 12 and k 21 have the same negative signs, Figure 6d, then the participants of both groups try to convince the participants of the opposing group that their (competitors’) position is erroneous and incorrect. By increasing these efforts, the opponents fail to come to any agreement, and their contradictions do not depend on the initial positions of the group participants (even if at first they were not so significantly different from each other, Figure 6e) and only intensify.
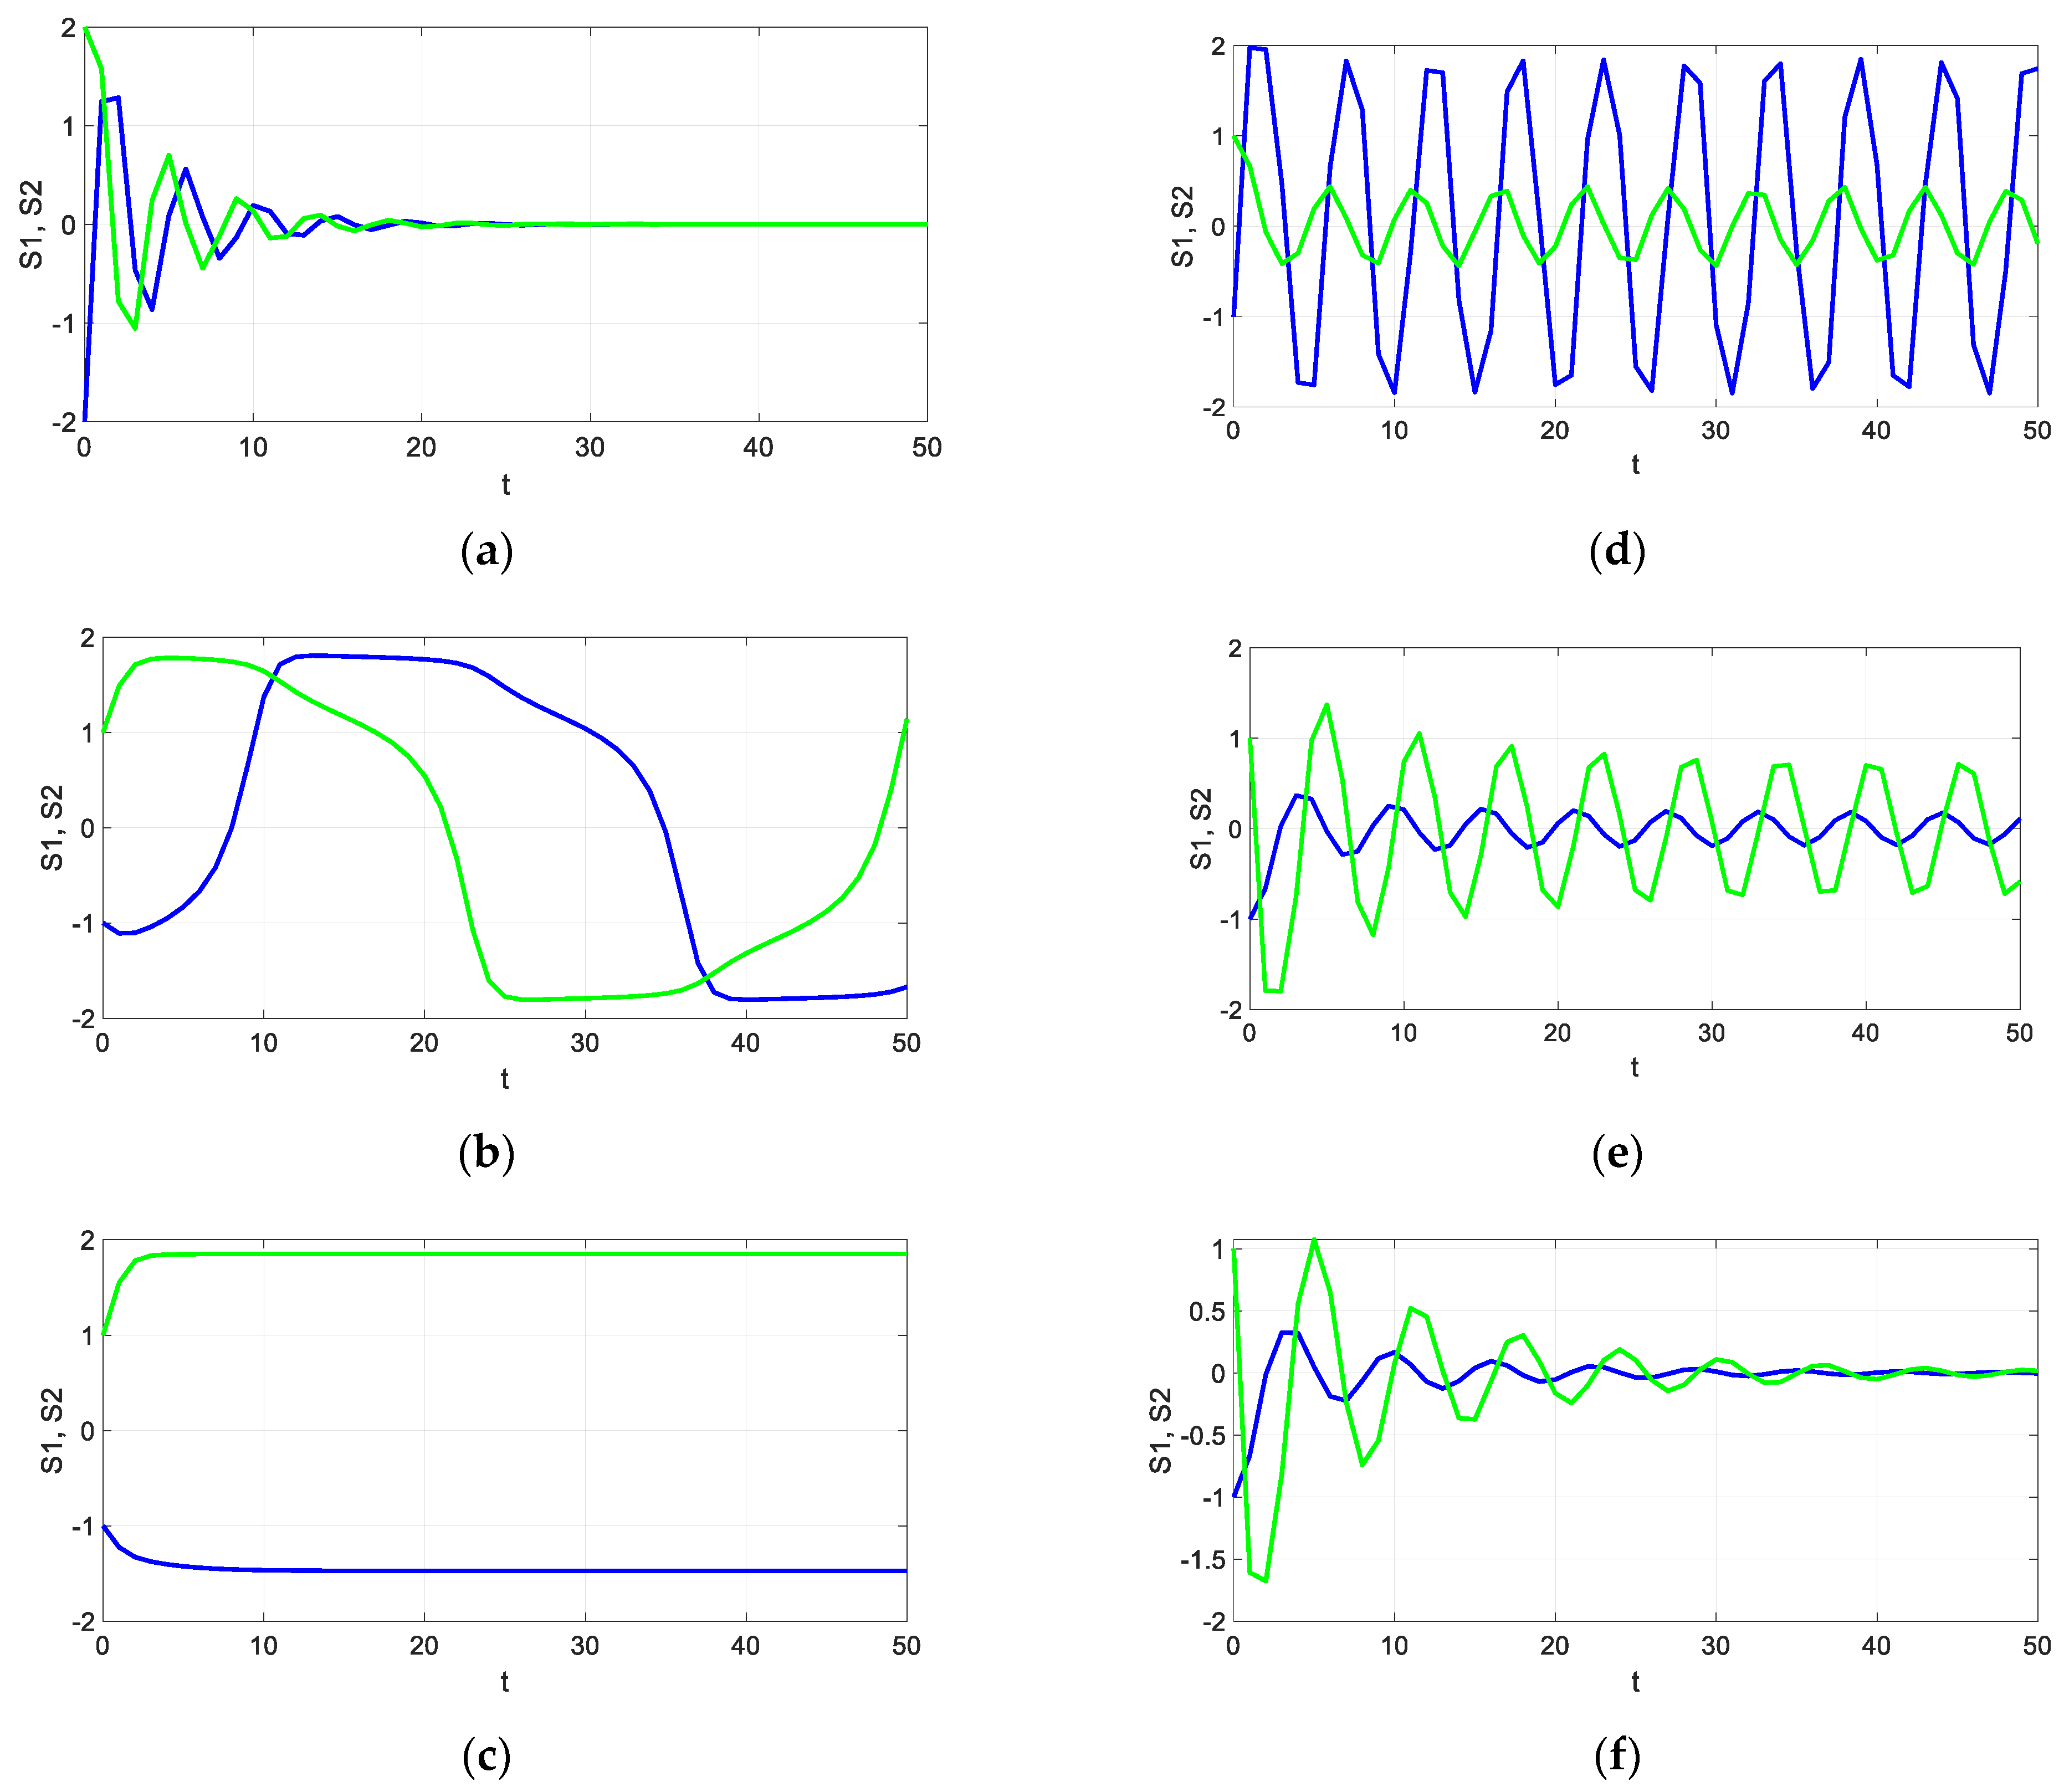
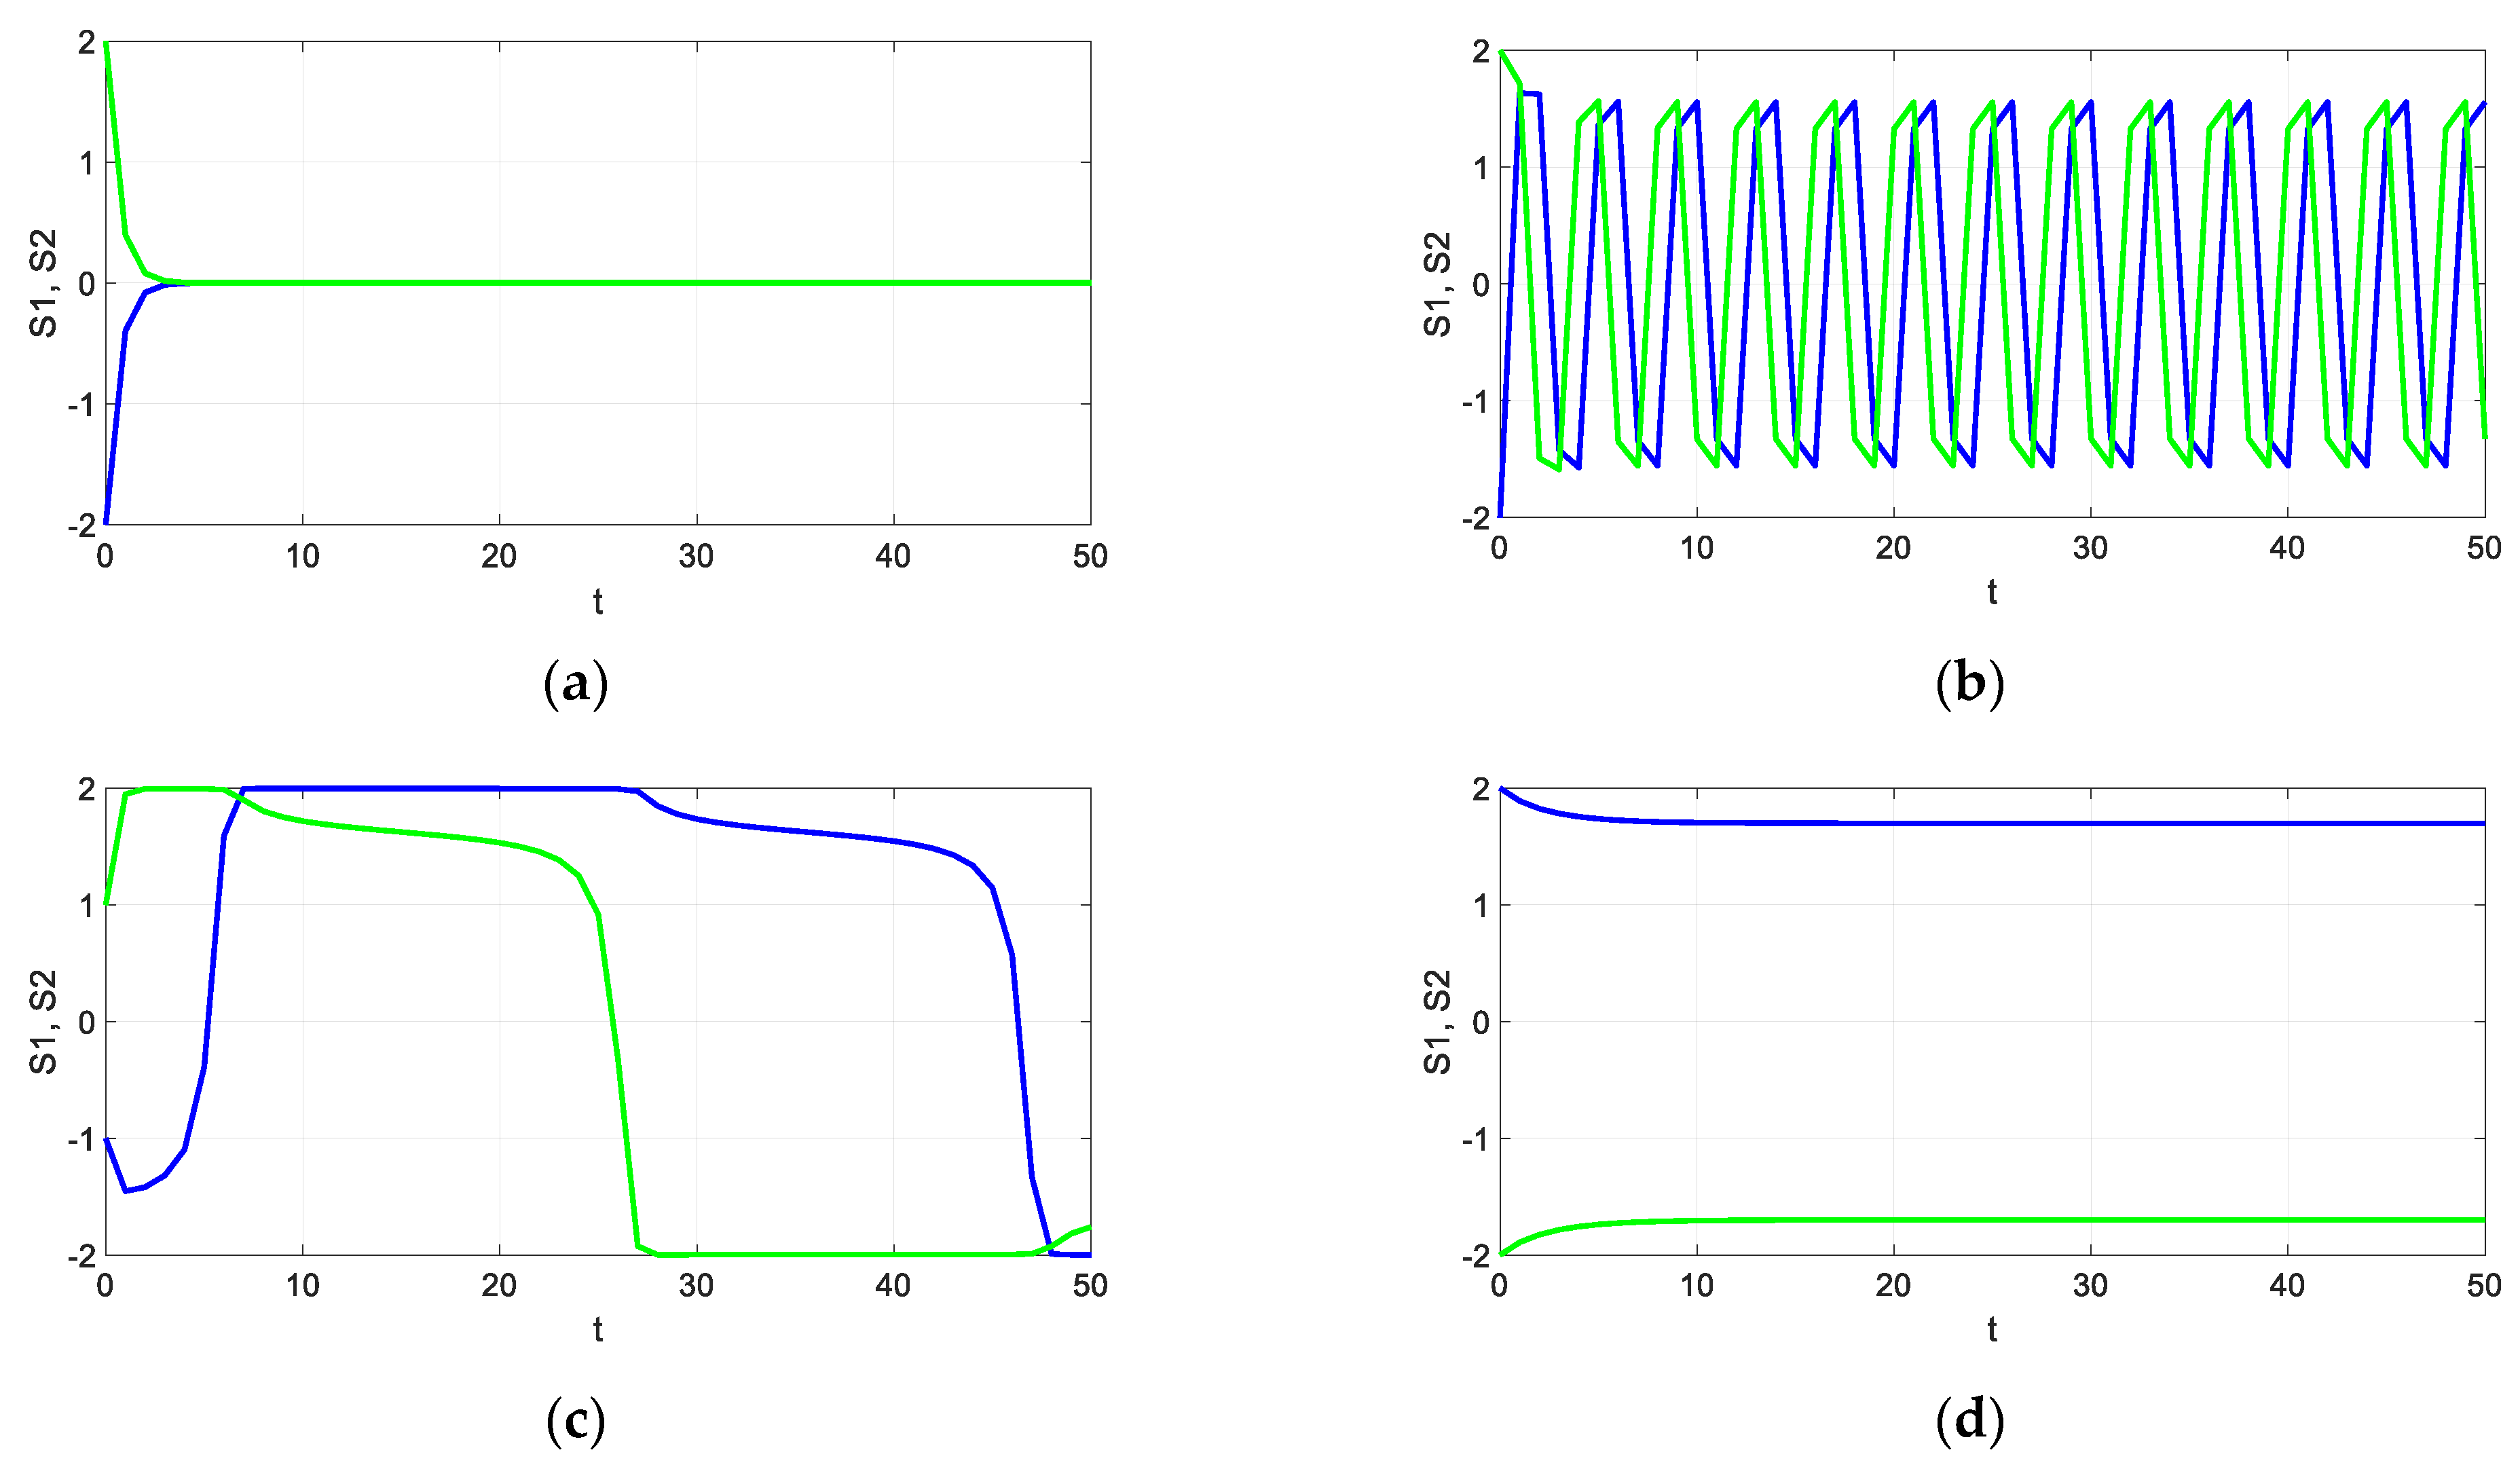
  • Situation 4. Connections within groups and between groups are different from zero
Figure 7 shows situations when participants within each group interact not only with each other, but also with representatives of the opposing group.
In Figure 7a, both groups have weak intra-group interactions, but intergroup communication causes average group opinions to fluctuate before eventually converging to a centrist position for both groups. The opportunity for interactions with opponents gives each member a chance to change each group’s position before eventually collaborating. The interactions in Figure 7b result from each group reacting negatively to the positions of members of the other group at. As a result, instead of convergence, the groups’ positions become locked in over the long term, with positions fluctuating from belligerence to conciliation (with decreasing intra-group influences of group members). The increasing influence on members of the opposing group with divergent efforts leads to divergence over time; see Figure 7c. Similar dynamics can arise in debates between group members.
Figure 7d–f show a slow return to convergence, in which one group (with strong intergroup interactions) gradually comes to the point of being ready to negotiate with the other group (with weak intergroup ties), oscillating between some turning points before stabilizing. This is due to the fact that in this case, workers are subject to a stronger influence from the other group than from members of their own group. Such an asymmetry can arise when both sides are not inclined to change their already established patterns of behavior.
Figure 7d,f demonstrate differences in the influence of one group on another. It consists in the increased influence of the second group on the members of the first group (Figure 7d). This asymmetry leads to long-term fluctuations in the average positions of the members of both groups, which may be due to a lag in mutual reactions to entering into dialogue. In addition, in the first group, the amplitude fluctuations are smaller than in the second group. The time delay of the values of states for the second group reflects the lesser influence of the members of the first group on it (Figure 7d). This model may correspond to how members of both groups recognize the need for innovations dictated by the objective market situation (for example, marketing, organizational innovations), as well as the existing pressure from members of their group.
Under conditions of strengths and directions of intra-group and intergroup connection changes, the following dynamics of the system are observed (Figure 8).
Figure 8b shows that the preferences S 1 ,   S 2 tend to zero, that is, to a compromise, in the absence of intra-group ties, and with weak intergroup connections k 12 = k 21 = 0.2 . When weak intra-group ties ( j 1 = j 2 = 0.03 ) are added to the system, the behavior of the system is preserved (Figure 8a). Further strengthening of intra-group ties ( j 1 = j 2 = 0.4 ) also ensures the convergence of the system to zero, which characterizes the mutual tendency of the conflict participants to compromise; see Figure 6b.
Figure 8d shows that the preferences of the participants tend to zero in the absence of intra-group ties, and with weak intergroup connection k 12 = k 21 = 0.2 . For small values of j 1 and j 2 , this situation persists. For sufficiently large intra-group ties j 1 = j 2 = 0.5 , the system evolves to non-zero S 1 ,   S 2 , having different signs. This characterizes the divergence of opinions of group participants regarding methods of conflict resolution; see Figure 8d. The transition between the described situations is intermittent. The possibilities of transition from a situation of confrontation of groups to a situation of readiness of members of opposing groups to participate in negotiations and cooperate with each other are shown. This is demonstrated in Figure 8d. Thus, with a significant increase in intra-group communication of innovators ( j 1 = 1 ) and even with the preservation of low communication in the group of adapters ( j 2 = 0.1 ), simultaneously increasing intergroup interactions to mutually trusting relations ( k 21 = 0.8 ,   k 12 = 0.8 ), the dynamics of the system develops in the mainstream of close cooperation.
The participants in the innovators’ group with state S = 2 show extreme commitment to the values of their group, which leads to unwillingness to enter into negotiations and make concessions, i.e., the members of this group demonstrate an extreme competitive position. The participants in the adapters’ group with S = 2 do not have a clear inclination or commitment to a certain concept of innovative development of the enterprise; they are independent, and, subsequently, can be open and convinced of the views of the opposing group; they are ready to cooperate. The participants with average preferences are ready to negotiate a conflict settlement taking into account their own values and beliefs.
After analyzing the described situations, additional experiments were conducted at the extreme points of system (5)’s parameter values j 1 ,   j 2 ,   k 12 ,   k 21 . The following parameter combinations were investigated:
  • Low intra-group and intergroup ties. With initial opposite positions of the parties and the absence of intergroup ( k 21 = 0 ,   k 12 = 0 ) and very weak intra-group ( j 1 = j 2 = 0.05 ) ties, the system evolves to a compromise solution; see Figure 9a. Such a situation is demonstrated in Figure 3d.
  • Low intra-group, high intergroup ties with opposite signs. With significant intergroup ties with opposite signs, the system does not have a compromise solution; see Figure 9b. Such a situation is also shown in Figure 6c.
  • High intra-group, high intergroup ties with opposite signs. Strengthening intra-group ties only aggravates the contradictions of the parties; see Figure 9c.
  • High intra-group, low intergroup ties. There is no equilibrium in the system; see Figure 9d. This situation is discussed in detail and shown above in Figure 3a.
The numerical experiments carried out with various combinations of parameters and different initial conditions provide the basis for formulating some general conclusions.
In the first situations, there are no intergroup connections. This can happen in very protracted disputes, when even discussing issues with representatives of the opposing group is not recommended or is considered a sign of value oscillation. Figure 8 shows possible trajectories of the system if the competing groups are not connected with each other and the participants within each group act weakly or try to convince each other of their own position. Over time, both groups converge in disorder. In this case, they may not reach any agreement on resolving the conflict situation.
In the second and third situations, the groups are also divided. While in the first group, intra-group interactions are as weak as before, and members of the second group interact with each other more vigorously. As a result, the innovator group slowly comes to zero, i.e., over time, it demonstrates openness to negotiations, but the adapter group tends to polarize, becoming more attached to its own basic values and less open to compromise. Such an asymmetry in the intensity of activity within the groups may arise if the controversial situation under consideration is more important for one group than for the other. In the medium term, the groups may converge in their readiness to negotiate, but in the long term, the group for which opposition to the development and promotion of innovations is more important (adapters) will be more inclined to intransigence.

4.2. Testing the Model at an Industrial Enterprise

In order to demonstrate the potential of the presented model, we used data from a large mechanical engineering enterprise. The innovativeness and social capital of an individual are diagnosed, for which a methodology based on psychodiagnostic tools was developed [12]. The purpose of the diagnostic study is to assess the social capital and innovativeness of an individual under labor activity. Since social capital is a systemic phenomenon that integrates the features and forms of trust, social networks and connections, and social norms and values, the methodology is based on ideas about the structure of social capital, which includes these three components. The innovativeness of an individual is a construct in the form of creativity, risk propensity, and strategy, so innovativeness is diagnosed using three factors and blocks of questions.
The test (questionnaire) includes 27 statements corresponding to social capital and innovativeness. The questions in the questionnaire are dichotomous and trichotomous. Employees are required to express their own attitude to each question on a scale from 1 to 2 or from 1 to 3. A representative sample of respondents was compiled, which included 100 employees. It was necessary to divide employees into groups based on the survey data obtained at this enterprise in order to estimate the values of model (4)’s parameters, and then qualitatively study this model from the position of possible conflict outcomes.
Based on the survey results, all employees, based on all characteristics studied (trust, social networks and connections, social norms and values, social capital, creativity, risk propensity, strategy, innovativeness), were divided into two groups (clusters)—innovators and adapters. Descriptive characteristics of the groups are shown in Table 1.
A third of the respondents, 36 people, were in the adapter group, while about two thirds, 64 people, and were in the adapter group. Descriptive statistics of the innovator and adapter groups show that these two groups are statistically homogeneous; the coefficient of variation in innovativeness does not exceed 33%. The average of innovativeness among members of the first group of innovators is 2.07 versus 1.48 among adapters, i.e., 40% higher. In our further discussions, we rely on this indicator of innovativeness as the resulting one to describe the differences between the groups, as well as the impact of other characteristics on the formation of the socio-economic portrait of the groups under study. In general, the innovator group can be characterized as quite creative, with members prone to risk; however, the levels of trust, social norms, and social connections do not differ very much between these groups. Thus, in terms of trust, innovators exceed adapters by 3.5%; in terms of social connections, by 18.5%; and in terms of social norms and values, the groups do not differ significantly.
In order to substantiate the values of the parameters of intra-group and intergroup connections of the studied groups, we additionally evaluate the influence of factors that make up the social capital of group members—trust, social networks and connections, and social norms and values—as well as factors that form innovativeness—creativity, risk propensity, and strategy. The matrices of paired correlations of all these factors by groups are given in Table 2 and Table 3.
It is evident that of the social capital factors in the group of innovators, the factor “social networks and connections” has the most statistically significant influence on innovation; in the group of adapters, the relationship between these factors is characterized by a negative sign, but in terms of magnitude, this dependence is two times weaker (the correlation coefficient of these factors for adapters is −0.231, while for innovators the correlation is 0.242).
The parameters’ values were selected in order to reflect the homogeneity of the studied groups. Judging by the indicators of the average level of trust and social norms and values, groups have approximately the same average values; see Table 1. Therefore, we consider that the internal cohesion (intra-group interaction) of innovators and adapters is the same and takes average values. In the range from 0 to 3, they are about 0.8–0.9 values, that is, we put j 1 = j 2 = 0.3 .
Intergroup interactions are positive, that is, the action of the group on the group is characterized as a copying strategy (the behavior of the opposite side on the opponent’s action is symmetrical, similar to the game model “prisoner’s dilemma”). That is, if a group of innovators behaves hostilely, then a group of adapters can react similarly, increasing intransigence. If one of the groups behaves hostilely, and the other group reacts conciliatory with the aim of extinguishing the conflict, or vice versa, the actions of one group are quite conciliatory (the opponent’s behavior is asymmetric), to which the second group reacts more aggressively in order to protect its own interests in this case.
To capture such types of reactions, and taking into account the data of Table 1, Table 2 and Table 3, we assume that k 21 = 0.23 , that is, the group of innovators reacts quite sharply to criticism from adapters, and k 12 = 0.2 , that is, adapters react to the effects of the group of innovators condescendingly, trying to ignore it. We also note that in social interactions, symmetry of the values of intergroup parameters is not necessarily fulfilled, as it happens in physical systems. This happens due to the manifestation of activity of individual participants in the conflict. The values of intergroup communications in this case are formed based on the quantitative composition of the groups and the assumption that the larger the group, the stronger their intergroup impacts should be.
The dynamics of the conflict between innovators and adapters is modeled; see Figure 10a. This situation is characterized by the initial opposite group’s positions S 1 = 2 ,   S 2 = 2 , and their interaction is reflected by the model in the form of a convergence of the groups’ positions over time and the desire to find a compromise. Various modifications are applied related to changing the parameters of intra-group and intergroup connections of the groups in order to achieve a mutually beneficial solution and resolve the conflict situation.
Thus, when ensuring a more conciliatory position of innovators, the situation does not change qualitatively, and the groups can eventually come to a compromise; see Figure 10b. However, this is not entirely satisfactory from the point of view of productive conflict resolution. Therefore, several more measures for its resolution are being tested. Strengthening the conciliatory position of adapters, Figure 10c, as well as strengthening the conciliatory position of innovators together with strengthening their intra-group connections, Figure 10d, does not allow for finally achieving convergence of the groups’ positions, rather on the contrary, it intensifies their contradictions. The resolution of the conflict situation can be facilitated by strengthening the intra-group cohesion of innovators and only this factor can ensure the resolution of the conflict of groups; see Figure 10e. In this situation, both groups are ready to make concessions and eventually move to cooperation, which will contribute to the development of creativity, strategy, and innovativeness of employees.
Thus, based on modeling the interaction of conflicting groups of innovators and adapters, the long-term consequences of their interaction in the enterprise are shown. Each group member has his/her own idea (preference) of how to resolve intergroup conflict and has a certain commitment to group values. The results of the model experiments show that different assumptions about the intensity of intra- and intergroup interactions lead to qualitatively different long-term patterns. Depending on the actual situation of conflict between two groups, the dynamics of the system can be characterized as convergence (convergence of positions of the participants in the conflict, cooperation), polarization (competition), or oscillatory mode (instability of positions over time).
Thus, the model of interaction between innovators and adapters, presented as a two-dimensional four-parameter mapping (4), describes the dynamics of conflict behavior between two groups S 1 ,   S 2 . It reflects involvement in the conflict or the predisposition of groups to conflict behavior. The parameters of the model j 1 and j 2 characterize cohesion within group participants and the degree of group depolarization k 12 ,   k 21 . An analysis of system evolution depending on the values of the parameters j 1 ,   j 2 , k 12 ,   k 21 was carried out to identify areas of periodic and possibly non-periodic and chaotic behavior. The analytical and graphical criteria of dynamic chaos—the senior characteristic index of Lyapupov, bifurcation diagrams, construction of attractors of the system with variations of its parameters—were used. The areas of parameters that ensure the achievement of the stability of the system were established. Numerical methods were used to analyze quantitative characteristics of the system trajectory. The phase space was investigated; the attractor of the system was presented as a limit cycle. Non-periodic and chaotic modes in the behavior of the system were not revealed.

5. Conclusions

This paper describes a two-group conflict of innovation (R&D) process for participants using sociodynamics and nonlinear dynamics methods, which allows them to obtain a new view on the dynamics of their conflict behavior. A model of interaction between innovators and adapters is proposed, presented as a two-dimensional four-parameter mapping, describing the dynamics of their conflict behavior in the form of a change in the behavioral styles of group participants in relation to conflict resolution methods. Participants in each group interact with each other within their group through mean field interactions. Under the influence of the depolarization field, a preference of group participants to a conflict resolution method (from extreme competition to close cooperation) is formed. The proposed nonlinear dynamic model of interaction between two groups of innovation process participants, unlike others, is based on sociodynamic methods and allows us to describe the dynamics of their conflict behavior as a change in the behavioral reactions of groups from cooperation to competition. The novelty of the model is that it is based on the principle of attractive management; it provides support for decision-making aimed at resolving contradictions between subjects of a two-group conflict.
Based on the developed model, equilibria and conditions for achieving them were studied using nonlinear dynamics methods; under uncertainty, the trajectories of conflict behavior of group subjects were analyzed and forecasted, taking into account changes in their behavioral styles in the corporate R&D process. The dynamics of conflict behavior of groups of innovators and adapters was modeled using a two-dimensional map, while the resolution of contradictions of often antagonistic behavioral reactions over group interaction was carried out based on monitoring the achievement of the attractor.
Various scenarios based on realistic assumptions about the conflict behavior of groups were studied. The scenarios were a basis for forecasting the conflict dynamics and for helping to develop strategies for conflict management. It was revealed that the dynamic system of a two-group conflict can have complex and diverse types of motions, so that the structure of its phase space and the dependence of this structure on the parameters are very complex. It was found that under certain parameters of intra-group and intergroup interactions and regardless of the initial conditions and states of preferences for the method of resolving the conflict by the participants of the two groups, the trajectories eventually converge to an attractor (limit cycle) in a two-dimensional space. No non-periodic or chaotic modes were revealed in the system of conflict interaction between two groups. Numerical experiments made it possible to study the dynamic behavior of the system and to determine its desired state in the space of possible trajectories—the attractor of the system, to which the controlled object must be brought. The results of the simulation experiments can be used to develop management decisions in the process of managing the conflict behavior of participants over the corporate R&D process aimed at forming the required modes of the R&D process and aimed at ensuring the group participants’ cohesion and depolarization.

Funding

This research received no external funding.

Data Availability Statement

Data are contained within the article.

Conflicts of Interest

The authors declare no conflict of interest.

References

  1. Kirton, M.J. Adaptors and innovators-Why new initiatives get blocked. Long Range Plan. 1984, 17, 137–143. [Google Scholar] [CrossRef]
  2. Kirton, M.J. Adaptors and innovators: A description and measure. In Creativity Assessment: Readings and Resources; Puccio, G.J., Murdock, M.C., Eds.; Creative Education Foundation Press: Buffalo, NY, USA, 1999; pp. 121–132. [Google Scholar]
  3. Stieglitz, N.; Heine, K. Innovations and the role of complementarities in a strategic theory of the firm. Strateg. Manag. J. 2007, 28, 1–15. [Google Scholar] [CrossRef]
  4. Hodge, J.; Sprague-Williams, F.; Woelk, J. Rank disequilibrium in multiple-criteria evaluation schemes. Involv. A J. Math. 2017, 10, 165–180. [Google Scholar] [CrossRef]
  5. Racek, D.; Thurner, P.; Kauermann, G. Integrating Spatio-temporal Diffusion into Statistical Forecasting Models of Armed Conflict via Non-parametric Smoothing. Cent. Open Sci. 2024, preprint. [Google Scholar] [CrossRef]
  6. Wei, E.; Tan, S.; Yu, P.; Kvist, T.; Yu, V. A video-based decision aid improved knowledge and decreased decisional conflict for asymptomatic persistent endodontic lesions. Int. Endod. J. 2017, 57, 394–405. [Google Scholar] [CrossRef] [PubMed]
  7. Malietskii, G.G.; Makhov, S.A. Dynamics of macroeconomic and bilateral trade’s indicators of the BRICS countries and the USA. Math. Model. Numer. Methods 2023, 37, 112–123. [Google Scholar] [CrossRef]
  8. Coleman, P.T.; Vallacher, R.R.; Nowak, A.; Bui-Wrzosinska, L. Intractable conflict as an attractor: A dynamical systems approach to conflict escalation and intractability. Am. Behav. Sci. 2007, 50, 1454–1475. [Google Scholar] [CrossRef]
  9. Liebovitch, L.S.; Naudot, V.; Vallacher, R.; Nowak, A.; Bui-Wrzosinska, L.; Coleman, P. Dynamics of two-actor cooperation-competition conflict models. Phys. A Stat. Mech. Its Appl. 2008, 387, 6360–6378. [Google Scholar] [CrossRef]
  10. Kaufman, M.; Kaufman, S.; Diep, H.T. Social Depolarization: Blume–Capel Model. Physics 2024, 6, 138–147. [Google Scholar] [CrossRef]
  11. Orlova, E.V. Design Technology and AI-Based Decision Making Model for Digital Twin Engineering. Future Internet 2022, 14, 248. [Google Scholar] [CrossRef]
  12. Orlova, E.V. Methodology and Statistical Modeling of Social Capital Influence on Employees’ Individual Innovativeness in a Company. Mathematics 2022, 10, 1809. [Google Scholar] [CrossRef]
  13. Orlova, E.V. Design of Personal Trajectories for Employees’ Professional Development in the Knowledge Society under Industry 5.0. Soc. Sci. 2021, 10, 427. [Google Scholar] [CrossRef]
  14. Orlova, E.V. Dynamic Regimes for Corporate Human Capital Development Used Reinforcement Learning Methods. Mathematics 2023, 11, 3916. [Google Scholar] [CrossRef]
  15. Orlova, E.V. Inference of Factors for Labor Productivity Growth Used Randomized Experiment and Statistical Causality. Mathematics 2023, 11, 863. [Google Scholar] [CrossRef]
  16. Orlova, E.V. Innovation in Company Labor Productivity Management: Data Science Methods Application. Appl. Syst. Innov. 2021, 4, 68. [Google Scholar] [CrossRef]
  17. Boudec, J.-Y.L.; McDonald, D.; Mundinger, J. A Generic Mean Field Convergence Result for Systems of Interacting Objects. In Proceedings of the Fourth International Conference on the Quantitative Evaluation of Systems (QEST 2007), Edinburgh, UK, 17–19 September 2007; pp. 3–18. [Google Scholar] [CrossRef]
  18. Coleman, P.T.; Deutsch, M.; Marcus, E.C. The Handbook of Conflict Resolution: Theory and Practice; Jossey-Bass: San Francisco, CA, USA, 2014; 1264p. [Google Scholar]
  19. Myers, D. Social Psychology; Piter: St. Petersburg, Russia, 2019; 800p. [Google Scholar]
  20. Thomas, K.W.; Kilmann, R.H. Thomas-Kilmann Conflict Mode Instrument. TKI Profile & Interpretive Report; CPP, Inc.: Sunnyvale, CA, USA, 1976. [Google Scholar] [CrossRef]
  21. Kapitsa, S.P.; Kurdyumov, S.P.; Malinetsky, G.G. Synergetics and Forecasts of the Future; Nauka: Moscow, Russia, 1997; 285p. [Google Scholar]
  22. Turchin, P.V. Historical Dynamics: How States Arise and Collapse. Towards Theoretical History; URSS: Moscow, Russia, 2022; 366p. [Google Scholar]
  23. Strauss, B.; Strauss, W.; Howe, N. The History of America’s Future, 1584 to 2069; Morrow: New York, NY, USA, 1991; 538p. [Google Scholar]
  24. Gumilev, L.N. Ethnogenesis and Biosphere Land; IrisPress: Moscow, Russia, 2016; 545p. [Google Scholar]
  25. Schumpeter, J. Capitalism, Socialism and Democracy; Harper & Brothers: New York, NY, USA, 1942; 431p. [Google Scholar]
  26. Orlova, E.V. Model for economic interests agreement in duopoly’s making price decisions. Comput. Res. Model. 2015, 7, 1309–1329. [Google Scholar] [CrossRef]
  27. Kaniadakis, G. Novel predator-prey model admitting exact analytical solution. Phys. Rev. E 2022, 106, 044401. [Google Scholar] [CrossRef]
  28. Vasin, A.A.; Stepanov, D.S. Endogenous formation of political parties. Math. Comput. Model. 2008, 48, 1519–1526. [Google Scholar] [CrossRef]
  29. Eguda, F.Y.; James, A.; Oguntolu, F.A.; Ogwumu, D.O. Mathematical analysis of a model to investigate the dynamics of poverty and corruption. Abacus (Math. Sci. Ser.) 2019, 44, 1. [Google Scholar]
  30. Petrosyan, L.A.; Yeung, D.W.K. Cooperative Dynamic Games with Durable Controls: Theory and Application. Dyn. Games Appl. 2020, 10, 872–896. [Google Scholar] [CrossRef]
  31. Puu, T. Nonlinear Economic Dynamics; Springer: Berlin/Heidelberg, Germany, 1997; 284p. [Google Scholar]
  32. Kopel, M. Improving the Performance of an Economic System: Controlling Chaos. J. Evol. Econ. 1997, 7, 269–289. [Google Scholar] [CrossRef]
  33. Holyst, J.A.; Urbanowicz, K. Chaos Control in Economical Model by Time-Delayed Feedback Method. Phys. A 2000, 287, 587–598. [Google Scholar] [CrossRef]
  34. Ahmed, E.; Elsadany, A.A.; Puu, T. On Bertrand duopoly game with differentiated goods. Appl. Math. Comput. 2015, 251, 169–179. [Google Scholar] [CrossRef]
  35. Orlova, E.V. Control over Chaotic Price Dynamics in a Price Competition model. Autom. Remote Control. 2017, 78, 16–28. [Google Scholar] [CrossRef]
  36. Vallacher, R.R.; Coleman, P.T.; Nowak, A.; Bui-Wrzosinska, L. Rethinking Intractable Conflict: The Perspective of Dynamical Systems, in Conflict, Interdependence, and Justice; Springer: New York, NY, USA, 2011; pp. 65–94. Available online: https://ssrn.com/abstract=3290370 (accessed on 1 May 2024).
  37. Bercovitch, J. Characteristics of Intractable Conflicts. In Beyond Intractability; Burgess, G., Burgess, H., Eds.; Conflict Information Consortium. University of Colorado: Boulder, CO, USA, 2003; Available online: http://www.beyondintractability.org/essay/characteristics-ic (accessed on 1 May 2024).
  38. Wilson, A. Notes on some concepts in social physics. Pap. Reg. Sci. 1969, 22, 159–193. [Google Scholar] [CrossRef]
  39. Stauffer, D. Sociophysics simulations. Comput. Sci. Eng. 2003, 5, 71–75. [Google Scholar] [CrossRef]
  40. Barnes, T.J.; Wilson, M.W. Big data, social physics, and spatial analysis: The early years. Big Data Soc. 2014, 1, 1–14. [Google Scholar] [CrossRef]
  41. Galam, S. Sociophysics: A Physicist’s Modeling of Psycho-Political Phenomena; Springer Science & Business Media: Berlin/Heidelberg, Germany, 2012. [Google Scholar]
  42. Godoy, A.; Tabacof, P.; Von Zuben, F.J. The role of the interaction network in the emergence of diversity of behavior. PLoS ONE 2017, 12, e0172073. [Google Scholar] [CrossRef]
  43. Schweitzer, F. Sociophysics. Phys. Today 2018, 71, 40. [Google Scholar] [CrossRef]
  44. Kaufman, S.; Kaufman, M. Tipping points in the dynamics of peace and war. Int. Negot. Found. Models Philos. 2013, 251–272. [Google Scholar]
  45. Kaufman, S.; Kaufman, M. Two-Group Dynamic Conflict Scenarios: Toy Model with a Severity Index. Negot. Confl. Manag. Res. 2015, 8, 41–55. [Google Scholar] [CrossRef]
  46. Deutsch, M.; Coleman, P.T.; Marcus, E.C. The Handbook of Conflict Resolution: Theory and Practice; John Wiley & Sons: San Francisco, CA, USA, 2006. [Google Scholar]
  47. Diep, H.T.; Kaufman, M.; Kaufman, S. Dynamics of two-group conflicts: A statistical physics model. Phys. A Stat. Mech. Its Appl. 2017, 469, 183–199. [Google Scholar] [CrossRef]
  48. Vallacher, R.R.; Nowak, A. Dynamical social psychology: Finding order in the flow of human experience. In Social Psychology: Handbook of Basic Principles; Kruglanski, A.W., Higgins, E.T., Eds.; Guilford Publications: New York, NY, USA, 2005. [Google Scholar]
  49. Vallacher, R.R.; Coleman, P.T.; Nowak, A.; Bui-Wrzosinska, L. Dynamical foundations of intractable conflict: Introduction to the special issue. Peace Confl. J. Peace Psychol. 2010, 16, 113–125. [Google Scholar] [CrossRef]
  50. Boulding, K.E. Conflict and Defense; Harper: New York, NY, USA, 1962. [Google Scholar]
  51. Pruitt, D.G. A graphical interpretation of escalation and de-escalation. Presented at Dynamics and Complexity of Intractable Conicts, Kamimierz, Poland, 19–22 October 2006. [Google Scholar]
  52. Liebovitch, L.S.; Coleman, P.T.; Vallacher, R.; Nowak, A.; Bui-Wrzosinska, L. Dynamics of Two-Actor Cooperation-Competition Conflict Models. IACM 2007 Meetings Paper. Available online: https://ssrn.com/abstract=1066815 (accessed on 1 May 2024).
  53. Kastler, A. Life and Work of Leon Brillouin. Uspekhi Fiz. Nauk. 1972, 106, 101–118. [Google Scholar] [CrossRef]
  54. Kittel, C. Statistical Thermodynamics; Nauka: Moscow, Russia, 1977; 336p. [Google Scholar]
  55. Borovik, E.S.; Eremenko, V.V.; Milner, A.S. Lectures on Magnetism; FIZMATLIT: Moscow, Russia, 2005; 512p. [Google Scholar]
  56. Trukhan, S.N.; Martyanov, O.N. Magnetic Properties of Matter. Part 1. Fundamentals of Structure; Boreskov Institute of Catalysis SB RAS: Novosibirsk, Russia, 2012; 75p. [Google Scholar]
  57. Glazkov, V.N. Magnetism: Static and Dynamic Properties of Magnets. Notes for a Lecture on General Physics; MIPT: Moscow, Russia, 2022; 67p. [Google Scholar]
  58. Darby, M.I. Tables of the Brillouin function and of the related function for the spontaneous magnetization. Brit. J. Appl. Phys. 1967, 18, 1415–1417. [Google Scholar] [CrossRef]
Figure 1. Types of conflict participants and their behavioral styles under R&D process.
Mathematics 12 02788 g001
Figure 2. Innovators and adapters’ conflict interactions.
Mathematics 12 02788 g002
Figure 3. System dynamics for the two groups of participants’ interactions (blue curve—for the first group of innovators, green curve—for the second group of adapters) under initial conditions S 1 = 2 ,   S 2 = 2 and k 12 = k 21 = 0 : (a) j 1 = 0.3 ,   j 2 = 0.3 ; (b) j 1 = 0.1 ,   j 2 = 0.3 ; (c) j 1 = 0.3 ,   j 2 = 0.1 ; (d) j 1 = 0.1 ,   j 2 = 0.1 .
Mathematics 12 02788 g003
Figure 4. System dynamics for the two groups of participants’ interactions; blue curve—for the first innovators group, green curve—for the second adapters group: (a) j 1 = 0.1 ,   j 2 = 0.1 , k 21 = 0.3 ,   k 12 = 0.3 , the initial conditions S 1 = 1 ,   S 2 = 0 ; (b) j 1 = 0.1 ,   j 2 = 0.1 , k 21 = 0.2 ,   k 12 = 0.2 , the initial conditions S 1 = 2 ,   S 2 = 2 .
Mathematics 12 02788 g004
Figure 5. Conflict system attractors: (a) j 1 = 0.25 ,   j 2 = 0.25 , k 21 = 0.1 ,   k 12 = 0.1 , initial conditions S 1 = 2 ,   S 2 = 2 ; (b) j 1 = 0.25 ,   j 2 = 0.25 , k 21 = 0.1 ,   k 12 = 0.1 , initial conditions S 1 = 0.2 ,   S 2 = 0.2 ; (c) j 1 = 0.1 ,   j 2 = 0.1 , k 21 = 0.3 ,   k 12 = 0.3 , initial conditions S 1 = 2 ,   S 2 = 2 ; (d) j 1 = 0.1 ,   j 2 = 0.1 , k 21 = 0.3 ,   k 12 = 0.3 , initial conditions S 1 = 1 ,   S 2 = 0 .
Mathematics 12 02788 g005
Figure 6. System dynamics for the two groups of participants’ interactions (blue curve—for the first group, green curve—for the second group) under j 1 = j 2 = 0 and initial conditions for (ac): S 1 = 2 ,   S 2 = 2 ; (a) k 21 = 0.1 ,   k 12 = 0.1 ; (b) k 21 = 0.2 ,   k 12 = 0.2 ; (c) k 21 = 0.3 ,   k 12 = 0.3 ; (d) k 21 = 0.3 ,   k 12 = 0.3 ; S 1 = 2 ,   S 2 = 2 ; (e) k 21 = 0.3 ,   k 12 = 0.3 ; S 1 = 1.8 ,   S 2 = 0.1 ; (f) k 21 = 0.3 ,   k 12 = 0.3 ; S 1 = 1.85 ,   S 2 = 0.07 .
Mathematics 12 02788 g006
Figure 7. System dynamics for the two groups participants interaction, blue curve—for the first group, green curve—for the second group, under k 21 = 0.2 ,   k 12 = 0.2 and initial conditions S 1 = 1 ,   S 2 = 1 for all except (a): (a) j 1 = 0.03 ,   j 2 = 0.03 ; S 1 = 2 ,   S 2 = 2 ; (b) j 1 = 0.85 ,   j 2 = 0.85 ; (c) j 1 = 0.95 ,   j 2 = 0.95 ; k 21 = 0.1 ,   k 12 = 1 ; (d) j 1 = 0.25 ,   j 2 = 0.25 ; k 21 = 0.1 ,   k 12 = 4 ; (e) j 1 = 0.25 ,   j 2 = 0.25 ; k 21 = 0.9 ,   k 12 = 0.1 ; (f) j 1 = 0.25 ,   j 2 = 0.25 ; k 21 = 1 ,   k 12 = 0.1 .
Mathematics 12 02788 g007
Figure 8. Dynamics of the interaction system of participants in two groups, blue curve—for the first group, green curve—for the second group under initial conditions S 1 = 2 ,   S 2 = 2 for (a,b): (a) j 1 = 0.03 ,   j 2 = 0.03 ; k 21 = 0.2 ,   k 12 = 0.2 ; (b) j 1 = 0.01 ,   j 2 = 0.01 ; k 21 = 0.2 ,   k 12 = 0.2 ; (c) j 1 = 0.5 ,   j 2 = 0.5 ; k 21 = 0.3 ,   k 12 = 0.3 ; S 1 = 1 ,   S 2 = 1 ; (d) j 1 = 1 ,   j 2 = 0.1 ; k 21 = 0.8 ,   k 12 = 0.8 ; S 1 = 1 ,   S 2 = 1 .
Mathematics 12 02788 g008
Figure 9. Dynamics of the interaction system of participants in two groups, blue curve—for the innovators group, green curve—for the adapters group: (a) S 1 = 2 ,   S 2 = 2 ; j 1 = j 2 0 ; k 21 = 0 ,   k 12 = 0 (more precisely j 1 = j 2 = 0.05 ); (b) S 1 = 2 ,   S 2 = 2 ; j 1 = j 2 0 ; k 21 = 0.7 ,   k 12 = 0.7 (more precisely j 1 = j 2 = 0.05 ); (c) S 1 = 1 ,   S 2 = 1 ; j 1 = j 2 = 1 ; k 21 = 1 ,   k 12 = 1 ; (d) S 1 = 2 ,   S 2 = 2 ; j 1 = j 2 = 0.5 ; k 21 = 0 ,   k 12 = 0 .
Mathematics 12 02788 g009
Figure 10. Dynamics of the interaction system of participants in two groups, blue curve—for the innovators group, green curve—for the adapters group, with initial conditions S 1 = 2 ,   S 2 = 2 : (a) j 1 = 0.3 ,   j 2 = 0.3 ; k 21 = 0.23 ,   k 12 = 0.2 ; (b) j 1 = 0.3 ,   j 2 = 0.3 ; k 21 = 0.2 ,   k 12 = 0.2 ; (c) j 1 = 0.3 ,   j 2 = 0.3 ; k 21 = 0.2 ,   k 12 = 0.8 ; (d) j 1 = 0.89 ,   j 2 = 0.3 ; k 21 = 0.1 ,   k 12 = 0.2 ; (e) j 1 = 0.8 ,   j 2 = 0.3 ; k 21 = 0.23 ,   k 12 = 0.2 .
Mathematics 12 02788 g010
Table 1. Descriptive statistics of the studied indicators by groups.
IndicatorGroup 1—Innovators
(36 People Out of 100)
Group 2—Adapters
(64 People Out of 100)
MeanStandard
Deviation
MeanStandard
Deviation
Trust0.92360.07060.89250.0924
Social networks and connections0.46750.18280.39440.1572
Social norms and values0.89370.14420.90230.1554
Social capital2.28480.22962.18920.2069
Creativity0.56940.14770.39250.1388
Risk appetite0.85410.13850.68750.1836
Strategy0.64440.14020.39840.1537
Innovativeness2.06800.19351.47850.1835
Table 2. Correlation between social capital and innovativeness factors for innovators group.
VariableTrustSocial Networks
and
Connections
Social Norms
and Values
Social
Capital
CreativityRisk AppetiteStrategyInnovativeness
Trust1.000−0.200−0.256−0.0130.0510.004−0.224−0.121
Social networks
and connections
−0.2001.0000.0740.781 *−0.211−0.349 *−0.0430.242 *
Social norms
and values
−0.2560.0741.0000.608 *−0.1470.1030.1480.068
Social capital−0.0130.781 *0.608 *1.000−0.245−0.212−0.010−0.346 *
Creativity0.051−0.211−0.147−0.2451.0000.029−0.3940.498 *
Risk appetite0.004−0.349 *0.103−0.2120.0291.000−0.2080.587 *
Strategy−0.224−0.0430.148−0.010−0.394 *−0.2081.0000.275
Innovativeness−0.1210.242 *0.068−0.346 *0.498 *0.587 *0.2751.000
* significant parameter for p < 0.05.
Table 3. Correlation between social capital and innovativeness factors for adaptors group.
VariableTrustSocial Networks
and
Connections
Social Norms
and Values
Social
Capital
CreativityRisk AppetiteStrategyInnovativeness
Trust1.000−0.0720.0060.397 *−0.0730.0330.0610.028
Social networks
and connections
−0.0721.000−0.260 *0.532 *−0.098−0.040−0.104−0.231 *
Social norms
and values
0.006−0.260 *1.0000.557 *0.027−0.1720.158−0.019
Social capital0.397 *0.532 *0.557 *1.000−0.087−0.1450.067−0.154
Creativity−0.073−0.0980.027−0.0871.000−0.170−0.2030.416 *
Risk appetite0.033−0.040−0.172−0.145−0.1701.000−0.453 *0.492 *
Strategy0.061−0.1040.1580.067−0.203−0.453 *1.0000.231
Innovativeness0.028−0.231 *−0.019−0.1540.416 *0.492 *0.2311.000
* significant parameter for p < 0.05.
Disclaimer/Publisher’s Note: The statements, opinions and data contained in all publications are solely those of the individual author(s) and contributor(s) and not of MDPI and/or the editor(s). MDPI and/or the editor(s) disclaim responsibility for any injury to people or property resulting from any ideas, methods, instructions or products referred to in the content.

