
Performance Evaluation of the Taiwanese Banking Industry before and after the COVID-19 Pandemic


Abstract
:1. Introduction
2. Literature Review
2.1. Application of Quantitative Analysis Tools on Bank Performance
2.2. DEA Application on Bank Performance
3. Methodology
3.1. SBM Model
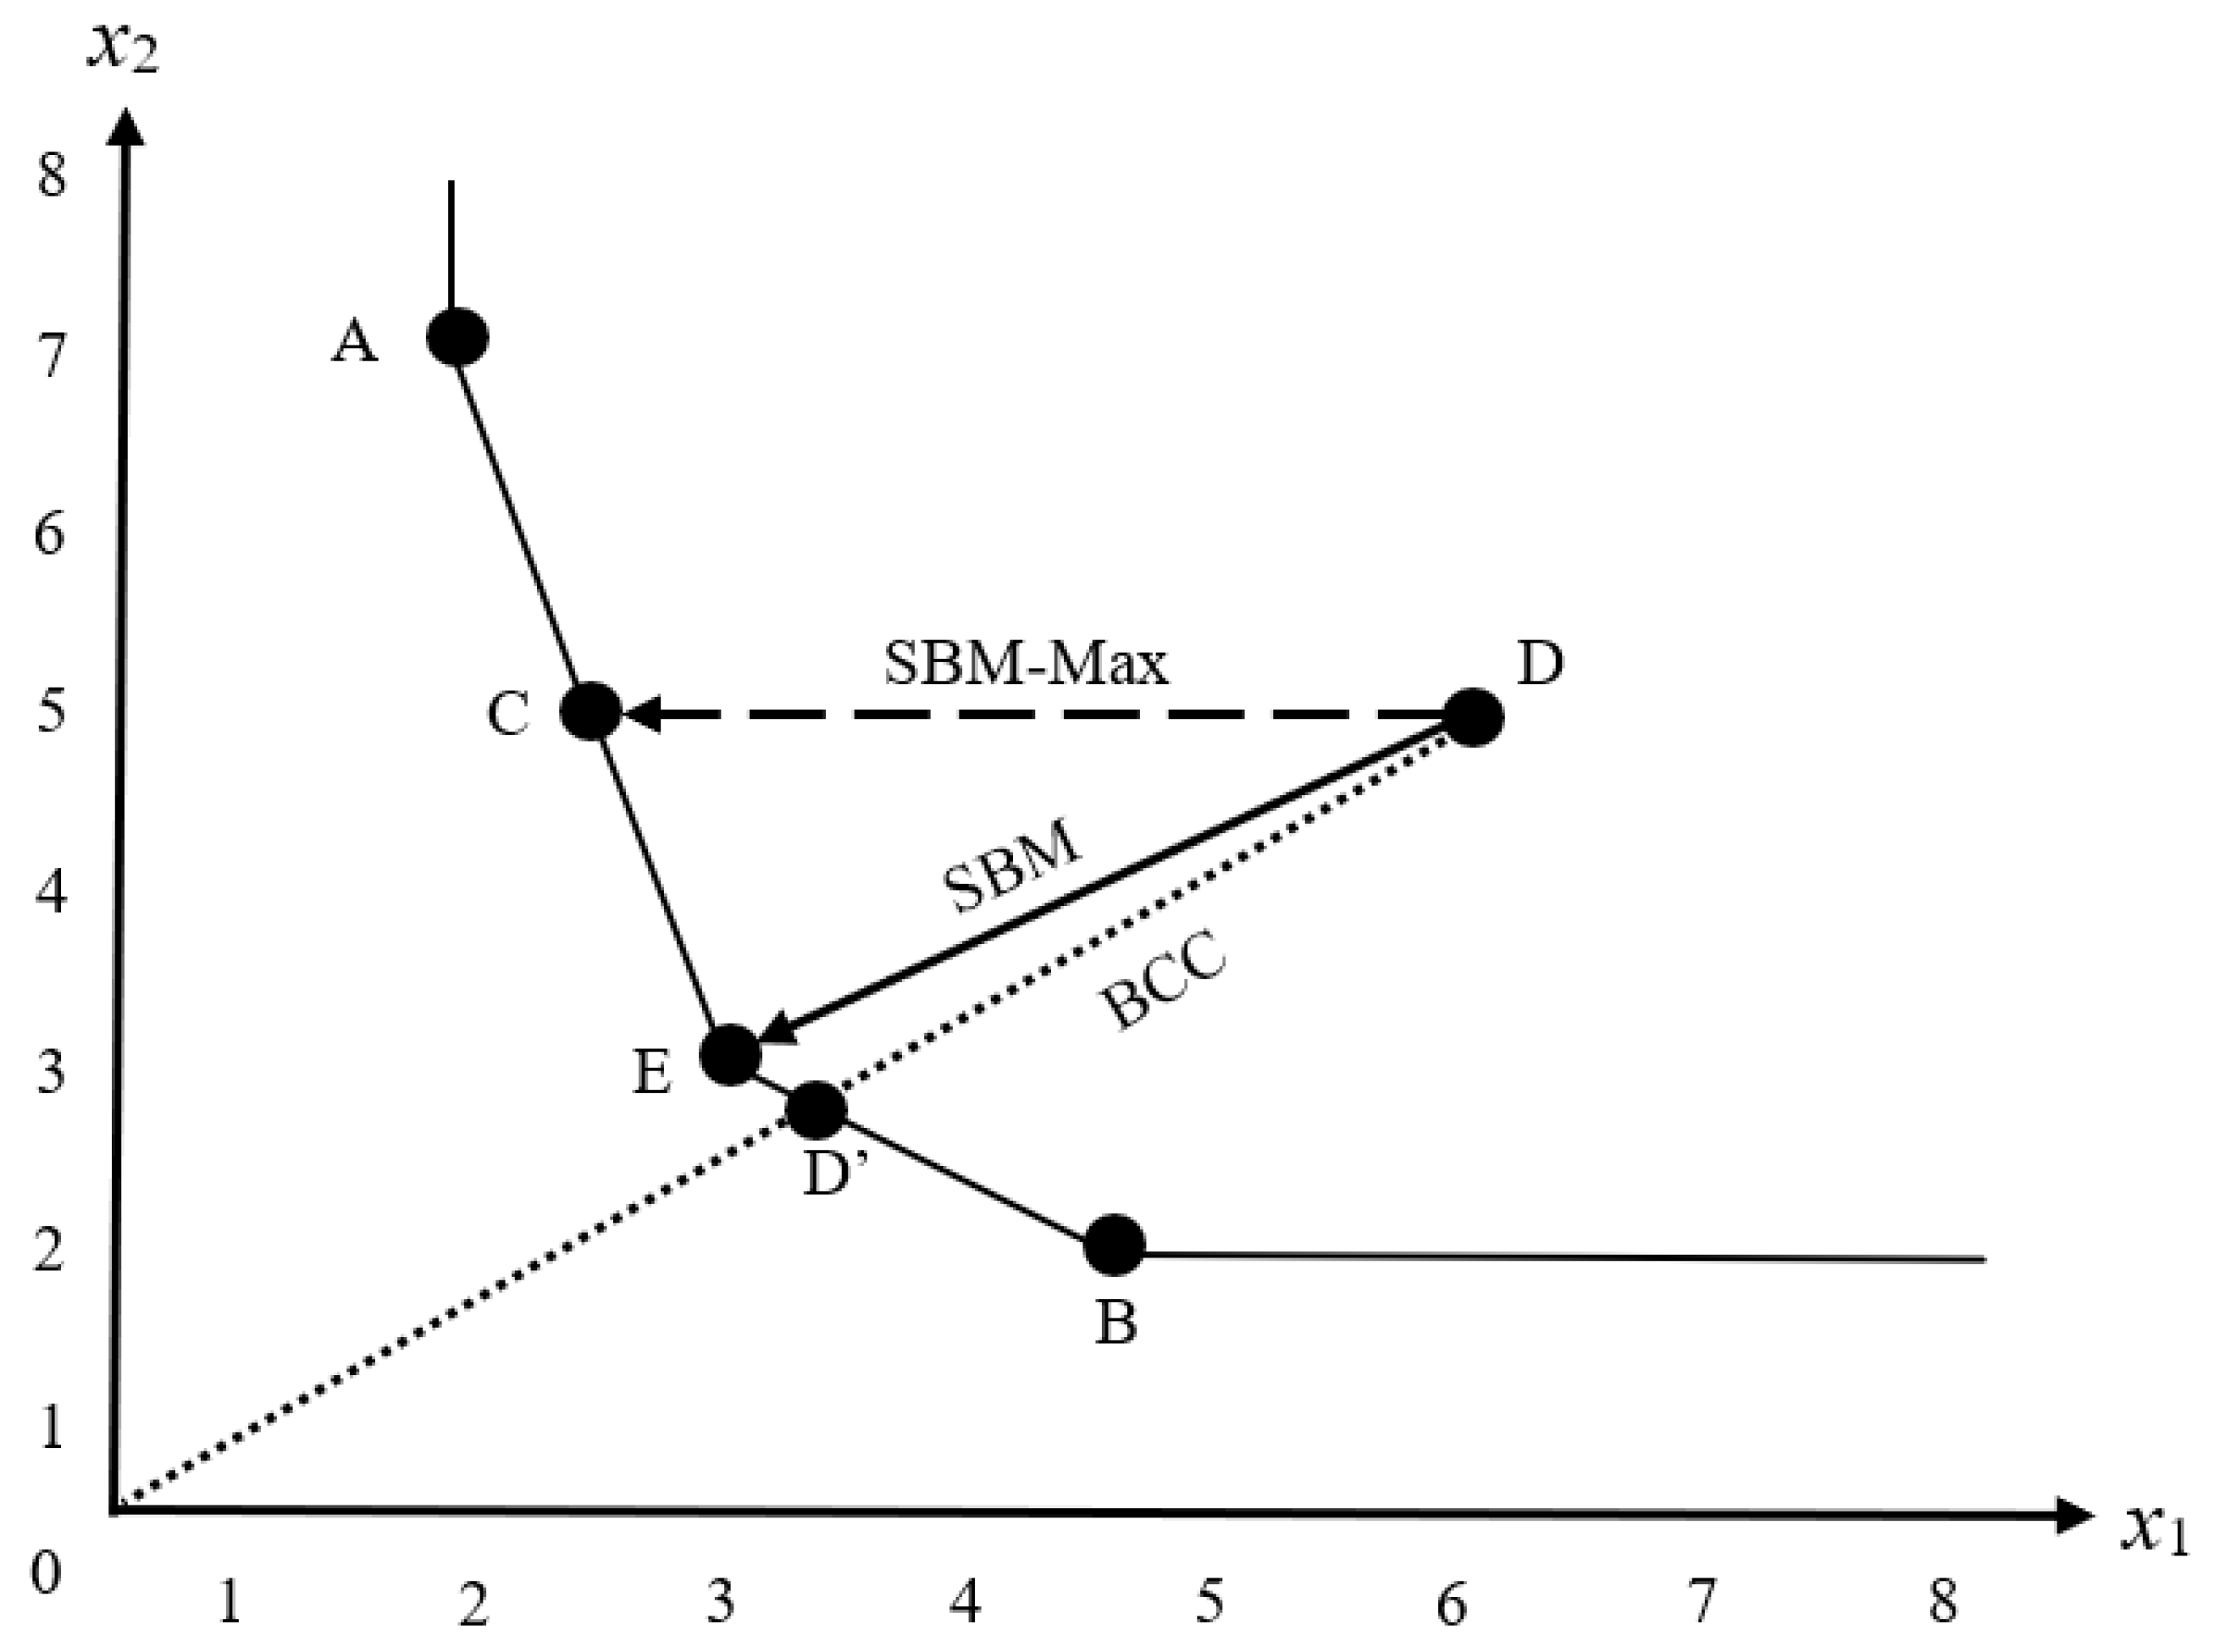
3.2. SBM-Max Model
3.3. Numerical Analysis Example
4. Empirical Case Analysis
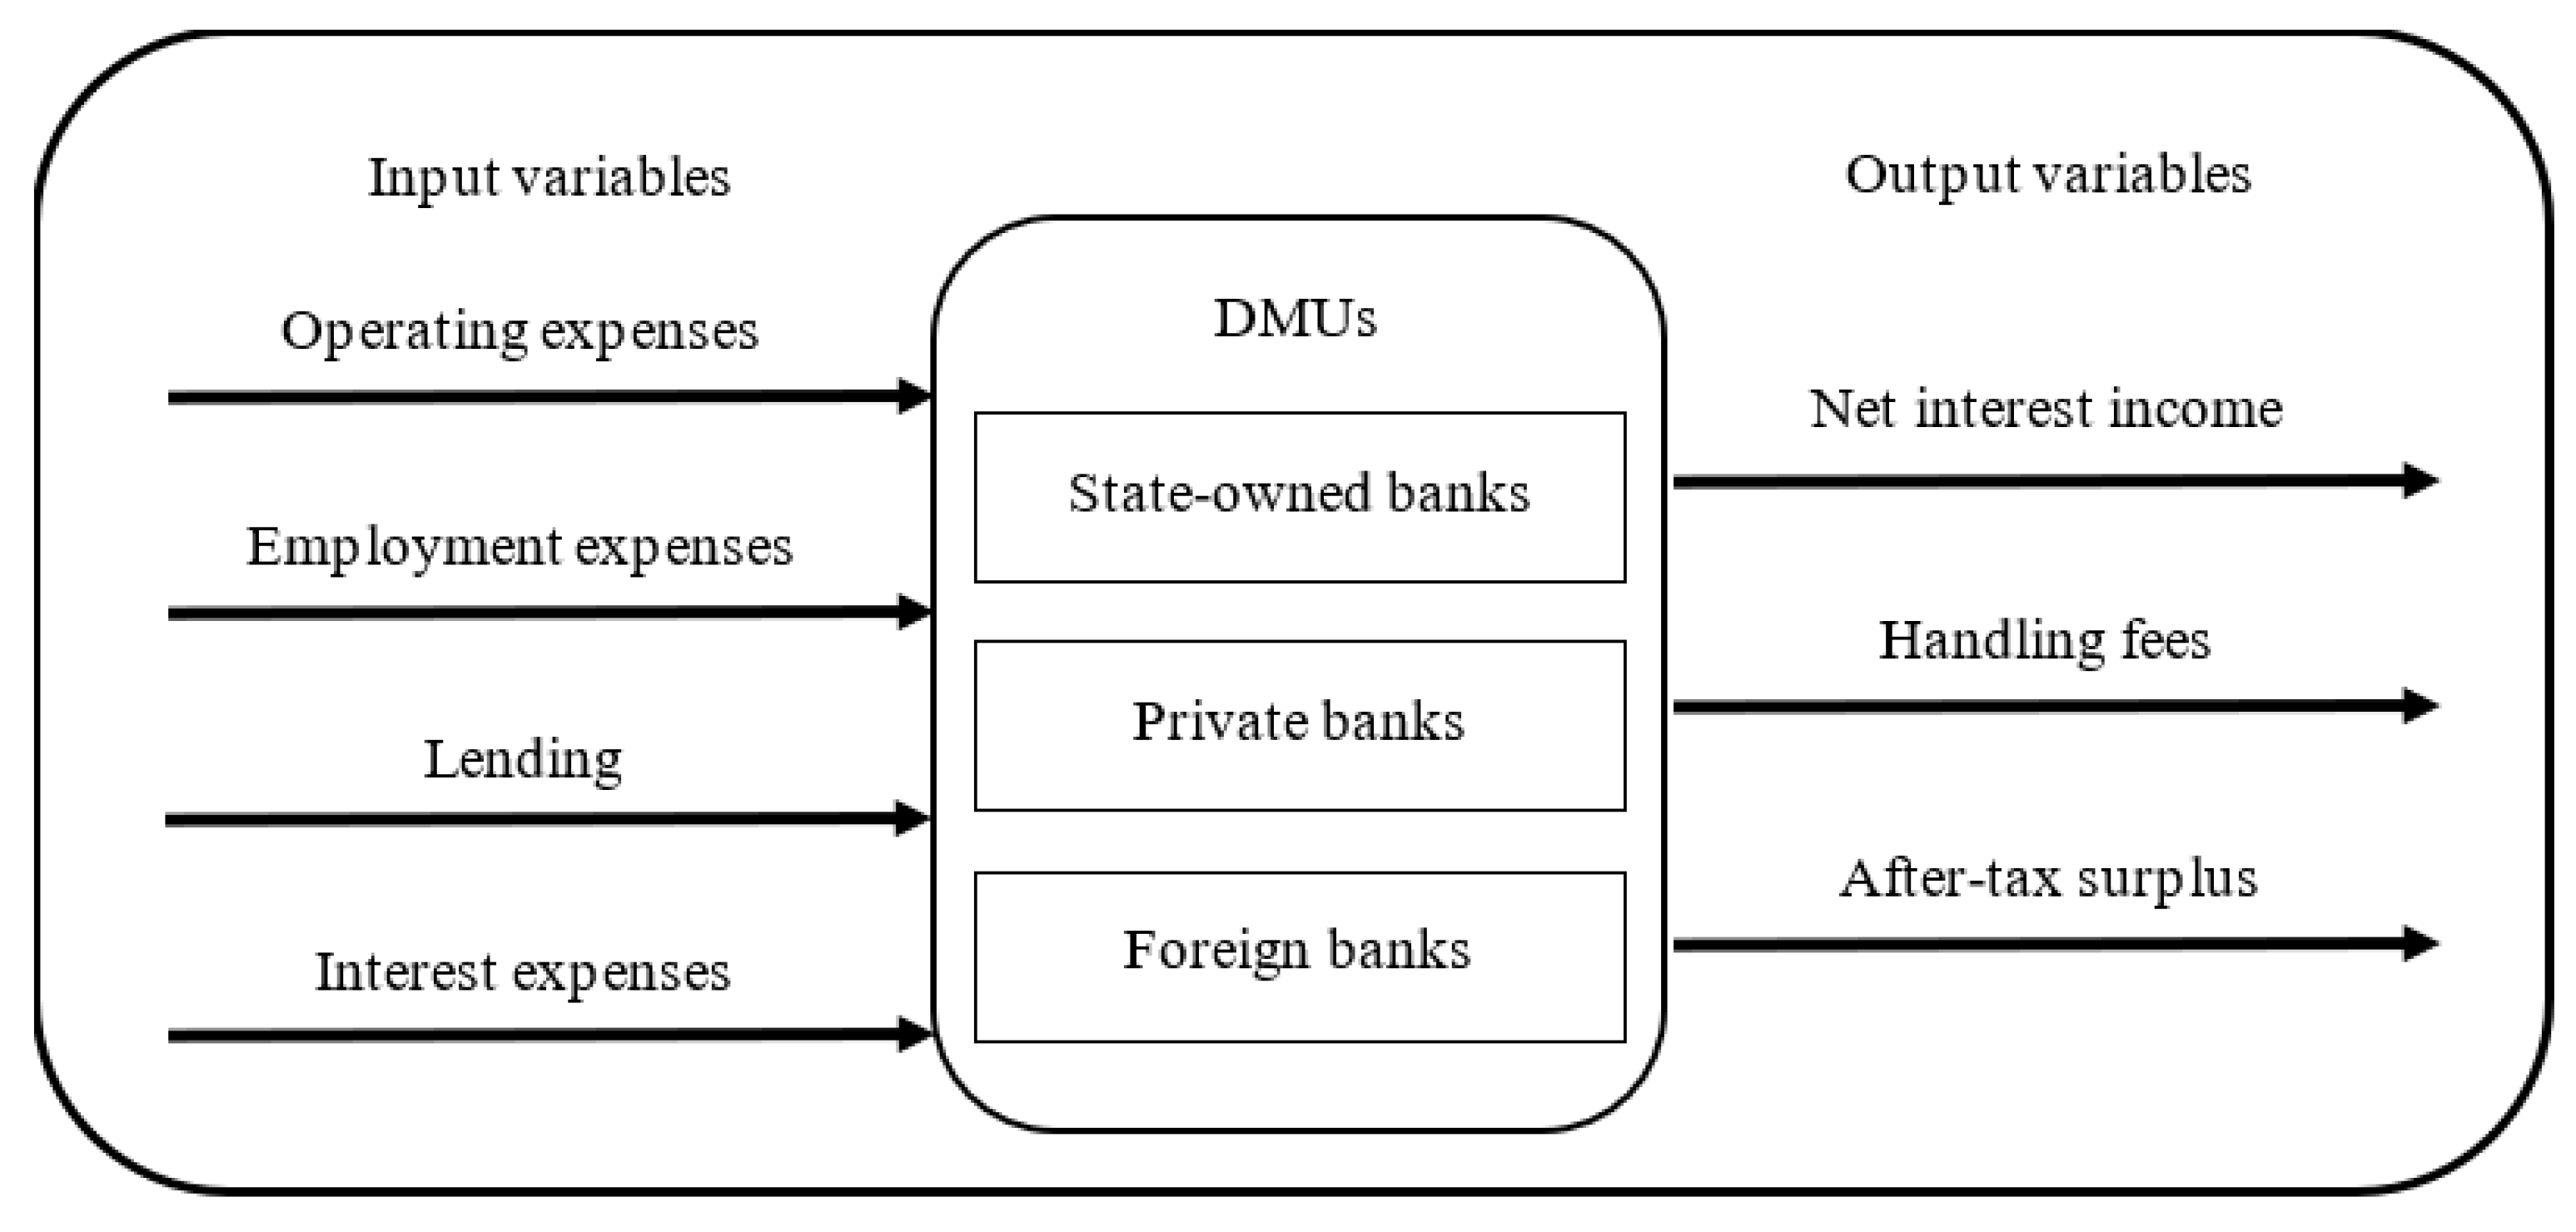
4.1. Case Background
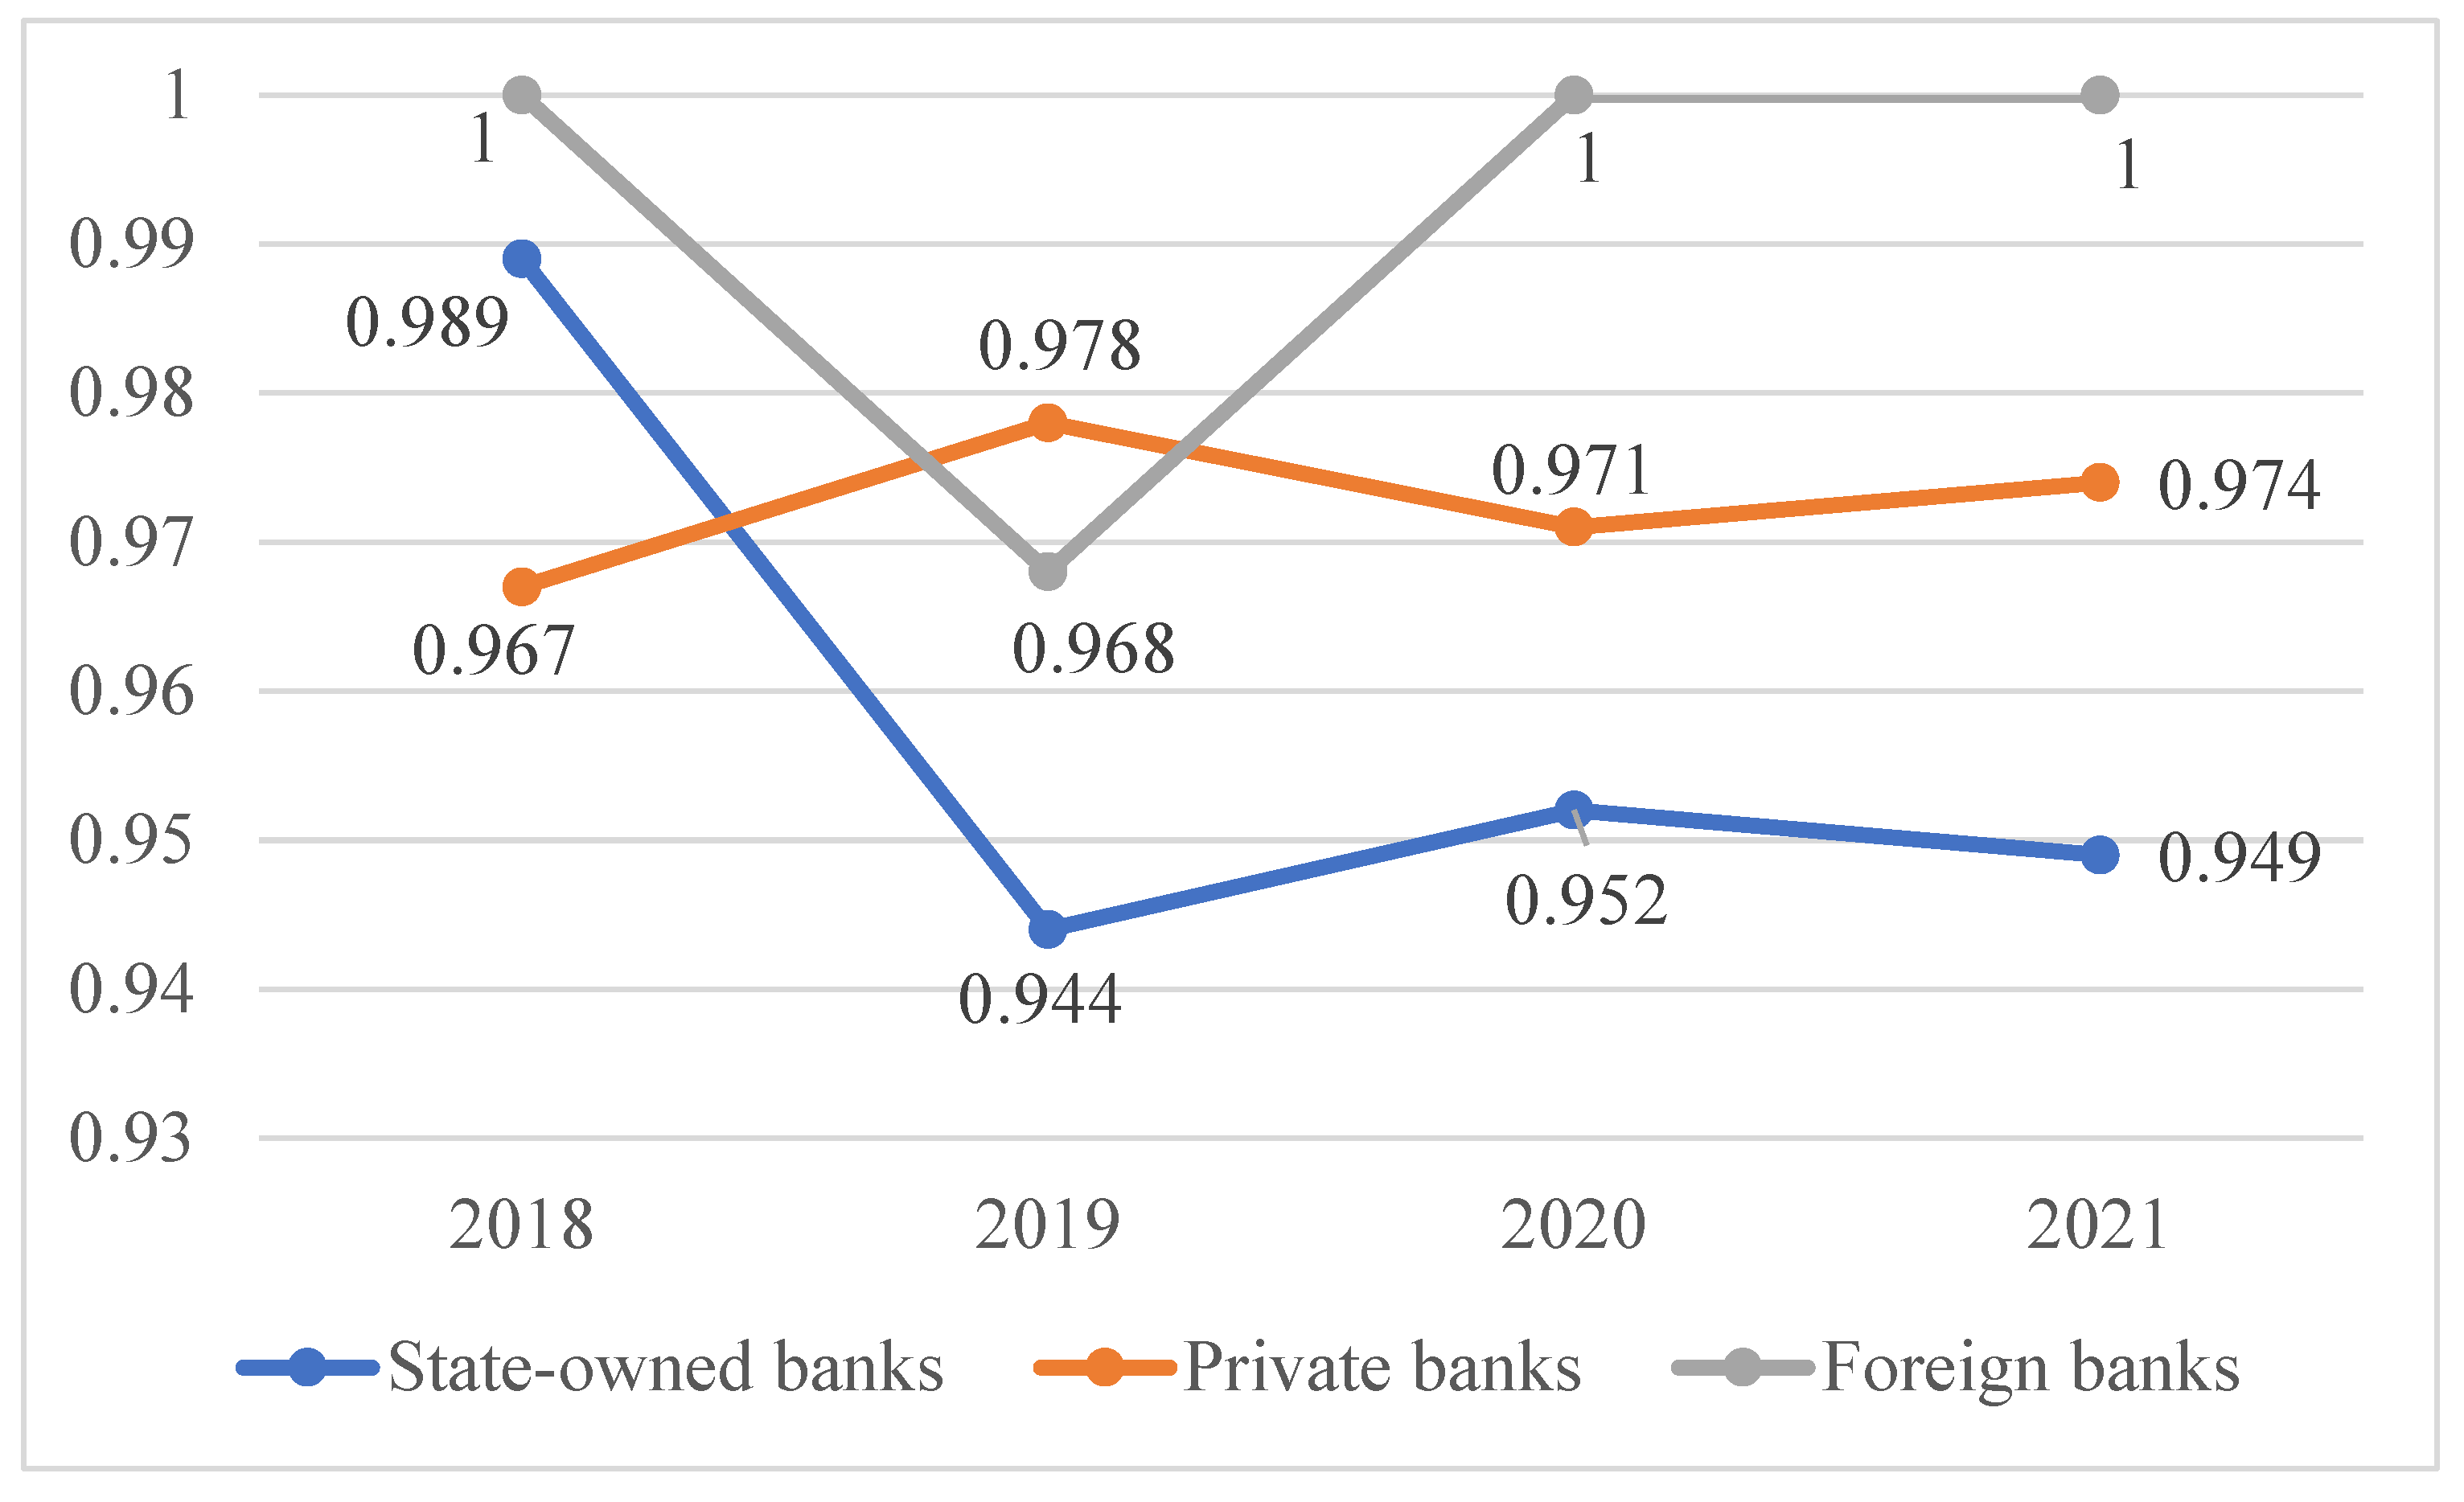
4.2. Bank Performance
4.3. Analysis of the Input–Output Gap of Inefficient Banks
5. Conclusions
Author Contributions
Funding
Data Availability Statement
Conflicts of Interest
Appendix A

| Variable | Definition |
|---|---|
| Operating expenses | An expenditure that a business incurs as a result of performing its normal business operations. |
| Employment expenses | All costs, expenses, debts, liabilities, and obligations related to or incurred in respect of employment including salaries, fees, wages, incentive pay, gratuities, bonuses, vacation pay, holiday pay, other paid leave, overtime, standby pay, sick pay, workers’ compensation legislation contributions, or costs. |
| Lending | The activity of lending money to people and organizations that they pay back with interest. |
| Interest expenses | Interest payable on any borrowings—bonds, loans, convertible debt, or lines of credit. |
| Net interest income | The difference between the revenue generated from interest-bearing assets and the expenses associated with paying on its interest-bearing liabilities. |
| Handling fees | What a customer is charged in order to cover expenses not related to the product or shipping. |
| After-tax surplus | The profit or earnings after all expenses have been deducted from revenue. |
References
- Financial Supervisory Commission. 2021. Available online: https://www.fsc.gov.tw/ch/home.jsp?id=96&parentpath=0,2&mcustomize=news_view.jsp&dataserno=202106100003&dtable=News (accessed on 10 June 2021).
- Horvat, A.M.; Milenković, N.; Dudić, B.; Kalaš, B.; Radovanov, B.; Mittelman, A. Evaluating bank efficiency in the West Balkan countries using data envelopment analysis. Mathematics 2023, 11, 15. [Google Scholar] [CrossRef]
- Cvetkoska, V.; Fotova Ciković, K.; Tasheva, M. Efficiency of commercial banking in developing countries. Mathematics 2021, 9, 1597. [Google Scholar] [CrossRef]
- Yang, F.C. Application of centralised DEA in an automobile parts retail network in Taiwan. Int. J. Retail. Distrib. Manag. 2020, 48, 667–686. [Google Scholar] [CrossRef]
- Charnes, A.; Cooper, W.W.; Rhodes, E. Measuring efficiency of decision making units. Eur. J. Oper. Res. 1978, 2, 429–444. [Google Scholar] [CrossRef]
- Banker, R.D.; Charnes, A.; Cooper, W.W. Some models for estimating technical and scale inefficiencies in data envelopment analysis. Manag. Sci. 1984, 30, 1078–1092. [Google Scholar] [CrossRef]
- Tone, K. A slacks-based measure of efficiency in data envelopment analysis. Eur. J. Oper. Res. 2001, 130, 498–509. [Google Scholar] [CrossRef]
- Tone, K. On the Consistency of Slacks-based Measure-Max Model and Super-Slacks-based Measure Model. Univers. J. Manag. 2017, 5, 160–165. [Google Scholar] [CrossRef]
- Luo, X. Evaluating the profitability and marketability efficiency of large banks: An application of data envelopment analysis. J. Bus. Res. 2003, 56, 627–635. [Google Scholar] [CrossRef]
- Partovi, E.; Matousek, R. Bank efficiency and non-performing loans: Evidence from Turkey. Res. Int. Bus. Financ. 2019, 48, 287–309. [Google Scholar] [CrossRef]
- Berger, A.N.; Klapper, L.K.; Peria, M.S.M.; Zaidi, R. Bank ownership type and banking relationships. J. Financ. Intermed. 2008, 17, 37–62. [Google Scholar] [CrossRef]
- Hasan, I.; Marton, K. Development and efficiency of the banking sector in a transitional economy: Hungarian experience. J. Bank Financ. 2003, 27, 2249–2271. [Google Scholar] [CrossRef]
- Barth, J.R.; Nolle, D.E.; Phumiwasana, T.; Yago, G. A Cross-Country Analysis of the Bank Supervisory Framework and Bank Performance. Financ. Mark. Inst. Instrum. 2003, 12, 67–120. [Google Scholar] [CrossRef]
- Weill, L. Banking efficiency in transition economies. Econ. Transit. 2003, 11, 569–592. [Google Scholar] [CrossRef]
- Bonin, J.P.; Hasan, I.; Wachtel, P. Bank performance, efficiency and ownership in transition countries. J. Bank Financ. 2005, 29, 31–53. [Google Scholar] [CrossRef]
- Beccalli, E. Does IT investment improve bank performance? Evidence from Europe. J. Bank Financ. 2007, 31, 2205–2230. [Google Scholar] [CrossRef]
- Lin, X.; Zhang, Y. Bank ownership reform and bank performance in China. J. Bank Financ. 2009, 33, 20–29. [Google Scholar] [CrossRef]
- Assaf, A.G.; Barros, C.P.; Matousek, R. Productivity and efficiency analysis of Shinkin banks: Evidence from bootstrap and Bayesian approaches. J. Bank Financ. 2011, 35, 331–342. [Google Scholar] [CrossRef]
- Fahlenbrach, R.; Stulz, R.M. Bank CEO incentives and the credit crisis. J. Financ. Econ. 2011, 99, 11–26. [Google Scholar] [CrossRef]
- Beltratti, A.; Stulz, R.M. The credit crisis around the globe: Why did some banks perform better. J. Financ. Econ. 2012, 105, 1–17. [Google Scholar] [CrossRef]
- Liang, Q.; Xu, P.; Jiraporn, P. Board characteristics and Chinese bank performance. J. Bank Financ. 2013, 37, 2953–2968. [Google Scholar] [CrossRef]
- García-Meca, E.; García-Sánchez, I.-M.; Martínez-Ferrero, J. Board diversity and its effects on bank performance: An international analysis. J. Bank Financ. 2015, 53, 202–214. [Google Scholar] [CrossRef]
- Mamatzakis, E.; Matousek, R.; Vu, A.N. What is the impact of bankrupt and restructured loans on Japanese bank efficiency. J. Bank Financ. 2016, 72, S187–S202. [Google Scholar] [CrossRef]
- Sidhu, A.V.; Rastogi, S.; Gupte, R.; Rawal, A.; Agarwal, B. Net Stable Funding Ratio (NSFR) and Bank Performance: A Study of the Indian Banks. J. Risk Financ. Manag. 2022, 15, 527. [Google Scholar] [CrossRef]
- Potapova, E.A.; Iskoskov, M.O.; Mukhanova, N.V. The Impact of Digitalization on Performance Indicators of Russian Commercial Banks in 2021. J. Risk Financ. Manag. 2022, 15, 452. [Google Scholar] [CrossRef]
- Jemric, I.; Vujcic, B. Efficiency of Banks in Croatia: A DEA Approach. Comp. Econ. Stud. 2002, 44, 169–193. [Google Scholar] [CrossRef]
- Lo, S.F.; Lu, W.M. An integrated performance evaluation of financial holding companies in Taiwan. Eur. J. Oper. Res. 2009, 198, 341–350. [Google Scholar] [CrossRef]
- Seiford, L.M.; Zhu, J. Profitability and marketability of the top 55 U.S. commercial banks. Manag. Sci. 1999, 45, 1270–1288. [Google Scholar] [CrossRef]
- Fukuyama, H.; Weber, W.L. A slacks-based inefficiency measure for a two-stage system with bad outputs. Omega 2010, 38, 398–409. [Google Scholar] [CrossRef]
- Lin, T.Y.; Chiu, S.H. Using independent component analysis and network DEA to improve bank performance evaluation. Econ. Model. 2013, 32, 608–616. [Google Scholar] [CrossRef]
- Fujii, H.; Managi, S.; Matousek, R. Indian bank efficiency and productivity changes with undesirable outputs: A disaggregated approach. J. Bank Financ. 2014, 38, 41–50. [Google Scholar] [CrossRef]
- Fukuyama, H.; Matousek, R. Modelling bank performance: A network DEA approach. Eur. J. Oper. Res. 2017, 259, 721–732. [Google Scholar] [CrossRef]
- Li, M.; Zhu, N.; He, K.; Li, M. Operational efficiency evaluation of Chinese internet banks: Two-stage network DEA approach. Sustainability 2022, 14, 14165. [Google Scholar] [CrossRef]
- Laporšek, S.; Trunk, A.; Stubelj, I. Productivity change in European banks in the post-crisis period. Systems 2022, 10, 186. [Google Scholar] [CrossRef]
- Shi, X.; Wang, L.; Emrouznejad, A. Performance evaluation of Chinese commercial banks by an improved slacks-based DEA model. Socio-Econ. Plan. Sci. 2023, 90, 101702. [Google Scholar] [CrossRef]
- Boubaker, S.; Le, T.D.Q.; Ngo, T. Managing bank performance under COVID-19: A novel inverse DEA efficiency approach. Int. Trans. Oper. Res. 2023, 30, 2436–2452. [Google Scholar] [CrossRef]
- Shabani, P.; Akbarpour Shirazi, M. Performance evaluation of commercial bank branches in dynamic competitive conditions: A network DEA model with serial and cross-shared resources. J. Econ. Stud. 2024, 51, 1–23. [Google Scholar] [CrossRef]


| DMU | x1 | x2 | y | Efficiency Score | ||
|---|---|---|---|---|---|---|
| BCC | SBM | SBM-Max | ||||
| A | 2 | 7 | 1 | 1 | 1 | 1 |
| B | 4.5 | 2 | 1 | 1 | 1 | 1 |
| C | 2.5 | 5 | 1 | 1 | 1 | 1 |
| D | 6 | 5 | 1 | 0.556 | 0.550 | 0.708 |
| E | 3 | 3 | 1 | 1 | 1 | 1 |
| Year | Statistics | Operating Expenses | Employment Expenses | Lending | Interest Expenses | Net Interest Income | Handling Fees | After-Tax Surplus |
|---|---|---|---|---|---|---|---|---|
| 2018 | Average | 14,653 | 8254 | 1,032,203 | 13,224 | 18,147 | 6417 | 29,009 |
| Minimum value | 1277 | 373 | 16,139 | 2037 | 1 | 91 | 3333 | |
| Maximum value | 30,118 | 15,377 | 2,592,200 | 38,259 | 34,776 | 16,527 | 58,486 | |
| Standard deviation | 7866 | 4513 | 761,217 | 9365 | 10,145 | 4825 | 15,691 | |
| Kurtosis | −0.569 | −1.051 | −0.688 | 1.403 | −0.801 | 0.409 | −0.808 | |
| Skewness | 0.134 | −0.061 | 0.347 | 1.018 | −0.200 | 1.039 | 0.062 | |
| 2019 | Average | 15,381 | 8594 | 1,082,031 | 14,712 | 18,135 | 6708 | 30,336 |
| Minimum value | 1285 | 424 | 3206 | 2560 | 1 | 291 | 1882 | |
| Maximum value | 31,940 | 15,855 | 2,676,141 | 39,355 | 34,900 | 18,725 | 60,114 | |
| Standard deviation | 8645 | 5126 | 771,205 | 9944 | 10,430 | 5480 | 16,903 | |
| Kurtosis | −0.580 | −1.220 | −0.597 | 0.414 | −0.857 | 0.303 | −0.870 | |
| Skewness | 0.273 | −0.174 | 0.387 | 0.752 | −0.136 | 1.046 | 0.015 | |
| 2020 | Average | 15,474 | 8696 | 1,162,400 | 9706 | 17,255 | 6566 | 28,791 |
| Minimum value | 1172 | 387 | 12,453 | 795 | 628 | 168 | 2868 | |
| Maximum value | 32,494 | 15,795 | 2,869,204 | 26,565 | 33,740 | 19,831 | 58,669 | |
| Standard deviation | 8838 | 5838 | 821,171 | 6844 | 10,330 | 5396 | 16,515 | |
| Kurtosis | −0.528 | 0.050 | −0.625 | 0.500 | −1.101 | 1.005 | −0.781 | |
| Skewness | 0.321 | 0.370 | 0.333 | 0.705 | −0.035 | 1.280 | 0.299 | |
| 2021 | Average | 15,597 | 9134 | 1,144,183 | 5824 | 18,011 | 6849 | 29,466 |
| Minimum value | 1249 | 379 | 22,443 | 279 | 885 | 192 | 2876 | |
| Maximum value | 31,926 | 16,718 | 2,455,870 | 13,001 | 35,731 | 21,324 | 61,210 | |
| Standard deviation | 8967 | 5428 | 864,482 | 4865 | 11,461 | 5763 | 17,256 | |
| Kurtosis | −0.647 | −1.108 | −0.848 | 0.734 | −1.301 | 1.127 | −0.832 | |
| Skewness | 0.237 | −0.189 | 0.236 | 0.816 | −0.034 | 1.245 | 0.261 |
| Banking System | DMUs | 2018 Efficiency (Rank) | 2019 Efficiency (Rank) | 2020 Efficiency (Rank) | 2021 Efficiency (Rank) |
|---|---|---|---|---|---|
| State-owned banks | Bank of Taiwan | 0.986 (13) | 0.789 (18) | 0.850 (18) | 0.780 (18) |
| Land Bank of Taiwan | 1 (1) | 1 (1) | 1 (1) | 1 (1) | |
| Changhua Commercial Bank | 0.983 (14) | 0.928 (15) | 0.946 (16) | 0.950 (15) | |
| Taiwan Cooperative Bank | 1 (1) | 1 (1) | 1 (1) | 1 (1) | |
| First Commercial Bank | 1 (1) | 1 (1) | 0.965 (12) | 1 (1) | |
| Taiwan Business Bank | 0.962 (16) | 0.945 (14) | 0.949 (15) | 0.965 (14) | |
| Overall average | 0.989 | 0.944 | 0.952 | 0.949 | |
| Private banks | Cathay United Bank | 1 (1) | 1 (1) | 1 (1) | 1 (1) |
| Shin Kong Commercial Bank | 1 (1) | 1 (1) | 1 (1) | 1 (1) | |
| E.Sun Commercial Bank | 1 (1) | 1 (1) | 1 (1) | 1 (1) | |
| Union Bank of Taiwan | 0.977 (14) | 0.996 (12) | 0.960 (13) | 0.973 (13) | |
| Taishin International Bank | 0.863 (18) | 0.879 (16) | 0.915 (17) | 0.931 (17) | |
| Yuanta Commercial Bank | 0.961 (17) | 0.991 (13) | 0.951 (14) | 0.938 (16) | |
| Overall average | 0.967 | 0.978 | 0.971 | 0.974 | |
| Foreign banks | Standard Chartered Bank | 1 (1) | 0.805 (17) | 1 (1) | 1 (1) |
| Citibank | 1 (1) | 1 (1) | 1 (1) | 1 (1) | |
| MUFG Bank | 1 (1) | 1 (1) | 1 (1) | 1 (1) | |
| The Shanghai Commercial and Savings Bank | 1 (1) | 1 (1) | 1 (1) | 1 (1) | |
| Fubon Bank | 1 (1) | 1 (1) | 1 (1) | 1 (1) | |
| UBS | 1 (1) | 1 (1) | 1 (1) | 1 (1) | |
| Overall average | 1 | 0.968 | 1 | 1 |
| Banking System | Bank | 2018 | 2019 | 2020 | 2021 |
|---|---|---|---|---|---|
| State-owned banks | Bank of Taiwan | ||||
| Land Bank of Taiwan | ☺ | ☺ | ☺ | ||
| Changhua Commercial Bank | |||||
| Taiwan Cooperative Bank | ☺ | ☺ | ☺ | ☺ | |
| First Commercial Bank | ☺ | ☺ | ☺ | ||
| Taiwan Business Bank | |||||
| Private banks | Cathay United Bank | ☺ | ☺ | ☺ | |
| Shin Kong Commercial Bank | ☺ | ||||
| E.Sun Commercial Bank | ☺ | ☺ | ☺ | ||
| Union Bank of Taiwan | |||||
| Taishin International Bank | |||||
| Yuanta Commercial Bank | |||||
| Foreign banks | Standard Chartered Bank | ☺ | ☺ | ||
| Citibank | ☺ | ☺ | ☺ | ☺ | |
| MUFG Bank | ☺ | ☺ | ☺ | ☺ | |
| The Shanghai Commercial and Savings Bank | ☺ | ☺ | ☺ | ||
| Fubon Bank | ☺ | ☺ | ☺ | ||
| UBS | ☺ | ☺ | ☺ |
| Year-Input Variable | State-Owned Banks | Private Banks | Foreign Banks |
|---|---|---|---|
| 2018—Operating expenses | 0% | 27.38% | 0% |
| 2019—Operating expenses | 4.88% | 32.06% | 29.47% |
| 2020—Operating expenses | 1.69% | 35.00% | 0% |
| 2021—Operating expenses | 2.96% | 39.53% | 0% |
| Overall average | 2.38% | 33.49% | 7% |
| 2018—Employment expenses | 55.14% | 29.97% | 0% |
| 2019—Employment expenses | 20.46% | 36.91% | 44.48% |
| 2020—Employment expenses | 21.12% | 21.87% | 0% |
| 2021—Employment expenses | 12.12% | 36.29% | 0% |
| Overall average | 27.21% | 31.26% | 11% |
| 2018—Lending | 40.67% | 42.63% | 0% |
| 2019—Lending | 43.57% | 31.03% | 0% |
| 2020—Lending | 41.49% | 37.70% | 0% |
| 2021—Lending | 43.98% | 17.46% | 0% |
| Overall average | 42.43% | 32.20% | 0% |
| 2018—Interest expenses | 4.19% | 0.02% | 0% |
| 2019—Interest expenses | 31.09% | 0% | 0% |
| 2020—Interest expenses | 35.70% | 5.43% | 0% |
| 2021—Interest expenses | 40.95% | 6.72% | 0% |
| Overall average | 27.98% | 3.04% | 0% |
| Year-Input Variable | State-Owned Banks | Private Banks | Foreign Banks |
|---|---|---|---|
| 2018—Operating expenses | 0% | 27.38% | 0% |
| 2019—Operating expenses | 4.88% | 32.06% | 29.47% |
| 2020—Operating expenses | 1.69% | 35.00% | 0% |
| 2021—Operating expenses | 2.96% | 39.53% | 0% |
| Overall average | 2.38% | 33.49% | 7% |
| 2018—Employment expenses | 55.14% | 29.97% | 0% |
| 2019—Employment expenses | 20.46% | 36.91% | 44.48% |
| 2020—Employment expenses | 21.12% | 21.87% | 0% |
| 2021—Employment expenses | 12.12% | 36.29% | 0% |
| Overall average | 27.21% | 31.26% | 11% |
| 2018—Lending | 40.67% | 42.63% | 0% |
| 2019—Lending | 43.57% | 31.03% | 0% |
| 2020—Lending | 41.49% | 37.70% | 0% |
| 2021—Lending | 43.98% | 17.46% | 0% |
| Overall average | 42.43% | 32.20% | 0% |
| 2018-Interest expenses | 4.19% | 0.02% | 0% |
| 2019-Interest expenses | 31.09% | 0% | 0% |
| 2020—Interest expenses | 35.70% | 5.43% | 0% |
| 2021—Interest expenses | 40.95% | 6.72% | 0% |
| Overall average | 27.98% | 3.04% | 0% |
Disclaimer/Publisher’s Note: The statements, opinions and data contained in all publications are solely those of the individual author(s) and contributor(s) and not of MDPI and/or the editor(s). MDPI and/or the editor(s) disclaim responsibility for any injury to people or property resulting from any ideas, methods, instructions or products referred to in the content. |
© 2024 by the authors. Licensee MDPI, Basel, Switzerland. This article is an open access article distributed under the terms and conditions of the Creative Commons Attribution (CC BY) license (https://creativecommons.org/licenses/by/4.0/).
Share and Cite
Lee, C.-F.; Yang, F.-C. Performance Evaluation of the Taiwanese Banking Industry before and after the COVID-19 Pandemic. Mathematics 2024, 12, 2817. https://doi.org/10.3390/math12182817
Lee C-F, Yang F-C. Performance Evaluation of the Taiwanese Banking Industry before and after the COVID-19 Pandemic. Mathematics. 2024; 12(18):2817. https://doi.org/10.3390/math12182817
Chicago/Turabian StyleLee, Chuan-Feng, and Fu-Chiang Yang. 2024. "Performance Evaluation of the Taiwanese Banking Industry before and after the COVID-19 Pandemic" Mathematics 12, no. 18: 2817. https://doi.org/10.3390/math12182817