Abstract
As a part of the service industry, product design practitioners should possess an understanding of the multifaceted factors and solutions that contribute to delivering exceptional service quality. However, related research on the service quality factors and solutions for China’s ceramic product design industry is still an important research gap. In view of this, an integrated approach based on multi-criteria decision making (MCDM), combining the fuzzy analytic hierarchy process (FAHP) and the measurement of alternatives and ranking according to compromise solution (MARCOS), was proposed in this research to analyse and evaluate the service quality factors and solutions for China’s ceramic product design industry. Initially, the FAHP method determined the significance of the service quality dimensions and indicators. Subsequently, the MARCOS method ranked the alternatives based on their performance against these criteria. This research focuses on the growing subject of service quality in China’s ceramic product design industry. The proposed model identifies essential service quality factors and solutions for China’s ceramic product design industry. The findings of this study may assist ceramic product design practitioners in China in making strategic decisions to provide excellent service quality.
Keywords:
SERVQUAL scale; fuzzy analytic hierarchy process (FAHP); the measurement of alternatives and ranking according to compromise solution (MARCOS); multi-criteria decision making (MCDM); integrated method MSC:
68U35
1. Introduction
As one of the oldest civilisations, China has a rich history in ceramics. As a result, many studies on China’s ceramic industry have been published in recent decades. For example, Li [1] mentioned that Chinese ceramic products are famous for their refined artistry and durable quality. Heimann [2] reported that the significant development of Chinese ceramic products occurred during the Ming Dynasty, when potters put more emphasis on quality and artistic expression. The world-famous Jingdezhen “Blue and White” porcelain displays a fusion of delicate artistry and technical mastery that set a benchmark for ceramic design. Many scholars [3,4,5] have noted that China’s ceramic art continues to thrive in the modern era, combining ancient practices with the latest technologies. Mahendri et al. [6] added that contemporary artisans are incorporating cultural motifs into their wares to meet the needs of domestic and global markets and to emphasise continued relevance in an ever-connected world. In addition, Yu et al. [7] discussed the differences in opinions between Jingdezhen ceramic product manufacturers and consumers from the perspective of consumers’ purchasing experience. Mirfakhradini et al. [8] studied the impact of consumer opinions on the new ceramic product development process. Duy et al. [9] discussed the factors related to promoting consumer satisfaction and loyalty in the ceramic industry. Lin [10] and Guo et al. [11] studied the differences in consumer perspectives to find out the sustainable development factors and strategies for the Jingdezhen ceramic product industry.
Furthermore, some scholars have begun to consider the service capabilities of China’s ceramic industry to meet future challenges. For example, Lo et al. [12] examined the competitive strategies of China’s ceramic industry in the globalised economic environment. They found that the industry needs to evolve into a service industry by offering a range of customised design services to meet the changes and challenges of this environment. Ke [13] suggested that China’s ceramic industry should transform towards the cultural and creative industry, enhancing the economic scale and influence of the ceramic industry by providing cultural and creative content services. Li et al. [14] explored the influence of information technology adoption on the ceramic design industry. They noted that technologies such as VR or intelligent manufacturing have the potential to significantly enhance the industry’s capacity to deliver design services in the post-pandemic era. Tian et al. [15] reported that China’s ceramic industry should strengthen its industrial production and design service capabilities, largely due to the challenges brought by the COVID-19 epidemic.
In 2023, Wang et al. [16] proposed a novel MCDM method that combines entropy-based objective weighting and the MARCOS method to evaluate 3PL providers’ sustainable performance. Miškić et al. [17] developed an integrated MEREC–MARCOS evaluation model of the logistics performance index of European Union (EU) countries with an emphasis on sensitivity analysis, which implies a change in the importance of criteria. Badi [18] proposed a hybrid MCDM framework to analyse and evaluate wind farm locations in Libya.
In 2024, Ristić et al. [19] discussed the evaluation of pedestrian crossings based on pedestrian behaviour, particularly focusing on the start-up time. They employed an integrated fuzzy multi-criteria decision-making (MCDM) model to analyse how different age groups and genders influence pedestrian behaviour and the rankings of various cities regarding their pedestrian crossing characteristics.
In addition, Wan et al. [20] have presented a study investigating the service quality of Yue Kiln Celadon in China. The study examined service quality indicators and potential solutions for China’s yue kiln celadon industry in the post-pandemic era through the use of a hybrid MCDM methodology. The authors argued that service quality is paramount in this new landscape. Key indicators of such excellent service quality, including robust safety mechanisms, high-calibre personnel and tailored service capabilities, were considered essential for China’s ceramic-related industries to deliver exceptional service in the post-pandemic world. It is noteworthy that Lin et al. [21] conducted a study to evaluate service quality solutions within the design industry. Using an evaluation framework based on the SERVQUAL scale, they applied a hybrid MCDM method in a fuzzy environment to analyse and rank service quality indicators and solutions. The research undertaken by these two research teams represents some of the most recent findings concerning service quality within the ceramics and design industries during the post-COVID-19 era.
Despite this, there is still a lack of related research using the SERVQUAL scale to measure service quality in China’s ceramic product design industry. Therefore, we first attempted to establish a service quality evaluation framework based on the SERVQUAL scale, specifically tailored to China’s ceramic product design industry. Subsequently, the weights of service quality aspects and indicators relevant to this industry were analysed and calculated. Subsequently, service quality solutions were evaluated and ranked with the aim of providing relevant decision-making suggestions to promote the provision of exemplary service quality in China’s ceramic product design industry. In view of this, we established a framework grounded in the SERVQUAL scale to measure service quality within China’s ceramic product design industry. This was achieved through questionnaires distributed amongst experts in the field. Subsequently, the fuzzy analytic hierarchy process (FAHP) was employed to calculate the weights of dimensions and indicators. Finally, we utilised the measurement of alternatives and ranking according to the compromise solution (MARCOS) to rank all alternatives, thereby addressing the following research objectives:
- To construct the evaluation structure based on the SERVQUAL scale for China’s ceramic product design service quality.
- To analyse and calculate the weight of dimensions and indicators using FAHP.
- To evaluate and rank all solutions using MARCOS.
- To provide related decision-making suggestions for China’s ceramic product design industry for providing excellent service quality.
This paper begins with a review of the existing literature on the SERVQUAL scale FAHP and MARCOS (Section 2). Section 3 details the methodology, including the construction of the evaluation framework and the calculation processes of FAHP and MARCOS models. Section 4 presents the results of numerical analysis and research findings. Section 5 discusses the research findings. Lastly, Section 6 offers conclusions.
2. Literature Review
When multiple criteria influence a choice, the challenge is classified as multi-criteria decision-making (MCDM), requiring decision-makers to weigh numerous elements before choosing a course of action from a range of methodologies [22,23]. Li et al. [24] highlighted a key advantage of MCDM approaches: they empower decision-makers to prioritise risk and financial gain while minimising the weight given to other aspects. Similarly, Kou et al. [25] analysed and calculated data from small-scale studies and demonstrated the effectiveness of MCDM techniques in tackling a variety of MCDM-related problems.
In this research, the assessment framework of service quality for China’s ceramic product design industry is constructed based on the SERVQUAL scale. In addition, two MCDM methods, namely FAHP and MARCOS, are employed to evaluate and rank service quality aspects, indicators and potential solutions.
The relevant research gaps are discussed in this section, and the SERVQUAL scale, FAHP and MARCOS are explored.
2.1. Research Gaps
In terms of methodology, this paper proposes a model that combines FAHP and MARCOS methods for the first time to evaluate the service quality of China’s ceramic product design industry. In the MCDM process, the determination of the criterion weight is crucial, as it greatly affects the results [26]. Therefore, both Odu [27] and Deng et al. [28] mentioned that using mathematical methods to obtain weights is conducive to data-based structural analysis and improves the decision-making level.
Additionally, Kumar et al. [29] presented an application of upgraded arithmetic operations on fuzzy numbers to extend the reliability from point estimation to interval estimation. Also, Dhiman et al. [30] explored the reliability of Ultra-Low Temperature (ULT) freezers under a fuzzy environment, particularly in the context of their critical role during the COVID-19 pandemic for vaccine storage. They delved into how preventive maintenance and situational factors can influence the performance of these essential machines. Their findings aim to enhance our understanding of ULT freezers and ensure they operate effectively when needed most. Moreover, Kumar et al. [31] discussed the performance analysis of an “Injection Moulding Machine” under a fuzzy environment. The above research is one of the latest studies to apply fuzzy numbers to the field of MCDM, demonstrating the feasibility of fuzzy methods for solving MCDM problems.
Despite this, there is a lack of hybrid MCDM methods for service quality assessment in China’s ceramic industry under a fuzzy environment. The hybrid method of FAHP and MARCOS proposed in this study helps to improve the robustness of the method. Although several studies focus on the ceramic product design industry, there are few studies on service quality in this industry. This highlights some new characteristics of China’s ceramic product design industry that have received little attention in previous studies. Therefore, this article aims to fill this gap.
2.2. SERVQUAL Scale
The SERVQUAL scale, developed by Parasuraman, Zeithaml and Berry [32], is a multi-item scale used to measure customer perceptions of service quality. It assesses the gap between customer expectations and perceptions across five dimensions: tangibility, reliability, responsiveness, assurance and empathy, as shown in Table 1.

Table 1.
Five main dimensions of the SERVQUAL scale.
The SERVQUAL scale examines five dimensions of service quality using 22 indicators [33,34,35]. Also, customer perception is gauged using a fuzzy-like Likert scale [36]. Moreover, the following equation is employed to determine the discrepancy between each dimension of service quality and customer expectations for analysing the specific characteristics of different industries and services [37].
where is SERVQUAL scale dimension, is the number of questions in dimension, is the average of perceptions, is the average of expectations and is the gap between every dimension.
If is positive, the service quality level is higher in dimension than the customer expectations. On the contrary, the service quality level is lower than customer expectations. Accordingly, a reasonable score of service quality level can be calculated by weighting if the weight value of each industry indicator in the SERVQUAL scale is obtained.
The SERVQUAL scale’s robustness and accuracy have been substantiated by researchers across diverse disciplines [38,39,40,41,42]. Notably, several studies [43,44,45,46,47,48] have demonstrated the viability of integrating the SERVQUAL scale with MCDM techniques for assessing service quality.
Given this established efficacy, this paper utilises the SERVQUAL scale to analyse and categorise customer requirements.
2.3. Fuzzy Analytic Hierarchy Process (FAHP)
Analytic Hierarchy Process (AHP) was first introduced by Saaty [49]. It stands out as a comprehensive technique for addressing MCDM challenges across diverse fields, its efficacy confirmed by numerous studies [50,51,52]. This method excels at structuring complex problems and breaking them down into manageable levels for thorough evaluation and quantitative assessment.
However, AHP falls short in addressing uncertainties inherent in real-world scenarios. To overcome this limitation, Chang [53], in 1996, pioneered an integrated approach combining fuzzy logic with AHP, termed Fuzzy AHP (FAHP). This innovative method effectively handles and computes decision-making challenges arising from imprecise or ambiguous information.
Over recent decades, FAHP has gained widespread adoption and recognition as a highly dependable and robust research method for tackling MCDM problems, as evidenced by its successful application in various studies [54,55,56,57,58].
2.4. Measurement of Alternatives and Ranking According to Compromise Solution (MARCOS)
The measurement of alternatives and ranking according to compromise solution (MARCOS) was first proposed in 2020 [59]. It is an innovative and effective MCDM technique. It revolutionises the decision-making process by addressing several shortcomings of other methods. In particular, MARCOS tackles issues such as overlooking the relative importance of distances and reduces the burden of exhaustive calculations. The approach takes into account various parameters related to the performance of alternatives and uses utility-based functions to determine their final performance scores.
In recent years, Puška et al. [60] applied MARCOS to the performance assessment field of software project management. Chakraborty et al. [61] proposed a supplier selection model using an integrated method of D numbers and MARCOS. D numbers are a mathematical tool used to represent and manage uncertainty in decision-making processes. They are an extension of the Dempster–Shafer (D-S) theory [62]. They are particularly useful in situations where information is incomplete or ambiguous. Ali [63] developed a solid waste management model using MARCOS under a fuzzy environment. El-Araby [64] published a research work in 2023 and reported that MARCOS is a new method that is very suitable for application in the field of engineering decision-making because it is not easily affected by the rank reversal phenomenon (RRP). Badi et al. [65] developed a supplier selection model for the steelmaking industry using a hybrid approach of the grey system and the MARCOS method.
More recently, some scholars have started to apply the MARCOS method to the sustainability field. For example, Puška et al. [66] proposed a selection model of a sustainable supplier industry using MARCOS under an uncertain environment. Badi et al. [67] and Pamucar et al. [68] assessed sustainable performance indicators for the green innovation and road transportation industries using an integrated method of FUCOM and MARCOS. In 2023, two groups of scholars [69,70] established an assessment framework for zero-carbon mobility and fibre fabric recycling using the MARCOS methodology.
2.5. Summary
Based on the literature review, the methods of FAHP and MARCOS have proven effective in addressing MCDM problems within sustainability fields. Notably, Tešić et al. [71] highlighted the MARCOS method as a powerful and robust tool for multi-objective optimisation, employing both ratio and reference point methods to generate a comprehensive decision information scheme. Meanwhile, Ecer [72] argued that the MARCOS model exhibits remarkable flexibility and capability, particularly when handling MCDM models. Crucially, its ease of use is maintained even with an increasing number of criteria or options.
Also, the MARCOS method is characterised by its simplicity, effectiveness and ease of extension compared to other methods. For example, compared to the TOPSIS method, MARCOS demonstrates superior stability and robustness of results when adjustments are made to the measurement scales of decision attributes [73]. Moreover, the MARCOS method shows an exceptionally high-rank correlation with established MCDM methods such as MABAC, SAW, ARAS, WASPAS and EDAS [74].
Furthermore, the evaluation criteria for each alternative are obtained by integrating expert opinions into the FAHP model. Therefore, the disadvantage of such models is that they rely on expert experience and are prone to subjective opinions.
In view of this, many scholars [75,76,77] suggested utilising MARCOS as another way to assess the importance of evaluation indicators, thus avoiding interference with the result by the subjective opinion of experts.
Accordingly, in this paper, the service quality assessment framework of China’s ceramic product design industry will be established based on the SERVQUAL scale. Subsequently, the overall weights of dimensions and indicators will be calculated by FAHP. Finally, the MARCOS method will then be used to rank the alternatives to meet the primary objectives of the research.
3. Materials and Methods
In this research, we present an integrated approach of FAHP and MARCOS that is based on the SERVQUAL scale to evaluate the service quality of China’s ceramic product design industry. The process of this research is shown in Figure 1.
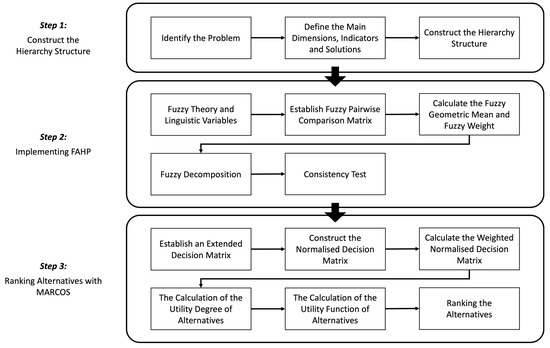
Figure 1.
The process of this research.
3.1. The Construction of Hierarchy Structure
To construct the evaluation framework, we decomposed the problem into evaluation criteria and alternatives in accordance with the research methods. In addition, Tsai et al. [78] mentioned that the description of evaluation criteria and solutions should be reviewed and revised via expert discussion. Accordingly, a total of ten experts were invited to establish a focus group for this study. Among these, three are senior managers in ceramic product design-related industries, four are senior creative directors and the other three are senior ceramic product designers.
Subsequently, each focus group member independently scrutinised every dimension, indicator and potential solution, utilising their professional background and the SERVQUAL scale as guides. This assessment sought to ascertain whether the descriptions were congruent with the study’s aims. Thereafter, they engaged in an inductive examination for the assessment criteria and solutions to construct an initial hierarchy structure for the research, including 5 main dimensions, 14 indicators and 4 solutions, as shown in Figure 2.
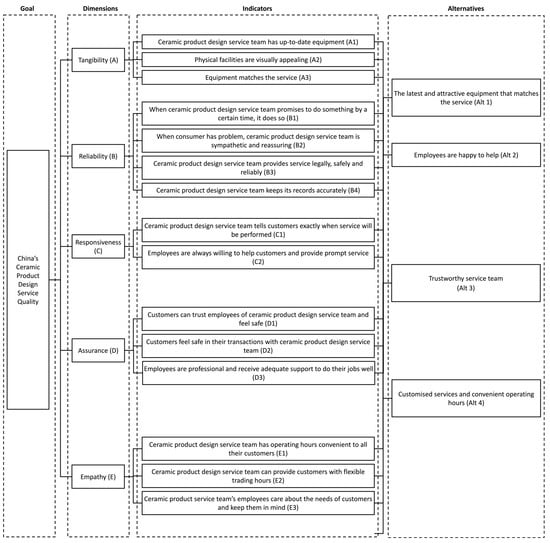
Figure 2.
The initial hierarchy structure.
After an initial hierarchy structure was constructed, a preliminary test was conducted to ascertain the coherence and adequacy of the semantic portrayal. A total of 112 expert questionnaires were disseminated, with 73 valid responses retrieved. According to the results of the pre-test, most experts mentioned that the semantic meanings of some indicators were too close. Taking the dimension of assurance as an example, the semantics of the two indicators D1 and D2 will prevent the test subjects from correctly assessing the importance. Similarly, in the empathy dimension, the semantics of E1 and E2 were also very close, so appropriate modifications need to be made. Meanwhile, the number of indicators and solutions in the initial hierarchical structure was not sufficient to evaluate the service quality of the ceramic product design industry. In addition, solutions related to customer needs and employee quality should also be considered in this research.
Accordingly, we invited another ten experts to review and revise the description and phrasing of each dimension, indicator and potential solution in accordance with the SERVQUAL scale and the findings of the pre-test. For example, the experts reviewed each indicator in the assurance and empathy dimensions based on the pre-test results and revised them based on the SERVQUAL scale to ensure that the description of each indicator met the requirements of service quality assessment. In the meantime, the experts also mentioned that the number of indicators in the three dimensions of responsiveness, assurance and empathy was indeed insufficient. Therefore, they revised the number of indicators in these three dimensions. In addition, the experts added solutions related to potential customer needs and employee quality to the hierarchical structure.
Following this, the evaluation structure of service quality assessment for China’s ceramic product design industry based on the SERVQUAL scale was constructed, including 5 main dimensions, 17 indicators and 6 solutions, as shown in Figure 3.
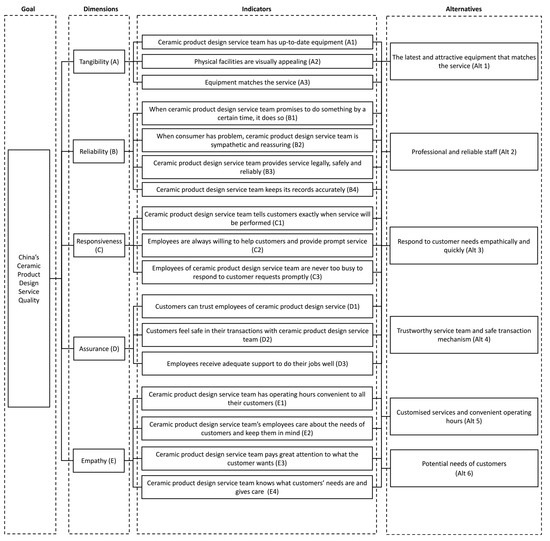
Figure 3.
The evaluation structure of this research.
3.2. Questionnaire Development and Measurement
This research utilises an expert questionnaire method to obtain and gather research data for calculating the overall weight (OW) and the utility function of each dimension, indicator and solution in the hierarchy structure, according to FAHP and MARCOS methods. Therefore, there is a need to consider validity before questionnaire development. In view of this, this study rewrites the questionnaire statement on the basis of expert advice and keeps the original representation of dimensions and indicators in order to maintain high content validity [79]. In addition, this study conducts a pre-test and revises the statements according to the results of the pre-test to check whether the meaning of the questionnaire was clear.
As for the number of experts, F. J. Parenté and J. K. Anderson-Parenté [80] suggested that there should be at least ten experts or more. Interestingly, Darko et al. [81] mentioned that a large sample size may not be helpful, because “cold-called” experts could profoundly affect the result of consistency examination. We found that much research [82,83,84,85,86,87] utilised a small sample size of four to nine experts to obtain a valuable and reliable decision-making basis.
Accordingly, a total of 30 experts were selected for this research to avoid the influence of opinions from “cold-called” experts on the consistency evaluation results, thus achieving our main research objectives. These experts were divided into two groups of 15. One group completed the pairwise comparison questionnaires and used the FAHP method for calculation and analysis. Another group of experts rated the solutions according to their relative importance, which was then calculated and ranked using the MARCOS method.
3.3. Fuzzy Analytic Hierarchy Process (FAHP)
3.3.1. Fuzzy Theory and Linguistic Variables
Herrera et al. [88] asserted that linguistic markers like “very important”, “somewhat important” and “not important” are frequently used to depict how individuals understand the significance of a specific issue. However, Zimmermann [89] observed that these linguistic markers, when employed to articulate the weight of human psychological understanding, often lack clarity. Therefore, it is crucial to integrate fuzzy theory to offer a more precise depiction of human interpretation of these matters.
Fuzzy theory was first proposed by Dr. Lotfi Zadeh [90], addressing problems encountered in uncertain environments. It is an algorithm that operates on fuzzy numbers, which incorporates a reasoning-like process to determine the outcome most aligned with human psychological perception.
In view of this, the fuzzy numbers were studied and it was discovered that their representation is often mathematical in nature [91,92,93,94]. For instance, a triangular fuzzy number can be denoted as (, , ), where the parameters , and represent the smallest, most likely and largest values, respectively. Figure 4 illustrates a triangular fuzzy number (, , ) as defined by the following equation:
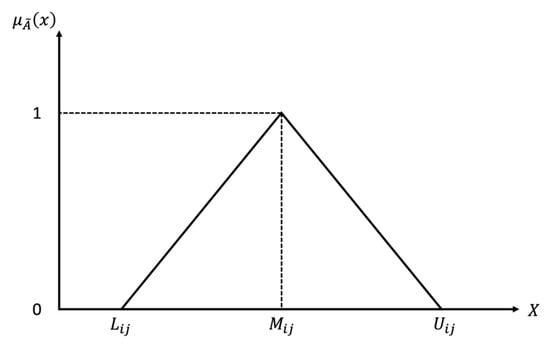
Figure 4.
Fuzzy triangular numbers [95].
Meanwhile, much research [96,97,98,99] mentioned that the most likely evaluation value of triangular fuzzy numbers is the crisp value. The crisp value of triangular fuzzy numbers is given by the following equation.
Additionally, Buckley [100] reported that the characteristics of triangular fuzzy numbers are helpful in accurately presenting human fuzzy psychological perception variables by converting fuzzy numbers into clear and practical numbers. Moreover, triangular fuzzy numbers have been proven by Pedrycz [101] to be very suitable for expressing the degree of relative psychological perception and judgment of each criterion and alternative in the hierarchy and network structure. Accordingly, triangular fuzzy numbers are utilised to represent linguistic variable scales in this research.
Furthermore, AHP used a nine-point evaluation scale to indicate the importance of each evaluation criterion. Therefore, we integrate the triangular fuzzy number and AHP evaluation scale for assessing and measuring human psychological true preferences for specific options. The corresponding fuzzy numbers are provided in Table 2 [102].
Table 2.
Fuzzy numbers and linguistic variables.
3.3.2. The Construction of Fuzzy Pairwise Comparison Matrix
In this step, a fuzzy pairwise comparison matrix is performed and presented as follows:
where represents the fuzzy pairwise comparison matrix and is the triangular fuzzy mean value for comparing priority pairs among elements.
3.3.3. The Calculation of Fuzzy Geometric Mean () and Fuzzy Weight ()
The calculation of fuzzy geometric mean and fuzzy weight is as follows:
where represents the operation of Kronecker product.
3.3.4. Defuzzification
In terms of fuzzy decomposition, the optimism index (, ) is utilised to combine the smallest and largest values of triangular fuzzy numbers (, ) for defuzzification [103,104,105]. Thus, the process of fuzzy decomposition is as follows:
where
When the diagonal matrix is matching, we have
where is the value of fuzzy decomposition.
3.3.5. Consistency Check
Saaty [106] proposed adopting the consistency index (C.I.) and consistency ratio (C.R.) to verify the consistency of the comparison matrix. The C.I. and C.R. are defined as follows:
where is the maximum value of the matrix and is the number of criteria.
Random index (R.I.) is a consistency index produced by positive reciprocal matrices of different orders 2 to 14 generated from the integer set 1 to 9 [107]. It depends on the number of involved criteria [108]. Table 3 shows the values of the random index.
Table 3.
Random index (R.I.) values.
When , it refers to the best acceptable error. When , it means that the consistency of the matrix is satisfactory.
3.4. Measurement of Alternatives and Ranking According to Compromise Solution (MARCOS)
3.4.1. Establish an Extended Decision Matrix
The extended decision matrix is performed as follows:
The ideal () solution represents an alternative with the highest performance, whereas the anti-ideal () solution denotes the least desirable alternative. Depending on the characteristics of the criteria, the and sets are established as follows:
where denotes a benefit group of criteria while denotes a group of cost criteria.
3.4.2. Construct the Normalised Decision Matrix
The normalised decision matrix can be calculated using the following equations.
where and represent the elements of the matrix .
3.4.3. Calculate the Weighted Normalised Decision Matrix
The weighted matrix is obtained by multiplying the normalised matrix with the weight coefficient of each criterion using the following equation.
3.4.4. The Calculation of the Utility Degree of Alternatives
The utility degrees of an alternative in relation to the ideal () and anti-ideal () solution are calculated as follows:
where signifies the summation of the elements within the weighted matrix , illustrated in the following equation.
3.4.5. The Calculation of the Utility Function of Alternatives
The utility function of alternatives is calculated as follows:
where the utility functions concerning the ideal and anti-ideal solutions are determined using the following equations.
3.4.6. Ranking the Solutions
Within the MARCOS model, all potential solutions are ranked according to the final values of the utility function, denoted as . The most favourable alternative is identified as the one that is closest to the ideal and at the same time furthest from the anti-ideal reference point. This implies that potential solutions with higher utility function values are considered more desirable.
4. Results
4.1. Numerical Analysis
4.1.1. Fuzzy Analytic Hierarchy Process (FAHP)
As for the construction of a fuzzy pairwise comparison matrix, we gathered the opinions and integrated the perspectives of 15 experienced ceramic product design experts. Subsequently, the fuzzy pairwise comparison matrix was established using Equation (4), as shown in Table 4.
Table 4.
The fuzzy pairwise comparison matrix of the five main dimensions from the FAHP model.
Subsequently, the fuzzy geometric mean values of the five main dimensions are calculated through the use of Equation (5), as shown in Table 5.
Table 5.
The calculation of fuzzy geometric mean values for the main dimensions.
The calculation process of fuzzy weight () for each dimension using Equation (6) is shown in Table 6.
Table 6.
The calculation of fuzzy weight for the main dimensions.
As for fuzzy decomposition, this study utilises and during the defuzzification [109,110,111]. The process of fuzzy decomposition for dimensions between tangibility (A) and reliability (B) is as follows:
The processes of fuzzy decomposition for the remaining main dimensions are like the above calculation. Subsequently, the de-fuzzified pairwise comparison matrix for the five main dimensions from the FAHP model is shown in Table 7.
Table 7.
The de-fuzzified pairwise comparison matrix of five dimensions from the FAHP model.
The calculation of the maximum individual value () for each dimension is shown in Table 8.
Table 8.
The maximum individual value calculation process.
The calculation process of weight (ω) for each dimension is shown in Table 9.
Table 9.
The calculation of weight for the five dimensions.
The calculation of the normalised matrix is shown in Table 10.
Table 10.
Normalised matrix calculation.
The calculation of the maximum eigenvector () is shown in Table 11.
Table 11.
The calculation of the maximum eigenvector for the five main dimensions.
Since the numbers of main dimensions are 5, we obtain . Therefore, and are calculated as follows:
For , with , we have .
The calculation results of the de-fuzzified pairwise comparison matrix between five main dimensions are shown in Table 12.
Table 12.
The pairwise comparison matrix for five main dimensions from the FAHP model.
The calculation processes of defuzzification, maximum eigenvalue (), consistency index () and consistency ratio () for all indicators are like the above calculations. Subsequently, the de-fuzzified pairwise comparison matrix for all sub-criteria is shown in Table A1, Table A2, Table A3, Table A4 and Table A5.
As shown in Table A1, Table A2, Table A3, Table A4 and Table A5, values of the consistency index (C.I.) and consistency ratio (C.R.) for all criteria are less than 0.1. This means that the result of the consistency tests is acceptable.
After passing the consistency test, the overall weight (OW) of all indicators in the FAHP model was calculated using Super Decisions software 3.2. This software was developed by Prof. Saaty [112], the inventor of the analytic hierarchy process (AHP), and is suitable for obtaining the OW of all criteria. The OW of all indicators in the FAHP model is shown in Table 13.
Table 13.
The overall weight of all indicators in the FAHP model.
4.1.2. Measurement of Alternatives and Ranking according to Compromise Solution (MARCOS)
After obtaining the overall weight of all indicators from the FAHP model, the MARCOS method was applied to rank all alternatives. The ideal (AI) and anti-ideal (AAI) solutions in relation to each criterion are determined. The ideal (AI) is the highest value of each criterion while the lowest value is the anti-ideal (AAI).
The extended decision-making matrix was established using Equation (13), as shown in Table 14.
Table 14.
Extended decision-making matrix of the MARCOS model.
Subsequently, the normalised decision-making matrix was constructed using Equations (16) and (17), as shown in Table A6.
The values of the weighted normalised decision-making matrix shown in Table A7 were obtained by applying Equation (18): .
The calculations of utility degrees for all alternatives () in the MARCOS model using Equations (19)–(21) are shown in Table A8.
4.2. Research Result
4.2.1. Fuzzy Analytic Hierarchy Process (FAHP)
In the FAHP model, all dimensions and indicators are ranked based on overall weight (OW). As for the calculation of the OW, all data in the de-fuzzified pairwise comparison matrix were input into Super Decisions software. Subsequently, the OW of main dimensions and indicators were obtained, as shown in Figure 5 and Figure 6.
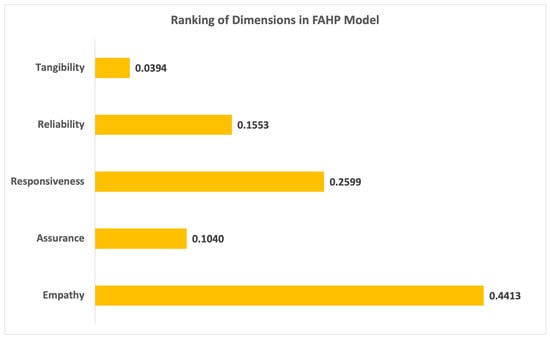
Figure 5.
The ranking of all the dimensions in the FAHP model.
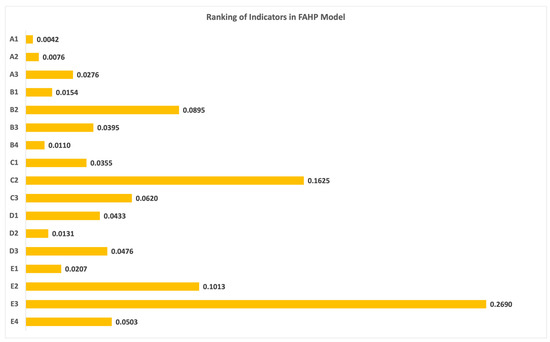
Figure 6.
The ranking of all the indicators in the FAHP model.
As shown in Figure 5, the dimensions were ordered by OW as empathy (0.4413), responsiveness (0.2599), reliability (0.1553), assurance (0.104) and tangibility (0.0394).
As shown in Figure 6, the top three indicators in terms of OW were “Ceramic product design service team pays great attention to what the customer wants” (E3, 0.269), “Employees are always willing to help customers and provide prompt service” (C2, 0.1625) and “Ceramic product design service team’s employees care about the needs of customers and keep them in mind” (E2, 0.1013).
The OWs of indicators ranked fourth to sixth were “When consumer has problem, ceramic product design service team is sympathetic and reassuring” (B2, 0.0895), “Employees of ceramic product design service team are never too busy to respond to customer requests promptly” (C3, 0.062) and “Ceramic product design service team knows what customers’ needs are and gives care” (E4, 0.053).
4.2.2. Measurement of Alternatives and Ranking according to Compromise Solution (MARCOS)
In the MARCOS model, the ranking of all alternatives was determined by the value of the final utility function (). The final utility function value of all alternatives was calculated using Equations (22)–(24), as shown in Table 15.
Table 15.
The final utility function value of all alternatives.
The ranking result of all alternatives based on the final utility function value in the MARCOS model is shown in Figure 7.
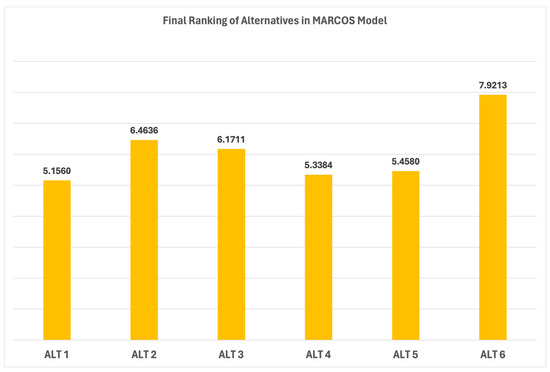
Figure 7.
The ranking of all alternatives in the MARCOS model.
In Figure 7, “Potential needs of customers” (ALT 6, 7.9213) ranked first, followed by “Professional and reliable staff” (ALT 2, 6.4636), “Respond to customer needs empathically and quickly” (ALT 3, 6.1711) and “Customised services and convenient operating hours” (ALT 5, 5.458). In addition, “Trustworthy service team and safe transaction mechanism” (ALT 4, 5.3384) and “The latest and attractive equipment that matches the service” (ALT 1, 5.156) were ranked fourth and fifth.
5. Discussion
5.1. Sensitivity Analysis of Criteria Weight
In MCDM problems, the input data are often fluid and constantly changing, as opposed to being consistent and stable. Therefore, sensitivity analysis is essential to support the decision-making process. In this study, sensitivity analysis in the context of MCDM problems is used to assess the impact of changes in the weighting of a single criterion on the overall results. These changes include adjustments to the weighting of other criteria and variations in the final ranking of options [113].
For this purpose, each criterion is removed in turn, resulting in 18 scenarios for sensitivity analysis of criteria weight. The weight of all criteria and the prospect value of alternatives in all scenarios are shown in Table A9 and Table A10. The ranking is visualised in Figure 8.
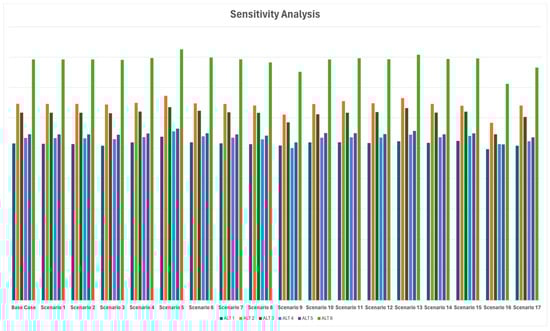
Figure 8.
The ranking of alternatives in all scenarios.
While the prospect values changed, the final ranking remains largely consistent, identifying “Potential needs of customers” (ALT 6) as the optimal solution. These results from the sensitivity phase indicate a robust alternative ranking that is insensitive to changes in criteria weights. This demonstrates the high stability and applicability of the proposed FAHP-MARCOS model.
5.2. Implications for Research
In this research, a hybrid MCDM method was proposed to exploit the strengths of both FAHP and MARCOS, thereby increasing robustness and mitigating the limitations of each method. Meanwhile, by applying this hybrid MCDM method to real-world data, the study ensures greater objectivity and reduces bias, providing more practical insights for decision making by practitioners in China’s ceramic product design industry.
Also, the hybrid MCDM method proposed in this study will positively help practitioners in the ceramic product design industry to understand the service quality index and solutions to provide excellent service quality. Therefore, China’s ceramic product design practitioners can use the proposed priorities of the indicator to compare their own industry’s priorities with the ideal proposed rankings.
Moreover, the main criteria, including empathy, responsiveness and reliability, emerge as the three most significant in the FAHP model. In terms of indicator ranking, “Ceramic product design service team pays great attention to what the customer wants” ranks first, followed by “Employees are always willing to help customers and provide prompt service” and “Ceramic product design service team’s employees care about the needs of customers and keep them in mind”. Thus, practitioners in the ceramic product design industry should give priority to these identified indicators for providing good service quality. It is important to note that while relevant indicators such as “Ceramic product design service team keeps its records accurately”, “Physical facilities are visually appealing” and “Ceramic product design service team has up-to-date equipment” may appear lower in the ranking, this reflects their relative priority within the context of this study’s decision model. It should not be interpreted as meaning that these indicators are not important at all.
In addition, this research makes a scientific contribution by demonstrating the effectiveness of the proposed hybrid MCDM method. It shows how the FAHP and MARCOS methods can help in understanding the factors and solutions related to Chinese ceramic product design. Furthermore, the relative priority of service quality factors was analysed, evaluated and presented in the outcome of this study.
5.3. Implications for Management
For China’s ceramic product design industry, understanding these solutions of excellent service quality for making the right choices is a major decision-making challenge. Making this choice is critical to helping companies achieve their service goals. According to the findings of this study, the potential needs of customers, well-qualified staff and the response speed to customer needs will contribute to the service quality of the ceramic product design industry. Therefore, the ceramic product design industry should work with suppliers to develop new standards to meet the requirement of excellent service quality.
Finally, this fundamental change in approach has implications for management across related sectors. The proposed model is tailored to China’s ceramic product design industry, offering valuable perspectives for ceramic product designers as well as for business, management and industry professionals in related fields.
5.4. Research Limitations
This research proposed an integrated MCDM method by combining FAHP and MARCOS. In the FAHP model, the pairwise comparison of the importance of the indicators and the values of C.I. and C.R. were used to verify the indicators’ progression and consistency. As for the ranking of solutions, it was analysed and calculated using MARCOS.
The research results were obtained based on the opinions of experts. Therefore, the research findings are contingent upon expert opinions, constituting a limitation of this study. To mitigate this, the research involved the participation of highly experienced experts in completing the questionnaire.
In addition, more than half of the experts involved in completing the questionnaire were Chinese professionals within the ceramic design industry, aged between 34 and 56 years. Of these participants, 72.68% were male, with the remaining identifying as female. Consequently, the findings of this study hold relevance for China’s ceramic product design sector, offering valuable insights to enhance understanding and alignment with customer preferences. Thus, these insights serve as a crucial reference and guide for the industry to offer good service quality that aligns closely with customer expectations.
6. Conclusions
In this research, an integrated method of FAHP and MARCOS is proposed and applied to assess and calculate the importance of the service quality index and solutions for China’s ceramic design industry. This work makes a scientific contribution by evidencing the effectiveness of the proposed hybrid MCDM method. It shows how the FAHP and MARCOS methods can assist in comprehending the dimensions, indicators and solutions concerning the service quality of China’s ceramic product design industry. Practically, this research suggests that companies involved in China’s ceramic product design industry can employ the decision-making model put forward to better address service quality index and solutions for diminishing risks and enhancing informed decision-making.
The most three important dimensions in the FAHP model were empathy, responsiveness and reliability. Moreover, indicators related to accurately recognising the priority of customer needs, willingness to serve customers and memorising customer needs were among the top three in the FAHP model.
According to the MARCOS model, solutions related to the customers’ potential needs, professional staff and the ability to empathise with the customer are the key points in providing excellent service quality.
Furthermore, the originality of this article lies in the following. (1) This study is the first to consider service quality index and solutions in China’s ceramic product design field under a fuzzy environment. The research can provide valuable insights into the service quality criteria of the ceramic product design industry. (2) Using the merits of both FAHP and MARCOS methods, the proposed integrated method can conveniently express the real condition of the decision-making problem, providing a better representation of experts’ evaluation with simplified calculations. (3) The implementation of sensitivity analysis will allow decision-makers to test the method’s stability, while findings can be effectively adapted to related sectors.
Finally, the integrated operations performed in this study were logically coherent, practical and functional. In addition to establishing a systematic and objective general model of selection in the context of this study and reflecting the characteristics of the conditions to meet practical needs, it can also serve as a reference for future studies in similar fields.
Author Contributions
All authors contributed equally. All authors have read and agreed to the published version of the manuscript.
Funding
This research received no external funding.
Data Availability Statement
Data are contained within the article.
Conflicts of Interest
The authors declare no conflicts of interest.
Appendix A
Table A1.
The pairwise comparison matrix for tangibility criteria.
Table A1.
The pairwise comparison matrix for tangibility criteria.
| Indicators | A1 | A2 | A3 | |
|---|---|---|---|---|
| A1 | 1 | 2 | 6 | 0.588 |
| A2 | 1/2 | 1 | 4 | 0.323 |
| A3 | 1/6 | 1/4 | 1 | 0.089 |
| Total | 1 | |||
Table A2.
The pairwise comparison matrix for reliability criteria.
Table A2.
The pairwise comparison matrix for reliability criteria.
| Indicators | B1 | B2 | B3 | B4 | |
|---|---|---|---|---|---|
| B1 | 1 | 5 | 4 | 1/2 | 0.334 |
| B2 | 1/5 | 1 | 1/4 | 1/5 | 0.059 |
| B3 | 1/4 | 4 | 1 | 1/4 | 0.133 |
| B4 | 2 | 5 | 4 | 1 | 0.473 |
| Total | 1 | ||||
Table A3.
The pairwise comparison matrix for responsiveness criteria.
Table A3.
The pairwise comparison matrix for responsiveness criteria.
| Indicators | C1 | C2 | C3 | |
|---|---|---|---|---|
| C1 | 1 | 4 | 2 | 0.558 |
| C2 | 1/4 | 1 | 1/3 | 0.122 |
| C3 | 1/2 | 3 | 1 | 0.32 |
| Total | 1 | |||
Table A4.
The pairwise comparison matrix for assurance criteria.
Table A4.
The pairwise comparison matrix for assurance criteria.
| Indicators | D1 | D2 | D3 | |
|---|---|---|---|---|
| D1 | 1 | 1/3 | 1 | 0.185 |
| D2 | 3 | 1 | 5 | 0.659 |
| D3 | 1 | 1/5 | 1 | 0.156 |
| Total | 1 | |||
Table A5.
The pairwise comparison matrix for empathy criteria.
Table A5.
The pairwise comparison matrix for empathy criteria.
| Indicators | E1 | E2 | E3 | E4 | |
|---|---|---|---|---|---|
| E1 | 1 | 6 | 8 | 3 | 0.589 |
| E2 | 1/6 | 1 | 5 | 1/3 | 0.123 |
| E3 | 1/8 | 1/5 | 1 | 1/4 | 0.048 |
| E4 | 1/3 | 3 | 4 | 1 | 0.24 |
| Total | 1 | ||||
Table A6.
Normalised decision-making matrix of the MARCOS model.
Table A6.
Normalised decision-making matrix of the MARCOS model.
| Alternatives | Indicators | ||||||||||||||||
|---|---|---|---|---|---|---|---|---|---|---|---|---|---|---|---|---|---|
| A1 | A2 | A3 | B1 | B2 | B3 | B4 | C1 | C2 | C3 | D1 | D2 | D3 | E1 | E2 | E3 | E4 | |
| ALT 1 | 1.00 | 1.00 | 1.00 | 0.61 | 0.67 | 0.63 | 0.58 | 0.51 | 0.32 | 0.50 | 0.61 | 0.68 | 1.00 | 0.46 | 0.40 | 0.35 | 0.46 |
| ALT 2 | 0.45 | 0.43 | 0.44 | 1.00 | 0.92 | 1.00 | 1.00 | 1.00 | 1.00 | 0.93 | 0.52 | 1.00 | 0.76 | 1.00 | 1.00 | 1.00 | 0.67 |
| ALT 3 | 0.25 | 0.25 | 0.29 | 0.75 | 1.00 | 0.48 | 0.40 | 0.42 | 0.81 | 1.00 | 1.00 | 0.81 | 0.78 | 0.79 | 0.57 | 0.98 | 1.00 |
| ALT 4 | 0.56 | 0.65 | 0.54 | 0.70 | 0.67 | 0.47 | 0.46 | 0.67 | 0.79 | 0.61 | 0.69 | 0.64 | 0.78 | 0.44 | 0.40 | 0.32 | 0.67 |
| ALT 5 | 0.33 | 0.36 | 0.23 | 0.73 | 0.81 | 0.63 | 0.73 | 0.67 | 0.67 | 0.45 | 0.60 | 0.87 | 0.79 | 0.74 | 0.52 | 0.48 | 0.63 |
| ALT 6 | 0.41 | 0.40 | 0.48 | 1.16 | 1.28 | 1.00 | 1.03 | 1.75 | 1.41 | 1.27 | 1.32 | 1.78 | 1.66 | 1.06 | 1.04 | 1.53 | 2.43 |
Table A7.
Weighted normalised decision-making matrix of the MARCOS model.
Table A7.
Weighted normalised decision-making matrix of the MARCOS model.
| Alternatives | Indicators | ||||||||||||||||
|---|---|---|---|---|---|---|---|---|---|---|---|---|---|---|---|---|---|
| A1 | A2 | A3 | B1 | B2 | B3 | B4 | C1 | C2 | C3 | D1 | D2 | D3 | E1 | E2 | E3 | E4 | |
| ALT 1 | 0.004 | 0.008 | 0.028 | 0.009 | 0.060 | 0.025 | 0.006 | 0.018 | 0.052 | 0.031 | 0.026 | 0.009 | 0.048 | 0.010 | 0.040 | 0.095 | 0.023 |
| ALT 2 | 0.002 | 0.003 | 0.012 | 0.015 | 0.083 | 0.039 | 0.011 | 0.035 | 0.162 | 0.058 | 0.022 | 0.013 | 0.036 | 0.021 | 0.101 | 0.269 | 0.034 |
| ALT 3 | 0.001 | 0.002 | 0.008 | 0.012 | 0.090 | 0.019 | 0.004 | 0.015 | 0.132 | 0.062 | 0.043 | 0.011 | 0.037 | 0.016 | 0.058 | 0.263 | 0.050 |
| ALT 4 | 0.002 | 0.005 | 0.015 | 0.011 | 0.060 | 0.018 | 0.005 | 0.024 | 0.129 | 0.038 | 0.030 | 0.008 | 0.037 | 0.009 | 0.040 | 0.087 | 0.034 |
| ALT 5 | 0.001 | 0.003 | 0.006 | 0.011 | 0.072 | 0.025 | 0.008 | 0.024 | 0.109 | 0.028 | 0.026 | 0.011 | 0.038 | 0.015 | 0.053 | 0.129 | 0.032 |
| ALT 6 | 0.002 | 0.003 | 0.013 | 0.018 | 0.115 | 0.039 | 0.011 | 0.062 | 0.229 | 0.078 | 0.057 | 0.023 | 0.079 | 0.022 | 0.105 | 0.412 | 0.122 |
Table A8.
The utility degrees of all alternatives.
Table A8.
The utility degrees of all alternatives.
| Alternatives | Utility Degrees | ||
|---|---|---|---|
| ALT 1 | 0.3483 | 1.1646 | 0.4922 |
| ALT 2 | 0.6493 | 2.1713 | 0.9175 |
| ALT 3 | 0.5820 | 1.9461 | 0.8224 |
| ALT 4 | 0.3903 | 1.3051 | 0.5515 |
| ALT 5 | 0.4178 | 1.3971 | 0.5904 |
| ALT 6 | 0.9849 | 3.2934 | 1.3917 |
Table A9.
The criteria weights in all scenarios.
Table A9.
The criteria weights in all scenarios.
| Sub-Criteria | Scenarios | |||||||||||||||||
|---|---|---|---|---|---|---|---|---|---|---|---|---|---|---|---|---|---|---|
| Base | 1 | 2 | 3 | 4 | 5 | 6 | 7 | 8 | 9 | 10 | 11 | 12 | 13 | 14 | 15 | 16 | 17 | |
| A1 | 0.004 | 0.000 | 0.005 | 0.006 | 0.005 | 0.009 | 0.006 | 0.005 | 0.006 | 0.014 | 0.008 | 0.007 | 0.005 | 0.007 | 0.005 | 0.010 | 0.020 | 0.007 |
| A2 | 0.008 | 0.008 | 0.000 | 0.009 | 0.008 | 0.013 | 0.010 | 0.008 | 0.010 | 0.017 | 0.011 | 0.010 | 0.008 | 0.010 | 0.009 | 0.014 | 0.023 | 0.011 |
| A3 | 0.028 | 0.028 | 0.028 | 0.000 | 0.028 | 0.033 | 0.030 | 0.028 | 0.030 | 0.037 | 0.031 | 0.030 | 0.028 | 0.030 | 0.029 | 0.034 | 0.043 | 0.031 |
| B1 | 0.015 | 0.016 | 0.016 | 0.017 | 0.000 | 0.021 | 0.018 | 0.016 | 0.017 | 0.025 | 0.019 | 0.018 | 0.016 | 0.018 | 0.017 | 0.021 | 0.031 | 0.018 |
| B2 | 0.090 | 0.090 | 0.090 | 0.091 | 0.090 | 0.000 | 0.092 | 0.090 | 0.092 | 0.099 | 0.093 | 0.092 | 0.090 | 0.092 | 0.091 | 0.095 | 0.105 | 0.092 |
| B3 | 0.039 | 0.040 | 0.040 | 0.041 | 0.040 | 0.045 | 0.000 | 0.040 | 0.042 | 0.049 | 0.043 | 0.042 | 0.040 | 0.042 | 0.041 | 0.045 | 0.055 | 0.042 |
| B4 | 0.011 | 0.011 | 0.011 | 0.013 | 0.012 | 0.016 | 0.013 | 0.000 | 0.013 | 0.021 | 0.015 | 0.014 | 0.012 | 0.014 | 0.012 | 0.017 | 0.027 | 0.014 |
| C1 | 0.035 | 0.036 | 0.036 | 0.037 | 0.036 | 0.041 | 0.038 | 0.036 | 0.000 | 0.045 | 0.039 | 0.038 | 0.036 | 0.038 | 0.037 | 0.041 | 0.051 | 0.038 |
| C2 | 0.162 | 0.163 | 0.163 | 0.164 | 0.163 | 0.168 | 0.165 | 0.163 | 0.165 | 0.000 | 0.166 | 0.165 | 0.163 | 0.165 | 0.164 | 0.168 | 0.178 | 0.165 |
| C3 | 0.062 | 0.062 | 0.062 | 0.064 | 0.063 | 0.067 | 0.064 | 0.063 | 0.064 | 0.072 | 0.000 | 0.065 | 0.063 | 0.065 | 0.063 | 0.068 | 0.078 | 0.065 |
| D1 | 0.043 | 0.044 | 0.044 | 0.045 | 0.044 | 0.049 | 0.046 | 0.044 | 0.045 | 0.053 | 0.047 | 0.000 | 0.044 | 0.046 | 0.045 | 0.049 | 0.059 | 0.046 |
| D2 | 0.013 | 0.013 | 0.014 | 0.015 | 0.014 | 0.018 | 0.015 | 0.014 | 0.015 | 0.023 | 0.017 | 0.016 | 0.000 | 0.016 | 0.014 | 0.019 | 0.029 | 0.016 |
| D3 | 0.048 | 0.048 | 0.048 | 0.049 | 0.049 | 0.053 | 0.050 | 0.048 | 0.050 | 0.057 | 0.051 | 0.050 | 0.048 | 0.000 | 0.049 | 0.054 | 0.063 | 0.051 |
| E1 | 0.021 | 0.021 | 0.021 | 0.022 | 0.022 | 0.026 | 0.023 | 0.021 | 0.023 | 0.030 | 0.024 | 0.023 | 0.021 | 0.024 | 0.000 | 0.027 | 0.037 | 0.024 |
| E2 | 0.101 | 0.102 | 0.102 | 0.103 | 0.102 | 0.107 | 0.104 | 0.102 | 0.103 | 0.111 | 0.105 | 0.104 | 0.102 | 0.104 | 0.103 | 0.000 | 0.117 | 0.104 |
| E3 | 0.269 | 0.269 | 0.269 | 0.271 | 0.270 | 0.274 | 0.271 | 0.270 | 0.271 | 0.279 | 0.273 | 0.272 | 0.270 | 0.272 | 0.270 | 0.275 | 0.000 | 0.272 |
| E4 | 0.050 | 0.051 | 0.051 | 0.052 | 0.051 | 0.056 | 0.053 | 0.051 | 0.052 | 0.060 | 0.054 | 0.053 | 0.051 | 0.053 | 0.051 | 0.056 | 0.066 | 0.000 |
Table A10.
The prospect value of alternatives in all scenarios.
Table A10.
The prospect value of alternatives in all scenarios.
| Sub-Criteria | Scenarios | |||||||||||||||||
|---|---|---|---|---|---|---|---|---|---|---|---|---|---|---|---|---|---|---|
| Base | 1 | 2 | 3 | 4 | 5 | 6 | 7 | 8 | 9 | 10 | 11 | 12 | 13 | 14 | 15 | 16 | 17 | |
| ALT 1 | 5.156 | 5.145 | 5.136 | 5.080 | 5.189 | 5.378 | 5.193 | 5.159 | 5.131 | 5.088 | 5.191 | 5.194 | 5.170 | 5.228 | 5.178 | 5.240 | 4.966 | 5.082 |
| ALT 2 | 6.464 | 6.461 | 6.459 | 6.439 | 6.493 | 6.724 | 6.478 | 6.457 | 6.407 | 6.108 | 6.453 | 6.552 | 6.480 | 6.651 | 6.461 | 6.399 | 5.838 | 6.406 |
| ALT 3 | 6.171 | 6.169 | 6.168 | 6.150 | 6.205 | 6.352 | 6.234 | 6.181 | 6.164 | 5.849 | 6.117 | 6.168 | 6.188 | 6.322 | 6.173 | 6.203 | 5.456 | 6.031 |
| ALT 4 | 5.338 | 5.333 | 5.326 | 5.297 | 5.366 | 5.557 | 5.390 | 5.344 | 5.291 | 5.003 | 5.344 | 5.360 | 5.353 | 5.447 | 5.359 | 5.407 | 5.135 | 5.227 |
| ALT 5 | 5.458 | 5.455 | 5.453 | 5.444 | 5.485 | 5.643 | 5.491 | 5.454 | 5.412 | 5.188 | 5.499 | 5.495 | 5.464 | 5.569 | 5.459 | 5.489 | 5.126 | 5.357 |
| ALT 6 | 7.921 | 7.922 | 7.923 | 7.910 | 7.970 | 8.256 | 7.988 | 7.926 | 7.826 | 7.515 | 7.924 | 7.962 | 7.931 | 8.077 | 7.941 | 7.956 | 7.119 | 7.656 |
References
- Li, J. An Analysis of the Teaching Reform of Ceramics in Colleges and Universities from the Perspective of Innovation and Entrepreneurship. In Proceedings of the 6th International Conference on Education, Language, Art and Inter-Cultural Communication (ICELAIC 2019), Moscow, Russia, 24–25 October 2019; Atlantis Press: Amsterdam, the Netherlands, 2020; pp. 241–245. [Google Scholar]
- Heimann, R. Introduction to Classic Ceramics. In Classic and Advanced Ceramics; John Wiley & Sons: Hoboken, NJ, USA, 2010; pp. 1–10. ISBN 978-3-527-63017-2. [Google Scholar]
- Wang, S. The Integration Method of Ceramic Arts in the Product Design. In Proceedings of the IOP Conference Series: Materials Science and Engineering, Shanghai, China, 15–17 December 2017; IOP Publishing: Shanghai, China, 2018; p. 012051. [Google Scholar]
- Zhao, W.; Li, S.; Huang, Q. Research on the Digital Inheritance Education of Jingdezhen Ceramic Culture from the Perspective of. J. Sociol. Ethnol. 2022, 4, 23–28. [Google Scholar] [CrossRef]
- Lin, Z.; Shi, X. Comparative Study on Modern Ceramic Art in China and the West Based on Cultural and Psychological Differences; Atlantis Press: Amsterdam, the Netherlands, 2021; pp. 142–147. [Google Scholar]
- Mahendri, C.D.; Anggoro, P.W.; Fergiawan, P.K.; Yuniarto, T.; Bayuseno, A.P. Jamari Development of the Ceramic Jewellry Industry for Necklace with Indonesian Batik Motifs; Atlantis Press: Amsterdam, The Netherlands, 2021; pp. 387–393. [Google Scholar]
- Yu, Q.; Yukari, N.; Luo, Y. Co-Creation with Ceramic Practitioner for Improving the Marketing and Enhancing the Customer Purchase Experiences. Asian Bus. Res. J. 2019, 4, 44–53. [Google Scholar] [CrossRef]
- Mirfakhradini, S.H.; Safari, K.; Shaabani, A.; Valaei, N.; Mohammadi, K. Customer Involvement in New Product Development of Tile and Ceramic Industry. Int. J. Product. Qual. Manag. 2018, 25, 108–138. [Google Scholar] [CrossRef]
- Duy, P.N.N.; Hoang, T.M. Factors Affecting Customer Satisfaction and Customer Loyalty the Case of Binh Duong Ceramic Product. In Proceedings of the NIDA International Business Conference, Bangkok, Thailand, 12 March 2017; pp. 380–405. [Google Scholar]
- Lin, J. The Sustainable Development of Jingdezhen Ceramic Expo Industry. Adv. Educ. Technol. Psychol. 2022, 6, 18–25. [Google Scholar]
- Guo, L.; Zhao, Y. Research on the Marketing Status and Countermeasures of Small Pieces of Creative Ceramics in Jingdezhen: Based on the Perspective of Consumer Psychology; Atlantis Press: Amsterdam, the Netherlands, 2018; pp. 128–131. [Google Scholar]
- Lo, M.-H.; Han, D. Exploring Competitive Strategies of China Ceramic Tile Industrial Cluster in Global Economy. Open J. Soc. Sci. 2014, 2014, 11–18. [Google Scholar] [CrossRef][Green Version]
- Ke, D. Research on the Development Strategy of Ceramic Culture and Creative Industries under the Strategy of Belt and Road-Taking Jingdezhen as an Example. In Proceedings of the 9th International Conference on Education, Management, and Computer (ICEMC 2019), Shenyang, China, 12–14 May 2019. [Google Scholar]
- Li, X.; Hu, X. Current Status of Ceramic Industry and VR Technology Used in Ceramic Display and Dissemination. Sci. Program. 2021, 2021, 7555550. [Google Scholar] [CrossRef]
- Tian, Y.; Hu, X. SWOT Analysis of China’s Ceramic Industry and the Use of Computers for Scientific and Technological Innovation Research. Sci. Program. 2021, 2021, 5395988. [Google Scholar] [CrossRef]
- Wang, C.-N.; Nguyen, N.-A.-T.; Dang, T.-T. Sustainable Evaluation of Major Third-Party Logistics Providers: A Framework of an MCDM-Based Entropy Objective Weighting Method. Mathematics 2023, 11, 4203. [Google Scholar] [CrossRef]
- Miškić, S.; Stević, Ž.; Tadić, S.; Alkhayyat, A.; Krstić, M. Assessment of the LPI of the EU Countries Using MCDM Model with an Emphasis on the Importance of Criteria. World Rev. Intermodal Transp. Res. 2023, 11, 258–279. [Google Scholar] [CrossRef]
- Badi, I.; Pamučar, D.; Stević, Ž.; Muhammad, L.J. Wind Farm Site Selection Using BWM-AHP-MARCOS Method: A Case Study of Libya. Sci. Afr. 2023, 19, e01511. [Google Scholar] [CrossRef]
- Ristić, B.; Bogdanović, V.; Stević, Ž.; Marinković, D.; Papić, Z.; Gojković, P. Evaluation of Pedestrian Crossings Based on the Concept of Pedestrian Behavior Regarding Start-Up Time: Integrated Fuzzy MCDM Model. Teh. Vjesn. 2024, 31, 1206–1214. [Google Scholar]
- Wan, J.; Lin, C.-L. Research on the Service Quality Index and Alternatives Evaluation and Ranking for Online Yue Kiln Celadon Art Education in Post COVID-19 Era. Mathematics 2023, 11, 1339. [Google Scholar] [CrossRef]
- Lin, C.-L.; Chen, J.-J.; Ma, Y.-Y. Ranking of Service Quality Solution for Blended Design Teaching Using Fuzzy ANP and TOPSIS in the Post-COVID-19 Era. Mathematics 2023, 11, 1255. [Google Scholar] [CrossRef]
- Kou, G.; Lu, Y.; Shi, Y. Evaluation of Classification Algorithms Using MCDM and Rank Correlation. Int. J. Inf. Technol. Decis. Mak. 2012, 11, 197–225. [Google Scholar] [CrossRef]
- Kou, G.; Lin, C.; Chen, Y. Pairwise Comparison Matrix in Multiple Criteria Decision Making. Technol. Econ. Dev. Econ. 2016, 22, 738–765. [Google Scholar] [CrossRef]
- Li, G.; Kou, G.; Peng, Y. A Group Decision Making Model for Integrating Heterogeneous Information. IEEE Trans. Syst. Man Cybern. Syst. 2018, 48, 982–992. [Google Scholar] [CrossRef]
- Kou, G.; Yang, P.; Peng, Y.; Xiao, F.; Chen, Y.; Alsaadi, F.E. Evaluation of Feature Selection Methods for Text Classification with Small Datasets Using Multiple Criteria Decision-Making Methods. Appl. Soft Comput. 2020, 86, 105836. [Google Scholar] [CrossRef]
- Wang, J.-J.; Jing, Y.-Y.; Zhang, C.-F.; Zhao, J.-H. Review on Multi-Criteria Decision Analysis Aid in Sustainable Energy Decision-Making. Renew. Sustain. Energy Rev. 2009, 13, 2263–2278. [Google Scholar] [CrossRef]
- Odu, G.O. Weighting Methods for Multi-Criteria Decision Making Technique. J. Appl. Sci. Environ. Manag. 2019, 23, 1449–1457. [Google Scholar] [CrossRef]
- Deng, H.; Yeh, C.-H.; Willis, R.J. Inter-Company Comparison Using Modified TOPSIS with Objective Weights. Comput. Oper. Res. 2000, 27, 963–973. [Google Scholar] [CrossRef]
- Kumar, A.; Dhiman, P. Reliability Range Through Upgraded Operation with Trapezoidal Fuzzy Number. Fuzzy Inf. Eng. 2020, 12, 452–463. [Google Scholar] [CrossRef]
- Dhiman, P.; Kumar, A. A Situational Based Reliability Indices Estimation of ULT Freezer Using Preventive Maintenance under Fuzzy Environment. Int. J. Math. Eng. Manag. Sci. 2023, 8, 477–503. [Google Scholar] [CrossRef]
- Kumar, A.; Dhiman, P. Performance Analysis of “Injection Moulding Machine” under Fuzzy Environment through Contemporary Arithmetic Operations on Right Triangular Generalized Fuzzy Numbers (RTrGFN). J. Intell. Fuzzy Syst. 2023, 45, 4427–4445. [Google Scholar] [CrossRef]
- Parasuraman, A.; Zeithaml, V.A.; Berry, L.L. SERVQUAL: A Multiple-Item Scale for Measuring Consumer Perceptions of Service Quality. J. Retail. 1988, 64, 12–28. [Google Scholar]
- Parasuraman, A.; Berry, L.L.; Zeithaml, V.A. Perceived Service Quality as a Customer-based Performance Measure: An Empirical Examination of Organizational Barriers Using an Extended Service Quality Model. Hum. Resour. Manag. 1991, 30, 335–364. [Google Scholar] [CrossRef]
- Asubonteng, P.; McCleary, K.J.; Swan, J.E. SERVQUAL Revisited: A Critical Review of Service Quality. J. Serv. Mark. 1996, 10, 62–81. [Google Scholar] [CrossRef]
- Iwaarden, J.V.; Wide, J.; Bell, V.L.; Miller, R. Applying SERVQUAL to Websites: An Exploratory Study. Int. J. Qual. Manag. 2003, 20, 919–935. [Google Scholar]
- Albaum, G. The Likert Scale Revisited: An Alternate Version. Int. J. Mark. Res. 1997, 39, 331–348. [Google Scholar]
- Kassim, N.M.; Bojei, J. Service Quality: Gaps in the Malaysian Telemarketing Industry. J. Bus. Res. 2002, 55, 845–852. [Google Scholar] [CrossRef]
- Ladhari, R. Alternative Measures of Service Quality: A Review. Manag. Serv. Qual. 2008, 18, 65–86. [Google Scholar] [CrossRef]
- Ladhari, R. A Review of Twenty Years of SERVQUAL Research. Int. J. Qual. Serv. Sci. 2009, 1, 172–198. [Google Scholar] [CrossRef]
- Buttle, F. SERVQUAL: Review, Critique, Research Agenda. Eur. J. Mark. 1996, 30, 8–32. [Google Scholar] [CrossRef]
- Gilmore, A.; McMullan, R. Scales in Services Marketing Research: A Critique and Way Forward. Eur. J. Mark. 2009, 43, 640–651. [Google Scholar] [CrossRef]
- Lam, S.S. SERVQUAL: A Tool for Measuring Patients’ Opinions of Hospital Service Quality in Hong Kong. Total Qual. Manag. 1997, 8, 145–152. [Google Scholar] [CrossRef]
- Nguyen, P.-H. A Fuzzy Analytic Hierarchy Process (FAHP) Based on SERVQUAL for Hotel Service Quality Management: Evidence from Vietnam. J. Asian Financ. Econ. Bus. 2021, 8, 1101–1109. [Google Scholar]
- Stević, Ž.; Tanackov, I.; Puška, A.; Jovanov, G.; Vasiljević, J.; Lojaničić, D. Development of Modified SERVQUAL–MCDM Model for Quality Determination in Reverse Logistics. Sustainability 2021, 13, 5734. [Google Scholar] [CrossRef]
- Abdolvand, M.A.; Taghipouryan, M.J. Evaluation of Customs Service Quality by Using Fuzzy SERVQUAL and Fuzzy MCDM. Am. J. Sci. Res. 2011, 35, 89–103. [Google Scholar]
- Altuntas, S.; Dereli, T.; Yilmaz, M.K. Multi-Criteria Decision Making Methods Based Weighted SERVQUAL Scales to Measure Perceived Service Quality in Hospi-Tals: A Case Study from Turkey. Total Qual. Manag. Bus. Excell. 2012, 23, 1379–1395. [Google Scholar] [CrossRef]
- Liu, C.C.; Chen, J.J. Research on Service Quality Index of UAV Film Production-Dual Perspective. J. Qual. 2021, 28, 231–251. [Google Scholar]
- Afkham, L.; Abdi, F.; Komijan, A. Evaluation of Service Quality by Using Fuzzy MCDM: A Case Study in Iranian Health-Care Centers. Manag. Sci. Lett. 2012, 2, 291–300. [Google Scholar] [CrossRef]
- Saaty, T.L. The Analytic Hierarchy Process: Planning, Priority Setting, Resources Allocation; McGraw-Hill: New York, NY, USA, 1980. [Google Scholar]
- Tseng, H.-E.; Li, R.-K. Analytic Hierarchical Process for Design Alternative Selection. J. Des. 1998, 3, 43–54. [Google Scholar]
- Shahin, A.; Mahbod, M.A. Prioritization of Key Performance Indicators: An Integration of Analytical Hierarchy Process and Goal Setting. Int. J. Product. Perform. Manag. 2007, 56, 226–240. [Google Scholar] [CrossRef]
- Tu, J.-C.; Chang, Y.-C. Strategy of Sustainable Product Development by Applying Analytic Hierarchy Process (AHP). Kaohsiung Norm. Univ. J. 2006, 21, 139–153. [Google Scholar]
- Chang, D.-Y. Applications of the Extent Analysis Method on Fuzzy AHP. Eur. J. Oper. Res. 1996, 95, 649–655. [Google Scholar] [CrossRef]
- Hsu, Y.; Lee, C.; Kreng, V.B. The Application of Fuzzy Delphi Method and Fuzzy AHP in Lubricant Regenerative Technology Selection. Expert Syst. Appl. 2010, 37, 419–425. [Google Scholar] [CrossRef]
- Kaganski, S.; Majak, J.; Karjust, K. Fuzzy AHP as a Tool for Prioritization of Key Performance Indicators. Procedia CIRP 2018, 72, 1227–1232. [Google Scholar] [CrossRef]
- Kwong, C.K.; Bai, H. A Fuzzy AHP Approach to the Determination of Importance Weights of Customer Requirements in Quality Function Deployment. J. Intell. Manuf. 2002, 13, 367–377. [Google Scholar] [CrossRef]
- Lam, K.C.; Lam, M.C.K.; Wang, D. MBNQA–Oriented Self-Assessment Quality Management System for Contractors: Fuzzy AHP Approach. Constr. Manag. Econ. 2008, 26, 447–461. [Google Scholar] [CrossRef]
- Rehman, A.U.; Mian, S.H.; Umer, U.; Usmani, Y.S. Strategic Outcome Using Fuzzy-AHP-Based Decision Approach for Sustainable Manufacturing. Sustainability 2019, 11, 6040. [Google Scholar] [CrossRef]
- Stević, Ž.; Pamučar, D.; Puška, A.; Chatterjee, P. Sustainable Supplier Selection in Healthcare Industries Using a New MCDM Method: Measurement of Alternatives and Ranking According to COmpromise Solution (MARCOS). Comput. Ind. Eng. 2020, 140, 106231. [Google Scholar] [CrossRef]
- Puška, A.; Stojanović, I.; Maksimović, A.; Osmanović, N. Evaluation Software of Project Management by Using Measurement of Alternatives and Ranking According to Compromise Solution (MARCOS) Method. Oper. Res. Eng. Sci. Theory Appl. 2020, 3, 89–102. [Google Scholar] [CrossRef]
- Chakraborty, S.; Chattopadhyay, R.; Chakraborty, S. An Integrated D-MARCOS Method for Supplier Selection in an Iron and Steel Industry. Decis. Mak. Appl. Manag. Eng. 2020, 3, 49–69. [Google Scholar] [CrossRef]
- Dempster, A.P. Upper and Lower Probabilities Induced by a Multivalued Mapping. Ann. Math. Stat. 1967, 38, 325–339. [Google Scholar] [CrossRef]
- Ali, J. A Q-Rung Orthopair Fuzzy MARCOS Method Using Novel Score Function and Its Application to Solid Waste Management. Appl. Intell. 2022, 52, 8770–8792. [Google Scholar] [CrossRef]
- El-Araby, A. The Utilization of MARCOS Method for Different Engineering Applications: A Comparative Study. Int. J. Res. Ind. Eng. 2023, 12, 155–164. [Google Scholar] [CrossRef]
- Badi, I.; Pamucar, D. Supplier Selection for Steelmaking Company by Using Combined Grey-MARCOS Methods. Decis. Mak. Appl. Manag. Eng. 2020, 3, 37–48. [Google Scholar] [CrossRef]
- Puška, A.; Stević, Ž.; Stojanović, I. Selection of Sustainable Suppliers Using the Fuzzy MARCOS Method. Curr. Chin. Sci. 2021, 1, 218–229. [Google Scholar] [CrossRef]
- Badi, I.; Jibril, M.; Abubakar, M.; Bakir, M. Measuring Sustainability Performance Indicators Using FUCOM-MARCOS Methods. Oper. Res. Eng. Sci. Theory Appl. 2022, 5, 99–116. [Google Scholar] [CrossRef]
- Pamucar, D.; Ecer, F.; Deveci, M. Assessment of Alternative Fuel Vehicles for Sustainable Road Transportation of United States Using Integrated Fuzzy FUCOM and Neutrosophic Fuzzy MARCOS Methodology. Sci. Total Environ. 2021, 788, 147763. [Google Scholar] [CrossRef]
- Krishankumar, R.; Mishra, A.R.; Rani, P.; Ecer, F.; Ravichandran, K.S. Assessment of Zero-Carbon Measures for Sustainable Transportation in Smart Cities: A CRITIC-MARCOS Framework Based on Q-Rung Fuzzy Preferences. IEEE Internet Things J. 2023, 10, 18651–18662. [Google Scholar] [CrossRef]
- Birkocak, D.T.; Acar, E.; Bakadur, A.Ç.; Ütebay, B.; Özdağoğlu, A. An Application of the MARCOS Method Within the Framework of Sustainability to Determine the Optimum Recycled Fibre-Containing Fabric. Fibers Polym. 2023, 24, 2595–2608. [Google Scholar] [CrossRef]
- Tešić, D.; Božanić, D.; Puška, A.; Milić, A.; Marinković, D. Development of the MCDM Fuzzy LMAW-Grey MARCOS Model for Selection of a Dump Truck. Rep. Mech. Eng. 2023, 4, 1–17. [Google Scholar] [CrossRef]
- Ecer, F. A Consolidated MCDM Framework for Performance Assessment of Battery Electric Vehicles Based on Ranking Strategies. Renew. Sustain. Energy Rev. 2021, 143, 110916. [Google Scholar] [CrossRef]
- Wang, C.-N.; Chung, Y.-C.; Wibowo, F.D.; Dang, T.-T.; Nguyen, N.-A.-T. Sustainable Last-Mile Delivery Solution Evaluation in the Context of a Developing Country: A Novel OPA–Fuzzy MARCOS Approach. Sustainability 2023, 15, 12866. [Google Scholar] [CrossRef]
- Ayan, B.; Abacioğlu, S. Bibliometric Analysis of the MCDM Methods in the Last Decade: WASPAS, MABAC, EDAS, CODAS, COCOSO, and MARCOS. Int. J. Bus. Econ. Stud. 2022, 4, 65–85. [Google Scholar] [CrossRef]
- Demir, G.; Chatterjee, P.; Kadry, S.; Abdelhadi, A.; Pamučar, D. Measurement of Alternatives and Ranking According to Compromise Solution (MARCOS) Method: A Comprehensive Bibliometric Analysis. Decis. Mak. Appl. Manag. Eng. 2024, 7, 313–336. [Google Scholar] [CrossRef]
- Wang, C.-N.; Cao, T.-B.-O.; Dang, T.-T.; Nguyen, N.-A.-T. Third-Party Logistics Provider Selection in the Industry 4.0 Era by Using a Fuzzy AHP and Fuzzy MARCOS Methodology. IEEE Access 2024, 12, 67291–67313. [Google Scholar] [CrossRef]
- Wang, C.-N.; Pan, C.-F.; Nguyen, H.-P.; Fang, P.-C. Integrating Fuzzy AHP and TOPSIS Methods to Evaluate Operation Efficiency of Daycare Centers. Mathematics 2023, 11, 1793. [Google Scholar] [CrossRef]
- Tsai, W.C.; Kung, P.T.; Wang, R.H.; Chang, Y.H.; Lee, S.Y. Applying the SERVQUAL Questionnaire to Establish Quality Indicators for Chinese Medicine. Taiwan J. Public Health 2008, 27, 309–319. [Google Scholar]
- Babakus, E.; Mangold, W.G. Adapting the SERVQUAL Scale to Hospital Services: An Empirical Investigation. Health Serv. Res. 1992, 22, 767–786. [Google Scholar]
- Parenté, F.J.; Anderson-Parenté, J.K. Delphi Inquiry Systems. In Judgmental Forecasting; Wiley: Chichester, UK, 1987; pp. 129–156. [Google Scholar]
- Darko, A.; Chan, A.; Ameyaw, E.; Owusu, E.; Pärn, E.; Edwards, D. Review of Application of Analytic Hierarchy Process (AHP) in Construction. Int. J. Constr. Manag. 2018, 19, 436–452. [Google Scholar] [CrossRef]
- Dalal, J.; Mohapatra, P.K.; Chandra, M.G. Prioritization of Rural Roads: AHP in Group Decision. Eng. Constr. Archit. Manag. 2010, 17, 135–158. [Google Scholar] [CrossRef]
- Zou, P.X.W.; Li, J. Risk Identification and Assessment in Subway Projects: Case Study of Nanjing Subway Line 2. Constr. Manag. Econ. 2010, 28, 1219–1238. [Google Scholar] [CrossRef]
- Li, J.; Zou, P.X.W. Fuzzy AHP-Based Risk Assessment Methodology for PPP Projects. J. Constr. Eng. Manag. 2011, 137, 1205–1209. [Google Scholar] [CrossRef]
- Pan, W.; Dainty, A.R.J.; Gibb, A.G.F. Establishing and Weighting Decision Criteria for Building System Selection in Housing Construction. J. Constr. Eng. Manag. 2012, 138, 1239–1250. [Google Scholar] [CrossRef]
- Akadiri, P.O.; Olomolaiye, P.O.; Chinyio, E.A. Multi-Criteria Evaluation Model for the Selection of Sustainable Materials for Building Projects. Autom. Constr. 2013, 30, 113–125. [Google Scholar] [CrossRef]
- Chou, J.; Pham, A.; Wang, H. Bidding Strategy to Support Decision-Making by Integrating Fuzzy AHP and Regression-Based Simulation. Autom. Constr. 2013, 35, 517–527. [Google Scholar] [CrossRef]
- Herrera, F.; Herrera-Viedma, E. Linguistic Decision Analysis: Steps for Solving Decision Problems under Linguistic Information. Fuzzy Sets Syst. 2000, 115, 67–82. [Google Scholar] [CrossRef]
- Zimmermann, H. Fuzzy Set Theory—And Its Applications, 2nd ed.; Kluwer Academic: Dordrecht, The Netherlands, 1992. [Google Scholar]
- Zadeh, L. Fuzzy Sets. Inf. Control 1965, 9, 338–353. [Google Scholar] [CrossRef]
- Lee, A.H.I. A Fuzzy Supplier Selection Model with the Consideration of Benefits, Opportunities, Costs and Risks. Expert Syst. Appl. 2009, 36, 2879–2893. [Google Scholar] [CrossRef]
- Lee, A.H.I.; Kang, Y.H.; Hsu, C.F.; Hung, H.C. A Green Supplier Selection Model for High-Tech Industry. Expert Syst. Appl. 2009, 36, 7917–7927. [Google Scholar] [CrossRef]
- Lee, A.H.I.; Kang, H.Y.; Chang, C.T. Fuzzy Multiple Goal Programming Applied to Tft-Lcd Supplier Selection by Downstream Manufacturers. Expert Syst. Appl. 2009, 36, 6318–6325. [Google Scholar] [CrossRef]
- Lee, A.H.I.; Kang, H.Y.; Wang, W.P. Analysis of Priority Mix Planning for the Fabrication of Semiconductors under Uncertainty. Int. J. Adv. Manuf. Technol. 2006, 28, 351–361. [Google Scholar] [CrossRef]
- Ma, Y.-Y.; Lin, C.-L.; Lin, H.-L. Ranking of Service Quality Index and Solutions for Online English Teaching in the Post-COVID-19 Crisis. Mathematics 2023, 11, 4001. [Google Scholar] [CrossRef]
- Chang, C.H. Evaluating Weapon Systems Using Ranking Fuzzy Numbers. Fuzzy Sets Syst. 1999, 107, 25–35. [Google Scholar] [CrossRef]
- Lin, Y.-H. The Algorithm of Fuzzy Linguistic Numbers and Its Comparison of Scoring. J. Natl. Taichung Teach. Coll. 2003, 17, 279–304. [Google Scholar]
- Chen, D.-C. Evaluation and Inspection of Domestic Civil Aviation Safety Performance. Master’s Thesis, National Chiao Tung University, Hsinchu, Taiwan, 2003. [Google Scholar]
- Dehghani, M.; Esmaeilian, M.; Tavakkoli-Moghaddam, R. Employing Fuzzy Anp for Green Supplier Selection and Order Allocations: A Case Study. Int. J. Econ. Manag. Soc. Sci. 2013, 2, 565–575. [Google Scholar]
- Buckley, J.J. Fuzzy Hierarchical Analysis. Fuzzy Sets Syst. 1985, 17, 233–247. [Google Scholar] [CrossRef]
- Pedrycz, W. Why Triangular Membership Functions? Fuzzy Sets Syst. 1994, 64, 21–30. [Google Scholar] [CrossRef]
- Lin, C.-L.; Hsu, C.-Y.; Ting, C.-H. Research on the Key Influencing Goals for Visual Design Sustainability: A Dual Perspective. Sustainability 2024, 16, 1885. [Google Scholar] [CrossRef]
- Tang, Y.-C.; Beynon, M.J. Application and Development of a Fuzzy Analytic Hierarchy Process within a Capital Investment Study. J. Econ. Manag. 2005, 1, 207–230. [Google Scholar]
- Adamo, J.M. Fuzzy Decision Tree. Fuzzy Sets Syst. 1980, 4, 207–219. [Google Scholar] [CrossRef]
- Wang, C.-N.; Nguyen, V.T.; Thai, H.T.N.; Duong, D.H. Multi-Criteria Decision Making (MCDM) Approaches for Solar Power Plant Location Selection in Viet Nam. Energies 2018, 11, 1504. [Google Scholar] [CrossRef]
- Saaty, T.L. How to Make a Decision: The Analytic Hierarchy Process. Eur. J. Oper. Res. 1990, 48, 9–26. [Google Scholar] [CrossRef]
- Donegan, H.; Dodd, F. A Note on Saaty’s Random Indexes. Math. Comput. Model. 1991, 15, 135–137. [Google Scholar] [CrossRef]
- Shyamprasad, V.; Kousalya, P. Role of Consistency and Random Index in Analytic Hierarchy Process—A New Measure. In The Numerical Optimization in Engineering and Sciences; Dutta, D., Mahanty, B., Eds.; Springer: Singapore, 2020; pp. 233–239. [Google Scholar]
- Tseng, M.L.; Lin, Y.H.; Chiu, A.S.F.; Liao, J.C.H. Using FANP Approach on Selection of Competitive Priorities Based on Cleaner Production Implementation: A Case Study in PCB Manufacturer, Taiwan. Clean Technol. Environ. Policy 2008, 10, 17–29. [Google Scholar] [CrossRef]
- Wang, C.-N.; Yang, C.-Y.; Cheng, H.-C. Fuzzy Multi-Criteria Decision-Making Model for Supplier Evaluation and Selection in a Wind Power Plant Project. Mathematics 2019, 7, 417. [Google Scholar] [CrossRef]
- Wang, C.-N.; Su, C.-C.; Nguyen, V.T. Nuclear Power Plant Location Selection in Vietnam under Fuzzy Environment Conditions. Symmetry 2018, 10, 548. [Google Scholar] [CrossRef]
- Saaty, T.L. The Analytic Hierarchy and Analytic Network Processes for the Measurement of Intangible Criteria and for Decision-Making. In Multiple Criteria Decision Analysis: State of the Art Surveys; Springer: New York, NY, USA, 2016; pp. 363–419. [Google Scholar]
- Alinezhad, A.; Amini, A. Sensitivity Analysis of TOPSIS Technique: The Results of Change in the Weight of One Attribute on the Final Ranking of Alternatives. J. Optim. Ind. Eng. 2011, 7, 23–28. [Google Scholar]


Disclaimer/Publisher’s Note: The statements, opinions and data contained in all publications are solely those of the individual author(s) and contributor(s) and not of MDPI and/or the editor(s). MDPI and/or the editor(s) disclaim responsibility for any injury to people or property resulting from any ideas, methods, instructions or products referred to in the content. |
© 2024 by the authors. Licensee MDPI, Basel, Switzerland. This article is an open access article distributed under the terms and conditions of the Creative Commons Attribution (CC BY) license (https://creativecommons.org/licenses/by/4.0/).