Article

Discrete Random Renewable Replacements after the Expiration of Collaborative Preventive Maintenance Warranty

by
Hui Chen
1,
Jie Chen
1,
Yangyang Lai
1,
Xiaoqi Yu
1,
Lijun Shang
1,*,
Rui Peng
2,* and
Baoliang Liu
3
1
School of Management, Foshan University, Foshan 528225, China
2
School of Economics and Management, Beijing University of Technology, Beijing 100124, China
3
College of Mathematics and Statistics, Shanxi Datong University, Datong 037009, China
*
Authors to whom correspondence should be addressed.
Mathematics 2024, 12(18), 2845; https://doi.org/10.3390/math12182845
Submission received: 13 August 2024 / Revised: 11 September 2024 / Accepted: 12 September 2024 / Published: 13 September 2024

Abstract

:
With advanced digital technologies as the key support, many scholars and researchers have proposed various random warranty models by integrating mission cycles into the warranty stage. However, these existing warranty models are designed only from the manufacturer’s subjective perspective, ignoring certain consumer requirements. For instance, they overlook a wide range of warranty coverage, the pursuit of reliability improvement rather than mere minimal repair, and the need to limit the delay in repair. To address these consumer requirements, this paper proposes a novel random collaborative preventive maintenance warranty with repair-time threshold (RCPMW-RTT). This model incorporates terms that are jointly designed by manufacturers and consumers to meet specific consumer needs, thereby overcoming the limitations of existing warranty models. The introduction of a repair-time threshold aims to limit the time delay in repairing failures and to compensate for any losses incurred by consumers. Using probability theory, the RCPMW-RTT is evaluated in terms of cost and time, and relevant variants are derived by analyzing key parameters. As an exemplary representation of the RCPMW-RTT, two random replacement policies named the discrete random renewable back replacement (DRRBR) and the discrete random renewable front replacement (DRRFR) are proposed and modelled to ensure reliability after the expiration of the RCPMW-RTT. In both policies, product replacement is triggered either by the occurrence of the first extreme mission cycle or by reaching the limit on the number of non-extreme mission cycles, whichever comes first. Probability theory is used to present cost rates for both policies in order to determine optimal values for decision variables. Finally, numerical analysis is performed on the RCPMW-RTT to reveal hidden variation tendencies and mechanisms; numerical analysis is also performed on the DRRBR and the DRRFR. The numerical results show that the proposed random replacement policies are feasible and unique; the replacement time within the post-warranty coverage increases as the maintenance quality improves and the cost rate can be reduced by setting a smaller repair-time threshold.

1. Introduction

Warranty models serve as the primary instruments for ensuring the reliability of a product or system under the warranty coverage. Additionally, they function as promotional tools related to the product or system in question. The warranty coverage represents only a portion of the product’s life cycle. Consequently, the maintenance policies after the expiration of the warranty or the post-warranty maintenance policies are designed to ensure the product’s continued reliability beyond the warranty coverage, which is referred to as the post-warranty coverage. From the perspective of responsibility, manufacturers bear responsibility for designing and implementing warranty models to ensure product/system reliability under the warranty coverage, while consumers bear responsibility for designing and implementing maintenance policies after the expiration of the warranty to ensure product/system reliability under the post-warranty coverage.
Due to the core value of warranty models, various warranty models have been proposed and modeled from manufacturers’ perspectives. Maintenance theories are an important basis for warranty models. Existing maintenance theories can be classified into three broad types: classical maintenance theories (see Refs. [1,2]), condition-based maintenance theories (see Refs. [3,4,5,6]), and random maintenance theories (see Ref. [7]). Based on these three types, this paper categorizes existing warranty models into classical warranty models, condition-based warranty models, and random warranty models.
The utilization of classic warranty models is suitable for ensuring the reliability of products/systems, where failure times are represented by lifetime-distribution functions. Replacement, preventive maintenance, and minimal repair or their combinations serve as the primary methods to ensure product/system reliability. These types of warranty models include renewable free replacement warranty models, non-renewable pro-rata replacement warranty models, free repair warranty models, and combination warranty models. For example, Ref [8] studied multicomponent systems with interdependent failure relationships, and defined and modeled a renewable free replacement warranty model. They also constructed warranty cost models for series and parallel systems under this model. In addition, there are earlier related studies by Refs. [9,10,11]. Non-renewable pro-rata replacement warranty models require that the manufacturer replaces the failed product with a new product, and the warranty period of the relevant new product is not counted from zero, but inherits the remaining warranty period, i.e., only the product is renewed without involving a change in the warranty period. For example, Refs. [12,13] studied the non-renewable pro-rata replacement warranty models and explored the issue of the burn-in test under relevant conditions. The free repair warranty models (see Refs. [14,15]) aim to satisfy the requirements of the relevant regulatory or governmental agencies. Combination warranty models are currently mainly restricted to renewable free replacement warranty: a rebate which consists of a renewable free replacement warranty and refund/discount rebate models. For example, Ref. [16] incorporates the refund clause into the renewable free replacement warranty model and defines and models the renewable free replacement warranty: a rebate considering rebate. Other classifications and discussions about classical warranty models have been mentioned in Refs. [17,18,19] and will not be repeated here.
Advanced digital technologies enable managers to capture performance degradation data in real time, so scholars and practitioners have adopted some of the stochastic degradation processes in Refs. [20,21,22,23,24,25,26,27,28,29,30] to predict performance degradation trends and proposed condition-based warranty models. Such a type of warranty model mainly consists of the condition-based renewable free replacement warranty model and the condition-based non-renewable free replacement warranty model. For example, Ref. [31] used the Inverse Gaussian Process to predict the trend of reliability performance change, and proposed and modeled the condition-based renewable free replacement warranty model; Ref. [32] used the Gamma Process to predict the trend of reliability performance degradation and proposed and modeled the condition-based non-renewable replacement warranty model. Other categorizations and discussions of the visual warranty model have been covered in Refs. [33,34] and will not be repeated here.
Empowered by advanced digital technologies, managers can capture mission data in real time. For example, a remote monitoring system integrated with advanced digital technologies can instantly record the riding time of each bike-sharing user and the time when a drone user uses the drone for operations. These data are time data, which are referred to as mission data. Based on the above-mentioned information and the theory of the classical warranty model, some researchers have proposed random warranty models. For example, Ref. [35] applied limited mission data to one of the limitations of warranty coverage and proposed a two-dimensional random renewable free replacement warranty model; similarly, Refs. [36,37] also proposed a two-dimensional random repair warranty model and a three-dimensional random repair warranty model, respectively. Other classifications and discussions on random warranty models have been covered in Refs. [38,39] and will not be repeated here.
For the purpose of ensuring product/system reliability under the post-warranty coverage, many maintenance policies after the expiration of the warranty have been proposed and modeled from the perspective of consumers. Similar to classifying existing warranty models, this paper categorizes maintenance policies after the expiration of the warranty into classic maintenance policies models, condition-based maintenance policies, and random maintenance policies. Under the renewable free replacement warranty and the non-renewable pro-rata replacement warranty models, Ref. [40] used an age replacement policy as a maintenance policy after the expiration of the warranty to ensure product/system reliability under the post-warranty coverage. Subsequently, Ref. [41] used the periodic preventive maintenance policy as the maintenance policy after the expiration of the warranty and determined the optimal periodic preventive maintenance policy. Ref. [42] combined preventive maintenance with replacement and proposed a maintenance policy after the expiration of the warranty called the ‘maintenance-replacement’ policy. Other classifications and discussions of classical maintenance policy after the expiration of the warranty have been mentioned in Refs. [43,44,45] and will not be repeated here.
In the context of advanced digital technology as a technological pedestal, Ref. [36] incorporated preventive maintenance into the post-warranty coverage and proposed a maintenance policy after the expiration of the warranty called the ‘random maintenance-replacement policy’. Using a finite number of missions as product replacement limits under the post-warranty coverage, Ref. [46] proposed two random maintenance policies after the expiration of the warranty: the random age replacement first and the random age replacement last. In addition, Ref. [37] incorporated replacement into the post-warranty coverage and proposed maintenance policies after the expiration of the warranty such as a two-variable random replacement first and last and a hybrid policy.
The integration of missions into both the warranty coverage and the post-warranty coverage has enabled the investigation of a range of warranty models and maintenance policies after the expiration of the warranty. Nevertheless, a number of outstanding issues remain, as illustrated in the following section. The existing warranty models are designed solely from the manufacturer’s subjective perspective, thus neglecting certain consumer requirements such as extensive reliability management services, optimal maintenance methods, limited time for repairing, and specific preventive maintenance intervals. In the context of the random maintenance policies after the expiration of a warranty, mission cycles may emerge at two distinct levels. To illustrate, mission cycles may end either after or before the specified time threshold, which suggests the existence of two levels of mission cycles: extreme and non-extreme. In instances where the product’s age at the warranty’s expiration is greater, the associated post-warranty maintenance costs may be significantly higher if the replacement limits related to extreme mission cycles are not effectively managed.
The objective of this paper is to propose and model the random collaborative warranty model and the random replacement policy that would be applicable after the expiration of the proposed warranty model. The motivation for this undertaking is to address the aforementioned challenges. The proposed random collaborative warranty model is designated as the random collaborative preventive maintenance warranty with repair-time threshold (RCPMW-RTT). The terms and conditions of this model are jointly designed by manufacturers and consumers in order to meet specific consumer needs. The introduction of a repair-time threshold serves to limit the time delay in removing failures and to compensate for any losses incurred by consumers. The preventive maintenance interval is set by consumers according to their needs rather than manufacturers. By addressing these aspects, the RCPMW-RTT model is able to overcome the limitations observed in existing warranty models. A replacement policy is proposed: a discrete random renewable back replacement (DRRBR). Such a policy is designed to ensure reliability after the expiration of the RCPMW-RTT and requires that a product replacement be triggered either by the occurrence of the first extreme mission cycle or by reaching the limit of the number of non-extreme mission cycles, whichever occurs first. By revising the definition of the extreme and the non-extreme mission cycles in the DRRBR, the second replacement policy, the discrete random renewable front replacement (DRRFR), is proposed. In the DRRFR, the product replacement is triggered either by the occurrence of the first extreme mission cycle or by reaching the limit of the number of non-extreme mission cycles, whichever occurs first. All proposed approaches are evaluated from a mathematical perspective and are subjected to numerical analysis to elucidate the potential mechanism and to provide guidance for management.
The following sections of this paper are structured as follows: Section 2 introduces a collaborative warranty model and variants, assessing the time and cost models associated with each warranty model. In Section 3, two replacement policies are defined and modeled randomly, deriving the cost rate models for both policies. Numerical studies are conducted in Section 4 to illustrate the presented approaches and uncover hidden management insights. Finally, conclusions are drawn in Section 5.

2. Random Collaborative Warranty Contract

The assumptions made in this paper are as follows: The product operates in a single mission mode, and the hardware and software system integrated with advanced digital technology provides the manufacturer and the customer with the ability to monitor the mission data of the product. The mission cycle (i.e., the span of the duration of a single mission) is  Y i  ( i = 1 , 2 , , ), and all mission cycles are independently distributed in a common memory-less distribution, which is defined as  G ( y ) . The time  X  to the first failure of the products follows the distribution function  F ( x ) = 1 exp 0 x r ( u ) d u , where the function  r ( u )  represents the failure rate function. Preventive maintenance (PM) can reduce the PM interval (PMI); that is, the reduction of age is the maintenance effect of the PM. The time required for minimal repair, PM, or replacement is completely ignored.
As mentioned above, from the manufacturer’s subjective perspective, the manufacturer designs solely the existing warranty models, thereby neglecting certain consumer requirements such as extensive reliability management services, optimal maintenance methods, limited repair time, and specific preventive maintenance intervals. Moreover, the existing warranty models cannot generate any benefit in the process of warranting the products; that is, the manufacturer has no opportunity to achieve profitability.
To address these issues, the following subsections will present two random collaborative warranty models by allowing the manufacturer and user to participate in the process of designing the terms.

2.1. Random Collaborative Warranty

2.1.1. Definition of Collaborative Warranty

Define  n M  and  N  as three non-negative natural numbers, define  S p  as the selling price of the warranty, define  δ  ( 0 < δ 1 ) as a maintenance-effect measure, and define  τ  as the repair-time threshold; then, in the case where each failure that occurs within the warranty coverage will be rectified by minimal repair, the random collaborative warranty can be described by the following three steps:
Step 1: According to the customer’s requirements for reliability management services, the customer books a warranty service with a coverage formed by  n  mission cycles with the manufacturer, where the manufacturer is required to perform PM in the form of the PMI formed by  N  ( 0 N < n ) mission cycles, and accepts the penalty costs in the case where the failure is not rectified until the time to rectify it reaches the repair-time threshold  τ .
Step 2: Based on the customer’s demands, the manufacturer performs the following scheme:
  • Models the warranty cost resulting from Step 1 and then minimizes the warranty cost to obtain the optimal maintenance-effect measure  δ * .
  • Prices the warranty contract based on the results of minimizing the warranty cost; that is, determines the selling price  S p  of the warranty based on the results of minimizing the warranty cost.
Step 3: Both parties sign the warranty contract, and the customer pays the manufacturer the selling price  S p .
Minimal repairs are used to rectify every failure within the warranty coverage; PMs are designed to improve reliability in order to reduce the costs of subsequent failure rectification (hereafter referred to as repair costs) and increase utilization rate of products; penalty costs depend on the repair-time threshold  τ ; and warranty terms are developed in a collaborative manner between the manufacturer and customer, where the PMI is set by consumers according to their needs rather than manufacturers. Taking these factors into account, the warranty is called a random collaborative preventive maintenance warranty with repair-time threshold (RCPMW-RTT), where the PM number  M  can be determined based on the values of both  n  and  N , and the maintenance-effect measure  δ  is a decision variable.
The RCPMW-RTT offers significant advantages, including resolving customers’ passive issues resulting from existing warranties, meeting their demand for excessive reliability management services, and providing pricing opportunities to manufacturers to achieve profitability, etc. That is to say, the RCPMW-RTT can overcome the limitations observed in existing warranty models.

2.1.2. Modeling of the RCPMW-RTT

As pointed out above, the PMI is the time interval formed by  N  mission cycles. In the case of  S N  representing a PMI, then the PMI  S N  can be calculated as  S N = i = 0 N Y i  and follows the convolution distribution function  G ( N ) ( s N ) = 0 s N G ( N 1 ) ( s N u ) d G ( N ) ( s N ) . The field of reliability engineering acknowledges two fundamental principles: as a product ages, the necessity for preventive maintenance reserves increases, and as reliability improves, the associated cost of PM also rises. The implication of these realities is that the cost of the PM increases with age and reliability improvement. It is defined that each PM reduces the PMI  S N  to  δ S N . Then, after each PM, the reduction in the corresponding PMI can be modelled as  δ ¯ S N  ( δ ¯ = 1 δ ). Using this, the cost  C p m ( δ | k , S N )  of the PM until the completion of the  k th  ( k = 0 , 1 , 2 , ) PM can be modelled as an increasing function of age and reliability improvement, i.e.,
C p m ( δ | k , S N ) = k δ S N c s + c I δ ¯ S N a
where  k δ S N c s  indicates the  k th  PM reserve depending on age  k δ S N c s  ( > 0 ) is the coefficient of the PM reserve;  c I  ( > 0 ) is the reliability-improvement cost; and  a  ( > 0 ) is a parameter.
In the case where  N  is a natural number less than the mission number  n  (i.e.,  0 < N < n ), if  N 1 , then the PM number  M  is satisfied  0 M n / N ; if  N = 1 , the PM number  M  is satisfied by the expression given by  M = n 1 . Furthermore, summing the natural number  k  in the cost  C p m ( δ | k , S N )  of the PM from 1 to  M , the total cost  T C p m ( δ | S N )  of  M  PMs for the manufacturer can be obtained by
T C p m ( δ | S N ) = k = 1 M C p m ( k | δ , S N ) = c s δ S N k = 0 M k + M c I δ ¯ S N a = M ( 1 + M ) δ S N c s 2 + c I S N δ ¯ a
If the failure is not rectified until the time to rectify it reaches the repair-time threshold  τ , then the manufacturer is required to pay a penalty cost to the related consumer. Let  c m  and  c r  be the unit repair cost incurred by rectifying the unit failure and the penalty cost per unit time after the repair-time threshold  τ , respectively; then, the total cost  C M  incurred by the unit failure is given by
C M = c m R ( τ ) + R ¯ ( τ ) c m + c r τ t d R ( t ) R ¯ ( τ ) = c m + c r τ t d R ( t )
where  R ( )  and  R ¯ ( )  are the distribution and reliability functions of the repair time to rectify each failure, respectively.
When the  M th  PM is completed, the product has completed  N M  mission cycles. In this case, the remaining  n N M + 1  mission cycles are not yet completed. Therefore, the remaining warranty time  S r  after  M  PMs have been completed (i.e., a time duration formed by the remaining  n N M + 1  mission cycles) can be calculated as  S r = i = 1 n Y i M S N = i = N M + 1 n Y i . Through algebraic calculation, the repair cost  T C m ( δ | S N , S r )  resulting from all failures within the warranty coverage is obtained by
T C m ( δ | S N , S r ) = C M 0 S M r ( u ) d u + δ S N δ S N + S N r ( u ) d u + + ( M 1 ) δ S N ( M 1 ) δ S N + S N r ( u ) d u + M δ S N M δ S N + S r r ( u ) d u = c m + c r τ t d R ( t ) k = 0 M 1 k δ S N k δ S N + S N r ( u ) d u + M δ S N M δ S N + S r r ( u ) d u
By algebraic operation of the total cost  T C p m ( δ | S N )  of  M  PMs and the manufacturer’s total repair cost  T C m ( δ | S N , S r ) , the total maintenance cost  T C ( δ | S N , S r )  of the RCPMW-RTT can be obtained by
T C ( δ | S N , S r ) = T C p m ( δ | S N ) + T C m ( δ | S N , S r ) = M ( 1 + M ) δ S N c s 2 + c I S N δ ¯ a + c m + c r τ t d R ( t ) k = 0 M 1 k δ S N k δ S N + S N r ( u ) d u + M δ S N M δ S N + S r r ( u ) d u
Let  G ( n N M ) ( s r )  be the distribution function of the remaining warranty time  S r , then  G ( n N M ) ( s r )  can be expressed as  G ( n N M ) ( s r ) = 0 s r G ( n N M 1 ) ( s r u ) d G ( n N M ) ( u ) . Using the distribution function  G ( n N M ) ( s r ) , the total maintenance cost  T C ( δ | S N , S r )  of the RCPMW-RTT can be rewritten as
T C ( δ | S N ) = M ( 1 + M ) δ S N c s 2 + c I S N δ ¯ a + c m + c r τ t d R ( t ) k = 0 M 1 k δ S N k δ S N + S N r ( u ) d u + 0 M δ S N M δ S N + s r r ( u ) d u d G ( n M N ) ( s r )
By using the distribution function  G ( N ) ( s N )  to carry out the probabilistic calculation on the total maintenance cost  T C ( δ | S N )  in Equation (6), the warranty cost  W C ( δ )  of the RCPMW-RTT can be calculated as
W C ( δ ) = 0 T C ( δ | s N ) d G ( N ) ( s N ) = M c s ( 1 + M ) δ c s 0 G ¯ ( N ) ( s N ) d s N 2 + c I ( δ ¯ ) a 0 ( s N ) a d G ( N ) ( s N ) + c m + c r τ t d R ( t ) 0 k = 0 M 1 k δ s N k δ s N + s N r ( u ) d u + 0 M δ s N M δ s N + s r r ( u ) d u d G ( n M N ) ( s r ) d G ( N ) ( s N )
It is obvious that PMs cannot alter the warranty coverage that is formed by  n  mission cycles. The random warranty time  S n  within the warranty coverage can be calculated as  S n = i = 1 n Y i . By using these expectations, the warranty time  W T  of the RCPMW-RTT can be obtained by
W T = 0 G ¯ ( n ) ( s n ) d s n
where  G ( n ) ( s n )  ( = 0 s n G ( n 1 ) ( s n u ) d G ( n ) ( s n ) ) and  G ¯ ( n ) ( s n )  ( = 1 G ¯ ( n ) ( s n ) ) are the distribution and reliability functions of  S n , respectively.

2.2. Optimization and Pricing of the RCPMW-RTT

The RCPMW-RTT has been proposed to solve the problems of traditional warranties. The next step is to determine the selling price  S P  of the RCPMW-RTT.
The warranty cost  W C ( δ )  resulting from the RCPMW-RTT has been captured. By minimizing such a cost, the manufacturer can obtain the optimal reliability-improvement measure  δ * , namely, obtain the optimal PM plan. In this process, the key mathematical models involved can be expressed as
δ * = δ | M i n W C ( δ ) s u b j e c t   t o 0 < N n 0 M n N
Warranty cost and time are two measurements needed to measure RCPMW-RTT. Therefore, both can be used to price such a RCPMW-RTT. In the field of reliability, the Cobb–Douglas production function is a feasible method to simulate the price (see Ref. [45]). Similarly, using the Cobb–Douglas production function, the price function  S P ( δ * )  of the RCPMW-RTT can be modeled as
S P ( δ * ) = c p W C ( δ * ) ρ W T σ
where  c p  ( > 0 ) is a cost parameter, and  ρ  ( > 0 ) and  σ  ( > 0 ) are two parameters.

2.3. Variant Warranties

If  c s = 0  and  δ = 1 , no PM is performed under the warranty coverage, resulting in the reduction of RCPMW-RTT to a random collaborative repair warranty with repair-time threshold (RCRW-RTT), where minimal repair is the method to correct any failure under the warranty coverage and  δ  is no longer a decision variable. The warranty cost of RCRW-RTT can be obtained as
lim c s = 0 δ = 1 W C ( δ ) = c m + c r τ t d R ( t ) 0 0 M s N r ( u ) d u + 0 M s N M s N + s r r ( u ) d u d G ( n M N ) ( s r ) d G ( N ) ( s N )
When  c r 0 , all penalty costs that depend on the repair-time threshold are removed, resulting in the reduction of RCPMW-RTT to a random collaborative preventive maintenance warranty (RCPMW), where  δ  is a unique decision variable. The warranty cost of the RCPMW can be expressed as
lim c r 0 W C ( δ ) = M ( 1 + M ) δ c s 0 G ¯ ( N ) ( s N ) d s N 2 + c I 0 s N δ ¯ a d G ( N ) ( s N ) + c m 0 k = 0 M 1 k δ s N k δ s N + s N r ( u ) d u + 0 M δ s N M δ s N + s r r ( u ) d u d G ( n M N ) ( s r ) d G ( N ) ( s N )
As previously stated, the warranty coverage cannot be modified by PMs. Consequently, the warranty period for the RCRW-RTT and the RCPMW is identical to that of the RCPMW-RTT, and their pricing methodology is analogous to that of the RCPMW-RTT. In light of these considerations, there is no necessity to reiterate them here.

3. Random Replacement Policies

The RCPMW-RTT included in our paper can manage product reliability throughout the warranty coverage. It is critical for the consumer to carefully evaluate methods for managing the reliability of the products that are going through the warranty coverage. The following section presents two random replacement policies after the expiry of the RCPMW-RTT, which can be implemented to effectively manage product reliability through the RCPMW-RTT.

3.1. Random Replacement Policy a

As pointed out above, in the case where the product’s age at the warranty’s expiration is greater, the associated post-warranty maintenance costs may be significantly higher if replacement limits related to the extreme mission cycles are not effectively managed. To address this issue, the subsequent section defines the extreme and the non-extreme mission cycles and proposes and models a novel random replacement policy.
Let  ς  represent a time threshold (a constant), then the mission cycle is defined as an extreme mission cycle if it does not end before the time threshold  ς , or is defined as a non-extreme mission cycle if it does end before the time threshold  ς . Using such declarations, the first random replacement policy is defined and modeled in the following subsections.

3.1.1. The Definition of Policy a

Consider  K  as a non-negative integer (a decision variable); subsequently, in the case where the renewal of the time threshold  ς  accompanies the renewal of each mission cycle, the terms of random replacement are enumerated as follows:
  • If the current mission cycle ends before the time threshold  ς , which is a non-extreme mission cycle, then the next mission cycle is renewed from the end of the current mission cycle;
  • In the process of renewing the above term, if the  K th  mission cycle ends before the time threshold  ς , then such a product will be replaced at the end of the  K th  mission cycle before the time threshold  ς ;
  • In the process of renewing the first term, if the extreme mission cycle arises before the  K th  mission cycle is renewed, then such a product will be replaced at the time threshold  ς  before the end of such a mission cycle.
In such a replacement policy, the next mission cycle is renewed depending on whether the current mission cycle ends before the time threshold  ς , namely whether the current mission cycle is an extreme mission cycle or not; when the  K th  mission cycle ends before the time threshold  ς  or the extreme mission cycle arises before the  K th  mission cycle is renewed, whichever occurs first, the replacement will be at the corresponding time points.
Obviously, in terms of such a replacement policy, if the first extreme mission cycle arises before the  K th  mission cycle is renewed, then the replacement will be performed at the time threshold  ς ; otherwise, the replacement is performed at the end of the  K th  mission cycle before the first extreme mission cycle arises.
The current mission cycle still will not end until the time threshold  ς ’, in the definition of the extreme mission cycle, is equivalent to the current mission cycle ending after the time threshold  ς ’. Considering that the keyword ‘after’ has the meaning of the keyword ‘back’, such a random replacement policy is named the discrete random renewable back replacement (DRRBR), wherein  K  is a discrete scale to control maintenance cost.

3.1.2. The Modeling of the DRRBR

If the  K th  mission cycle ends before the first extreme mission cycle arises, namely the first  K  mission cycles are non-extreme mission cycles, then such a product will be replaced at the end of the  K th  mission cycle before the time threshold  ς . Let  Z i  represent the  i th  ( i = 1 , 2 , , K ) mission cycle that ends before the time threshold  ς , then all elements from the sequence  Z i  formed by  K  mission cycles satisfying the above conditions are independent and identically distributed random variables. In the case of letting  Z  be the copy of all elements in the sequence  Z i , the random variable  Z  satisfies the conditional distribution function  H a ( z )  given by
H a ( z ) = Pr { Z < z | Z ς } = G ( z ) G ( ς )
where  z ς .
When the product goes through the RCPMW-RTT, its age equates to  N δ S N + S r . Based on the reliability theory, the failure-rate function at age  N δ S N + S r  can be expressed as  r N δ S N + S r + u . Obviously, the mean failure number between the  j th  ( j = 1 , 2 , ) renewal and the  ( j + 1 ) th  renewal can be modeled as  ( j 1 ) Z j Z r N δ S N + S r + u d u . The repair cost  R C a 1 ( K | S N , S r , Z )  until the replacement is conducted at the end of the  K th  mission cycle before the time threshold  ς  can be obtained by
R C a 1 ( K | S N , S r , Z ) = c m j = 1 K ( j 1 ) Z j Z r N δ S N + S r + u d u
By means of the distribution function  H a ( z ) , the repair cost  R C a 1 ( K | S N , S , Z )  can be revised as another expression  R C a 1 ( K | S N , S r )  given by
R C a 1 ( K | S N , S r ) = 0 ς R C a 1 ( K | S N , S r , z ) d H a ( z ) = c m 0 ς j = 1 K ( j 1 ) z j z r N δ S N + S r + u d u d H a ( z )
In the event that the current mission cycle still does not end until the time interval  ς  occurs before the  K th  mission cycle is renewed, then the corresponding product will be replaced at the time threshold  ς  before the end of such a mission cycle. Let  k a  ( k a = 1 , 2 , , K 1 ) be the renewal number of the mission cycle in the event that the current mission cycle still does not end until the time threshold  ς  occurs before renewing the  K th  mission cycle; then, the repair cost  R C a 2 ( k a | S N , S r , Z )  until the occurrence of such a replacement can be obtained by
R C a 2 ( k a | S N , S r , Z ) = c m j = 1 k a ( j 1 ) Z j Z r N δ S N + S r + u d u + k a Z k a Z + ς r N δ S N + S r + u d u
where  j = 1 , , K 1 0 · = 0  and is used similarly in the following.
By means of the distribution function  H a ( z ) , the repair cost  R C a 2 ( k a | S N , S r , Z )  can be revised as another expression  R C a 2 ( k a | S N , S r )  given by
R C a 2 ( k a | S N , S r ) = 0 ς R C a 2 ( k a | S N , S r , z ) d H a ( z ) = c m 0 ς j = 1 k a ( j 1 ) z j z r N δ S N + S r + u d u + k a z k a z + ς r N δ S N + S r + u d u d H a ( z )
In the renewing of the first term in the DRRBR, if the  K th  mission cycle ends prior to the time threshold  ς , then the related product will be replaced at the end of such a mission cycle. Therefore, under the DRRBR, the probability that the  K th  mission cycle ends before the time threshold  ς , namely the first  K  mission cycles are non-extreme mission cycles rather than extreme mission cycles, can be given by  G ( ς ) K . In the event that the current mission cycle still does not end at the time threshold  ς  and occurs before renewing the  K th  mission cycle, the related product will be replaced at the time threshold  ς . Therefore, under the DRRBR, the occurrence probability that the current mission cycle will still not end at the time threshold  ς  before renewing the  K th  mission cycle can be given by  k a = 0 K 1 G ( ς ) k a G ¯ ( ς ) . Using both, the total cost  T C a ( K | S N , S r )  resulting from the DRRBR can be obtained by
T C a ( K | S N , S r ) = G ( ς ) K R C a 1 ( K | S N , S r ) + C R + k a = 0 K 1 G ( ς ) k a G ¯ ( ς ) R C a 2 ( k a | S N , S r ) + C R = c m G ( ς ) K 0 ς j = 1 K ( j 1 ) z j z r N δ S N + S r + u d u d H a ( z ) + C R + c m k a = 0 K 1 G ( ς ) k a G ¯ ( ς ) 0 ς j = 1 k a ( j 1 ) z j z r N δ S N + S r + u d u + k a z k a z + ς r N δ S N + S r + u d u d H a ( z )
By means of the distribution function  G ( N ) ( s N )  and  G ( n M N ) ( s r ) , the total cost  T C a ( K | S N , S r )  of the DRRBR can be rewritten as
T C a ( K ) = 0 0 T C a ( K | s N , s r ) d G ( N ) ( s N ) d G ( n M N ) ( s r ) = c m 0 0 G ( ς ) K 0 ς j = 1 K ( j 1 ) z j z r N δ s N + s r + u d u d H a ( z ) + k a = 0 K 1 G ( ς ) k a G ¯ ( ς ) 0 ς j = 1 k a ( j 1 ) z j z r N δ s N + s r + u d u + k a z k a z + ς r N δ s N + s r + u d u d H a ( z ) d G ( N ) ( s N ) d G ( n M N ) ( s r ) + C R = c m 0 0 G ( ς ) K 1 0 ς j = 1 K ( j 1 ) z j z r N δ s N + s r + u d u d G ( z ) + k a = 0 K 1 G ( ς ) k a 1 G ¯ ( ς ) 0 ς j = 1 k a ( j 1 ) z j z r N δ s N + s r + u d u + k a z k a z + ς r N δ s N + s r + u d u d G ( z ) d G ( N ) ( s N ) d G ( n M N ) ( s r ) + C R
The sum formed by all elements from the sequence  Z i  can be calculated as  i = 0 K Z i . Therefore, the replacement time  R T a 1 ( K )  until the replacement is carried out at the end of the  K th  mission cycle before the time threshold  ς  can be obtained by
R T a 1 ( K , T ) = E i = 0 K Z i = K 0 ς z d H a ( z ) = K 0 ς z d G ( z ) G ( ς )
where  Z 0 = 0 .
In the event that the current mission cycle still does not end at the time threshold  ς  and occurs before the end of the  K th  mission cycle, namely the extreme mission cycle arises before renewing the  K th  mission cycle, the product will be replaced at the time threshold  ς  before renewing the  K th  mission cycle. The replacement time  R T a 2 ( k a )  until this case occurs can be obtained by
R T a 2 ( k a ) = E i = 0 k a Z i + ς = k a 0 ς z d H a ( z ) + ς = k a 0 ς z d G ( z ) G ( T ) + ς
By means of the probability  G ( ς ) K  and  k a = 0 K 1 G ( ς ) k a G ¯ ( ς ) , the replacement time  R T a ( K )  of the DRRBR can be obtained by
R T a ( K ) = G ( ς ) K R T a 1 ( K ) + k a = 0 K 1 G ( ς ) k a G ¯ ( ς ) R T a 2 ( k a ) = G ( ς ) K K 0 ς z d G ( z ) G ( ς ) + k a = 0 K 1 G ( ς ) k a G ¯ ( ς ) k a 0 ς z d G ( z ) G ( ς ) + ς = 1 G ( ς ) K 0 ς G ¯ ( z ) d z G ¯ ( ς )
In the field of reliability, availability is considered a type of objective function (refer to Refs. [47,48,49,50,51,52,53,54,55,56,57]), while the cost rate based on the renewal-reward theory in Ref. [58] represents another type of objective function which has been used in Refs. [59,60]. Since time measures are utilized as components of availability, the availability objective function can only evaluate the characteristics of the proposed approaches from a time perspective. On the contrary, the cost rate is related to both time and cost measures. Thus, it is an accurate and comprehensive evaluation basis. In this context, the cost rate is utilized as an objective function for modeling the DRRBR, i.e., the cost rate  C R a ( K )  of the DRRBR can be calculated as
C R a ( K ) = C F + T C a ( K ) W T + R T a ( K )
where  C F  is the total failure cost produced by the RCPMW-RTT and is obtained by replacing  c m  in the warranty cost  W C with the unit failure cost  c f , replacing  c r  in the warranty cost  W C  with  c r , and replacing  M ( 1 + M ) δ c s 0 G ¯ ( N ) ( s N ) d s N / 2 + c I ( δ ¯ ) a 0 s N a d G ( N ) ( s N )  in the warranty cost  W C  with  c f , respectively.

3.2. Random Replacement Policy b

The mission cycle is defined as an extreme mission cycle if it ends before the time threshold  ς , or is defined as a non-extreme mission cycle if it does end after the time threshold  ς . The text says that the extreme and non-extreme mission cycles in the following random replacement policy are obtained by revising the definition of extreme and non-extreme mission cycles in the DRRBR.
Using such declarations, the second random replacement policy is defined and modeled in the following subsections.

3.2.1. The Definition of Policy b

In the case where the renewal of the time threshold  ς  accompanies the renewal of each mission cycle, the terms of the random replacement policy are enumerated as follows:
  • If the current mission cycle ends after the time threshold  ς , then the next mission cycle is renewed from the end of the current mission cycle;
  • In the process of renewing the above term, if the  K th  mission cycle ends after the time threshold  ς , namely the first  K  mission cycles are non-extreme mission cycles, then such a product will be replaced at the end of the  K th  mission cycle after the time threshold  ς ;
  • In the process of renewing the first term, if the first extreme mission cycle arises before the  K th  mission cycle is renewed, then such a product will be replaced at the end of such an extreme mission cycle.
Compared to the DRRBR, this replacement policy is obtained by revising some of the keywords ‘after’ to ‘before’ and some of the keywords ‘before’ to ‘after’. Considering that the keyword ‘before’ has the meaning of the keyword ‘front’ in the case that the current mission cycle ends before the time interval  ς ’, such a replacement policy is named the discrete random renewable front replacement (DRRFR).

3.2.2. The Modeling of the DRRFR

Similar to the text before Equation (11), defining  Z i  as the  i th  mission cycle that end after the time threshold  ς , all elements from the sequence  Z i  formed by  K  mission cycles satisfying the above conditions are independent and identically distributed random variables. Let  Z  be the copy of all elements from such a sequence; then, the random variable  Z  satisfies the conditional reliability function  H ¯ b ( z )  given by
H ¯ b ( z ) = Pr { Z > z | Z > ς } = G ¯ ( z ) G ¯ ( ς )
where  z > ς .
The repair cost  R C b 1 ( K | S N , S r , Z )  until the replacement is conducted at the end of the  K th  mission cycle after the time interval DRRFR can be obtained by
R C b 1 ( K | S N , S r , Z ) = c m j = 1 K ( j 1 ) Z j Z r N δ S N + S r + u d u
By means of the reliability function  H ¯ b ( z ) , the repair cost  R C b 1 ( K | S N , S r , Z )  can revised as another expression  R C b 1 ( K | S N , S r )  given by
R C b 1 ( K | S N , S r ) = 0 T R C b 1 ( K | S N , S r , z ) d H ¯ b ( z ) = c m ς j = 1 K ( j 1 ) z j z r N δ S N + S r + u d u d H ¯ b ( z )
Let  Z s  represent the mission cycle that ends before the time threshold  ς , and let  k b  ( 0 k a K 1 ) be the renewal number of the mission cycle in the event that the current mission cycle ends prior to the time threshold  ς  and occurs before renewing the  K th  mission cycle; then the repair cost  R C b 2 ( k b | S N , S r , Z s , Z )  until the replacement is performed at the end of such a mission cycle can be obtained by
R C b 2 ( k b | S N , S r , Z s , Z ) = c m j = 1 k b ( j 1 ) Z j Z r N δ S N + S r + u d u + k b Z k b z + Z s r N δ S N + S r + u d u
By means of the reliability function  H ¯ b ( z ) , the repair cost  R C b 2 ( k b | S N , S r , Z s , Z )  can be revised as another expression  R C b 2 ( k b | S N , S r , Z s )  given by
R C b 2 ( k b | S N , S r , Z s ) = ς R C b 2 ( k b | S N , S r , Z s , z ) d H ¯ b ( z ) = c m ς j = 1 k b ( j 1 ) z j z r M S N + S r + u d u + k b z k b z + Z s r M S N + S r + u d u d H ¯ b ( z )
In renewing the first term in the DRRFR, if the  K th  mission cycle ends after the time threshold  ς , namely the first  K  mission cycles are non-extreme mission cycles rather than extreme mission cycles, then the related product will be replaced at the end of such a mission cycle. Obviously, under the DRRFR, the probability that the related product will be replaced at the end of the  K th  mission cycle after the time threshold  ς  can be given by  G ¯ ( ς ) K . In the event that the current mission cycle ends before the time threshold  ς  occurs (namely the first extreme mission cycle arises) before the completion of the  K th  mission cycle, the product will be replaced at the end of such a mission cycle. Obviously, under the DRRFR, the related product will be replaced at the end of the first extreme mission cycle for a cost given by  k b = 0 K 1 G ¯ ( ς ) k b G ( ς ) . Using both, the total cost  T C b ( K | S N , S r , Z s )  of the DRRFR can be obtained by
T C b ( K | S N , S r , Z s ) = G ¯ ( ς ) K R C b 1 ( K | S N , S r ) + C R + k b = 0 K 1 G ¯ ( ς ) k b G ( ς ) R C b 2 ( k b | S N , S r , Z s ) + C R = c m G ¯ ( ς ) K ς j = 1 K ( j 1 ) z j z r M S N + S r + u d u d H ¯ b ( z ) + C R c m k b = 0 K 1 G ¯ ( ς ) k b G ( ς ) ς j = 1 k b ( j 1 ) z j z r M S N + S r + u d u + k b z k b z + Z s r M S N + S r + u d u d H ¯ b ( z )
By means of the distribution function  G ( N ) ( s N )  and  G ( n M N ) ( s ) , the total cost  T C b ( K )  of the DRRFR can be rewritten as
T C b ( K ) = 0 0 0 T T C b ( K | s N , s r , z s ) d I ( z s ) d G ( N ) ( s N ) = c m 0 0 G ¯ ( ς ) K ς j = 1 K ( j 1 ) z j z r N δ s N + s r + u d u d H ¯ b ( z ) + k b = 0 K 1 G ¯ ( ς ) k b G ( ς ) ς j = 1 k b ( j 1 ) z j z r N δ s N + s r + u d u + 0 ς k b z k b z + z s r N δ s N + s r + u d u d I ( z s ) d H ¯ b ( z ) d G ( N ) ( s N ) d G ( n M N ) ( s r ) + C R = c m 0 0 G ¯ ( ς ) K 1 ς j = 1 K ( j 1 ) z j z r N δ s N + s r + u d u d G ( z ) + k b = 0 K 1 G ¯ ( ς ) k b 1 ς G ( ς ) j = 1 k b ( j 1 ) z j z r N δ s N + s + u d u + 0 ς k b z k b z + z s r N δ s N + s r + u d u d G ( z s ) d G ( z ) d G ( N ) ( s N ) d G ( n M N ) ( s r ) + C R
where  I ( z s )  represents the distribution function of the random variable  Z s  and satisfies  I ( z s ) = Pr { Z s < z s | Z s ς } = G ( z s ) / G ( ς )  with  z s ς .
The replacement time  R T b 1 ( K )  until the replacement is performed at the end of the  K th  mission cycle after the time threshold  T  (namely the first  K  mission cycles are non-extreme mission cycles rather than extreme mission cycles) can be obtained by
R T b 1 ( K ) = E i = 0 K Z i = K ς z d H ¯ b ( z ) = K ς z d G ( z ) G ¯ ( ς )
In the event that the current mission cycle ends before the time threshold  ς  occurs (namely the first extreme mission cycle arises) and before the renewal of the  K th  mission cycle, the product will be replaced at the end of such a cycle. In this case, the replacement time  R T b 2 ( k b )  can be obtained by
R T b 2 ( k b ) = E i = 0 k b Z i + Z s = k b ς z d H a ( z ) + 0 ς z s d I ( z s ) = k b ς z d G ( z ) G ¯ ( ς ) + 0 ς z s d G ( z s ) G ( ς )
By means of the probability  G ¯ ( ς ) K  and  k b = 0 K 1 G ¯ ( ς ) k b G ( ς ) , the replacement time  R T b ( K )  of the DRRFR can be obtained by
R T b ( K ) = G ¯ ( ς ) K R T b 1 ( K ) + k b = 0 K 1 G ¯ ( ς ) k b 1 G ( ς ) R T b 2 ( k b ) = G ¯ ( ς ) K K ς z d G ( z ) G ¯ ( ς ) + k b = 0 K 1 G ¯ ( ς ) k b G ( ς ) k b ς z d G ( z ) G ¯ ( ς ) + 0 ς z s d G ( z s ) G ( ς ) = 1 G ¯ ( ς ) K 0 G ¯ ( z ) d z G ( ς )
Similar to Equation (21), the cost rate  C R b ( K )  of the DRRFR can be calculated as
C R b ( K ) = C F + T C b ( K ) W T + R T b ( K )

4. Numerically Analyzing the Proposed Approaches

The previous sections have presented three random warranties and two random replacement policies, which have been modeled. Extracting valuable management insights from these proposals is crucial for guiding practical implementations. It is evident that obtaining management enlightenment solely through analytical analysis poses challenges. Hence, to uncover hidden management enlightenments, numerical analysis will be conducted on three representative examples: RCPMW-RTT, DRRBR, and DRRFR, among the five proposed approaches.
Gas detection robots are widely used to remotely detect whether the gas present in the coal mine exceeds the standard. The operation and maintenance systems integrated with advanced digital technologies can collect data/information including but not limited to failures and usage and can store all collected data/information in the history lists of the manufacturers and the users, respectively. The consumer activates the gas detection robot before use and deactivates the gas detection robot after use, with the time interval between activation and deactivation representing a duty cycle. Considering these factors, a gas detection robot is used as a case study.
In reliability practice, it has been found that failure rate functions for gas detection robots are increasing functions with accumulated operating time or age. Based on this, the failure rate functions are set as increasing functions:  r ( u ) = β ( u ) α , where  β > 0  and  α 0 . In addition, mission cycles  Y i  and  Z i  have been assumed to be independent and identically distributed random variables with memory-less distribution functions given by  G ( y )  and  G ( z ) . In reliability theory, the exponential distribution function is a memory-less distribution function. In view of this,  G ( y ) = 1 exp λ y  and  G ( z ) = 1 exp λ z  are used as the memory-less distribution functions modeling mission cycles  Y i  and  Z i , respectively, where  λ > 0 . Some of the parameters are assigned as  β = 0.8 c r = 0.5 c s = 0.01 c I = 0.7 , and  c f = 0.1 .

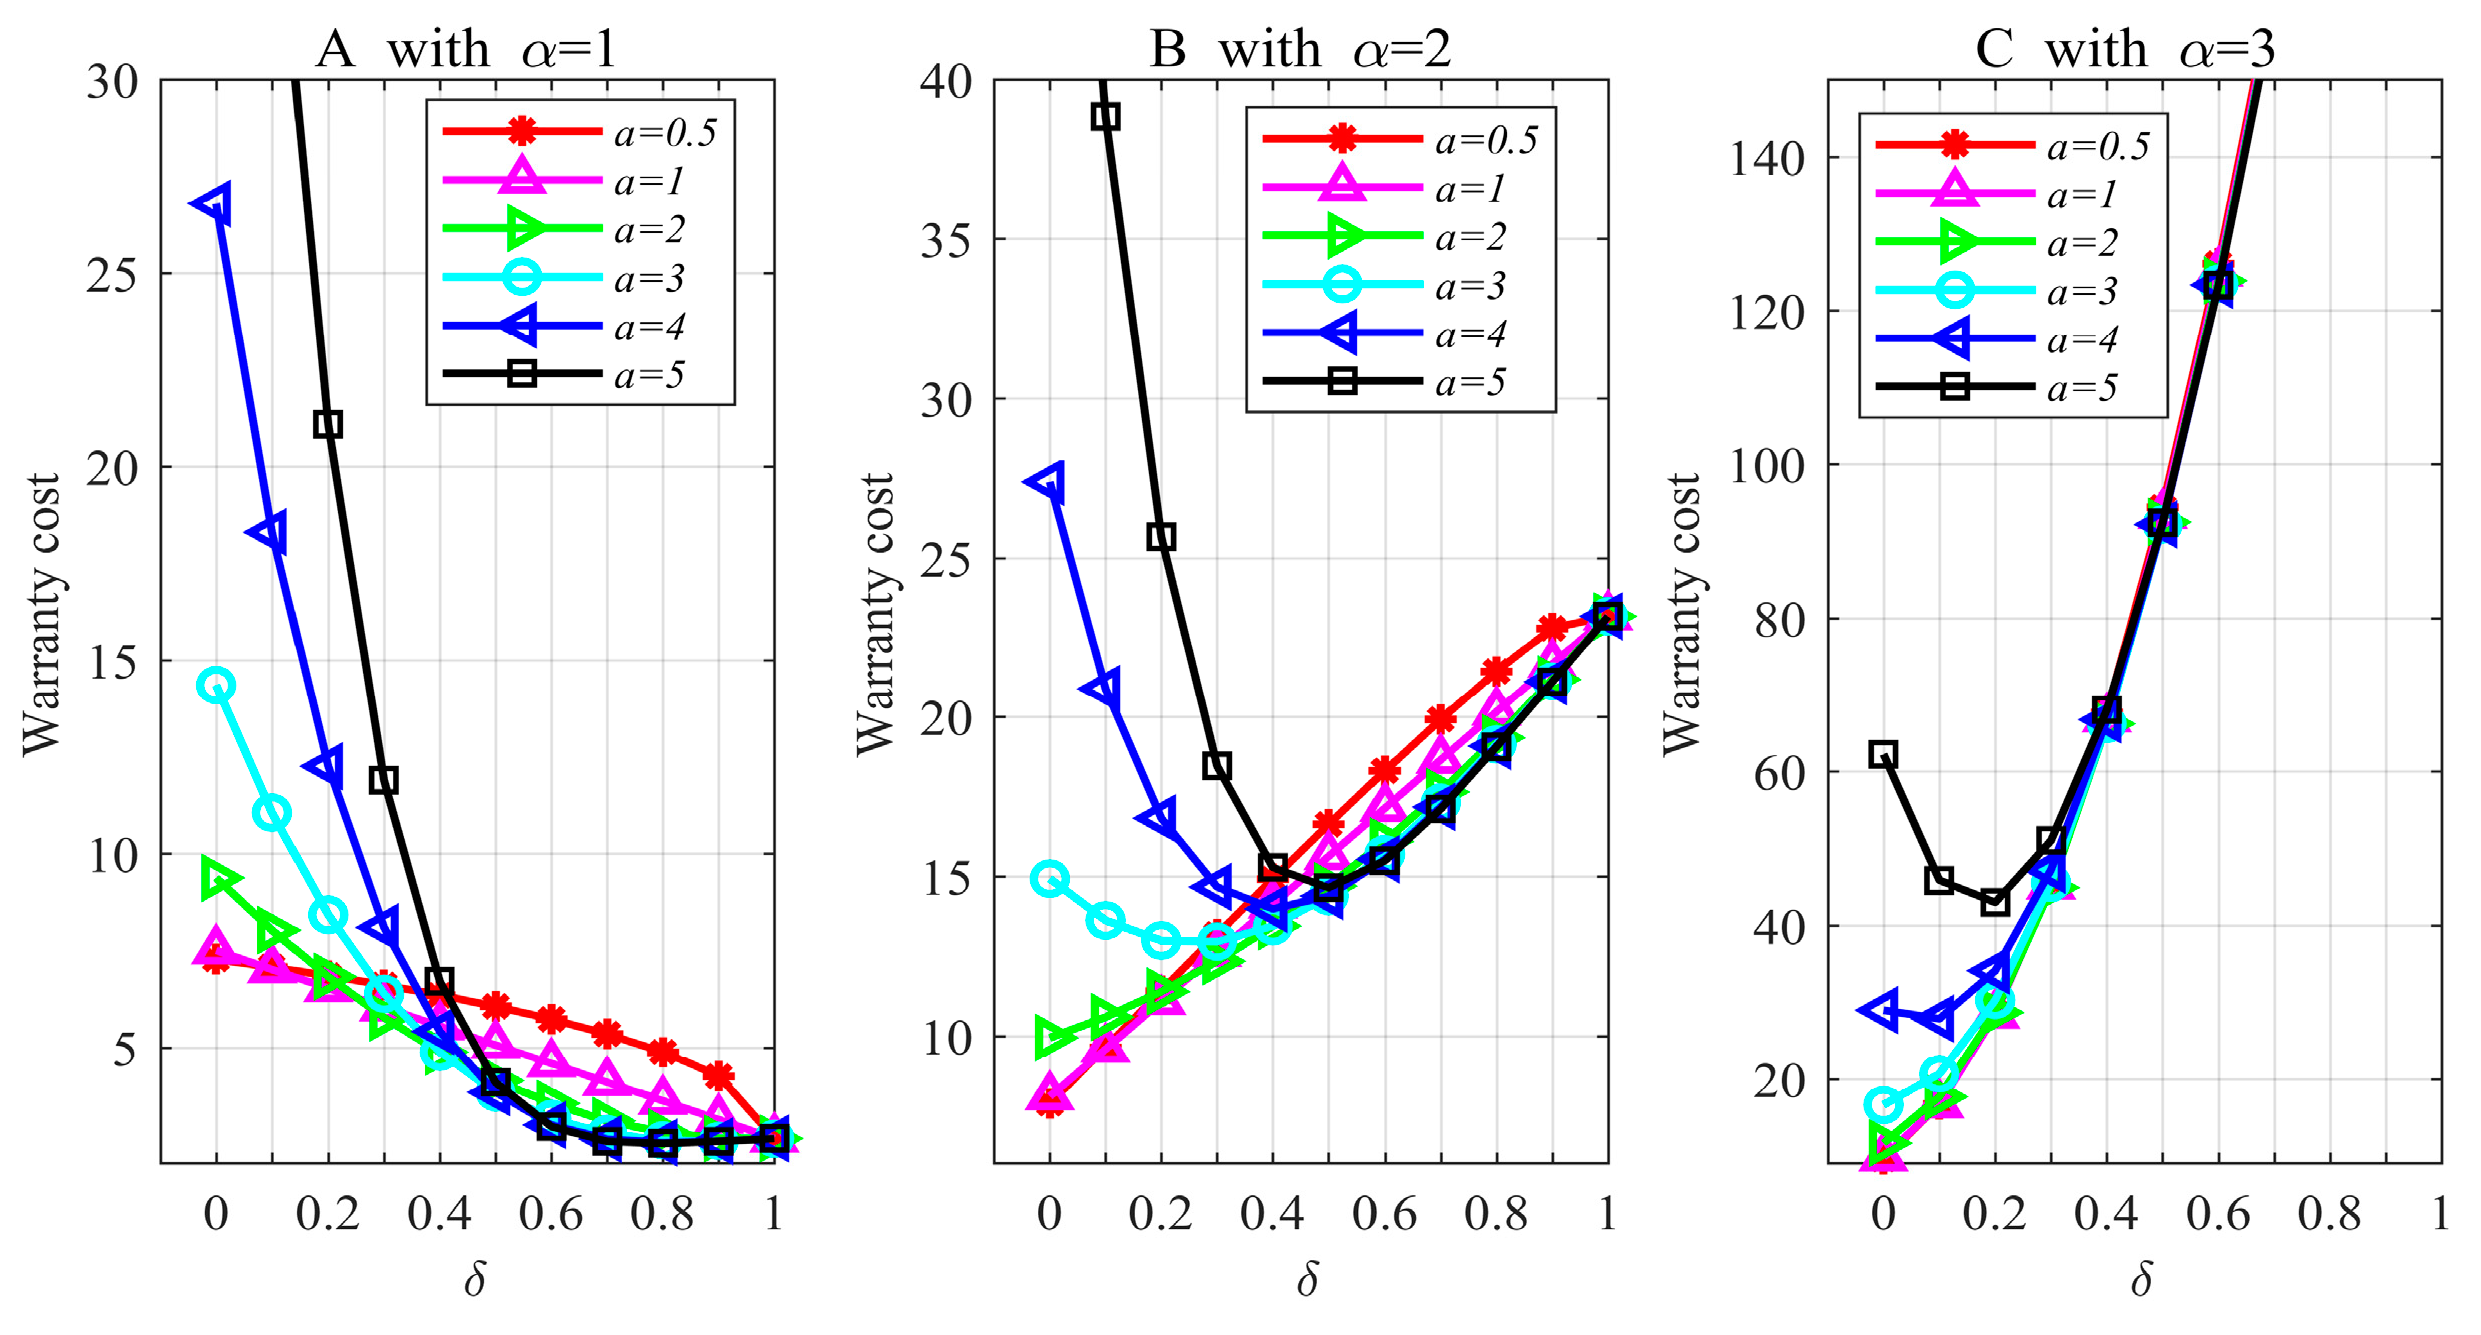
4.1. Numerically Analyzing the RCPMW-RTT

To show the effects of both the parameter  a  in the cost of the PM and the shape parameter  α  in the failure rate function of the PM plan, Figure 1 has been obtained by assigning  λ = 3 n = 25 N = 3 τ = 0.5 ς = 2 M = 8 , and  c m = 0.05 . Figure 1A shows that, for  a = 0.5 ,   1 , the warranty cost decreases strictly, implying that the optimal PM plan does not exist; while for  a = 2 ,   3 ,   4 ,   5 , the warranty cost has a minimum value, implying that the PMs are necessary. Figure 1B shows that for  a = 0.5 ,   1 ,   2 , the warranty cost increases strictly, implying that the introduction of the PMs may unnecessarily reduce the warranty cost; for  a = 3 ,   4 ,   5 , the warranty cost has a minimum value, implying that the optimal PM plan exists.
Figure 1C shows that for  a = 0.5 ,   1 ,   2 ,   3 , the warranty cost strictly increases, implying that introducing the PMs may unnecessarily reduce the warranty cost; for  a = 4 ,   5 , the warranty cost has a minimum value, implying that the optimal PM plan exists. These results imply that both whether the PM is introduced and whether the PM plan is introduced, if the PM is introduced, depend on some key parameters.
To obtain the effects of the parameter  N  on the PM plan in the RCPMW-RTT, Figure 2 was obtained where  α = 2 a = 2 τ = 0.5 λ = 5 n = 16 ς = 2 , and  c m = 0.05 .
Figure 2 shows that for  N = 2 , the warranty cost increases strictly; for  N = 3 , 4 , the warranty cost has a minimum value. These imply that, for a smaller  N , introducing the PMs can reduce the warranty cost while the optimal PM plan does not exist; for a larger  N , the optimal PM plan does exist.
To compare the performance of the RCPMW-RTT, the RCRW-RTT and the RCPMW, Figure 3 has been obtained where  α = 2 a = 2 τ = 0.5 λ = 5 n = 16 N = 3 M = 5 ς = 2 , and  c m = 0.05 .
Figure 3 shows that the warranty cost of the RCPMW-RTT is greater than the warranty cost of the RCPMW, and the warranty cost of the RCRW-RTT is greater than the minimum values of the warranty cost associated with the RCPMW. The former result implies that introducing the penalty cost has no effect on the optimal PM plan and it cannot reduce the warranty cost; the latter result implies that the warranty cost is not necessarily reduced if the PM is not introduced.

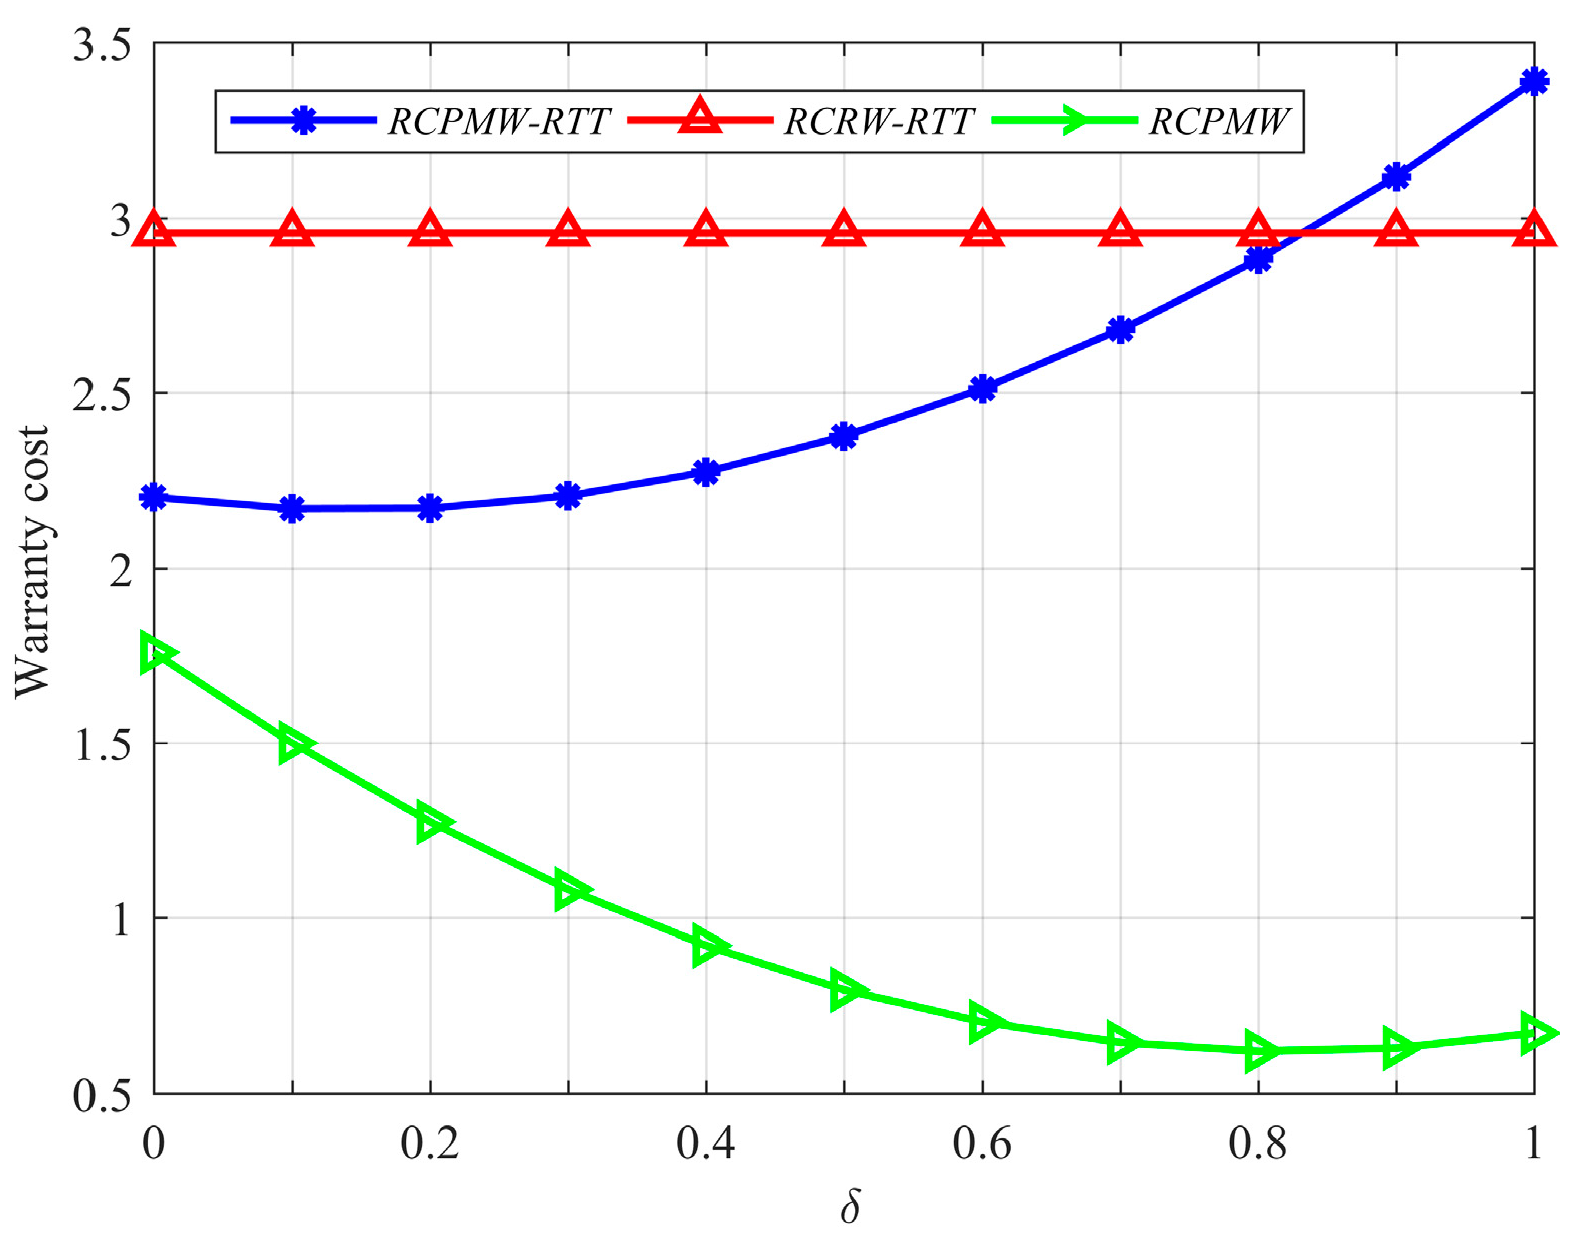
4.2. Numerically Analyzing the Proprosed Renewable Replacements

4.2.1. Numerically Analyzing the DRRBR

To explore whether the optimal DRRBR exists uniquely and to mine the effects of the replacement cost  C R  and the time threshold  ς  on the optimal DRRBR, Figure 4 has been obtained where  α = 2 a = 2 λ = 5 n = 23 τ = 0.9 N = 4 δ = 0.8 M = 5 , and  c m = 0.05 . Figure 4 shows that the minimum cost rate exists uniquely, implying that optimal DRRBR exists uniquely. Under the case of using  ς = 2 , Figure 4A shows that the optimal discrete scale  K *  increases with respect to  C R  and the minimum cost rate increases with respect to  C R  as well. This indicates that the larger replacement cost  C R  can extend the replacement time but cannot reduce the cost rate. Under the case of using  C R = 12 , Figure 4B shows that the optimal discrete scale  K *  decreases the time threshold  ς  while the minimum cost rate increases with respect to such a threshold  ς . This signals that when the time threshold  ς  associated with the extreme mission cycle definition is shorter, the replacement time is extended at a lower cost rate.
Using  λ = 5 α = a = 2 c m = 0.2 τ = 0.9 ς = 2 δ = 0.8 , and  C R = 12 , Table 1 has been presented to explore the impact of the mission number  n  required by the consumer and the mission number  N  in the PMI on the optimal DRRBR. In Table 1, it is shown that the optimal discrete scale  K *  is non-increasing with respect to the number of  n  missions required by users; the minimum cost rate shows a non-increasing trend with respect to such a number as well. Furthermore, for a given  n , it is observed that the optimal discrete scale  K *  decreases with respect to the number of  N  missions in the PMI; however, there is an increase in the minimum cost rate with respect to this number.
Using  λ = 5 α = a = 2 τ = 0.9 n = 23 N = 4 M = 5 c m = 0.2 C R = 12 , and  ς = 2 , Table 2 has been presented to explore the impact of the maintenance-effect measure  δ  and the repair-time threshold  τ  on the optimal DRRBR.
In Table 2, the optimal discrete scale K *  shows a decreasing trend with respect to the maintenance-effect measure  δ ; however, the minimum cost rate shows an increasing trend with respect to such a measure. Furthermore, for a given δ, it is observed that there is an increase in the minimum cost rate with respect to the repair-time threshold  τ . The former observation indicates that the replacement time under the post-warranty coverage increases as the maintenance quality improves. The latter observation shows that the cost rate can be reduced by setting a smaller repair-time threshold  τ .

4.2.2. Numerically Analyzing the DRRFR

To explore whether the optimal DRRFR exists uniquely and to mine the effects of the replacement cost  C R  and the time threshold  ς  on the optimal DRRFR, Figure 5 has been obtained where  α = 2 a = 2 λ = 3 τ = 0.5 n = 23 N = 4 δ = 0.5 M = 5 , and  c m = 0.2 .
Figure 5 shows that the minimum cost rate exists uniquely, implying that the optimal DRRFR exists uniquely. Figure 5A shows that the optimal discrete scale  K *  increases with  C R  and the minimum cost rate increases with  C R . This is similar to Figure 4A. Figure 5B shows that optimal discrete scale  K *  decreases with time threshold  ς  while the minimum cost rate increases with respect to such a threshold as well. This is similar to that in Figure 4B.
Using  λ = 3 α = a = 2 τ = 0.5 c m = 0.2 C R = 12 δ = 0.8  and  ς = 0.1 , Table 3 has been presented to explore the impact of the mission number  n  required by the consumer and the mission number  N  in the PMI on the optimal DRRFR. In Table 3, the minimum cost rate shows a non-increasing trend with respect to the number of  n  missions. Furthermore, for a given  n , it is observed that there is a decrease in the minimum cost rate with respect to the mission number  N  in the PMI.
Using  λ = 3 α = a = 2 n = 23 N = 3 M = 7 c m = 0.2 C R = 12 , and  ς = 0.1 , Table 4 has been presented to explore the impact of the maintenance-effect measure  δ  and the repair-time threshold  τ  on the optimal DRRFR.
In Table 4, the minimum cost rate exhibits an increasing trend with respect to the maintenance-effect measure  δ . Furthermore, for a given  δ , it is observed that there is an increase in the minimum cost rate with respect to the repair-time threshold  τ  as well. Such observations indicate that the replacement time under the post-warranty coverage increases as the maintenance quality improves and the cost rate can be reduced by setting a smaller repair-time threshold  τ . This is identical to that of Table 2.

5. Conclusions

Using the practical assistance of advanced digital technology, there is an innovative focus on exploring fresh approaches to managing product reliability throughout its life cycle. In view of this, this study introduces a novel collaborative preventive maintenance warranty with repair-time threshold (RCPMW-RTT), where manufacturers and consumers jointly design terms that cater to specific consumer requirements instead of being solely designed by manufacturers. This differs from existing warranty models where all terms are independently determined by manufacturers. The advantage of such a warranty model lies in its ability to overcome the limitations associated with current warranty models. Additionally, this paper proposes and models discrete random renewable back replacement (DRRBR) and discrete random renewable front replacement (DRRFR) by introducing definitions for extreme and non-extreme mission cycles. These policies ensure reliability after the expiration of the RCPMW-RTT and represent two novel approaches to product replacement. Under these policies, product replacement is triggered either by the occurrence of the first extreme mission cycle or when the limit on non-extreme mission cycles is reached, whichever comes first. By utilizing selected proposed solutions as representative examples, valuable management insights are derived through numerical analysis.
Based on the mission data, this paper introduces an innovative approach called random collaborative preventive maintenance warranty with repair-time threshold (RCPMW-RTT) along with two random replacement strategies. These solutions offer fresh perspectives in effectively managing product reliability throughout its life cycle. However, it fails to consider alternative approaches such as ‘whichever comes last’ and a combination of ‘whichever comes first’ and ‘whichever comes last’, which can effectively handle multiple limits in the multi-limit warranty and replacement scenarios. The authors are currently focusing on addressing these two specific topics.

Author Contributions

Validation, H.C.; Formal analysis, J.C.; Investigation, X.Y.; Data curation, Y.L.; Writing—original draft, L.S.; Writing—review & editing, R.P. and B.L.; Funding acquisition, B.L. All authors have read and agreed to the published version of the manuscript.

Funding

This paper is supported by the National Natural Science Foundation of China (No. 72271169).

Data Availability Statement

Data are contained within the article.

Acknowledgments

We sincerely thank all unknown reviewers for their valuable suggestions and helpful comments that have led to the present form of the original manuscript.

Conflicts of Interest

The authors declare no conflicts of interest.

References

  1. Márquez, A.C. The Maintenance Management Framework: Models and Methods for Complex Systems Maintenance; Springer Science & Business Media: Berlin/Heidelberg, Germany, 2007. [Google Scholar]
  2. Nakagawa, T. Maintenance Theory of Reliability; Springer Science & Business Media: Berlin/Heidelberg, Germany, 2006. [Google Scholar]
  3. Prajapati, A.; Bechtel, J.; Ganesan, S. Condition based maintenance: A survey. J. Qual. Maint. Eng. 2012, 18, 384–400. [Google Scholar] [CrossRef]
  4. Teixeira, H.N.; Lopes, I.; Braga, A.C. Condition-based maintenance implementation: A literature review. Procedia Manuf. 2020, 51, 228–235. [Google Scholar] [CrossRef]
  5. Yang, L.; Chen, Y.; Ma, X.; Qiu, Q.; Peng, R. A prognosis-centered intelligent maintenance optimization framework under uncertain failure threshold. IEEE Trans. Reliab. 2023, 73, 115–130. [Google Scholar] [CrossRef]
  6. Yang, A.; Qiu, Q.; Zhu, M.; Cui, L.; Chen, W.; Chen, J. Condition-based maintenance strategy for redundant systems with arbitrary structures using improved reinforcement learning. Reliab. Eng. Syst. Saf. 2022, 225, 108643. [Google Scholar] [CrossRef]
  7. Nakagawa, T. Random Maintenance Policies; Springer: London, UK, 2014. [Google Scholar]
  8. Liu, B.; Wu, J.; Xie, M. Cost analysis for multi-component system with failure interaction under renewing free-replacement warranty. Eur. J. Oper. Res. 2015, 243, 874–882. [Google Scholar] [CrossRef]
  9. Balcer, Y.; Sahin, I. Replacement costs under warranty: Cost moments and time variability. Oper. Res. 1986, 34, 554–559. [Google Scholar] [CrossRef]
  10. Blischke, W.R.; Scheuer, E.M. Applications of renewal theory in analysis of the free-replacement warranty. Nav. Res. Logist. Q. 1981, 28, 193–205. [Google Scholar] [CrossRef]
  11. Ritchken, P.H. Warranty policies for non-repairable items under risk aversion. IEEE Trans. Reliab. 1985, 34, 147–150. [Google Scholar] [CrossRef]
  12. Yun, W.Y.; Lee, Y.W.; Ferreira, L. Optimal burn-in time under cumulative free replacement warranty. Reliab. Eng. Syst. Saf. 2002, 78, 93–100. [Google Scholar] [CrossRef]
  13. Wu, S.; Clements-Croome, D. Burn-in policies for products having dormant states. Reliab. Eng. Syst. Saf. 2007, 92, 278–285. [Google Scholar] [CrossRef]
  14. Yeh, R.H.; Ho, W.T.; Tseng, S.T. Optimal production run length for products sold with warranty. Eur. J. Oper. Res. 2000, 120, 575–582. [Google Scholar] [CrossRef]
  15. Chen, C.K.; Lo, C.C.; Weng, T.C. Optimal production run length and warranty period for an imperfect production system under selling price dependent on warranty period. Eur. J. Oper. Res. 2017, 259, 401–412. [Google Scholar] [CrossRef]
  16. Chien, Y.H. A new warranty strategy: Combining a renewing free-replacement warranty with a rebate policy. Qual. Reliab. Eng. Int. 2008, 24, 807–815. [Google Scholar] [CrossRef]
  17. Blischke, W.R.; Murthy, D.N.P. Product warranty management—I: A taxonomy for warranty policies. Eur. J. Oper. Res. 1992, 62, 127–148. [Google Scholar] [CrossRef]
  18. Blischke, W.R.; Murthy, D.N.P. Product warranty management—II: An integrated framework for study. Eur. J. Oper. Res. 1992, 62, 261–281. [Google Scholar]
  19. Shafiee, M.; Chukova, S. Maintenance models in warranty: A literature review. Eur. J. Oper. Res. 2013, 229, 561–572. [Google Scholar] [CrossRef]
  20. Mukhopadhyay, K.; Liu, B.; Bedford, T.; Finkelstein, M. Remaining lifetime of degrading systems continuously monitored by degrading sensors. Reliab. Eng. Syst. Saf. 2023, 231, 109022. [Google Scholar] [CrossRef]
  21. Muhammad, I.; Xiahou, T.; Liu, Y.; Muhammad, M. A random-effect Wiener process degradation model with transmuted normal distribution and ABC-Gibbs algorithm for parameter estimation. Reliab. Eng. Syst. Saf. 2024, 250, 110289. [Google Scholar] [CrossRef]
  22. Ye, Z.S.; Xie, M. Stochastic modelling and analysis of degradation for highly reliable products. Appl. Stoch. Models Bus. Ind. 2015, 31, 16–32. [Google Scholar] [CrossRef]
  23. Qiu, Q.; Cui, L. Gamma process based optimal mission abort policy. Reliab. Eng. Syst. Saf. 2019, 190, 106496. [Google Scholar] [CrossRef]
  24. Wang, J.; Qiu, Q.; Wang, H.; Lin, C. Optimal condition-based preventive maintenance policy for balanced systems. Reliab. Eng. Syst. Saf. 2021, 211, 107606. [Google Scholar] [CrossRef]
  25. van Noortwijk, J.M.; vander Weide, J.A.; Kallen, M.J.; Pandey, M.D. Gamma processes and peaks-over-threshold distributions for time-dependent reliability. Reliab. Eng. Syst. Saf. 2007, 92, 1651–1658. [Google Scholar] [CrossRef]
  26. Yang, L.; Li, G.; Zhang, Z.; Ma, X.; Zhao, Y. Operations & maintenance optimization of wind turbines integrating wind and aging information. IEEE Trans. Sustain. Energy 2020, 12, 211–221. [Google Scholar]
  27. Yang, L.; Chen, Y.; Zhou, S.; Ma, X. RUL-centered postponed maintenance planning under random failure threshold. In Proceedings of the 2022 Global Reliability and Prognostics and Health Management (PHM-Yantai), Yantai, China, 13–16 October 2022; pp. 1–8. [Google Scholar]
  28. Qiu, Q.; Maillart, L.M.; Prokopyev, O.A.; Cui, L. Optimal condition-based mission abort decisions. IEEE Trans. Reliab. 2022, 72, 408–425. [Google Scholar] [CrossRef]
  29. Qiu, Q.; Li, R.; Zhao, X. Failure risk management: Adaptive performance control and mission abort decisions. Risk Anal. 2024, 1–20. [Google Scholar] [CrossRef]
  30. Yang, L.; Ma, Y.; Wei, F.; Qiu, Q. Optimal Condition-based Parameter Learning and Mission Abort Decisions. Nav. Res. Logist. 2024. [Google Scholar] [CrossRef]
  31. Shang, L.; Si, S.; Sun, S.; Jin, T. Optimal warranty design and post-warranty maintenance for products subject to stochastic degradation. IISE Trans. 2018, 50, 913–927. [Google Scholar] [CrossRef]
  32. Zhang, N.; Fouladirad, M.; Barros, A. Evaluation of the warranty cost of a product with type III stochastic dependence between components. Appl. Math. Model. 2018, 59, 39–53. [Google Scholar] [CrossRef]
  33. Liang, X.; Cui, L.; Wang, R. Non-renewable warranty cost analysis for dependent series configuration with distinct warranty periods. Reliab. Eng. Syst. Saf. 2024, 246, 110074. [Google Scholar] [CrossRef]
  34. Zheng, R.; Fang, H.; Hu, C. Joint optimization of inspection and condition-based maintenance for a deteriorating product under extended warranty. Reliab. Eng. Syst. Saf. 2024, 245, 110043. [Google Scholar] [CrossRef]
  35. Shang, L.; Qiu, Q.; Wu, C.; Du, Y. Random replacement policies to sustain the post-warranty reliability. J. Qual. Maint. Eng. 2023, 29, 481–508. [Google Scholar] [CrossRef]
  36. Shang, L.; Liu, B.; Qiu, Q.; Yang, L.; Du, Y. Designing warranty and maintenance policies for products subject to random working cycles. Reliab. Eng. Syst. Saf. 2023, 234, 109–187. [Google Scholar] [CrossRef]
  37. Shang, L.; Liu, B.; Qiu, Q.; Yang, L. Three-dimensional warranty and post-warranty maintenance of products with monitored mission cycles. Reliab. Eng. Syst. Saf. 2023, 239, 109–506. [Google Scholar] [CrossRef]
  38. Shang, L.; Chen, J.; Liu, B.; Lin, C.; Yang, L. Modeling Renewable Warranties and Post-Warranty Replacements for Self-Announcing Failure Products Subject to Mission Cycles. Symmetry 2024, 16, 603. [Google Scholar] [CrossRef]
  39. Shang, L.; Liu, B.; Yang, L.; Gao, K. Customizing Random Replacement Model and Flexible Warranty Model from the Perspective of Screening Reliability. Axioms 2023, 12, 358. [Google Scholar] [CrossRef]
  40. Sahin, I.; Polatoglu, H. Maintenance strategies following the expiration of warranty. IEEE Trans. Reliab. 1996, 45, 220–228. [Google Scholar] [CrossRef]
  41. Jung, K.M.; Han, S.S.; Park, D.H. Optimization of cost and downtime for replacement model following the expiration of warranty. Reliab. Eng. Syst. Saf. 2008, 93, 995–1003. [Google Scholar] [CrossRef]
  42. Shang, L.; Si, S.; Cai, Z. Optimal maintenance–replacement policy of products with competing failures after expiry of the warranty. Comput. Ind. Eng. 2016, 98, 68–77. [Google Scholar] [CrossRef]
  43. Jung, K.M.; Park, M.; Park, D.H. Optimal maintenance strategy for non-renewing replacement–repair warranty. Appl. Stoch. Models Bus. Ind. 2012, 28, 607–614. [Google Scholar] [CrossRef]
  44. Liu, P.; Wang, G. Generalized non-renewing replacement warranty policy and an age-based post-warranty maintenance strategy. Eur. J. Oper. Res. 2023, 311, 567–580. [Google Scholar] [CrossRef]
  45. Qiao, P.; Luo, M.; Ma, Y.; Jabbar, A. Optimal warranty option and post-warranty maintenance strategy under a warranty menu: From a consumer perspective. Int. J. Prod. Res. 2024, 62, 1586–1608. [Google Scholar] [CrossRef]
  46. Shang, L.; Liu, B.; Cai, Z.; Wu, C. Random maintenance policies for sustaining the reliability of the product through 2D-warranty. Appl. Math. Model. 2022, 111, 363–383. [Google Scholar] [CrossRef]
  47. Qiu, Q.; Cui, L.; Gao, H. Availability and maintenance modelling for systems subject to multiple failure modes. Comput. Ind. Eng. 2017, 108, 192–198. [Google Scholar] [CrossRef]
  48. Qiu, Q.; Cui, L.; Shen, J.; Yang, L. Optimal maintenance policy considering maintenance errors for systems operating under performance-based contracts. Comput. Ind. Eng. 2017, 112, 147–155. [Google Scholar] [CrossRef]
  49. Qiu, Q.; Cui, L.; Shen, J. Availability and maintenance modeling for systems subject to dependent hard and soft failures. Appl. Stoch. Models Bus. Ind. 2018, 34, 513–527. [Google Scholar] [CrossRef]
  50. Qiu, Q.; Cui, L.; Kong, D. Availability and maintenance modeling for a two-component system with dependent failures over a finite time horizon. Proc. Inst. Mech. Eng. Part O J. Risk Reliab. 2018, 233, 200–210. [Google Scholar] [CrossRef]
  51. Qiu, Q.; Cui, L. Availability analysis for general repairable systems with repair time threshold. Commun. Stat.-Theory Methods 2019, 48, 628–647. [Google Scholar] [CrossRef]
  52. Qiu, Q.; Cui, L.; Shen, J. Availability analysis and maintenance modelling for inspected Markov systems with down time threshold. Qual. Technol. Quant. Manag. 2019, 16, 478–495. [Google Scholar] [CrossRef]
  53. Qiu, Q.; Cui, L.; Kong, D. Availability analysis and optimal inspection policy for systems with neglected down time. Commun. Stat.-Theory Methods 2019, 48, 2787–2809. [Google Scholar] [CrossRef]
  54. Qiu, Q.; Cui, L. Availability analysis for periodically inspected systems subject to multiple failure modes. Int. J. Syst. Sci.-Oper. Logist. 2019, 6, 258–271. [Google Scholar] [CrossRef]
  55. Qiu, Q.; Cui, L. Optimal mission abort policy for systems subject to random shocks based on virtual age process. Reliab. Eng. Syst. Saf. 2019, 189, 11–20. [Google Scholar] [CrossRef]
  56. Qiu, Q.; Liu, B.; Lin, C.; Wang, J. Availability analysis and maintenance optimization for multiple failure mode systems considering imperfect repair. Proc. Inst. Mech. Eng. Part O J. Risk Reliab. 2021, 235, 982–997. [Google Scholar] [CrossRef]
  57. Qiu, Q.; Kou, M.; Chen, K.; Deng, Q.; Kang, F.; Lin, C. Optimal stopping problems for mission oriented systems considering time redundancy. Reliab. Eng. Syst. Saf. 2020, 205, 107226. [Google Scholar] [CrossRef]
  58. Barlow, R.E.; Proschan, F. Mathematical Theory of Reliability; John Wiley & Sons: Hoboken, NJ, USA, 1965. [Google Scholar]
  59. Peng, R.; He, X.; Zhong, C.; Kou, G.; Xiao, H. Preventive maintenance for heterogeneous parallel systems with two failure modes. Reliab. Eng. Syst. Saf. 2022, 220, 108310. [Google Scholar] [CrossRef]
  60. Peng, R.; Liu, B.; Zhai, Q.; Wang, W. Optimal maintenance strategy for systems with two failure modes. Reliab. Eng. Syst. Saf. 2019, 188, 624–632. [Google Scholar] [CrossRef]
Figure 1. The PM plan analysis in the RCPMW-RTT.
Mathematics 12 02845 g001
Figure 2. The impact of the mission number  N  in the PMI on the PM plan.
Mathematics 12 02845 g002
Figure 3. The performance comparison between RCPMW-RTT, RCRW-RTT and RCPMW.
Mathematics 12 02845 g003
Figure 4. The impact of  c R  and  ς  on the optimal DRRBR.
Mathematics 12 02845 g004
Figure 5. The impact of  c R  and  ς  on the optimal DRRFR.
Mathematics 12 02845 g005
Table 1. The impact of  n and  N  on the optimal DRRBR.
N n = 23 n = 26 n = 29
K * C R a ( K * ) K * C R a ( K * ) K * C R a ( K * )
3152.4527142.3283132.2245
4122.5732112.4128112.2848
5102.715492.513072.3980
Table 2. The impact of  δ and  τ  on the optimal DRRBR.
τ δ = 0.5 δ = 0.7 δ = 0.9
K * C R a ( K * ) K * C R a ( K * ) K * C R a ( K * )
0.5132.3996132.5055122.6086
0.7132.4051132.5126122.6175
0.9132.4106132.5197122.6264
Table 3. The impact of  n and  N  on the optimal DRRFR.
N n = 23 n = 29 n = 37
K * C R b ( K * ) K * C R b ( K * ) K * C R b ( K * )
321.974521.804721.7490
421.957421.796921.7007
511.928111.758611.6549
Table 4. The impact of  δ and  τ  on the optimal DRRFR.
τ δ = 0.3 δ = 0.5 δ = 0.8
K * C R b ( K * ) K * C R b ( K * ) K * C R b ( K * )
0.331.732131.825421.9565
0.531.740331.837421.9745
0.731.749531.850721.9945
Disclaimer/Publisher’s Note: The statements, opinions and data contained in all publications are solely those of the individual author(s) and contributor(s) and not of MDPI and/or the editor(s). MDPI and/or the editor(s) disclaim responsibility for any injury to people or property resulting from any ideas, methods, instructions or products referred to in the content.

