1. Introduction
Systemic Lupus Erythematosus (SLE) represents an enigmatic autoimmune condition with a poorly understood cause [
1]. The disease is characterized by a loss of immunological self-tolerance and dysfunctional immune reactions, which are driven by intricate interactions between genetic predispositions and environmental triggers. This culminates in the generation of harmful autoantibodies, the accumulation of immune complexes, and the ensuing inflammatory responses, ultimately causing damage across multiple organ systems. These features constitute the core pathogenesis of SLE. Given the disease’s erratic and frequently irreversible clinical trajectory, as well as its potential for considerable morbidity and mortality, timely and accurate diagnosis is essential.
Nevertheless, diagnosing SLE can be particularly challenging, due to its varied and often elusive clinical symptoms, especially during the initial stages of the condition [
2,
3]. Furthermore, no single test is sufficient for a definitive diagnosis of SLE. Various classification guidelines have been developed over the years, including the 1997 criteria by the American College of Rheumatology (ACR) [
4], the 2012 criteria by the Systemic Lupus International Collaborating Clinics (SLICC) [
5], and the 2019 criteria co-authored by the European League Against Rheumatism (EULAR) and ACR [
6]. Each of these sets of criteria relies on a combination of clinical observations and laboratory tests. For instance, to meet the specifications of the 2012 SLICC and 2019 EULAR/ACR criteria, specific immunological tests like autoantibodies and complement assays are indispensable. Although these criteria were not initially designed for diagnosing individual SLE cases, they serve the vital purpose of facilitating more uniform patient selection in epidemiological research [
7].
The ANA test detects a broad spectrum of autoantibodies directed against various intracellular antigens, most notably within the cell nucleus. This test is extensively used for the diagnosis of multiple autoimmune disorders, such as SLE, Sjögren’s Syndrome, Systemic Sclerosis, and Autoimmune Hepatitis. Remarkably, ANA is positive in over 95% of SLE patients, establishing it as the foremost screening tool for this condition. However, the test suffers from low specificity, often yielding positive results in patients afflicted with conditions unrelated to autoimmune diseases, including malignancies and infectious diseases. Additionally, up to 30% of ostensibly healthy individuals—particularly among the elderly—can exhibit false-positive ANA results [
8]. In alignment with this, the 2013 ‘Choosing Wisely’ campaign by the American College of Rheumatology recommended against ANA and its sub-serologies testing in patients presenting with non-specific symptoms, such as fatigue or myalgia, unless there is clinical suspicion of an ANA-positive autoimmune disease [
9]. Nevertheless, clinical practice often witnesses the imprudent use of ANA tests, leading to avoidable healthcare expenditure and the associated socioeconomic impacts [
10,
11].
The SLE diagnosis includes a variety of manifestations of clinical symptoms and laboratory tests. While clinical guidelines provide a structured approach to diagnosing SLE, machine learning (ML) enhances this process by offering improved accuracy, early detection, personalized treatment, and the ability to handle and learn from vast amounts of data. These advantages make ML an invaluable tool in the diagnosis and management of SLE, complementing traditional methods and helping to address some of the challenges associated with this complex autoimmune disease. Recently, Martorell-Marugán et al. conducted a systematic review of 10 studies on machine learning algorithms for diagnosing SLE [
12]. Among these, Murray et al. applied logistic regression to large, registered datasets, to classify patients into categories of “definite SLE”, “probable SLE”, “possible SLE”, and “not SLE” [
13].
Our study aims to develop the initial phase of a Clinical Decision Support System (CDSS) for SLE diagnosis by leveraging key diagnostic features and applying powerful machine learning algorithms to improve decision-making. Furthermore, we employed the Observational Medical Outcomes Partnership Common Data Model (OMOP-CDM) as the standardized database for data analysis. Recognized globally, the OMOP-CDM framework aids in the transformation of heterogeneous healthcare data from the real world into a standardized schema [
14]. Research utilizing the OMOP-CDM promotes collaboration among researchers across different institutions, while ensuring consistency in clinical terminology and database architecture. We believe that this preliminary study has the potential to lead to the development of a CDSS that can seamlessly integrate data from multiple healthcare institutions, leveraging real-world clinical data to enhance diagnostic accuracy. Additionally, it has the potential to assist clinicians in making more efficient SLE diagnostic decisions, thereby saving time and reducing costs in clinical practice.
2. Materials and Methods
2.1. Study Population
In this multi-center, observational study, we examined a cohort of 25,290 patients who underwent their first ANA test during hospital visits between March 2011 and December 2020 at Pusan National University Hospital (PNUH, 179 Gudeok-ro, Seo-gu, Busan, 49241, South Korea) and Pusan National University Yangsan Hospital (PNUYH, 20 Geumo-ro, Yangsan-si, Gyeongsangnam-do, 50612, South Korea) and had not been previously diagnosed with SLE. The data for this study were directly extracted from the OMOP-CDM, which was derived from Electronic Health Records (EHR) at these tertiary referral centers in Southern Korea.
In a recent development, PNUH transitioned the real-world data (RWD) for patients—including EHR—to the OMOP-CDM. For this study, retrospective patient data were extracted from specific OMOP-CDM tables: “Person” for demographic information, “Measurement” for laboratory results, and “Condition” for diseases diagnosed during hospital visits, all of which were mapped to their respective local EHR codes and terminologies. To maintain data privacy, identifying details like social security numbers and hospital visit IDs were replaced with randomized identifiers during the conversion to the OMOP-CDM standard database, followed by a thorough validation process.
The study was conducted in accordance with the Declaration of Helsinki, reported according to the Strengthening the Reporting of Observational Studies in Epidemiology statement, and approved by the Institutional Review Boards PNUH and PNUYH, which waived the consent for this study (IRB No. H-1909-020-083 for PNUH, 2019/09/23) and 05-2022-092 for PNUYH, 2022/04/14). Patient consent was waived, due to the data for this study being de-identified and based on longitudinal observational health data.
2.2. Study Designs and Data Analysis
For this study, we designated the index date as the day on which each patient received their inaugural ANA test, following the start of their hospital visit. Demographic data such as age and gender were captured at the time of this first ANA test. Additionally, initial laboratory test outcomes—including various ANA sub-serologies and inflammatory markers—were collected within a one-week window around the index date. For the ANA test, serum levels were quantified using indirect immunofluorescence in HEp-2 cells, and we classified ANA titers into predefined categories, considering titers ≥1:80 as positive. Sub-serologies were determined through enzyme-linked immunosorbent assays. A level of IgG anti-dsDNA antibody ≥40 IU/mL was considered positive, based on the lab reference ranges at PNUH and PNUYH.
In addition to its role in diagnosing SLE, ANA testing is also crucial for identifying a range of other autoimmune diseases, such as autoimmune hepatitis, idiopathic inflammatory myopathies, juvenile rheumatoid arthritis, and Sjögren’s syndrome. Therefore, these conditions were considered in our analysis. Relevant data on SLE and other autoimmune diseases were extracted from the “Condition” table in the OMOP-CDM database, which is mapped to ICD-10 and SNOMED-CT codes. Diagnosing SLE and assessing inflammation involves a combination of blood tests such as C-Reactive Protein (CRP) and complete blood count (CBC), including WBC, neutrophils, lymphocytes, and platelets. Especially, as neutrophils and platelets are critical for evaluating the degree of inflammation, Neutrophil-to-Lymphocyte Ratio (NLR), and Platelet-to-Lymphocyte Ratio (PLR) were also evaluated as inflammation markers.
The Observational Medical Outcomes Partnership (OMOP) CDM is a medical data standard adopted by the Observational Health Data Sciences and Informatics consortium to systematically analyze data not only in South Korea but also in North America, Europe, and Asia [
14]. The CDM standardizes diverse hospital data into a unified database format, enabling collaborative research across various medical institutions, globally. We gathered structured data from the OMOP CDM in conjunction with unstructured data, such as demographic information and SLE-related laboratory results.
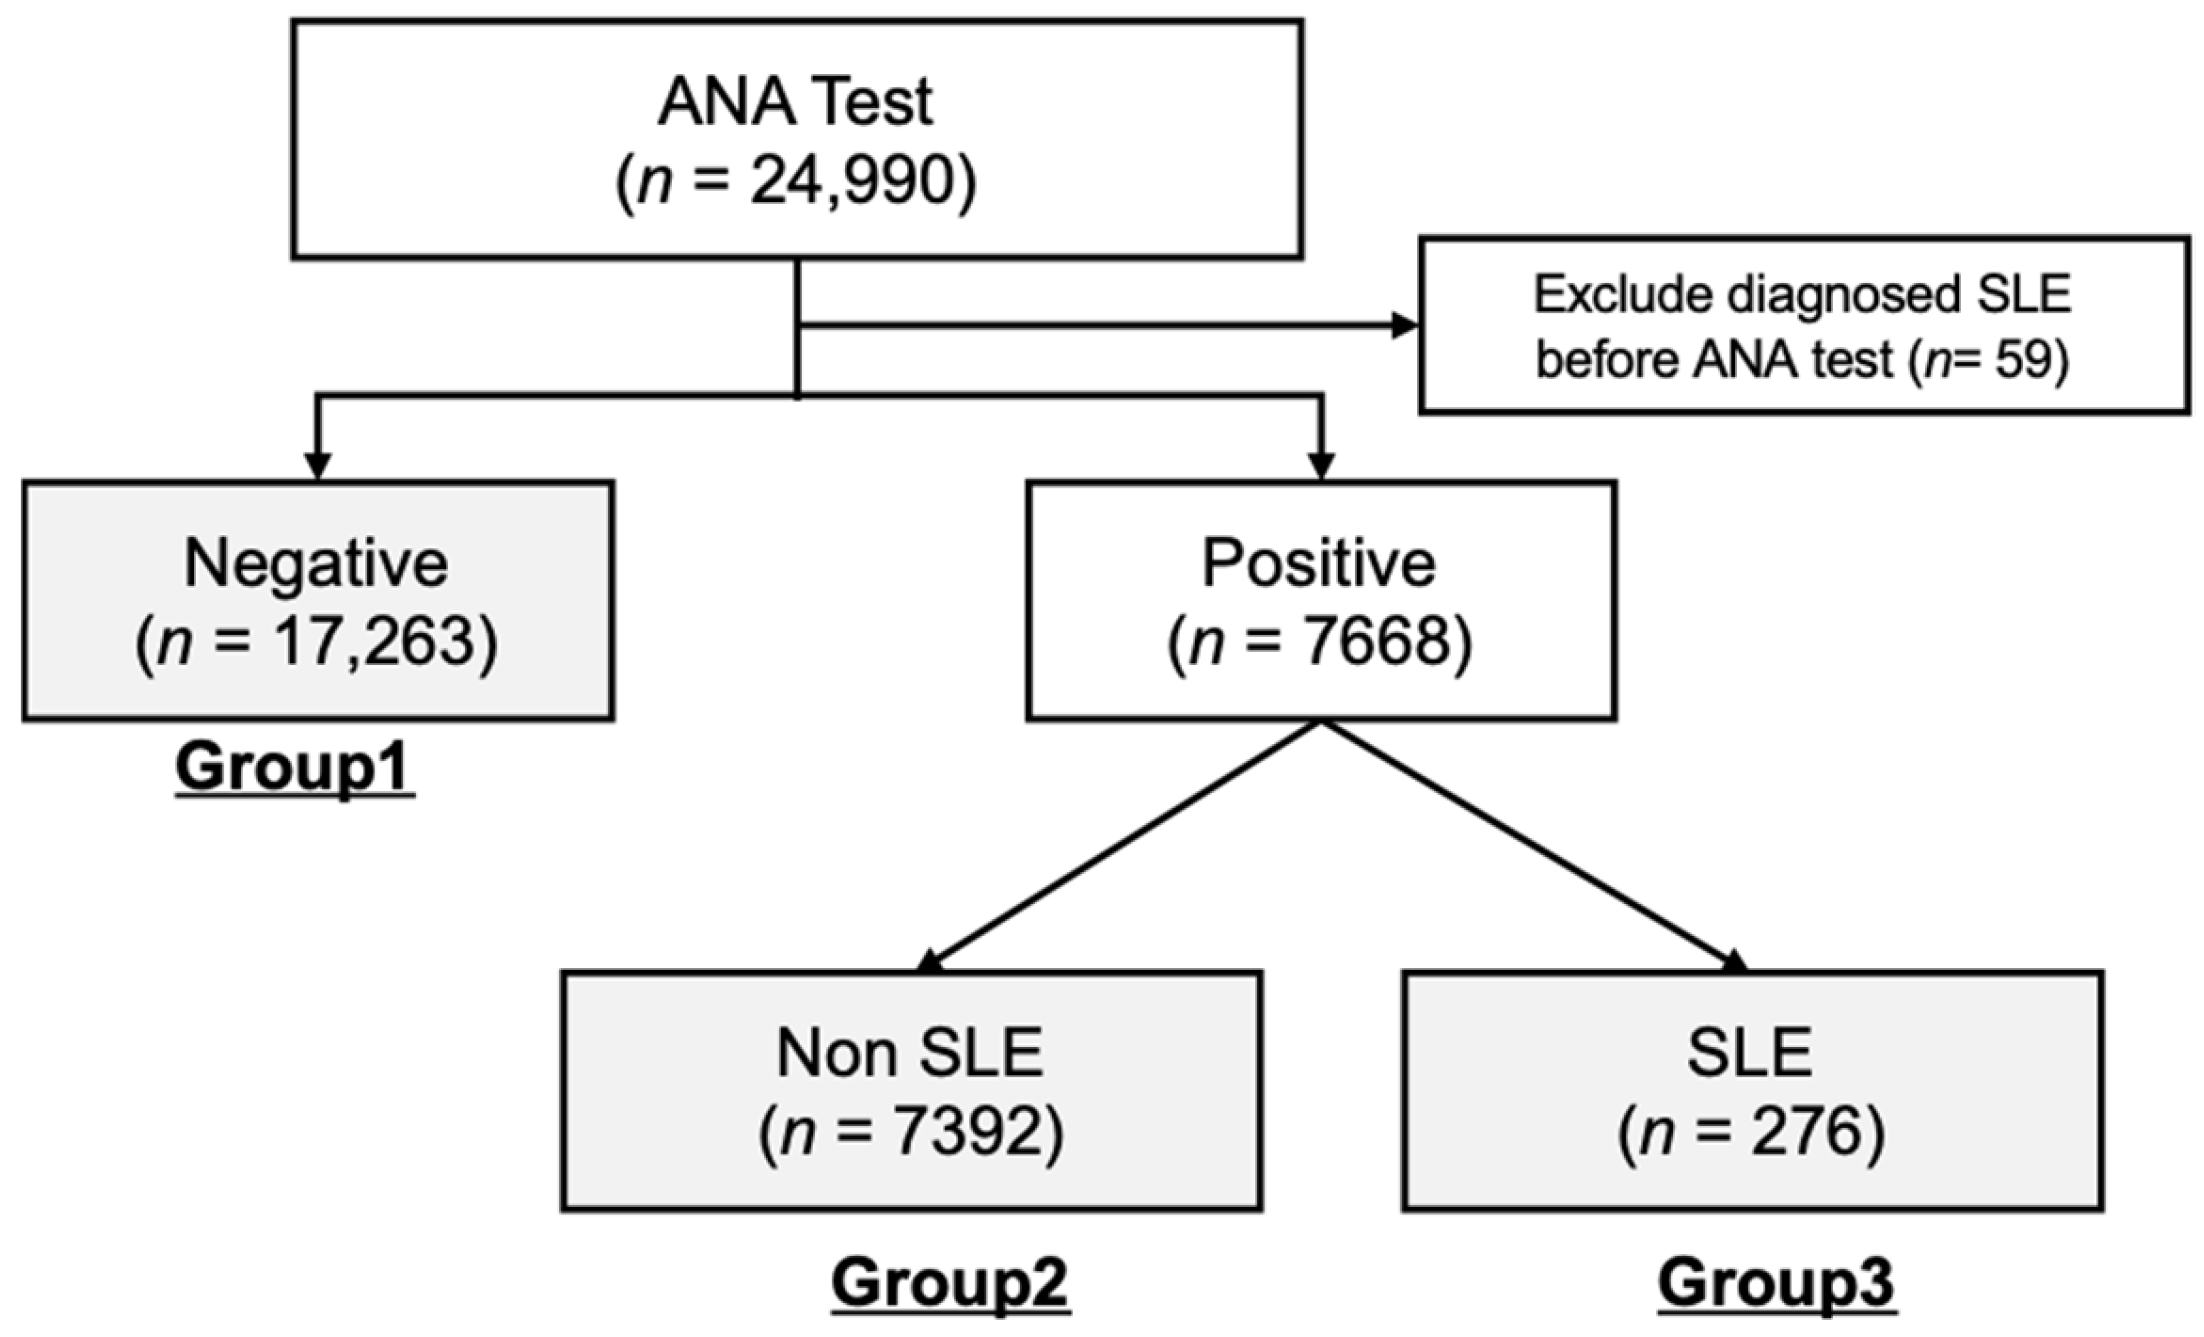
For subsequent data analyses, cohorts from both healthcare centers were combined and divided into three separate groups according to their ANA test results and SLE diagnosis status. As illustrated in
Figure 1, the total number of cohort groups is 24,931, and these groups included Group 1 (ANA-negative, n = 17,623), Group 2 (ANA-positive, n = 7391), and Group 3 (ANA-positive and diagnosed with SLE, n = 276).
2.3. Statistical Analysis
The baseline characteristics, including demographic information, ANA titers, ANA serological tests, and inflammatory markers, were characterized in the cross-sectional analysis. Categorical variables were converted into nominal values, while continuous variables were maintained, excluding any erroneous data points. Missing data were handled using the Fully Conditional Specification (FCS) method, facilitated by the MICE package in R, following the guidelines of Van Buuren and Groothuis-Oudshoorn [
15,
16]. Chi-square tests were used to compare categorical variables. However, given the significant size disparity between Group 3 and the other groups (Group 1: 17,623; Group 2: 7391; Group 3: 276), the Kruskal–Wallis test was chosen as the best method for comparing continuous data across these groups. The Kruskal–Wallis test does not assume a normal distribution of the data, and is less affected by unequal sample sizes. Statistical significance was set at a
p-value of less than 0.05. All statistical procedures were conducted using R (version 4.0.5) and RStudio (version 1.4.1).
2.4. Machine Learning Analysis
To develop our diagnostic decision support system, three algorithms—Decision Tree (DT), Random Forest (RF), and Gradient Boosting Machine (GBM)—were chosen for their complementary strengths in building a robust system. The Decision Tree algorithm generates interpretable classification rules by automatically learning from data, identifying specific conditions, and constructing a binary tree for prediction [
17]. It was selected for its ability to produce clear, interpretable classification rules, making it accessible to medical professionals and patients who may not be familiar with complex machine learning models. Random Forest was included for its ensemble approach, which enhances predictive accuracy by aggregating multiple decision trees generated through bagging [
18]. Finally, GBM was chosen for its effectiveness in handling imbalanced data by gradually improving predictions through a boosting technique, making it well-suited for medical datasets [
19,
20,
21]. To validate the stability of machine learning models, nested cross-validation with stratified N-fold cross-validation techniques were used. Nested cross-validation is an approach to overcome the overfitting problem and to reduce the bias in performance evaluation [
22]. Hyperparameters were optimized using the GridSearchCV() function in Python [
23]. Finally, to measure the performance of the ML algorithms for each feature set, four evaluation indicators—precision, recall, F1-score, and accuracy—were used.
3. Results
3.1. Analysis Results of Baseline Characteristics
The baseline demographic, clinical, and serological characteristics of the study participants are listed in
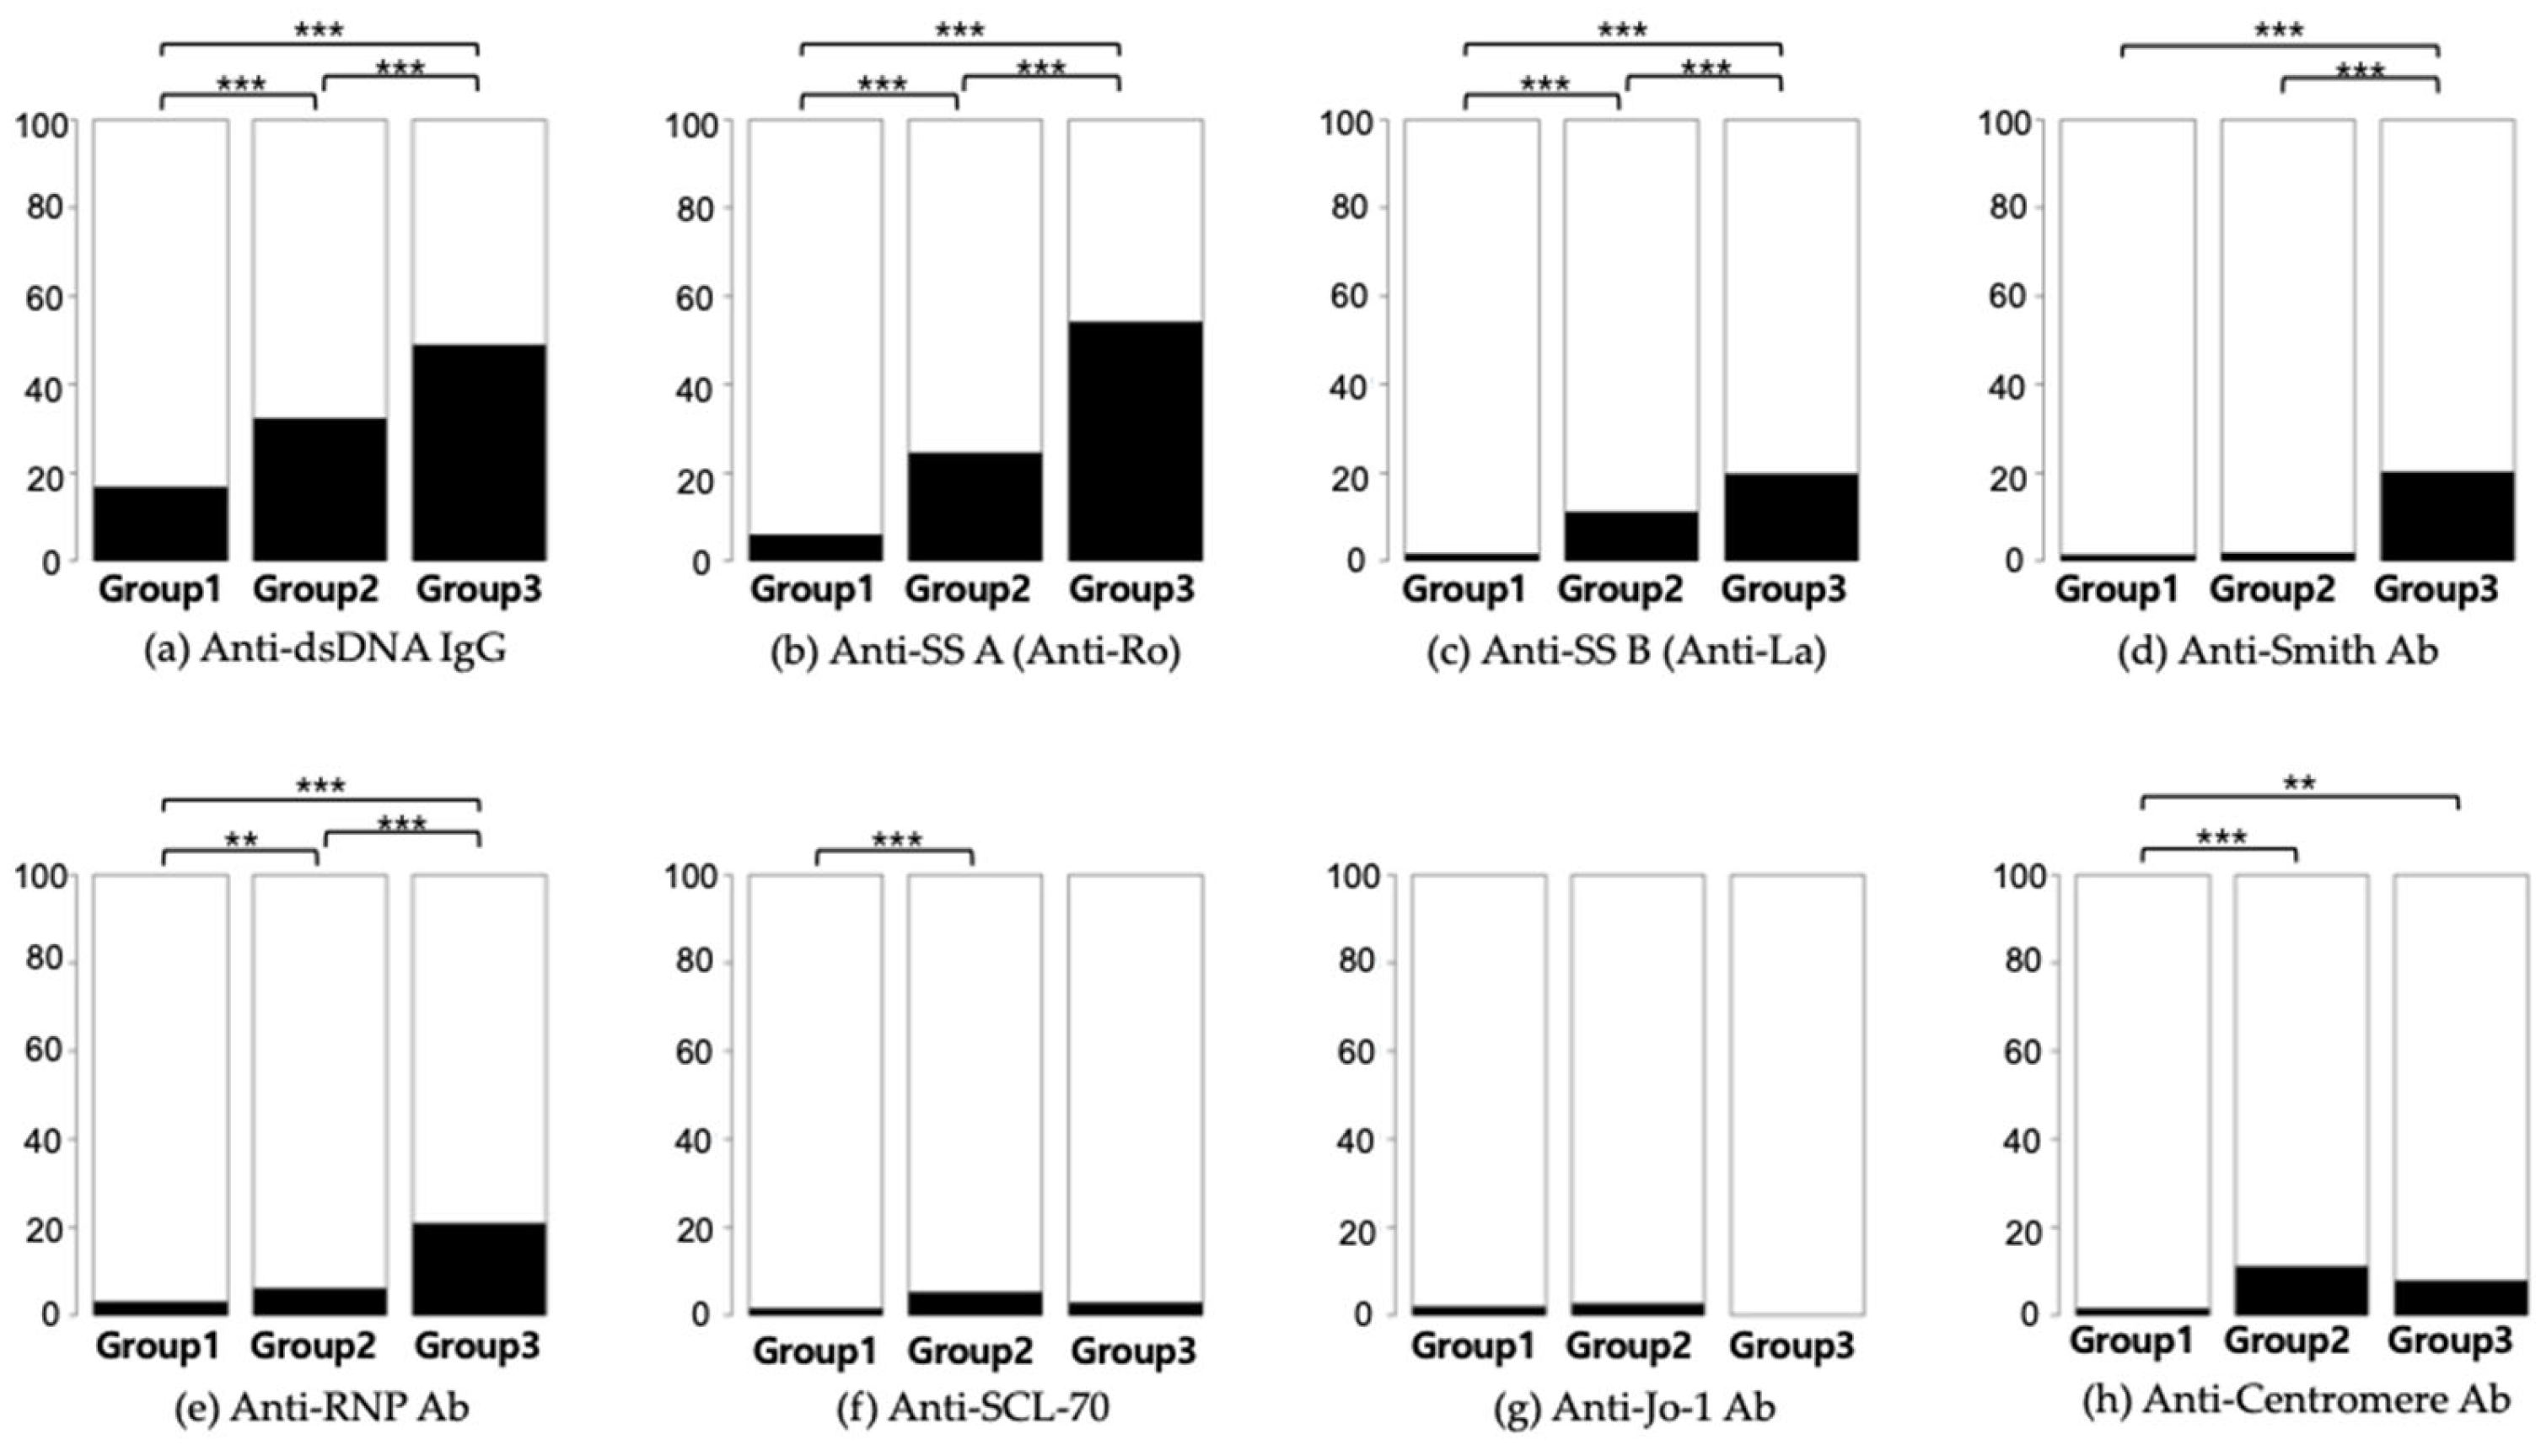
Table 1. Out of the 24,931 subjects who underwent ANA testing, 7668 (equivalent to 30.8% and encompassing Groups 2 and 3) returned positive results. Only 276 participants, representing 1.1% of those tested and categorized within Group 3, received a diagnosis of SLE. Additionally, 1008 (4%) participants had at least one autoimmune disease, including SLE (n = 276), autoimmune hepatitis (n = 459), idiopathic inflammatory myopathies (n = 65), juvenile rheumatoid arthritis (n = 45), overlap syndrome (n = 41), Raynaud’s disease (n = 244), Sjögren’s syndrome (n = 295), and systemic sclerosis (n = 167). A statistical comparison of the frequency of autoantibodies is depicted in
Figure 2.
Significant variations were observed across Groups 1–3 in terms of age distribution and gender ratios. Participants within Group 3, those diagnosed with SLE, were predominantly younger and more often female, compared to the other groups. Furthermore, a statistically significant disparity was noted in the occurrence rates of various autoimmune conditions among the groups, as detailed in
Table 1. Autoimmune hepatitis was most prevalent in Group 2, while Group 3 exhibited the highest incidence rates for idiopathic inflammatory myopathies, overlap syndrome, Sjögren’s syndrome, and systemic sclerosis.
3.2. Analysis Results of Lab Tests and SLE
Next, we analyzed the correlation of the ANA test and SLE and other autoimmune diseases. Hence, ANA-positive patients (Group 2 and 3) were chosen for further analysis. As demonstrated in
Table 2, the prevalence of autoimmune diseases and SLE among the 7668 ANA-positive patients was classified as Group 2 and 3. In these patient populations, autoimmune diseases were present in 1008 (13.2%) among 7668 individuals, and SLE was diagnosed in 276 (3.6%). A significant increase in the occurrence of both SLE and autoimmune diseases was noted as ANA titers increased. To identify and understand changes in data over ANA titer, trend analysis was performed. A
p-value revealed statistically significant variations in ANA titers across the different titer groups.
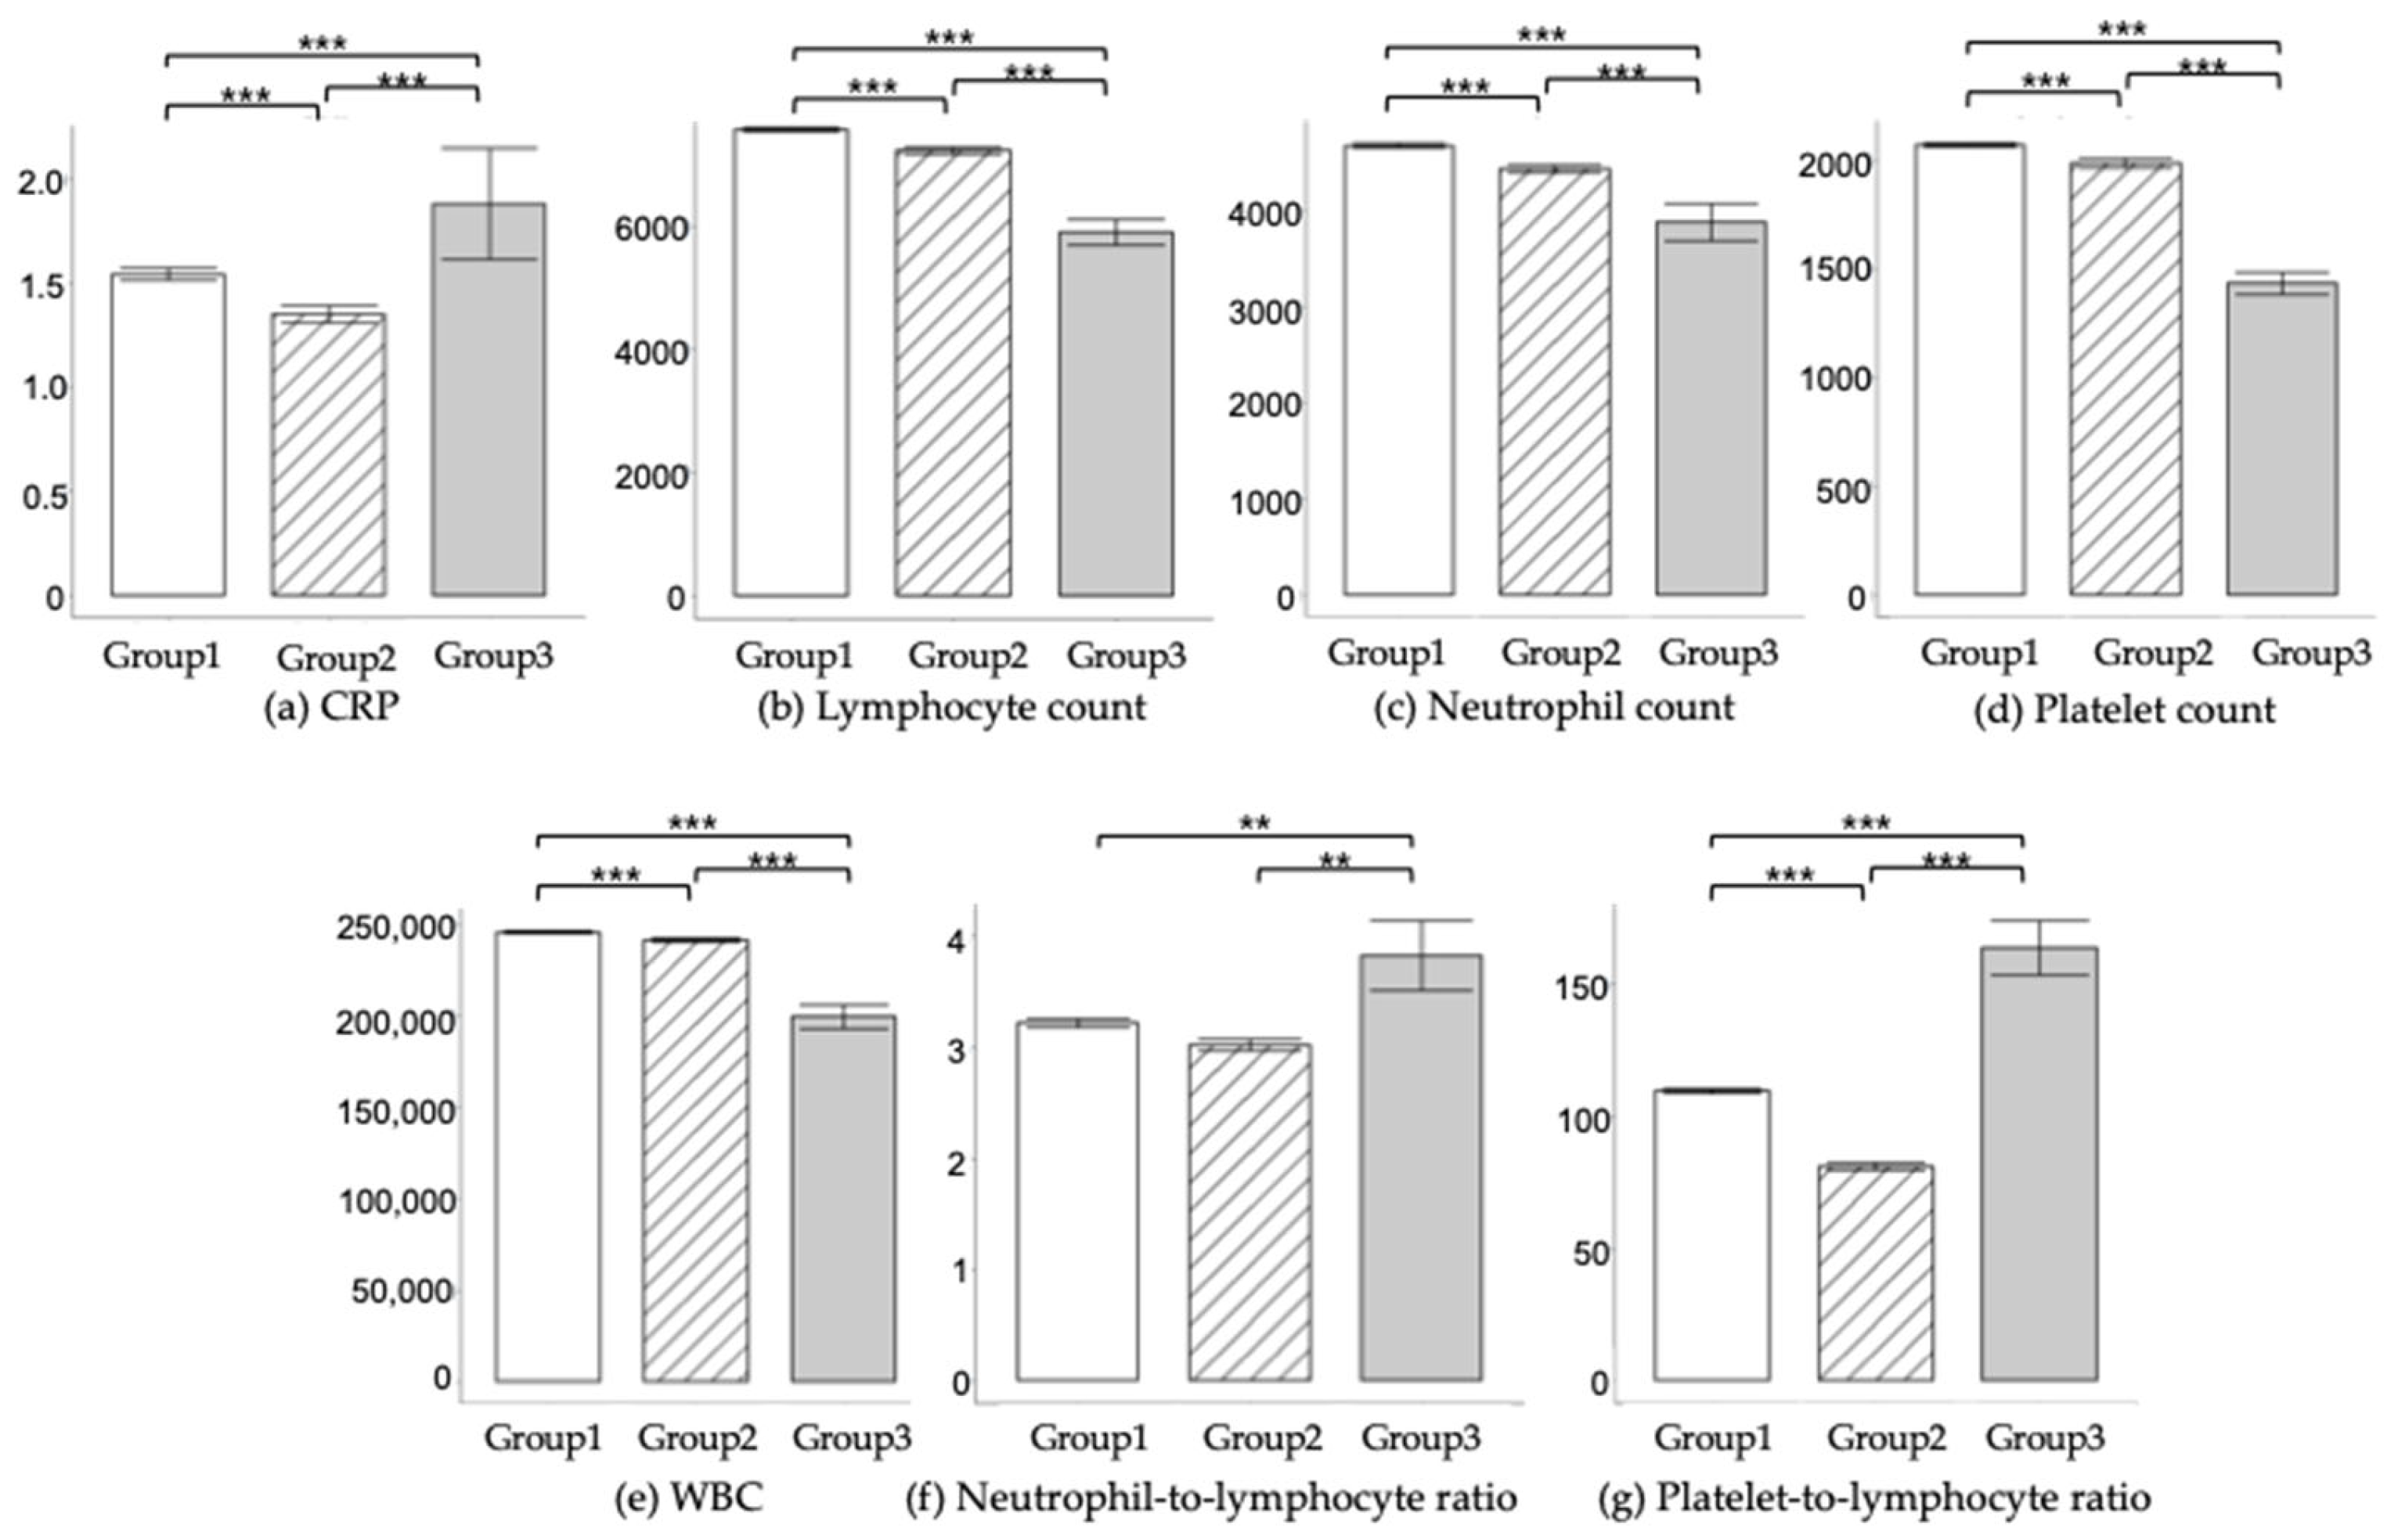
Inflammation is a significant component in the assessment and management of SLE. Diagnosing SLE and assessing inflammation involves a combination of blood tests such as C-Reactive Protein (CRP) and complete blood count (CBC) including WBC, neutrophils, lymphocytes, and platelets. Especially, as neutrophils and platelets are critical for evaluating the degree of inflammation, Neutrophil-to-Lymphocyte Ratio (NLR), and Platelet-to-Lymphocyte Ratio (PLR) were also evaluated as inflammation markers.
Table 3 and
Figure 3 show the comparative analysis of laboratory findings across Groups 1–3. Significant differences were observed in variables such as CRP levels, WBC counts, neutrophil counts, lymphocyte counts, platelet counts, NLR, and PLR, among the different groups. Notably, individuals in Group 3 exhibited elevated levels of CRP, NLR, and PLR, while showing reduced counts of WBC, neutrophils, lymphocytes, and platelets, compared to their counterparts in Groups 1 and 2.
3.3. Feature Selection
Machine learning is important for the diagnosis of SLE, even though clinical guidelines exist, because it may improve diagnostic accuracy with early and timely diagnosis. However, due to the incomplete characteristics of the real-world data (RWD), we preprocessed the dataset without loss of any clinical information. The dataset dimension and the features of the dataset are 24,931 samples(rows) × 27 features(columns). To analyze the data without loss of information, data imputation was applied. If the features had missing values, predictive mean matching techniques in the multivariate imputations by the chained equations (MICE) package provided in the R software were used. Then, we applied the standard scaling method to improve the performance of the ML algorithms. Feature selection was executed based on feature importance metrics from each ML model, to identify key factors for SLE diagnosis. This also accounts for the fact that clinicians generally check fewer than 50 factors when making clinical decisions.
Therefore, we identified the most effective number of features by testing the algorithms using 10 and 20 of all the features. Among them, the common top ten features are shown in
Table 4.
Among the selected features, the top feature is the ANA test, which represents the most important clinical diagnosis factor for SLE diagnosis. Moreover, the second and third factors were PLR and Anti-dsDNA IgG, which represent the inflammation indicator and important clinical factor, respectively, in the clinical field.
Figure 4 compares the importance of these features across the different algorithms.
3.4. Hyperparameter Tuning
To validate the stability of our machine learning models, we applied nested cross-validation (10 outer iteration and 3 inner iteration) with stratified 10-fold cross-validation techniques. Therefore, a total number of 300 times of the training process for each model were performed. The optimal hyperparameters for the models were determined using the GridSearchCV function from the Scikit-Learn module in Python. As illustrated in
Table 5, adjustments were made to the tree depth (max_depth) and the minimum number of samples required to split a node (min_samples_split) for both the Decision Tree and Random Forest algorithms, to reduce the risk of overfitting. For the Random Forest method, the number of trees (n_estimators) was also fine-tuned. In the case of the Gradient Boosting Machine (GBM), we optimized the tree depth (max_depth), the number of estimators (n_estimators), and the learning rate applied during training.
3.5. Machine Learning Performance
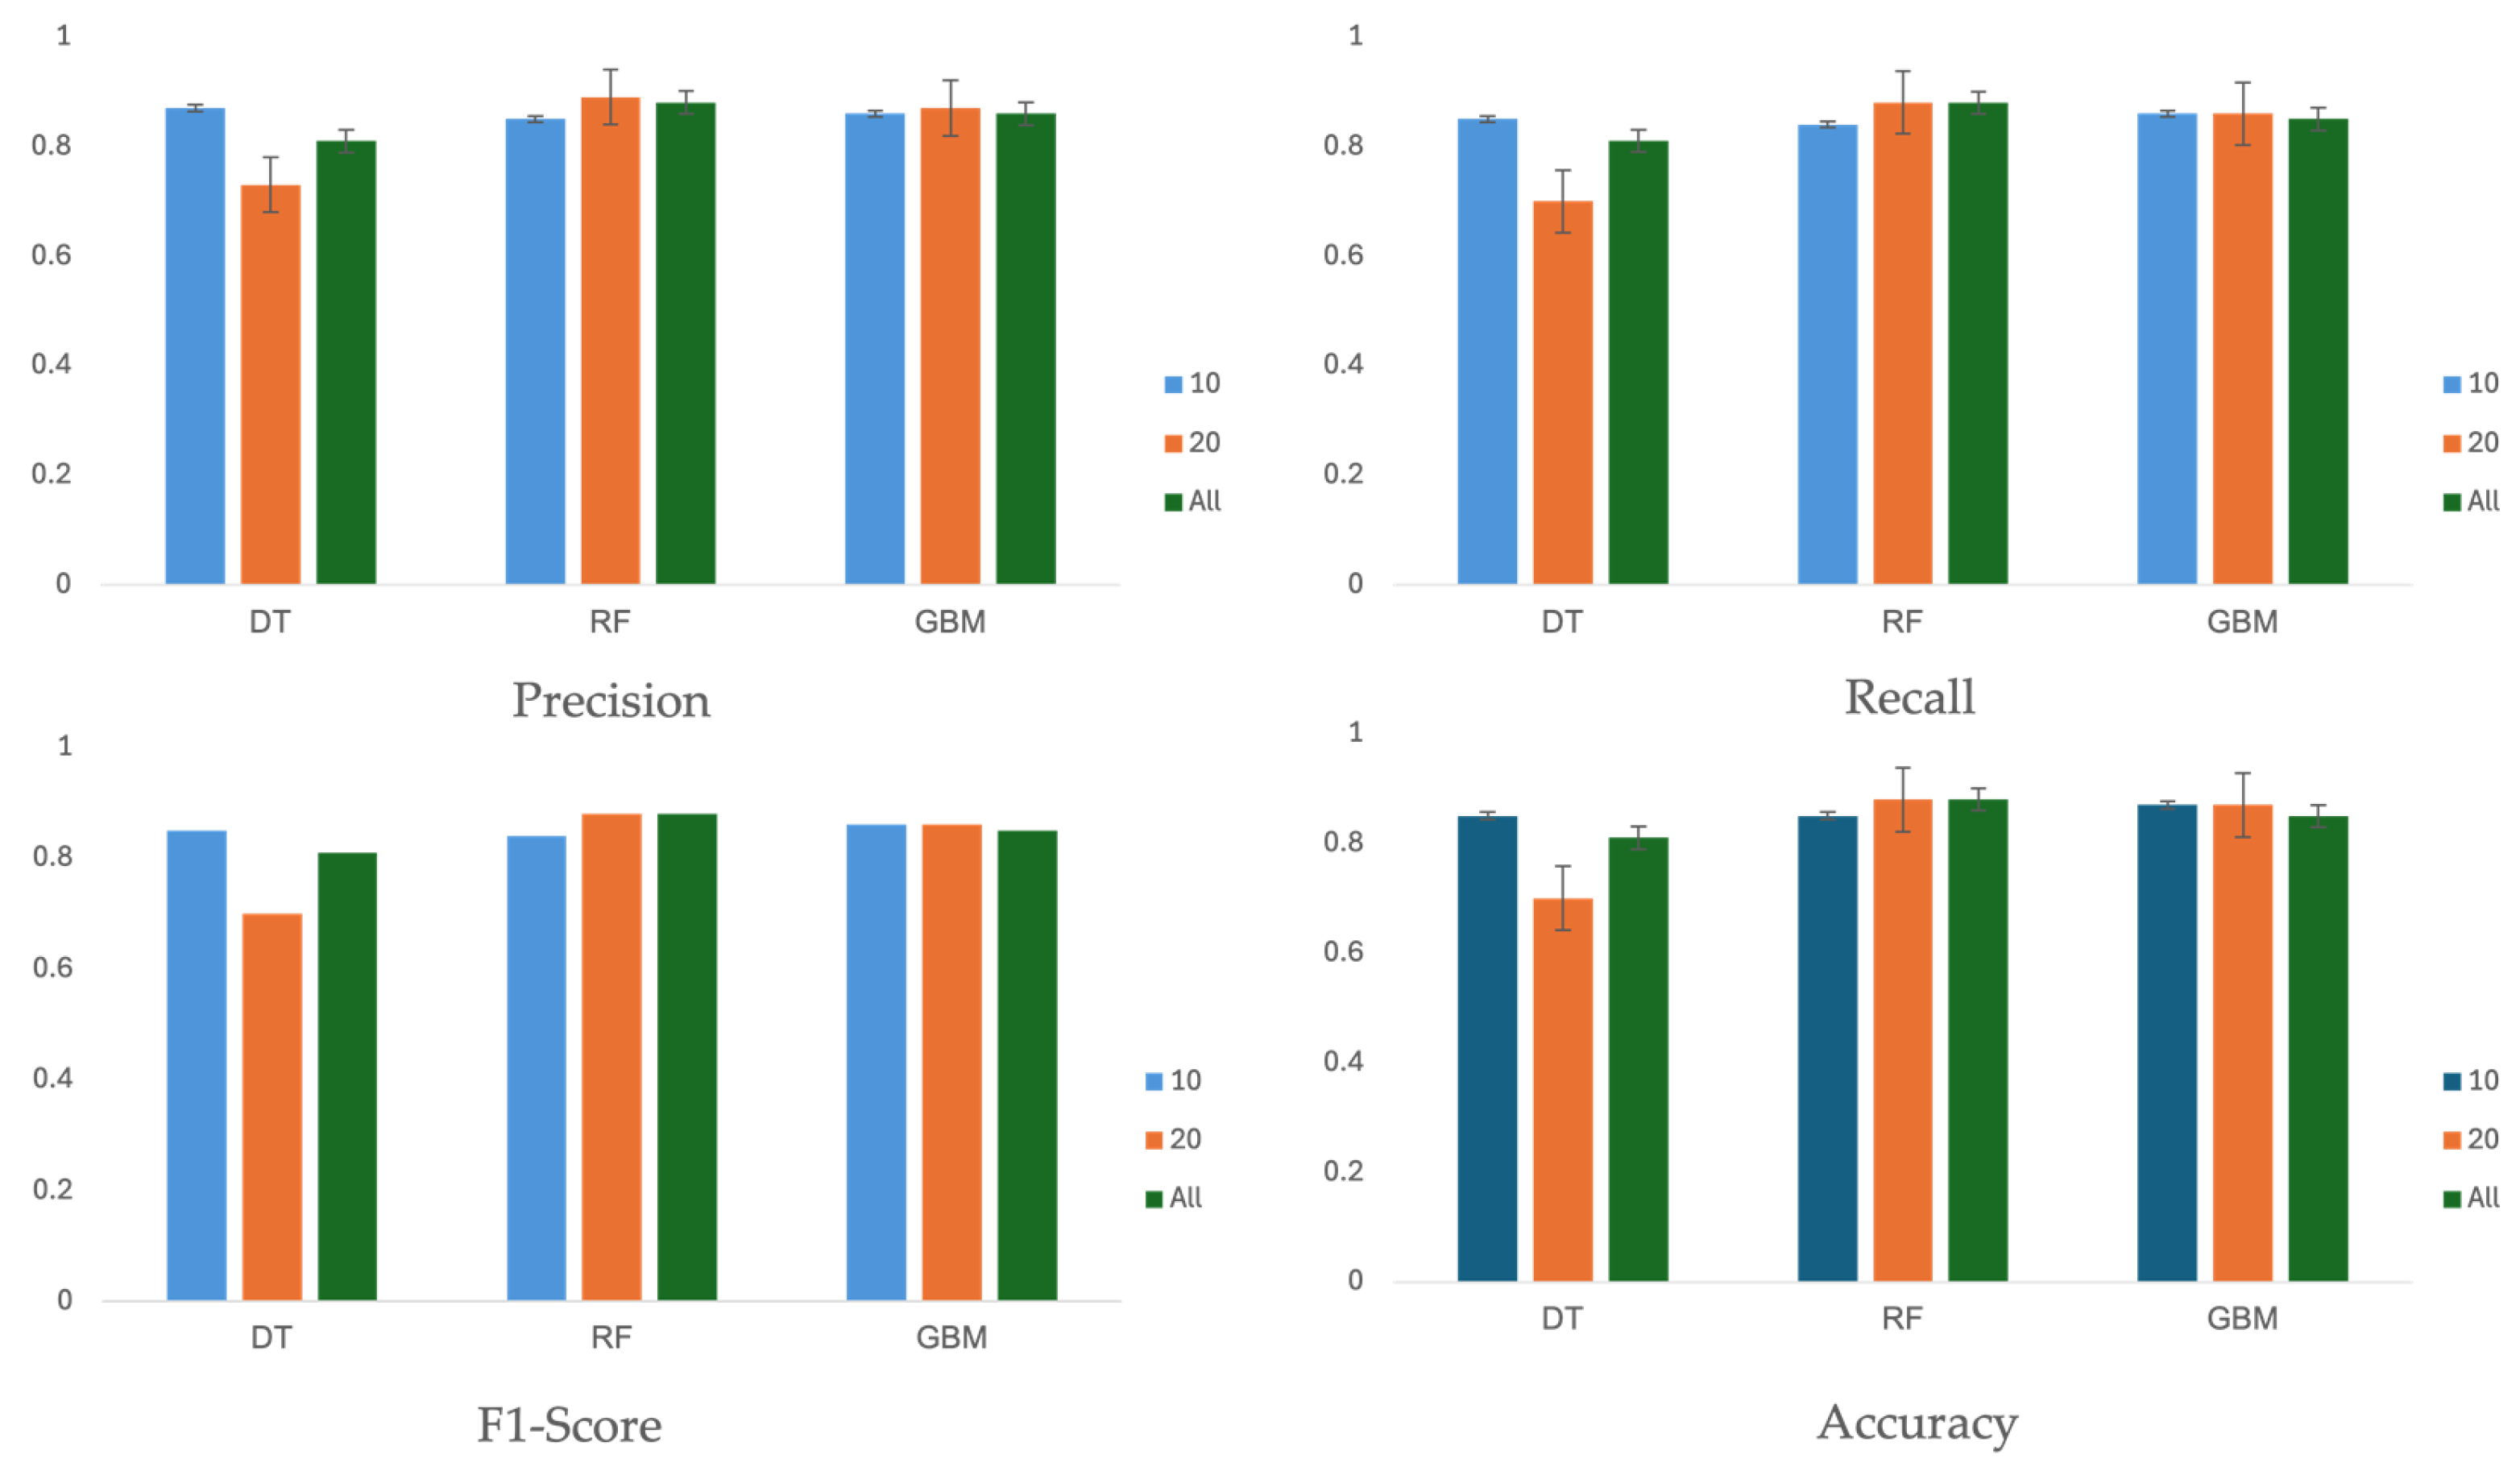
Table 6 and
Figure 5 summarizes the performance of three machine learning algorithms across three different feature sets: 10, 20, and all 27 features. The evaluation metrics, including precision, recall, F1-score, and accuracy, were calculated on the test set using the optimal hyperparameters shown in
Table 5.
Performance scores are reported with 95% confidence intervals (CIs), assuming a Gaussian distribution. In terms of accuracy, the score did not consistently improve with an increased number of features. For the feature sets with 10 or 20 features, the decision tree, random forest, and GBM algorithms achieved accuracy values of 85% (95% CI, 81–89%), 88% (95% CI, 84–92%), and 87% (95% CI, 83–91%), respectively. The evaluation results indicate that feature sets with 10 or 20 features performed better than the set with all 27 features.
4. Discussion
Authors Diagnosing SLE can find it challenging, due to its diverse and often elusive clinical symptoms, and no single test is sufficient for a definitive diagnosis. In this preliminary study, our goal is to develop a machine learning-based Clinical Decision Support System (CDSS) for SLE diagnosis. This system will utilize structured clinical big data and ensemble machine learning algorithms to enhance patient-specific evaluations and diagnoses, with the potential to reduce unnecessary tests.
We collected clinical big data from the standardized OMOP-CDM database across hospitals, which enables multi-center studies, despite variations in data formats. In the future, we plan to include data from additional hospitals.
The ANA test is most useful when there is a strong clinical suspicion of SLE or other autoimmune conditions, due to its low positive predictive value (PPV). PPV measures the probability that individuals who test positive have the condition. However, it is not recommended for general screening of non-specific symptoms because of its high false-positive rate [
8,
11]. In our study, real-world data revealed that among 24,931 patients tested for ANA, only a small percentage were diagnosed with SLE or other autoimmune diseases, and approximately 30.8% tested positive for ANA.
Additionally, 23% of ANA-negative individuals underwent further sub-serology tests, indicating frequent unnecessary testing in clinical settings. Our study supports previous research showing that ANA tests are often used indiscriminately [
10,
24,
25]. For instance, Kang et al. reported a 0.7% prevalence of ANA-associated rheumatic disease, despite a 14.4% positive ANA rate in a large sample from Korean hospitals [
10]. Similarly, a study from a Turkish pediatric clinic found a 27.6% positive ANA rate [
24]. These findings, including our study’s low positive predictive value for diagnosing autoimmune diseases, underscore the need for clinicians to use ANA tests more selectively.
According to our RWD, the likelihood of diagnosing SLE or other autoimmune diseases increased with higher ANA titers. SLE patients were more likely to have key antibodies such as anti-dsDNA, anti-SS A, anti-SS B, and anti-Smith, and exhibited elevated levels of systemic inflammation biomarkers like CRP, NLR, and PLR, while having lower WBC, neutrophil, lymphocyte, and platelet counts. Given the low positive predictive value of ANA testing, it should be reserved for patients with a high pre-test probability of autoimmune diseases. Our findings, consistent with previous research, emphasize the need for selective use of the ANA test due to its high false-positive rate. ANA sub-serologies should be used only for patients with a positive ANA result and strong clinical suspicion of autoimmune diseases, to avoid unnecessary testing. Our study also confirmed that elevated NLR and PLR levels may indicate a higher risk of SLE, warranting further investigation.
Using OMOP-CDM for multi-center studies facilitates scalable research on medical big data, though it comes with limitations due to the dependence on disease codes and de-identified data. ICD-10 and SNOMED are widely used general disease codes, while OMOP-CDM utilizes its own set of codes. As a result, users must map each code to integrate clinical information effectively. This mapping process is time-consuming, so an efficient tool is needed.
Our machine learning-based feature selection indicates that while ANA remains a crucial factor, both PLR and anti-dsDNA should also be considered for further testing. With an accuracy exceeding 88%, our CDSS shows potential as a valuable tool for diagnosing SLE. Although incorporating more features can improve accuracy, a moderate number of around 20 features also delivers comparable performance. However, this study is limited by its data scope, which includes only two hospitals, and by the de-identified nature of OMOP-CDM data, which restricts detailed individual patient evaluations. To validate and refine the machine learning algorithm, future research should integrate data from a broader range of healthcare institutions.


