Abstract
Over the past few years, there has been a surge in research attention towards tasks involving graph data, largely due to the impressive performance demonstrated by graph neural networks (GNNs) in handling such information. Currently, out-of-distribution (OOD) detection in graphs is a hot research topic. The goal of graph OOD detection is to identify nodes or new graphs that differ from the training data distribution, primarily in terms of attributes and structures. OOD detection is crucial for enhancing the stability, security, and robustness of models. In various applications, such as biological networks and financial fraud, graph OOD detection can help models identify anomalies or unforeseen situations, thereby enabling appropriate responses. In node-level OOD detection, existing models typically only consider first-order neighbors. This paper introduces graph diffusion to the OOD detection task for the first time, proposing the HOOD model, a graph diffusion-based OOD node detection algorithm. Specifically, the original graph is processed through graph diffusion to obtain a new graph that can directly capture high-order neighbor information, overcoming the limitation that message passing must go through first-order neighbors. The new graph is then sparsified using a top-k approach. Based on entropy information, regularization is employed to ensure the uncertainty of OOD nodes, thereby giving these nodes higher scores and enabling the model to effectively detect OOD nodes while ensuring the accuracy of in-distribution node classification. Experimental results demonstrate that the HOOD model outperforms existing methods in both node classification and OOD detection tasks on multiple benchmarks, highlighting its robustness and effectiveness.
MSC:
35Q68
1. Introduction
Graph-structured data is ubiquitous in our daily lives, with applications spanning social network analysis, molecular chemical reasoning, and recommendation systems. Drawing on the principles of advanced deep learning models, including convolutional neural networks, recurrent neural networks, and autoencoders, a variety of graph neural network (GNN) techniques have been developed in recent times. These include graph convolutional networks (GCN) [1], graph autoencoders (GAE) [2], graph attention networks (GAT) [3], and graph recurrent neural networks (GRNN) [4,5]. As a result, GNNs have garnered significant research interest due to their capacity to model complex relationships between entities and uncover potential interactions within those entities. This capability has led to their widespread application across various domains.
Graph representation learning involves using learned node or graph embeddings for downstream tasks such as node classification, link prediction, graph classification, out-of-distribution (OOD) graph detection, and graph importance analysis [6,7,8,9,10]. Among these, OOD graph detection is receiving increasing attention due to its significant relevance in real-world applications. For instance, graph-structured data in the real world often changes dynamically with the environment, as seen in transportation systems and bioinformatics networks. Consequently, existing graph neural network models frequently encounter data with significant changes in structure or attribute information. These unknown data violate the common assumption that the test and training distributions are the same. As a result, researchers are striving to enhance the generalization capabilities of network models to handle OOD data effectively.
If network models fail to appropriately address OOD node data, it can lead to severe prediction errors. Therefore, a model with robust OOD detection capabilities can take appropriate measures for such data, ensuring proper handling and avoiding the forceful categorization of unknown data as known types, thereby enhancing the model’s stability and robustness. For example, in cybersecurity, attackers may alter network traffic patterns to evade detection systems. A model with strong OOD detection capabilities can promptly respond to abnormal graph patterns, maintaining the integrity and security of the system.
Existing OOD detection methods have several limitations, such as relying on first-order neighbors for information propagation, which restricts their ability to capture higher-order information. Additionally, they perform poorly in handling noise and lack robustness when facing significant changes in graphs’ structures or attributes, making them less reliable in practical applications like network security and bioinformatics.
In this paper, we introduce a novel OOD detection structure that incorporates the graph diffusion equation to enhance the model’s capability for out-of-distribution detection. To mitigate the risks of over-smoothing and the impact of noise on message passing, we employ a multi-head attention mechanism. This mechanism effectively leverages the inherent features of the nodes, thereby reducing the risk of over-smoothing. Based on the principles of entropy information from the literature [11], we ensure the uncertainty of entropy information of OOD nodes. During the prediction phase, this approach allows for the accurate detection of OOD nodes while maintaining the classification accuracy of in-distribution nodes.
2. Preliminary
2.1. Graph Neural Network
Recent advancements have seen the development of numerous methods designed to address the challenges associated with graph data, which are inherently non-Euclidean in nature. Inspired by traditional convolutional neural networks and autoencoders, researchers have designed various types of graph neural networks (GNNs). These GNNs can broadly be categorized into three types: graph convolutional networks, graph attention networks, and graph recurrent neural networks.
To address noise issues and enhance robustness, several techniques have been proposed. Graph attention networks, for instance, leverage the weights of the attention mechanism to aggregate information from neighboring nodes, thereby improving robustness. Other approaches, such as DropEdge [11], utilize graph sparsification and sampling to achieve efficient computation and increased robustness. Additionally, significant efforts have been directed towards anomaly detection in graphs, with comprehensive surveys available in the literature [12,13]. These studies primarily focus on identifying anomalous samples within the graph.
However, OOD detection requires not only the effective identification of OOD samples but also maintaining the overall performance of the model. This paper investigates the challenge of end-to-end semi-supervised node classification by training GNN models with integrated OOD detection capabilities. By adopting a semi-supervised learning approach [14], our method enables the effective detection of OOD nodes without compromising the accuracy of node classification, thereby ensuring robust performance in practical applications.
2.2. Out-of-Distribution Detection
Graph neural networks (GNNs) have achieved remarkable success in handling graph-structured data, but their performance typically assumes an idealized setting. In real-world environments, however, GNNs are likely to encounter diverse conditions and challenges that can significantly impact their performance, potentially leading to model failure in severe cases [15,16]. The stark contrast between controlled, ideal environments and the unpredictable nature of real-world settings presents a significant challenge for network models.
For instance, in bioinformatics [17], experimental data often contain errors or anomalies, introducing noise into the data structure. This noise adversely affects the learning process of network models, preventing GNNs from making accurate predictions about molecular structures. Similarly, in cybersecurity [18], applying GNNs to network threat detection can lead to a significant deterioration in performance when encountering novel or out-of-distribution data types. These practical challenges expose the susceptibility of GNN models to a range of issues, emphasizing the necessity for enhancing their stability and dependability.
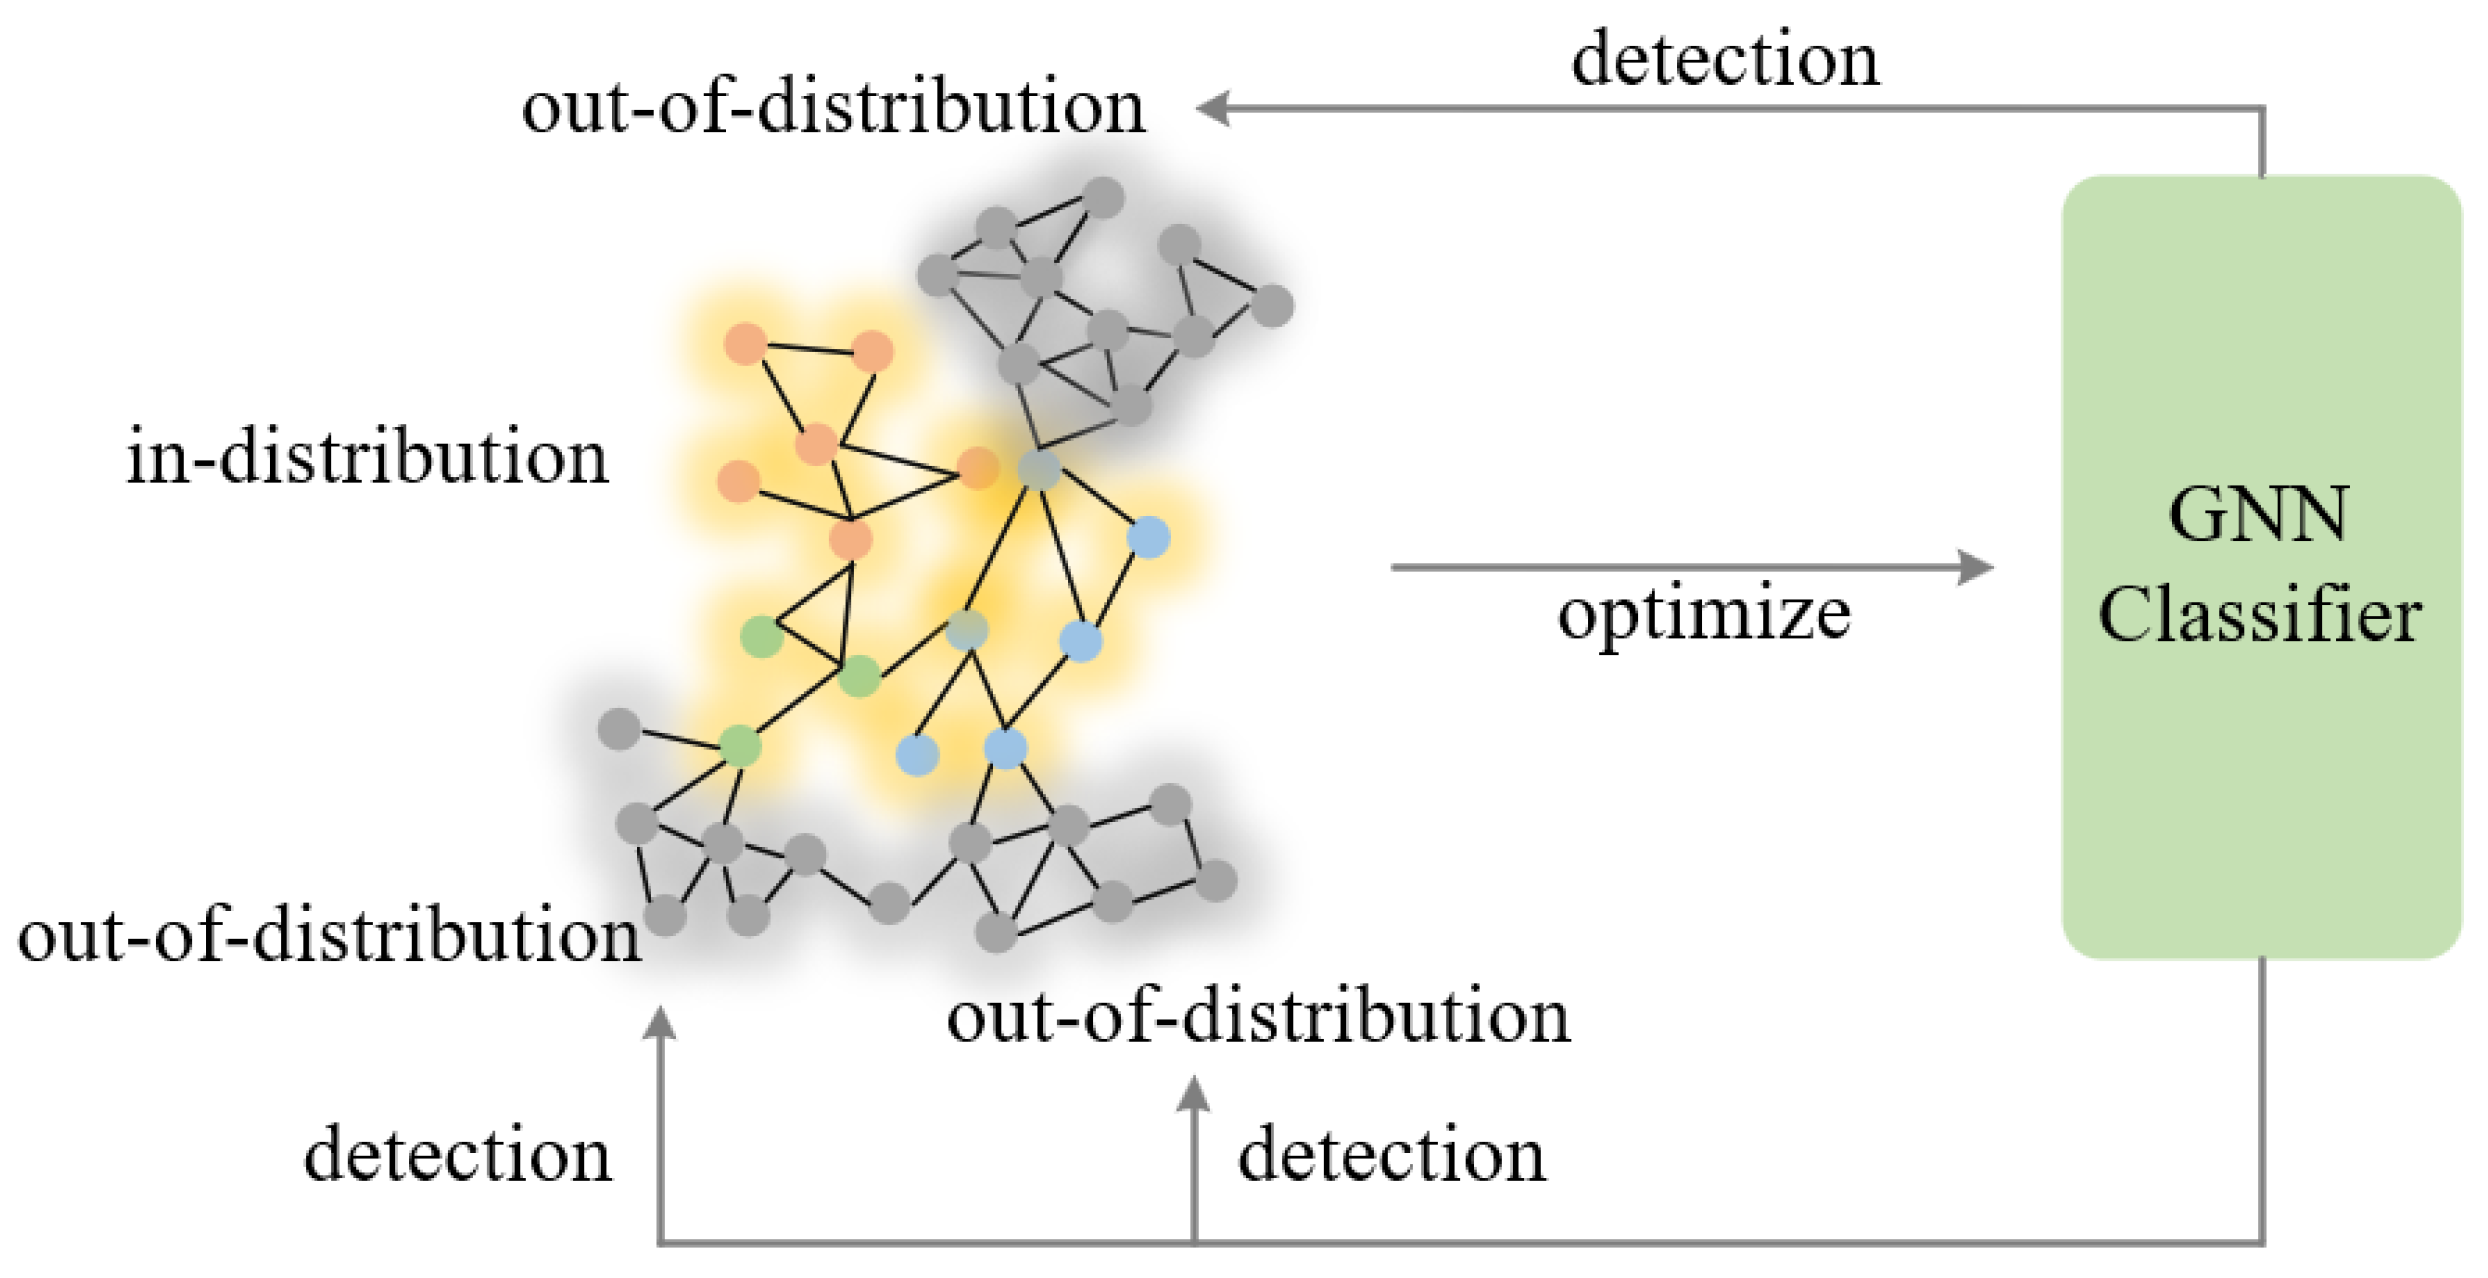
In graphs, out-of-distribution (OOD) data refer to data encountered during the testing phase, the distribution of which significantly deviates from that of the training dataset. In graph learning, OOD detection primarily involves identifying new or anomalous data that did not appear during the network model’s training process. Figure 1 illustrates the situation of OOD node data. Presently, OOD detection algorithms in graphs can be categorized into three types: propagation-based OOD detection algorithms, classification-based OOD detection algorithms, and self-supervised learning-based OOD detection algorithms [19]. Propagation-based algorithms monitor and detect anomalous nodes by propagating information through the graph, making them suitable for capturing structural anomalies but sensitive to edge noise and changes in graph structure. Classification-based algorithms add an OOD detection module or use the confidence levels of classification results to identify OOD nodes, fitting well for scenarios with significant attribute changes but limited for distinguishing when features are similar. Self-supervised learning-based algorithms enhance discriminative power by designing self-supervised tasks (e.g., node feature reconstruction, edge prediction), which are advantageous in dynamic environments but depend on well-designed self-supervised tasks. Each method has its pros and cons: propagation-based methods are good at capturing structural anomalies, classification-based methods can handle attribute changes, and self-supervised methods excel in dynamic environments.
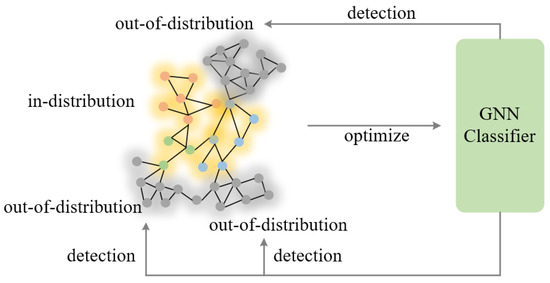
Figure 1.
An example of graph out-of-distribution detection.
For graph-structured data, previous works [20,21] have aimed to detect OOD nodes primarily through uncertainty detection. These efforts have focused exclusively on the OOD detection task, neglecting the simultaneous consideration of both OOD detection and graph node classification in an integrated, end-to-end manner.
2.3. Diffusion Equation
The application of diffusion equations in the context of graph-structured data has been extensively explored, particularly in the realm of graph neural networks (GNNs). For an in-depth understanding of graph diffusion processes and their theoretical underpinnings, we refer the reader to [22]. This work provides a comprehensive treatment of diffusion kernels and their utility in learning tasks conductedon graphs. Additionally, the use of diffusion maps for dimensionality reduction and data parameterization is elucidated in [23], offering a broader perspective on the application of graph-based algorithms. More recent developments, specifically the incorporation of a heat kernel in semi-supervised learning within GNNs, are detailed in [24]. These references offer a robust theoretical framework that complements the graph diffusion mechanisms integral to our model.
Graph diffusion. The graph diffusion equation plays a central role in graph signal processing, as it not only provides a mathematical description for the propagation of signals on graph structures, but also lays the theoretical foundation for designing graph filters and graph convolutional networks. By simulating the natural diffusion process of signals, the graph diffusion equation enables the fusion of neighbor information into node features, thereby enhancing the representational power of graph signals and offering a powerful tool for the analysis and processing of graph signals [25]. The application of the diffusion equation in graph neural networks (GNNs) primarily involves leveraging the structural information of graphs to enhance the capability of node feature representation [24]. GNNs facilitate the effective capture of complex relationships and dependencies between nodes in graph-structured data through information propagation and feature aggregation. By employing the concept of the diffusion equation, strategies for information propagation in GNNs can be designed to naturally mirror the process of information diffusion. This is particularly useful in tasks such as node classification, graph classification, and node clustering, where the diffusion equation guides the processes of information aggregation and propagation, thereby improving the overall performance and robustness of the models.
As shown in Figure 2, in graph data, the diffusion process can be viewed as moving from one node i to another node j. However, in the graph domain, the data domain is discrete, not continuous. Assuming c represents the diffusion rate on the edge, the amount of material moving from node i to node j over a time period is , and the amount moving from node j to node i is , the following expression can be derived:
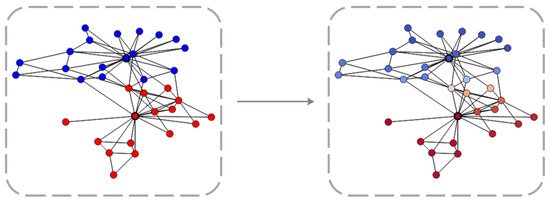
Figure 2.
The example of inter-node diffusion in graph.
Nonetheless, in a graph’s diffusion process, the procedure from all nodes to a particular node, and from node io to all other nodes must be taken into account. The adjacency matrix depicts the graph’s structure and connectivity. For a specified graph, the formula for node i can be deduced as shown in Equation (3):
Subsequently, the equation can be depicted in matrix format, as illustrated in Equation (8).
where , and D is the degree matrix. According to the graph Laplacian operator,
The sequence of formula derivations presented above demonstrates the application of the diffusion equation to graph neural networks.
3. HOOD
3.1. Overall Framework
The overall framework of the HOOD model is shown in Figure 3. The HOOD model is an innovative graph neural network model specifically designed to address the detection of out-of-distribution (OOD) nodes in graph-structured data. By incorporating graph diffusion mechanisms, multi-head attention mechanisms, and various regularization methods, the model effectively enhances the detection capability for OOD nodes while maintaining good classification performance for in-distribution nodes. The HOOD model begins with a heat kernel diffusion mechanism to perform information diffusion and smoothing across the graph. Following this, the top-k method is employed to sparsify the diffused graph. On the newly sparse graph, a multi-head attention mechanism is applied, dynamically adjusting the weights of the node features. The model incorporates entropy-based regularization and Lcon functions to optimize the training process. Finally, the optimized graph is used for model training to perform node classification and OOD node detection.
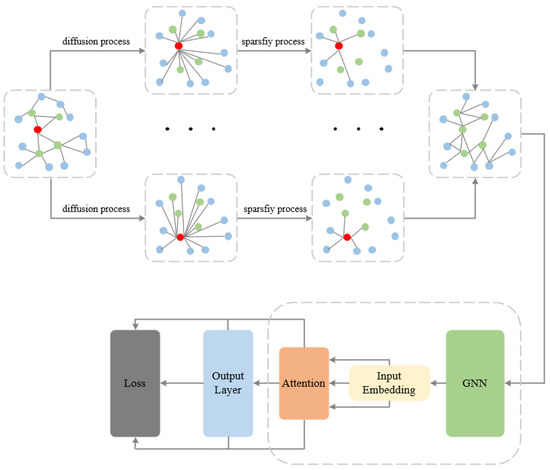
Figure 3.
The overall framework of HOOD.
3.2. Out-of-Distribution Node Detection Based on Graph Heat Kernel Diffusion
Spectral analysis of graph neural networks (GNNs) has led to the adaptation of numerous concepts and methods from traditional deep learning to manage graph-structured data. Spectral theory is particularly pivotal in GNNs design. For instance, graph convolutional networks (GCNs) are built on the graph Laplacian matrix, including its eigenvalues and eigenvectors. The graph’s Laplacian matrix, denoted as , where A signifies the graph’s adjacency matrix and D is the diagonal degree matrix, with each element representing the degree of node i; that is, the count of nodes connected to node i. The Laplacian matrix encodes structural information about the graph.
Spectral graph theory methods define the heat kernel based on the graph’s spectral properties to generate filters on the graph, enabling efficient information propagation and feature smoothing. The heat kernel, being the fundamental solution to the heat equation, can be interpreted as simulating the diffusion process of information or signals within the graph structure when applied to graphs. Moreover, the heat kernel can be considered a function of the graph Laplacian operator. Specifically, for a graph G, the normalized graph Laplacian operator is denoted as . Consequently, the mathematical representation of the heat kernel is as illustrated in Equation (11).
where t is a time parameter that represents the duration of the diffusion process. For the exponential function in the aforementioned Equation (14), it is decomposed through the eigenvalues of the graph Laplacian operator, followed by computation. It can be assumed that , where U is the matrix composed of eigenvectors and is the diagonal matrix of corresponding eigenvalues. Then, Equation (11) can be rewritten as Equation (12).
The previously mentioned Equation (12) explicitly shows that the heat kernel can be defined via the graph Laplacian operator, where each eigenvalue’s impact exponentially decays over time t. This also mirrors the process of information diffusion throughout the graph over time.
The heat kernel matrix is obtained through the spectral decomposition of the graph Laplacian operator , where each element of represents the probability of information diffusion from one node to another. Thus, the heat kernel matrix generates a new weighted graph through these information diffusion probabilities. Specifically, the graph Laplacian operator is obtained through spectral decomposition as , where U is the matrix of eigenvectors and is the diagonal matrix of eigenvalues. The Equation (12) indicates that the heat kernel is generated by the decay process of the graph Laplacian operator’s eigenvalues, directly capturing the high-order relationships within the graph structure. The matrix generated by this process is typically dense because each node may have non-zero diffusion probabilities with other nodes.
In the HOOD model, a common approach is used, treating the heat kernel as a filter, which can be considered as a polynomial of . Its kernel filter is , and are the eigenvalues for . The range of eigenvalues for is . For , if , then , meaning . As t escalates, the ratio also amplifies, progressively disregarding more high-frequency information. Thus, t serves as a modulator between low and high frequencies. This method of processing graph data mitigates the high-frequency noise in the graph signals, rendering the signals smoother throughout the graph. Additionally, as a spectral filter, the heat kernel can capture both local and global features of nodes in the graph. It effectively distances nodes from different distributions, reducing their mutual influence. By effectively adjusting the diffusion time t, it allows for precise control over the scale of feature extraction for different graph datasets. That is, when t is small, it can overly concentrate on local structural information in the graph; when t is large, it can better focus on the global structural information in the graph.
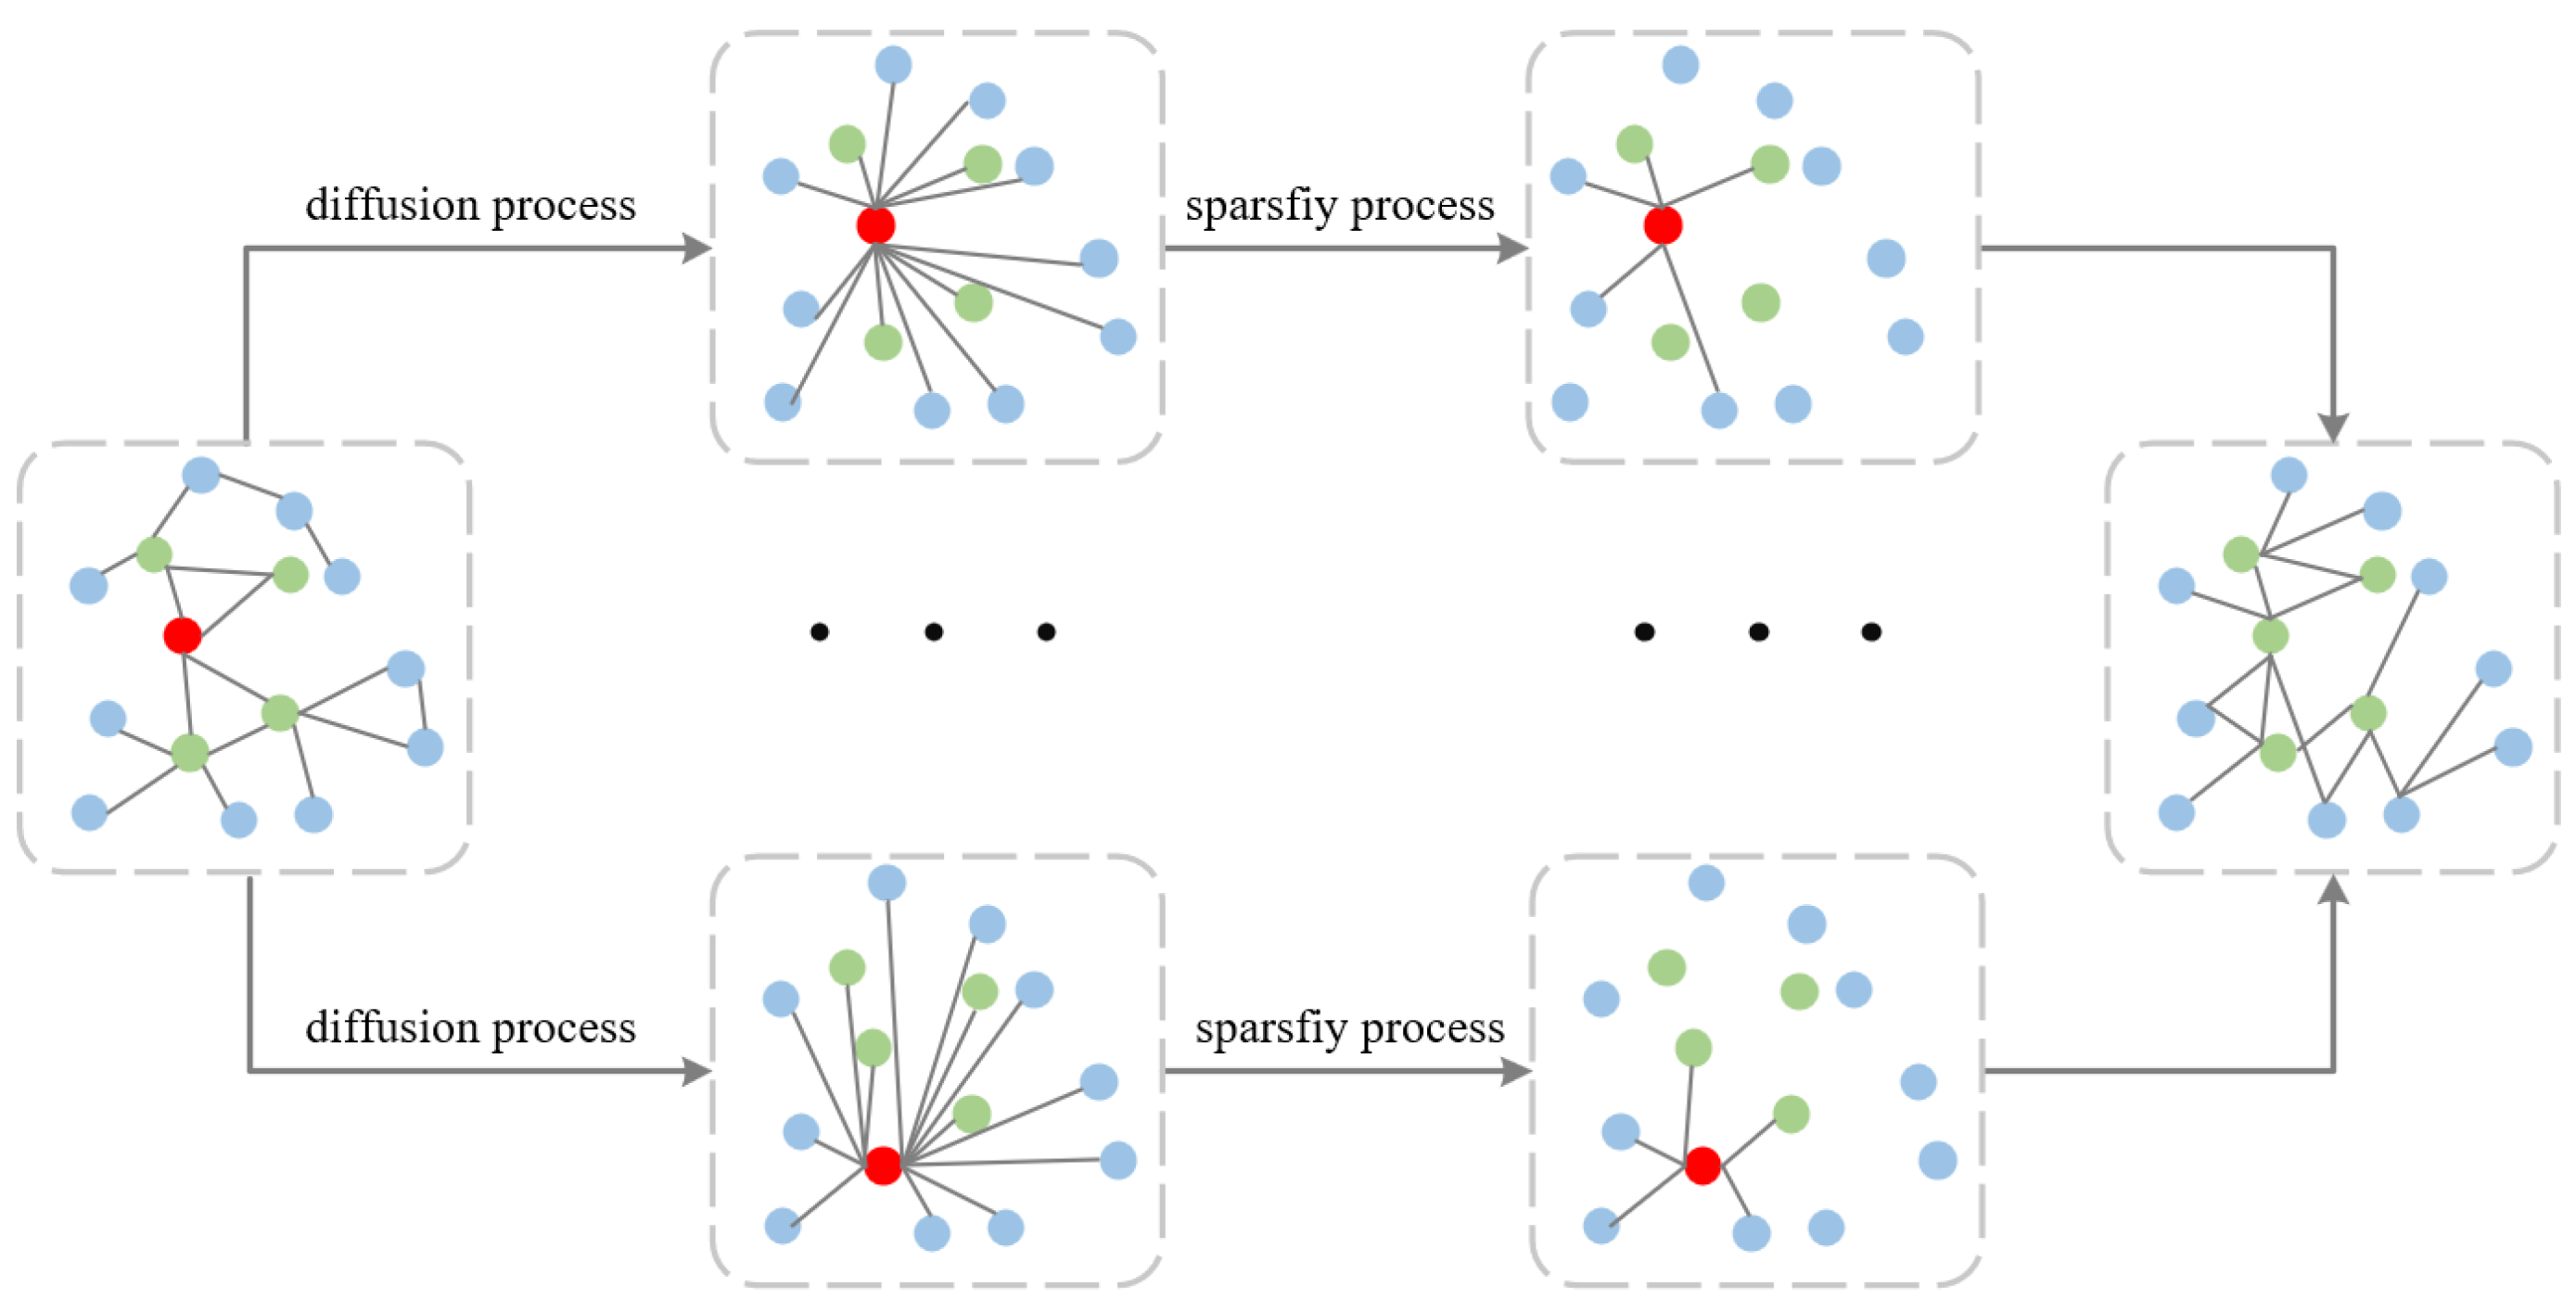
Figure 4 provides an overview of the diffusion and sparsification processes in our graph model. The diffusion process aims to smooth neighborhood information by propagating it throughout the graph, leading to a denser graph structure. To address this increased density, we employ a sparsification process, which is crucial for managing complexity and enhancing the computational efficiency of our model. Although the edges in the figure do not precisely point to the centers of the nodes, this visual representation effectively conveys the iterative nature of these processes and their significance in preparing the graph for subsequent analysis. As proposed in DGC [26], the HOOD model adopts a top-k sparsification approach. In the experimental section, an ablation study on the k value is conducted, and the results are analyzed. The top-k method retains only the most significant k connections in each node’s neighborhood, disregarding the rest. “Importance” can be defined based on various criteria, such as the feature similarity of adjacent nodes, edge weights, or the strength of interactions between nodes. In HOOD, by sorting the graph after heat kernel diffusion and setting the remaining elements to zero in the sorted array, all connections except for the k strongest are removed, thereby achieving graph sparsification. By only retaining the k most important neighbors for each node, computational load is further reduced, accelerating the model’s training and inference processes and positively impacting model performance.
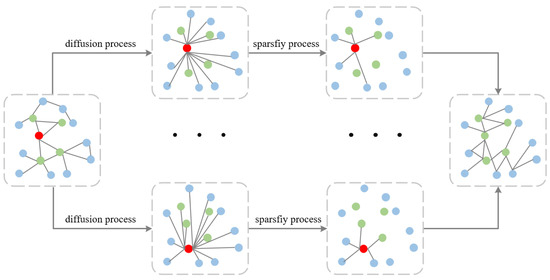
Figure 4.
The schematic diagram of the structure of figure diffusion.
3.3. Attention Mechanism
Post the diffusion and sparsification processing of the graph data as outlined above, a new graph is generated. An attention mechanism is utilized in the model to further differentiate in-distribution and out-of-distribution nodes during the network model training process, thereby diminishing their mutual influence. This mechanism determines the weight information between nodes, facilitating the accumulation of more beneficial information during the information propagation process and mitigating the noise impact from different distributions. Inspired by graph attention networks [3], the general form of the graph convolution formula for the attention mechanism is as illustrated in Equation (13).
where represents the attention weight between node i and node j. To enhance the performance of the HOOD model, this section employs a multi-head attention mechanism, as shown in Equation (14).
where, K represents the number of attention heads, and the content of the output layer is shown in Equation (15).
3.4. Regularization
In the HOOD model, node classification within the graph employs cross-entropy loss. Cross-entropy loss is primarily utilized to gauge the divergence between two probability distributions. In the downstream tasks of graph neural networks, it is typically applied to classification. The mathematical representation is as depicted in Equation (16).
Here, represents the number of nodes in the graph, represents the true label of node i, and represents the model’s predicted probability distribution, which is typically calculated using the softmax function.
To ensure enhanced learning of the differences between in-distribution node data and out-of-distribution node data by the model’s classifier, thereby boosting the model’s stability and reliability, the model applies cross-entropy loss supplemented by two regularization terms to manage the learning procedure of the HOOD model. The overall structure of the regularization loss in the model is depicted in Figure 5.
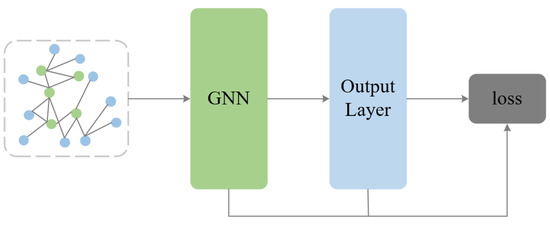
Figure 5.
Diagram of the structure of the regularization.
As per the literature [14], the utilization of cross-entropy loss in the HOOD model gradually aligns the predicted probability distribution of nodes with the true one-hot distribution during the model’s classification tasks. Overall, in the training process, nodes are progressively drawn towards the one-hot distribution, a process that diminishes the entropy of the nodes’ distribution in the graph. In the network model, this situation is beneficial for in-distribution node data. However, for out-of-distribution nodes, a reduction in entropy is not desirable. To lessen the impact of reducing entropy on the detection of out-of-distribution nodes, it is crucial to prevent a decrease in entropy information for these nodes. Therefore, out-of-distribution nodes should maintain a uniform distribution rather than shifting towards a one-hot distribution. This differentiation between in-distribution and out-of-distribution nodes enhances the model’s out-of-distribution detection performance. The mathematical formula for entropy loss is depicted in Equation (17).
where U represents the uniform distribution, represents the predicted distribution of node i, and represents the threshold for identifying a node as out-of-distribution. The term computes the cross-entropy between the predicted distribution of node i and a uniform distribution U. If the predicted distribution of node i is close to the uniform distribution, the cross-entropy loss will be large, indicating a higher likelihood that the node is considered an out-of-distribution node. Therefore, by applying this regularization term to out-of-distribution nodes, the risk of misclassifying them as in-distribution nodes can be effectively reduced.
In the HOOD model, this paper adopts the same method used in OODGAT, which uses a binary classifier to predict the scores for out-of-distribution nodes within the input graph data. To capture useful feature information between nodes, the previously discussed attention mechanism is utilized during the training process to manage the weights between nodes. Ultimately, in the model’s output, each node’s distribution is obtained, and these outputs are then computed to serve as criteria for determining whether nodes in the graph are out-of-distribution. In the model, these two parameters are optimized simultaneously. Cosine similarity is used for this purpose. The corresponding mathematical representation is depicted in Equation (20).
where represents the entropy information of node i, and represents the classifier’s predicted outcome for node i. By combining the two regularization terms and the classification loss from the above formula, the overall loss function is presented as shown in Equation (21).
4. Experiments
In this section, we assess the performance of the HOOD model across a range of actual graph datasets.
4.1. Datasets
In this study, we follow the evaluation protocol proposed in the literature [14]. Our experiments were performed on six commonly used graph datasets utilizing the HOOD algorithm. For each dataset, the corresponding classes are divided into two parts: in-distribution data, comprising nodes from in-distribution graph data, and out-of-distribution data, encompassing nodes from out-of-distribution graph data. To ensure balance in the data distribution within the graphs, the method used for dividing the datasets in the literature [14] was employed, ensuring that there are more than three categories of in-distribution graph data nodes. Information about the six datasets is provided in Table 1 below.

Table 1.
The detailed information of each dataset.
4.2. Baselines
We compared HOOD with eight mainstream graph OOD detection baseline methods, which can be classified into two types.
End-to-end methods. In this framework, we perform semi-supervised out-of-distribution detection and node classification. We have chosen MLP, GCN, GraphSAGE [27], GAT, and OODGAT as comprehensive baselines for this task. MLP serves as a control to measure performance without considering the graph’s topological structure, while the other four models are representative GNNs. For all these methods, the entropy of the predicted distribution is used as the score for OOD detection.
Post-hoc OOD detectors. This strategy involves the implementation of additional outlier detection mechanisms that operate subsequent to a pre-trained classification system. We have used ODIN [28], Mahalanobis distance [29], and CaGCN [30] as subsequent detection tools. ODIN modifies the output distribution using temperature scaling and pre-processing of inputs, while the Mahalanobis distance calculates the separation between test samples and identified inliers, leveraging the latent space from the pre-trained classifier. For these methods, we have adopted the OOD detection metrics from their original sources, specifically the MSP from [28] and the Mahalanobis metric from [29]. CaGCN, a newly introduced technique for confidence calibration in GNN outputs, enables us to utilize the calibrated confidence levels as a scoring system for outlier detection.
4.3. Evaluation Metrics
In the context of graph-based learning with out-of-distribution (OOD) nodes, our focus is on dual objectives: categorizing nodes and identifying anomalies. Accuracy serves as the primary benchmark for node classification. In contrast, for OOD detection, we rely on established metrics: the area under the receiver operating characteristic curve (AUROC) and the false positive rate at a 95% true positive rate (FPR@95). Across our experiments, anomalies are labeled as positive instances. To gauge the collective efficacy of these tasks, we frame them within a multi-class framework encompassing N + 1 classes—N for the standard distribution and one for OOD. The weighted F1 score serves as a comprehensive measure of this performance.
4.4. Experimental Settings
For the multi-head attention model, the number of attention heads is set to 4, the learning rate is set at 0.01, and DropEdge is set to 0.6. The values for the heat kernel diffusion coefficient t range from [1, 10]. For the top-k algorithm, the values of are in the set . The number of training iterations is set at 1000. All experiments are conducted using PyTorch Geometric.
4.5. Results
The experimental results, as presented in Table 2 and Table 3, highlight the significance and efficacy of the HOOD model, particularly in the task of out-of-distribution (OOD) node detection. Our model demonstrates a marked advantage over other methods across five of the six datasets, showcasing its strength in identifying nodes that deviate from the training data distribution. From the results, it is evident that the HOOD model significantly outperforms MLP in out-of-distribution node detection, demonstrating that graph neural networks can greatly enhance model performance in node classification and OOD detection by utilizing the graph topology. The HOOD model’s superiority is especially pronounced when compared to the MLP model, indicating the substantial benefits of leveraging graph topology for OOD detection. This performance edge is further emphasized in its comparison with established graph neural network models such as GCN, GAT, and, GraphSAGE, where HOOD consistently outperforms these models. This success can be attributed to the model’s incorporation of graph diffusion and regularization techniques, which effectively segregate nodes of varying distributions and bolster the model’s OOD detection capabilities. Compared to the OODGAT model, HOOD outperforms OODGAT in node classification on the Cora and AmazonCS datasets, while OODGAT has superior performance on the remaining four datasets. In terms of OOD node detection, except on the CoauthorCS dataset where OODGAT performs better, HOOD outperforms OODGAT on the other five datasets. This indicates that graph diffusion effectively separates nodes of different distributions within the graph data, helping to reduce the impact between in-distribution and out-of-distribution node data and enhancing the model’s ability to detect out-of-distribution nodes.
Table 2.
Comparison with end-to-end methods.
Table 3.
Comparison with end-to-end methods.
In Table 3, ODIN, CaGCN, and the Mahalanobis distance are post-hoc detection methods. Since HOOD utilizes semi-supervised learning, its performance is significantly superior to that of the post-hoc detection methods.
The experimental results in Table 2 and Table 3 demonstrate, from various aspects, the importance and effectiveness of graph diffusion, multi-head attention mechanisms, and regularization in enhancing the performance of graph neural networks in node classification and out-of-distribution node detection.
4.6. Ablation Study
To further validate the effectiveness of the modules proposed in this chapter, and to examine the impact of regularization on node classification and out-of-distribution detection performance, this section conducts a more comprehensive exploration of the model’s performance through ablation studies of the HOOD out-of-distribution detection model conductedon six datasets.
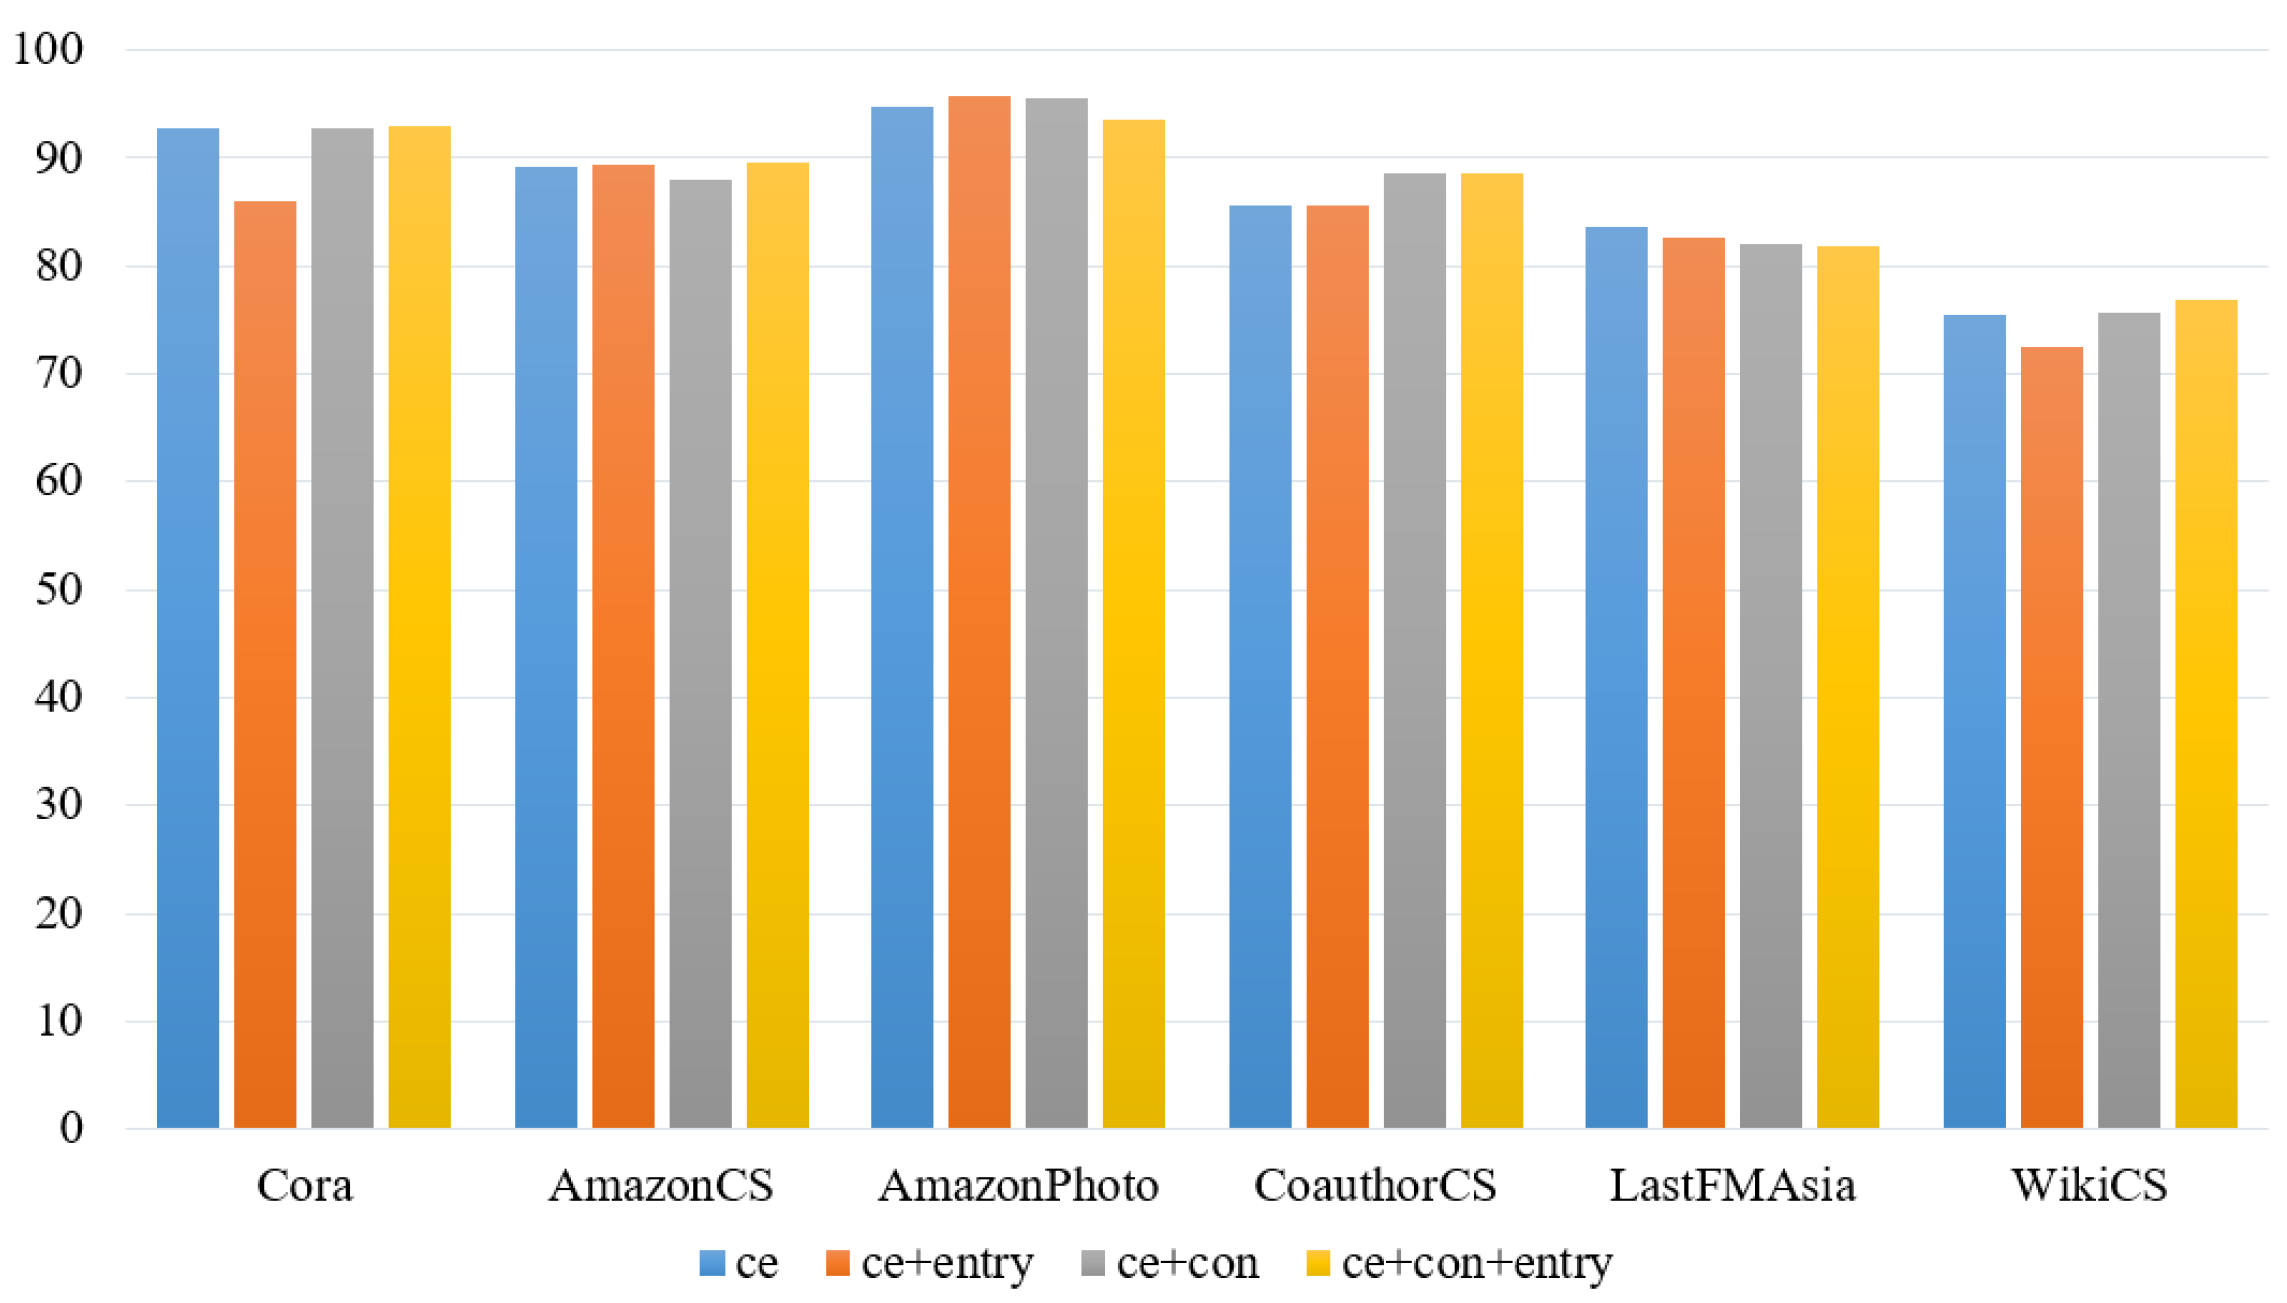
In HOOD, the loss function module is divided into four combinations to verify the effectiveness of each component. These combinations are , and .
From Figure 6, it is evident that in the HOOD algorithm, incorporating the module results in a slight decrease in performance for in-distribution node prediction, which can be attributed to the effect of entropy regularization on the distribution of nodes. Overall, the impact of each module on the performance of in-distribution node prediction is minimal. From Figure 7, it is observed that in the HOOD algorithm model, except for the AmazonCS and AmazonPhoto datasets, using only results in the worst AUROC scores across the remaining four datasets, directly demonstrating the effectiveness of adding and to the loss function in enhancing the model’s OOD detection capability. Comparing and , except for AmazonCS and AmazonPhoto, performs better in AUROC on the remaining datasets, indicating that has a greater impact on the network model than . Finally, among the four combinations, performs the best across all six datasets, further indicating the effectiveness of using the three loss function combinations in the HOOD algorithm.
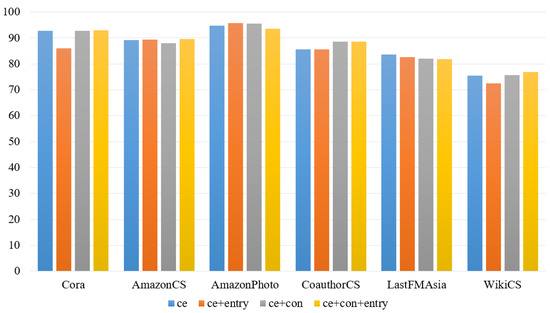
Figure 6.
The results of Acc on the HOOD model.
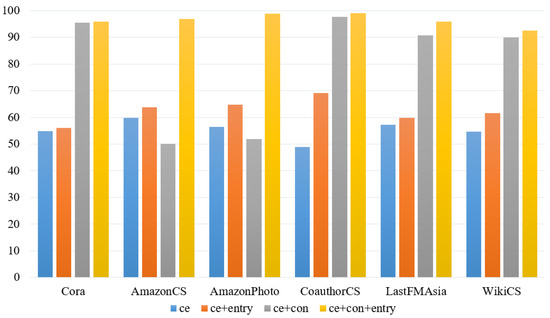
Figure 7.
The results of AUROC on the HOOD model.
4.7. Impact of Hyper-Parameters on Model Performance
To observe the impact of parameters on the experimental results within the HOOD model, this section conducts parameter sensitivity analysis experiments by varying the parameters in the model. This analysis is performed across six datasets.
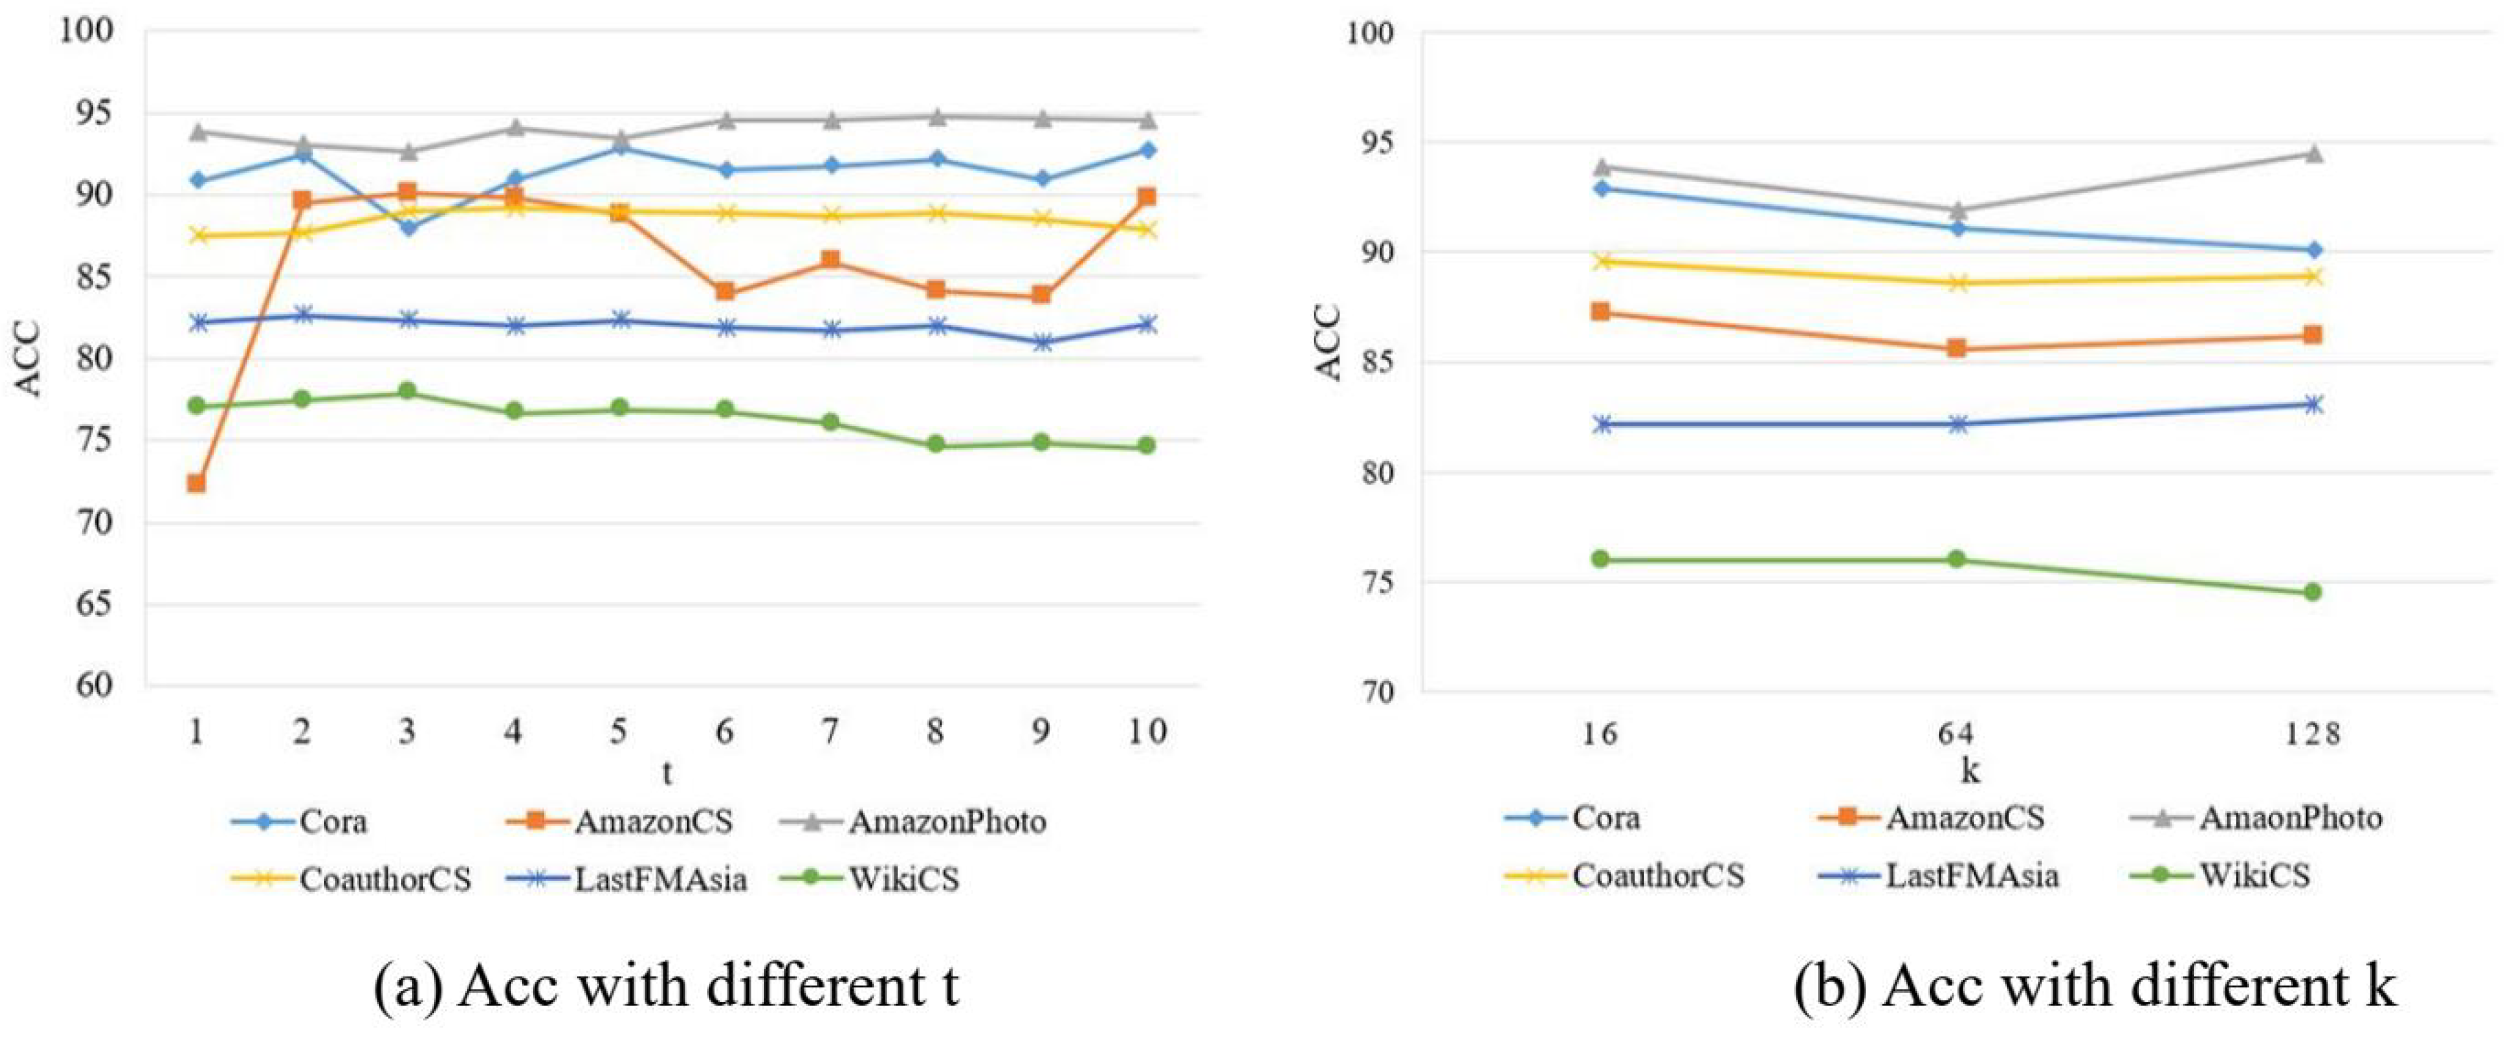
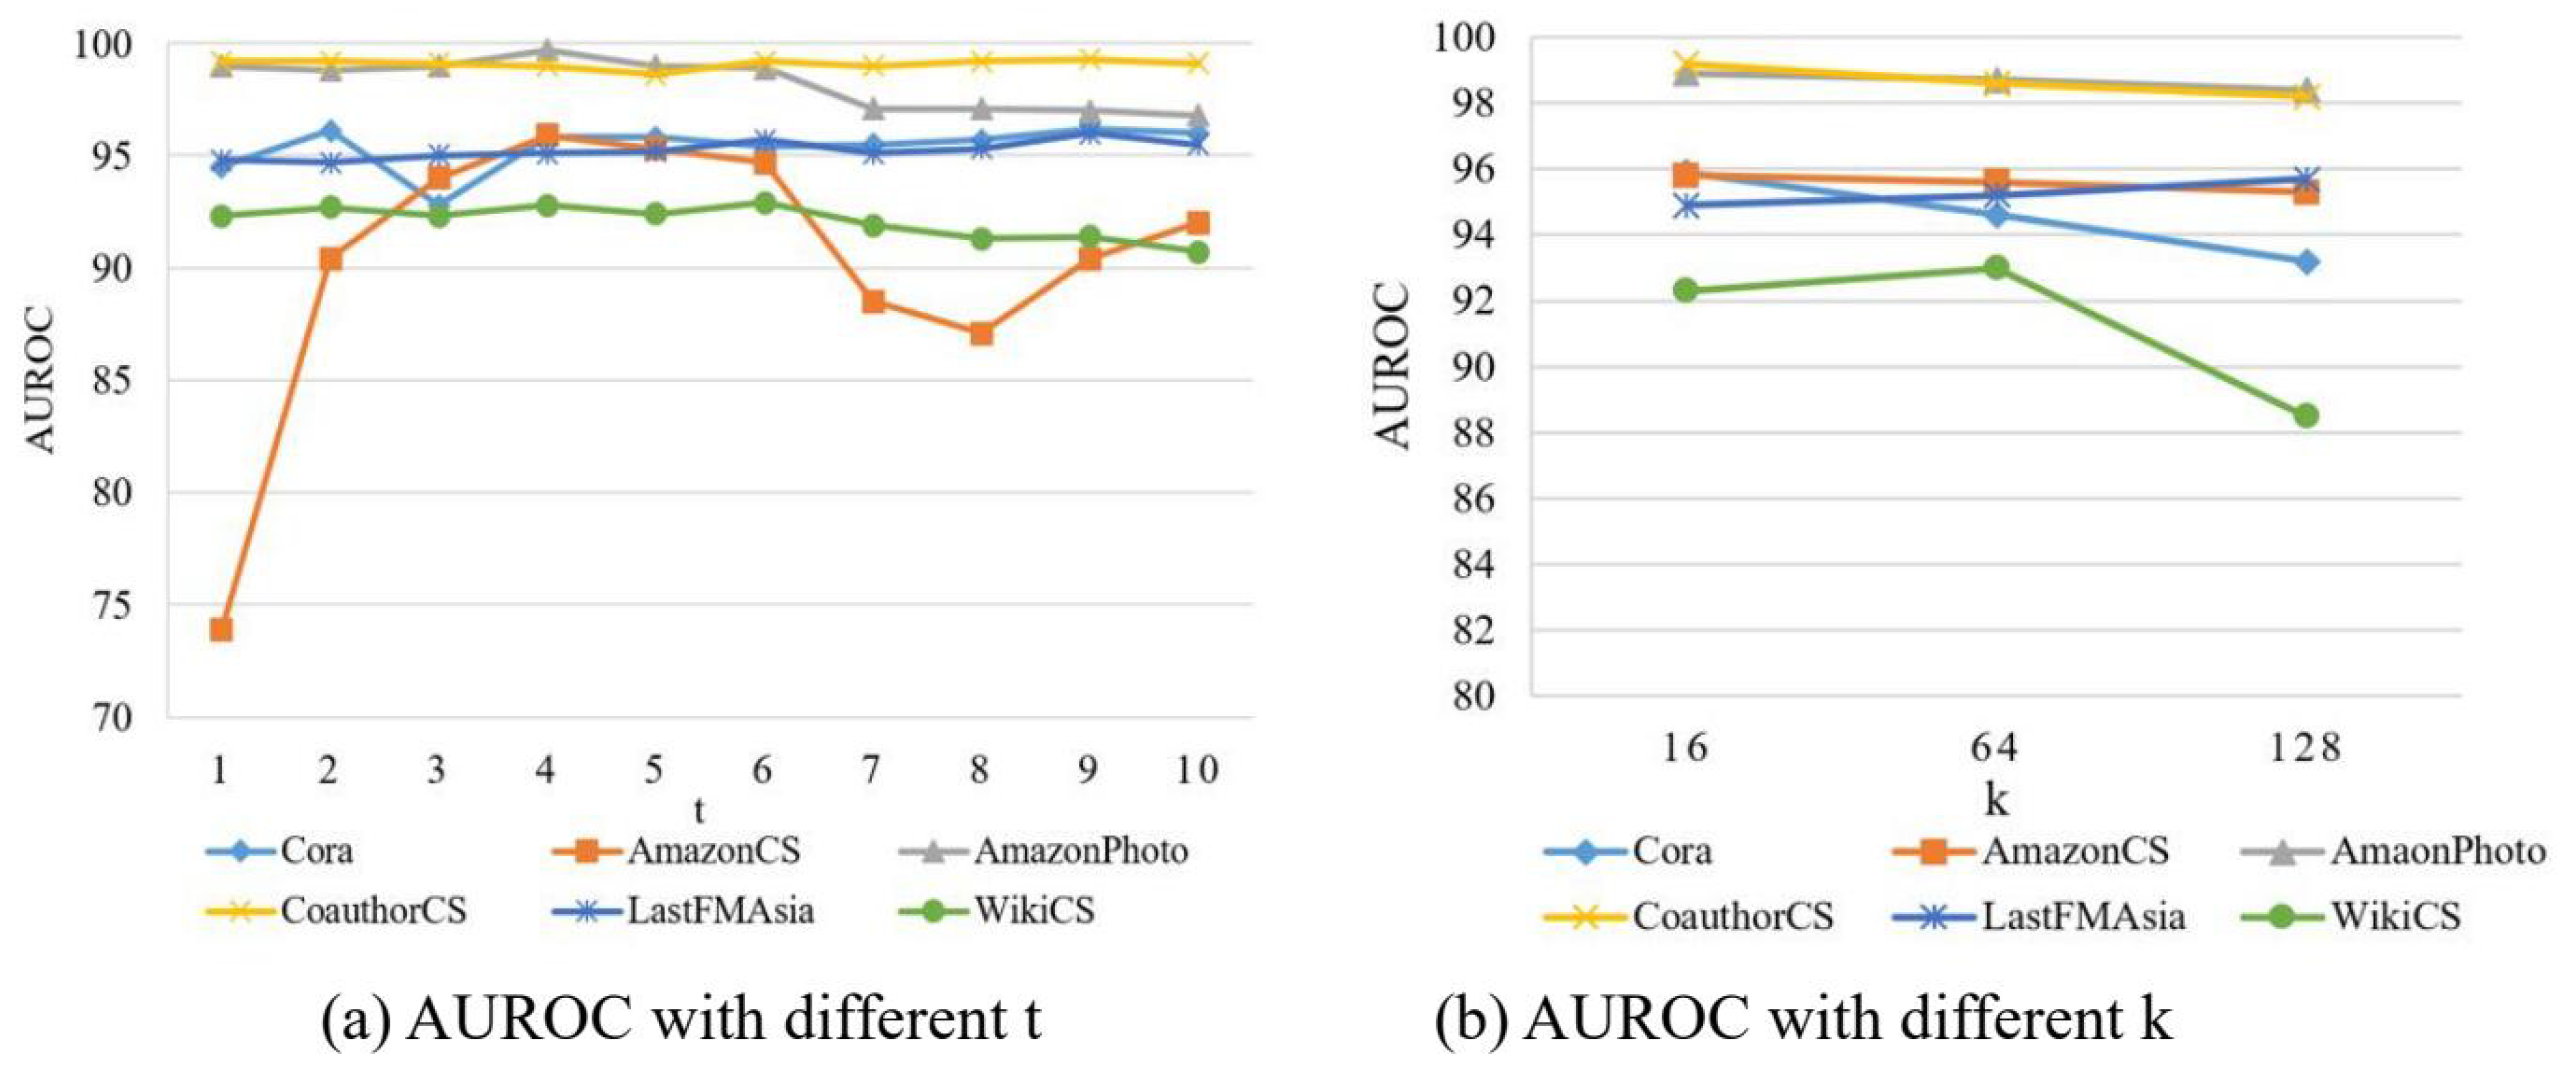
In the HOOD algorithm model, there are mainly two parameters: one is the value of t in the heat kernel diffusion, and the other is the value of k for sparsifying the original graph using the top-k method. When k is set to 16, the range of t is from 1 to 10, i.e., . The experiments observe the impact of the heat kernel diffusion t value on model performance, with the accuracy results shown in Figure 8a and the AUROC results shown in Figure 9a. When t is set to 5, and k takes values of 16, 64, and 128, the accuracy results are shown in Figure 8b and the AUROC results in Figure 9b.
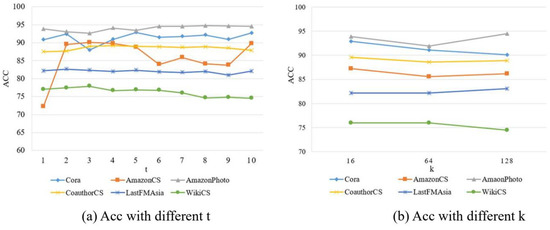
Figure 8.
The results of experiments of Acc.
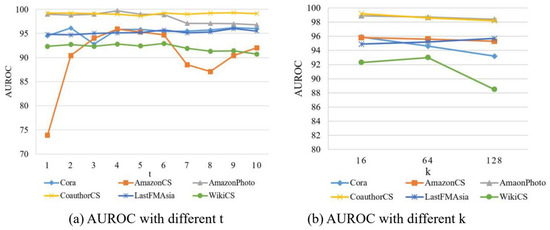
Figure 9.
The results of experiments of AUROC.
The experimental results are shown in Figure 8 and Figure 9. From these figures, the following conclusions can be drawn.
When k is set to 16, as the value of t increases, a general trend observed across the six datasets is that the accuracy performance first improves and then declines, and the AUROC performance also shows an initial increase followed by a decrease. Regarding the effect of t in the model, it influences the neighborhood relationships of nodes in the graph. As t increases, the AUROC performance initially improves because, with the expansion of node neighborhoods, the nodes in the graph can aggregate more useful feature information, reducing the impact of noise from nodes of different distributions. This means the model is better able to capture the characteristic information of in-distribution nodes and reduce the impact of out-of-distribution nodes. However, as t continues to increase, a decline in AUROC performance begins to appear. This decline can be attributed to potential overfitting as t becomes too large. Although regularization in the model helps mitigate overfitting, an excessively high t value can still have a detrimental effect on the network model.
When t is set to 5 and k values are increased, on the Cora and WikiCSfour datasets, the accuracy performance generally exhibits a trend of initial decline followed by an increase. On the Cora, AmazonCS, AmazonPhoto, and CoauthorCS datasets, the AUROC performance generally shows a declining trend. On the LastFMAisa dataset, the AUROC performance overall shows an increasing trend. On the WikiCS dataset, the AUROC performance initially increases and then decreases. Therefore, when using top-k sparsification on the new graph obtained through graph diffusion, the performance varies slightly across different datasets due to inherent characteristics of the datasets, such as graph size and sparsity, which all influence performance differently.
5. Conclusions
In this paper, we investigate the problem of graph learning with out-of-distribution (OOD) nodes. Specifically addressing the node-level OOD detection issue, we designed a graph diffusion-based HOOD algorithm model. This model introduces graph diffusion into OOD detection tasks for the first time and employs a multi-head attention mechanism to further differentiate between in-distribution and out-of-distribution node data. This reduces the mutual influence among nodes of different distributions, maintaining good performance in both in-distribution node prediction and OOD node detection, thereby enhancing the model’s stability and reliability.
Author Contributions
Writing—original draft, F.L.; Methodology, Y.W.; Software, X.D.; Formal analysis, X.L.; Investigation, G.Y. All authors have read and agreed to the published version of the manuscript.
Funding
This research received no external funding.
Data Availability Statement
Data is contained in this article (Section 4).
Conflicts of Interest
The authors declare no conflicts of interest.
References
- Wu, L.; Cui, P.; Pei, J.; Zhao, L.; Guo, X. Graph neural networks: Foundation, frontiers and applications. In Proceedings of the 28th ACM SIGKDD Conference on Knowledge Discovery and Data Mining, Washington, DC, USA, 14–18 August 2022; pp. 4840–4841. [Google Scholar]
- Li, M.M.; Huang, K.; Zitnik, M. Graph representation learning in biomedicine and healthcare. Nat. Biomed. Eng. 2022, 6, 1353–1369. [Google Scholar] [CrossRef] [PubMed]
- Velickovic, P.; Cucurull, G.; Casanova, A.; Romero, A.; Lio, P.; Bengio, Y. Graph attention networks. Stat 2017, 1050, 10–48550. [Google Scholar]
- Zhou, J.; Shen, J.; Shan, Y.; Xuan, Q.; Chen, G. Subgraph augmentation with application to graph mining. Graph Data Min. Algorithm Secur. Appl. 2021, 73–91. [Google Scholar] [CrossRef]
- Xia, F.; Sun, K.; Yu, S.; Aziz, A.; Wan, L.; Pan, S.; Liu, H. Graph learning: A survey. IEEE Trans. Artif. Intell. 2021, 2, 109–127. [Google Scholar] [CrossRef]
- Chen, H.; Yin, H.; Wang, W.; Wang, H.; Nguyen, Q.V.H.; Li, X. PME: Projected metric embedding on heterogeneous networks for link prediction. In Proceedings of the 24th ACM SIGKDD International Conference on Knowledge Discovery & Data Mining, London, UK, 19–23 August 2018; pp. 1177–1186. [Google Scholar]
- Wang, X.; Cui, P.; Wang, J.; Pei, J.; Zhu, W.; Yang, S. Community preserving network embedding. In Proceedings of the AAAI Conference on Artificial Intelligence, San Francisco, CA, USA, 4–9 February 2017; pp. 203–209. [Google Scholar]
- Long, Q.; Wang, Y.; Du, L.; Song, G.; Jin, Y.; Lin, W. Hierarchical community structure-preserving network embedding: A subspace approach. In Proceedings of the 28th ACM International Conference on Information and Knowledge Management (CIKM), Beijing, China, 3–7 November 2019; pp. 409–418. [Google Scholar]
- Shen, X.; Pan, S.; Liu, W.; Ong, Y.S.; Sun, Q.S. Discrete network embedding. In Proceedings of the 27th International Joint Conference on Artificial Intelligence (IJCAI), Stockholm, Sweden, 13–19 July 2018; pp. 3549–3555. [Google Scholar]
- Yang, H.; Pan, S.; Zhang, P.; Chen, L.; Lian, D.; Zhang, C. Binarized attributed network embedding. In Proceedings of the 2018 IEEE International Conference on Data Mining (ICDM), Singapore, 17–20 November 2018; pp. 1476–1481. [Google Scholar]
- Rong, Y.; Huang, W.; Xu, T.; Huang, J. Dropedge: Towards deep graph convolutional networks on node classification. arXiv 2019, arXiv:1907.10903. [Google Scholar]
- Pimentel, M.A.; Clifton, D.A.; Clifton, L.; Tarassenko, L. A review of novelty detection. Signal Process. 2014, 99, 215–249. [Google Scholar] [CrossRef]
- Ma, X.; Wu, J.; Xue, S.; Yang, J.; Zhou, C.; Sheng, Q.Z. A comprehensive survey on graph anomaly detection with deep learning. IEEE Trans. Knowl. Data Eng. 2021, 35, 12012–12038. [Google Scholar] [CrossRef]
- Song, Y.; Wang, D. Learning on graphs with out-of-distribution nodes. In Proceedings of the 28th ACM SIGKDD Conference on Knowledge Discovery and Data Mining (KDD), Washington, DC, USA, 14–18 August 2022; pp. 1635–1645. [Google Scholar]
- Zhang, H.; Wu, B.; Wang, S.; Yang, X.; Xue, M.; Pan, S.; Yuan, X. Demystifying uneven vulnerability of link stealing attacks against graph neural networks. In Proceedings of the International Conference on Machine Learning (PMLR), Honolulu, HI, USA, 23–29 July 2023; pp. 41737–41752. [Google Scholar]
- Dai, E.; Zhao, T.; Zhu, H.; Xu, J.; Guo, Z.; Liu, H.; Tang, J.; Wang, S. A comprehensive survey on trustworthy graph neural networks: Privacy, robustness, fairness, and explainability. arXiv 2022, arXiv:2204.08570. [Google Scholar]
- Wu, W.; Zhang, W.; Hou, W.; Ma, X. Multi-view clustering with graph learning for scRNA-seq data. IEEE/ACM Trans. Comput. Biol. Bioinform. 2023, 20, 3535–3546. [Google Scholar] [CrossRef]
- Jia, J.; Ma, S.; Liu, Y.; Wang, L.; Deng, R.H. A Causality-Aligned Structure Rationalization Scheme Against Adversarial Biased Perturbations for Graph Neural Networks. IEEE Trans. Inf. Forensics Secur. 2023, 19, 59–73. [Google Scholar] [CrossRef]
- Ju, W.; Yi, S.; Wang, Y.; Xiao, Z.; Mao, Z.; Li, H.; Gu, Y.; Qin, Y.; Yin, N.; Wang, S.; et al. A survey of graph neural networks in real world: Imbalance, noise, privacy and ood challenges. arXiv 2024, arXiv:2403.04468. [Google Scholar]
- Zhao, X.; Chen, F.; Hu, S.; Cho, J.H. Uncertainty aware semi-supervised learning on graph data. Adv. Neural Inf. Process. Syst. 2020, 33, 12827–12836. [Google Scholar]
- Stadler, M.; Charpentier, B.; Geisler, S.; Zügner, D.; Günnemann, S. Graph posterior network: Bayesian predictive uncertainty for node classification. Adv. Neural Inf. Process. Syst. 2021, 34, 18033–18048. [Google Scholar]
- Kondor, R.I.; Lafferty, J. Diffusion kernels on graphs and other discrete structures. In Proceedings of the 19th International Conference on Machine Learning, San Francisco, CA, USA, 8–12 July 2002; Volume 2002, pp. 315–322. [Google Scholar]
- Lafon, S.; Lee, A.B. Diffusion maps and coarse-graining: A unified framework for dimensionality reduction, graph partitioning, and data set parameterization. IEEE Trans. Pattern Anal. Mach. Intell. 2006, 28, 1393–1403. [Google Scholar] [CrossRef]
- Xu, B.; Shen, H.; Cao, Q.; Cen, K.; Cheng, X. Graph convolutional networks using heat kernel for semi-supervised learning. arXiv 2020, arXiv:2007.16002. [Google Scholar]
- Ortega, A.; Frossard, P.; Kovačević, J.; Moura, J.M.; Vandergheynst, P. Graph signal processing: Overview, challenges, and applications. Proc. IEEE 2018, 106, 808–828. [Google Scholar] [CrossRef]
- Gasteiger, J.; Weißenberger, S.; Günnemann, S. Diffusion improves graph learning. Adv. Neural Inf. Process. Syst. 2019, 32. [Google Scholar] [CrossRef]
- Hamilton, W.; Ying, R.; Leskovec, J. Inductive representation learning on large graphs. Adv. Neural Inf. Process. Syst. 2017, 30, 1–11. [Google Scholar]
- Liang, S.; Li, Y.; Srikant, R. Enhancing the reliability of out-of-distribution image detection in neural networks. arXiv 2017, arXiv:1706.02690. [Google Scholar]
- Lee, K.; Lee, K.; Lee, H.; Shin, J. A simple unified framework for detecting out-of-distribution samples and adversarial attacks. Adv. Neural Inf. Process. Syst. 2018, 31. [Google Scholar] [CrossRef]
- Wang, X.; Liu, H.; Shi, C.; Yang, C. Be confident! towards trustworthy graph neural networks via confidence calibration. Adv. Neural Inf. Process. Syst. 2021, 34, 23768–23779. [Google Scholar]


Disclaimer/Publisher’s Note: The statements, opinions and data contained in all publications are solely those of the individual author(s) and contributor(s) and not of MDPI and/or the editor(s). MDPI and/or the editor(s) disclaim responsibility for any injury to people or property resulting from any ideas, methods, instructions or products referred to in the content. |
© 2024 by the authors. Licensee MDPI, Basel, Switzerland. This article is an open access article distributed under the terms and conditions of the Creative Commons Attribution (CC BY) license (https://creativecommons.org/licenses/by/4.0/).