Article

Modeling the Influence of Lockdown on Epidemic Progression and Economy

1
S.M. Nikol’skii Mathematical Institute, Peoples’ Friendship University of Russia (RUDN University), 6 Miklukho-Maklaya St., 117198 Moscow, Russia
2
Institut Camille Jordan, UMR 5208 CNRS, University of Lyon 1, 69622 Villeurbanne, France
*
Author to whom correspondence should be addressed.
Mathematics 2024, 12(19), 3106; https://doi.org/10.3390/math12193106
Submission received: 30 August 2024 / Revised: 30 September 2024 / Accepted: 2 October 2024 / Published: 4 October 2024

Abstract

:
The COVID-19 pandemic has underscored the necessity of implementing non-pharmaceutical interventions such as lockdowns to mitigate the spread of infectious diseases. This study aims to model the impact of lockdown measures on the progression of an epidemic. Using a combination of compartmental models, specifically a novel delay model, we analyze the effects of varying lockdown intensities and durations on disease transmission dynamics. The results highlight that timely and stringent lockdowns can significantly reduce the peak number of infections and delay the epidemic’s peak, thereby alleviating pressure on healthcare systems. Moreover, our models demonstrate the importance of appropriate lifting of lockdowns to prevent a resurgence of cases. Analytical and numerical results reveal critical thresholds for lockdown efficacy from the epidemiological point of view, which depend on such factors as the basic reproduction number ( 0 ), disease duration, and immunity waning. In the case of a single outbreak with permanent immunity, we analytically determine the optimal proportion of isolated people which minimizes the total number of infected. While in the case of temporary immunity, numerical simulations show that the infectious cases decrease with respect to the proportion of isolated people during lockdowns; as we increase the proportion of isolated people, we have to increase the duration of lockdowns to obtain periodic outbreaks. Further, we assess the influence of epidemic with or without lockdown on the economy and evaluate its economical efficacy by means of the level of population wealth. The percentage of productive individuals among isolated people influences the wealth state of the population during lockdowns. The latter increases with the rise of the former for fixed epidemic parameters. This research provides valuable insights for policymakers in designing effective lockdown strategies to control future epidemics.
MSC:
34K21; 92C60

1. Introduction

1.1. Epidemiological Modeling

The modeling of infectious diseases is a valuable tool that has been used to investigate the mechanisms by which diseases spread in order to predict the future course of an outbreak and evaluate epidemic control strategies. Mathematical modeling in epidemiology is motivated by periodically emerging large scale epidemics such as HIV from the 1980s to the present [1,2], SARS in 2002–2003 [3,4], H5N1 influenza in 2005 [5,6], H1N1 in 2009 [7,8], and Ebola in 2014 [9,10]. The recent COVID-19 pandemic had a strong influence on public health, economy, and many other aspects of societal life.
Inspired by the works of Kermack and McKendrick [11,12], which were motivated by the Spanish influenza epidemic of 1918–1919, many epidemic models have been introduced. These include multi-compartment models, which provide critical insights into the spread of infectious diseases and form the basis for modern epidemiological analysis. Today, their applications range from understanding historical outbreaks to predicting the behavior of current and future diseases [13,14,15,16], models with a nonlinear disease transmission rate [17,18], multi-patch models [19,20], multi-group models incorporating the effect of the heterogeneity of the population [21], and epidemic models with vaccination and other control measures [22,23]. Random movement of individuals in the population is considered in spatiotemporal models in order to describe the spatial distributions of susceptible and infected individuals [24,25]. Further detailed literature reviews can be found in monographs [26,27] and review articles [15,28].
Single and multi-strain epidemic models are formulated based on classical SIR-type models. They usually assume that the number of recoveries and deaths at a particular time t is proportional to the number of infected at the time t. However, if τ is the average disease duration, then the number of recoveries and deaths at time t should be determined by the number of infected at time t τ , which might be significantly different from the number of infected at time t, especially during rapid epidemic growth or decay. These questions are discussed in detail in our previous works [29,30,31] for single-strain epidemic models and in [32] for both single-strain and two-strain models. Models with distributed recovery and death rates have been introduced, and it has been shown that delay differential equation (DDE) models provide a good approximation of distributed recovery and death rate models [31]. A delay model with vaccination was studied in [33].
The COVID-19 pandemic has dramatically reshaped societies worldwide, leading to unprecedented public health challenges and economic disruptions. As governments sought to mitigate the spread of the virus, a range of interventions was implemented, with partial lockdowns emerging as a prevalent response. These measures, which involve the selective restriction of activities while allowing certain sectors to operate, have been pivotal in balancing the dual imperatives of public health and economic stability [34].
Research indicates that partial lockdowns have had a significant impact on epidemic progression. In [35], the authors demonstrated that such measures can effectively reduce the reproduction number of the virus, thereby slowing transmission rates. However, the implementation of these strategies is not without economic consequences. In [36], it was reported that countries enforcing strict lockdowns experienced significant declines in gross domestic product along with job losses and increased poverty levels. These findings highlight the critical need for a nuanced understanding of how partial lockdowns affect both health outcomes and economic vitality.
In [37], an economic–demographic dynamical system was presented, illustrating scenarios which can lead in the long-run to sharp population decline and/or deterioration of the economy and showing that even when the population can go extinct under certain conditions, it might still experience temporary growth.
This research article aims to investigate the intricate relationship between partial lockdowns, epidemic progression, and economic performance. By presenting an epidemic–economic model that implements these measures, we explore the short-term and long-term effects on both public health and the economy. Ultimately, this study seeks to provide insights that can inform future policy decisions, ensuring that measures taken in response to health crises are both effective in curbing disease spread and sustainable for economic recovery.
The contents of this paper are as follows. Below, we introduce an epidemic–economic model with time delays. In Section 2, we show how the epidemic part of the model can be reduced to a single integral equation. This equation helps to find analytical formulae for calculating the stationary solutions of this model. Then, we study the stability of the stationary solution. In Section 3, we study the influence of partial lockdowns on epidemic progression by considering two systems, namely, with and without immunity waning. In Section 4, we introduce the full model incorporating productive individuals and wealth; we present numerical simulations to show the influence of the parameters of our model on epidemic progression and economy. Finally, we end the work with conclusions and further perspectives.

1.2. Epidemic–Economic Delay Model

Let J ( t ) denote the number of newly infected individuals at time t and let S ( t ) , I ( t ) , and R ( t ) be the total numbers of susceptible, infected, and recovered individuals, respectively, at time t. We assume that the disease-related death is negligible and do not consider this compartment in the model. The number of new infections at time t is provided by the formula
J ( t ) = β N S ( t ) I ( t ) ,
where β is the disease transmission rate, N is the total population size, which we assume to be constant, and
S ( t ) + I ( t ) + R ( t ) = N , t 0 .
Let τ 1 represent the infection period and let τ 2 be the immunity period after recovery; this means that individuals infected at time t τ 1 will recover at time t, while those infected at time t τ 1 τ 2 will become susceptible again at time t.
All individuals infected during time interval ( t τ 1 τ 2 , t ] can either be infected or recovered at time t, but cannot be susceptible; hence,
I ( t ) + R ( t ) = t τ 1 τ 2 t J ( η ) d η .
Differentiating Equation (2) and using the relation (1), we obtain
d S ( t ) d t = J ( t ) + J ( t τ 1 τ 2 ) .
Since J ( t ) is the number of newly infected individuals at time t, the number of new recovered individuals at time t is determined by J ( t τ 1 ) . Hence, the governing equations for the infected compartment in terms of the daily number of newly infected individuals is provided by
d I ( t ) d t = J ( t ) J ( t τ 1 ) .
The equation for the recovered compartment is as follows:
d R ( t ) d t = J ( t τ 1 ) J ( t τ 1 τ 2 ) .
As we aim to study the impact of the epidemic on the economy, we introduce an additional class of productive individuals who are people contributing to the wealth production, denoted as P ( t ) , and the corresponding time delay τ 3 signifying the convalescence period after which a person returns to professional activity. Notice that individuals infected at time t τ 1 will recover at time t; however, their ability to work might not be immediate due to lingering symptoms. We obtain the following equation for productive individuals:
d P ( t ) d t = J ( t ) + J ( t τ 1 τ 3 ) .
According to the assumptions of the model, all recovered individuals become susceptible after the end of acquired immunity. At the same time, recovered individuals can be in the period of convalescence, after which they become productive (Figure 1). Moreover, productive individuals P do not change the number of S , I , R ; for example, R can be productive or not, but this does not change the number of recovered. Thus, S + I + R = N , while being productive or not, is an independent characterization of the population.
The economic part of our model is represented by the following equation for wealth W ( t ) :
d W ( t ) d t = U ( t ) C ( t ) ,
where U ( t ) and C ( t ) respectively correspond to the wealth produced and consumed by the population:
U ( t ) = a 1 W ( t ) W ( t ) + a 2 P ( t ) P ( t ) + a 3 ,
C ( t ) = a 4 W ( t ) + ( a 5 + a 6 W ( t ) N ) N .
Here, a 1 characterizes the rate of wealth production for large W, parameters a 2 , a 3 determine the wealth production rate for small W and P, parameter a 4 is related to the amortization rate and wealth depletion independent of the population size, and the expression a 5 + a 6 W N represents the level of individual consumption, with the first term characterizing some basic level of consumption independent of wealth and the second term describes wealth-dependent consumption. These production and consumption functions are inspired by the economic–demographic model proposed in [37].
The complete system of delay differential equations (DDE) for the epidemic–economic model becomes
d S ( t ) d t = J ( t ) + J ( t τ 1 τ 2 ) ,
d I ( t ) d t = J ( t ) J ( t τ 1 ) ,
d R ( t ) d t = J ( t τ 1 ) J ( t τ 1 τ 2 ) ,
d P ( t ) d t = J ( t ) + J ( t τ 1 τ 3 ) ,
d W ( t ) d t = U ( t ) C ( t ) ,
J ( t ) = β N S ( t ) I ( t ) .
We assume here that τ 3 < τ 2 . This condition indicates that the convalescence period is shorter than the duration of immunity, which is usually satisfied for respiratory viral infections. From a modeling perspective, this means that everyone is considered to be productive after the convalescence period. Otherwise, people can be infected again during the convalescence period, and the model should be modified to take this condition into account. System (5) is considered with the following initial conditions:
S ( θ ) = N , I ( θ ) = 0 , W ( θ ) > 0 : θ [ ( τ 1 + τ 2 + τ 3 ) , 0 ) ,
S ( 0 ) = P ( 0 ) = S 0 > 0 , I ( 0 ) = I 0 > 0 , R ( 0 ) = 0 , W ( 0 ) > 0 , ( S 0 + I 0 = N ) .

2. Existence and Stability of Stationary Solutions

2.1. Reduction to an Integral Equation

We can integrate Equation (5a) from 0 to t:
S ( t ) S 0 = 0 t J ( s ) d s + 0 t J ( s τ 1 τ 2 ) d s =
0 t J ( s ) d s + 0 t τ 1 τ 2 J ( s ) d s = t τ 1 τ 2 t J ( s ) d s .
Here, we take into account that J ( t ) = 0 for t < 0 ; similarly, from Equation (5b) we obtain
I ( t ) = I 0 + t τ 1 t J ( s ) d s .
Next, we express S ( t ) and I ( t ) from the last two equalities and take their product:
J ( t ) = β N S 0 t τ 1 τ 2 t J ( s ) d s I 0 + t τ 1 t J ( s ) d s .
Thus, we have reduced the epidemic part of System (5), namely, classes S , I , R , to a single integral equation.

2.2. Stationary Solutions

Stationary solutions of Equation (7) can be found from the following algebraic equation:
J s = β N S 0 ( τ 1 + τ 2 ) J s I 0 + τ 1 J s .
The positive solution of this equation is provided by the formula
J s = ( N β + ( τ 1 + τ 2 ) I 0 τ 1 S 0 ) + Δ 1 2 τ 1 ( τ 1 + τ 2 ) ,
where
Δ 1 = ( N β + ( τ 1 + τ 2 ) I 0 τ 1 S 0 ) 2 + 4 S 0 I 0 τ 1 ( τ 1 + τ 2 ) .
If I 0 0 and S 0 N , then we find two approximate solutions of the previous equation:
J s = 0 , J s = N ( β τ 1 1 ) β τ 1 ( τ 1 + τ 2 ) .
In this case, a positive stationary solution exists if the basic reproduction number 0 = β τ 1 is larger than 1, allowing us to determine the stationary values of susceptible, infected, recovered, and productive individuals as follows:
S s = N β τ 1 , I s = N ( β τ 1 1 ) β ( τ 1 + τ 2 ) , R s = N S s I s , P s = N τ 2 τ 3 τ 1 + τ 2 + 1 β ( τ 1 + τ 2 ) + τ 3 β τ 1 ( τ 1 + τ 2 ) .
We can notice that S s is a decreasing function of disease transmission rate β and disease duration τ 1 , while it is independent of the immunity duration τ 2 . Additionally, if 0 = β τ 1 > 1 , then I s decreases as a function of immunity duration τ 2 , while R s increases. Furthermore, P s increases as a function of immunity duration τ 2 and decreases as a function of the convalescence period τ 3 .
The stationary solution W s of the wealth function can be determined from the equation
a W s 2 + b W s + c = 0 ,
where
a = a 4 + a 6 , b = a 2 ( a 4 + a 6 ) + a 5 N a 1 P s P s + a 3 , c = a 2 a 5 N ,
which has the discriminant Δ 2 = a 2 ( a 4 + a 6 ) + a 5 N a 1 P s P s + a 3 2 4 a 2 a 5 ( a 4 + a 6 ) N . We obtain the following two solutions:
W s 1 = a 1 P s P s + a 3 a 2 ( a 4 + a 6 ) a 5 N Δ 2 2 ( a 4 + a 6 ) ,
W s 2 = a 1 P s P s + a 3 a 2 ( a 4 + a 6 ) a 5 N + Δ 2 2 ( a 4 + a 6 ) .
We can suppose that Δ 2 0 ; if this is not the case, then there are no stationary solutions for wealth. We discuss this case below. If b > 0 , then both solutions are positive, while if b < 0 then both solutions are negative. A positive stationary solution for wealth suggests that the economy has reached a state where wealth production and consumption balance each other and the wealth of the population is sustained at a positive level. A negative stationary solution could represent a scenario in which the economy is operating at a deficit, potentially leading to insolvency or default. This could also model a situation where the economy is trapped in a cycle of debt. For instance, low productivity might result in insufficient production which cannot meet the population’s consumption needs.
We conclude that System (5) has stationary solutions under conditions 0 > 1 , Δ 2 0 . These stationary solutions are provided as follows:
  • E 1 = ( N , 0 , 0 , N , W s 1 ) , E 2 = ( N , 0 , 0 , N , W s 2 ) . Here J s = 0 .
  • E 3 = ( S s , I s , R s , P s , W s 1 ) , E 4 = ( S s , I s , R s , P s , W s 2 ) . Here J s = N ( β τ 1 1 ) β τ 1 ( τ 1 + τ 2 ) .

2.3. Stability of the Stationary Solution

System (5) can be reduced to Equations (5d), (5e), and (7). We recall that Equation (5e) can be expressed as follows:
d W ( t ) d t = F W ( t ) , P ( t ) ,
where
F W ( t ) , P ( t ) = a 1 W ( t ) W ( t ) + a 2 P ( t ) P ( t ) + a 3 a 4 W ( t ) ( a 5 + a 6 W ( t ) N ) N .
We linearize the system of Equations (5d), (7), and (11) about the stationary solution ( J s , P s , W s ) by setting
J ( t ) = J s + ϵ 1 e λ t , P ( t ) = P s + ϵ 2 e λ t , W ( t ) = W s + ϵ 3 e λ t .
Substituting Equation (13) into (5d), (7), and (11) and keeping the first-order terms with respect to ϵ j , where j { 1 , 2 , 3 } , we obtain the following algebraic system of equations:
a 11 ϵ 1 + a 12 ϵ 2 + a 13 ϵ 3 = 0 ,
a 21 ϵ 1 + a 22 ϵ 2 + a 23 ϵ 3 = 0 ,
a 31 ϵ 1 + a 32 ϵ 2 + a 33 ϵ 3 = 0 ,
where
a 11 ( λ ) = λ N β + ( I 0 + τ 1 J s ) ( 1 e ( τ 1 + τ 2 ) λ ) ( S 0 ( τ 1 + τ 2 ) J s ) ( 1 e τ 1 λ ) , a 12 = 0 , a 13 = 0 ,
a 21 ( λ ) = 1 e ( τ 1 + τ 2 ) λ , a 22 ( λ ) = λ , a 23 = 0 ,
a 31 = 0 , a 32 = a 1 a 3 W s ( W s + a 2 ) ( P s + a 3 ) 2 , a 33 ( λ ) = a 1 a 2 P s ( W s + a 2 ) 2 ( P s + a 3 ) ( a 4 + a 6 ) λ .
Setting the determinant of Systems (14)–(16) as zero, we obtain
a 11 ( λ ) a 22 ( λ ) a 33 ( λ ) = 0 .
We analyze the existence of eigenvalues λ with positive real parts, providing instability of the stationary solution. If a 22 ( λ ) = 0 , then λ = 0 . If a 11 ( λ ) = 0 , then we obtain
λ = α 1 ( 1 e ( τ 1 + τ 2 ) λ ) + α 2 ( 1 e τ 1 λ ) ,
where
α 1 = β 2 N ( τ 1 + τ 2 ) I 0 N β + ( τ 1 + τ 2 ) I 0 τ 1 S 0 + Δ 1 ,
α 2 = β 2 N τ 1 S 0 + N β + ( τ 1 + τ 2 ) I 0 τ 1 S 0 Δ 1 .
Under the approximations S 0 = N and I 0 = 0 , we obtain
α 1 = β τ 1 1 τ 1 + τ 2 , α 2 = 1 τ 1 .
Finally, if a 33 ( λ ) = 0 , then
λ = a 1 a 2 P s ( W s + a 2 ) 2 ( P s + a 3 ) ( a 4 + a 6 ) .
The properties of Equation (18) are formulated in the following theorem. In order to simplify this analysis, we set I 0 = 0 , S 0 = N in the coefficients of the equation.
Theorem 1.
Suppose that I 0 = 0 , S 0 = N ; then the following properties hold:
  • If 0 > 1 and J s > 0 , then Equation (18) does not have nontrivial positive real solutions.
  • If 0 > 1 and J s = 0 , then Equation (18) has exactly one positive real solution. If 0 < 1 , then this equation has only negative real solutions.
  • There exists some value c > 1 for which Equation (18) has a pure imaginary solution.
Proof. 
The theorem was proved in [33]. □
To summarize the results of this section, we conclude that the stationary solution J s = 0 loses its stability for 0 > 1 and another stationary solution J s > 0 appears. Next, there exists a critical value 0 = c > 1 for which the oscillatory instability of the positive stationary solution occurs. On the other hand, the positive real solution of Equation (21) determines the loss of stability of the stationary solution for the economic part of System (5).

3. Influence of Isolation on Epidemic Progression

Isolation of a part of the population can influence epidemic progression and decrease the number of infected individuals. We begin our analysis of the influence of isolation and determine the optimal proportion of isolated people using a scenario without immunity waning. Next, we study a scenario with both immunity waning and periodic outbreaks.

3.1. Without Immunity Waning (Single Outbreak)

In this section, we model partial lockdown in which a part of the population is isolated and cannot be infected. Isolation begins before epidemic outbreak and stops after the outbreak is over. We first determine the optimal proportion of isolated people which minimizes the number of infected individuals.
We impose a partial lockdown at time t 1 with duration T 1 and a proportion of isolated population k 1 ( 0 , 1 ) out of the total population N 0 . We consider the following system of equations:
d S ( t ) d t = J ( t ) ,
d I ( t ) d t = J ( t ) J ( t τ 1 ) ,
d R ( t ) d t = J ( t τ 1 ) ,
J ( t ) = β N ( t ) S ( t ) I ( t ) .
Equation (22c) differs from Equation (5c) because we assume that recovered individuals obtain permanent immunity against the disease and do not become susceptible anymore. System (22) is considered with the initial conditions
S ( θ ) = N 0 , I ( θ ) = 0 : θ [ τ 1 , 0 ) ,
S ( 0 ) = S 0 > 0 , I ( 0 ) = I 0 > 0 , R ( 0 ) = 0 ,
where S 0 + I 0 = N 0 . In the beginning of isolation at t = t 1 , a part of the total population and the same part of the susceptible population are removed, then returned at time t = t 1 + T 1 , as follows:
N ( t 1 ) = ( 1 k 1 ) N 0 , S ( t 1 ) = S ( t 1 ) k 1 N 0 , 0 < k 1 < 1 ,
N ( t 1 + T 1 ) = N 0 , S ( t 1 + T 1 ) = S ( t 1 + T 1 ) + k 1 N 0 .
Analytical estimate. Next, we determine the value of k 1 which provides the minimal total number of infected individuals. First of all, we find the number of susceptible individuals S f at the end of the outbreak, taking into account that a part of the population is isolated. We have the following equation with respect to ω = S f / ( ( 1 k 1 ) N 0 ) :
ln ω = 0 ( ω 1 )
which was derived in [31] for k 1 = 0 . Here, 0 = β τ 1 is the basic reproduction number. Equation (25) has a solution ω ( 0 , 1 ) if 0 > 1 . When the lockdown is finished and isolated people return, the total number of susceptible individuals becomes S f + k 1 N 0 and the new value of the basic reproduction number is
0 = β τ 1 S f + k 1 N 0 N 0 = 0 ( ( 1 k 1 ) ω + k 1 ) .
We can find k 1 from the condition 0 = 1 , which means that the epidemic does not restart after the end of isolation:
k 1 = 1 / 0 ω 1 ω .
The total number of infected individuals is provided by the formula
I t o t a l = ( 1 k 1 ) N 0 S f = ( 1 k 1 ) N 0 ( 1 ω ) .
For example, if 0 = 3 , then from Equation (25) we obtain ω 0.06 and from Equations (26) and (27) we have k 1 0.29 and I t o t a l / N 0.67 , respectively; on the other hand, without lockdown ( k 1 = 0 ) we obtain I t o t a l / N 0.94 . Thus, isolation reduces the proportion of infected individuals by about 30 % .
We note that for 0 sufficiently large, we can use the approximation ω 1 , and k 1 1 / 0 . This simple formula gives a good approximation already for 0 = 3 .
Numerical simulations. Examples of numerical simulations of System (22) are shown in Figure 2. In the case without isolated population (panel a), the usual dynamics of epidemic outbreak are observed, with decreasing number of susceptible people and increasing number of recovered. Next, we consider the case in which some part of the population is isolated during the outbreak and returned back when it is finished. If the proportion of isolated people does not exceed some critical value, then the new basic reproduction number 0 is less than 1 and the epidemic does not restart (panel b). However, if the proportion of isolated people is sufficiently large and 0 > 1 , then there is a second outbreak (panel c) and the total number of infected people increases.
We determined the total number of infected individuals in direct numerical solutions of Equations (22) and (23). From Figure 3 (left panel), it can be concluded that the total number of infected individuals in the model without immunity waning has a local minimum with respect to the proportion of isolated population. For instance, if τ 1 = 10 , then 0 = 3 , and the minimum optimal solution is represented by the pair ( k 1 , I t o t a l / N 0 ) = ( 0.294 , 0.673 ) (see Figure 2b), which corresponds to the analytical values obtained above. However, if the proportion of isolated people is 0.6 (as in Figure 2c), then the first outbreak is small, but there is another outbreak after the end of isolation which results in a larger number of total infected ( I t o t a l / N 0 0.85 ). For τ 1 = 15 ( 0 = 4.5 ) , the minimum optimal solution is represented by the pair ( k 1 , I t o t a l / N 0 ) = ( 0.217 , 0.780 ) . Analytical approximation k 1 1 / 0 0.222 , I t o t a l / N 0 0.778 provides close results.

3.2. Model with Immunity Waning (Periodic Outbreaks)

In this case, we assume that recovered individuals obtain temporary immunity against the disease. We impose consecutive lockdowns before each epidemic outbreak. The lockdowns are characterized by the moment t j when they begin, their duration T j , and the proportion k j ( 0 , 1 ) of isolated population. Hence, we have the following DDE system:
d S ( t ) d t = J ( t ) + J ( t τ 1 τ 2 ) ,
d I ( t ) d t = J ( t ) J ( t τ 1 ) ,
d R ( t ) d t = J ( t τ 1 ) J ( t τ 1 τ 2 ) ,
J ( t ) = β N ( t ) S ( t ) I ( t ) ,
with additional conditions
N ( t j ) = ( 1 k j ) N 0 , S ( t j ) = S ( t j ) k j N 0 ,
N ( t j + T j ) = N 0 , S ( t j + T j ) = S ( t j + T j ) + k j N 0 ,
where 0 < k j < 1 , j = 1 , 2 , . . . , m , and m N . Moreover, t j should be chosen before the start of the outbreak. Here, we set t 1 = 0 . The lockdown duration T j is such that it continues until the outbreak is finished.
Figure 3. (left): dependence of the total number of infected individuals I t o t a l on the proportion of isolated population k 1 in Model (22) without immunity waning. The parameter values are N 0 = 10 6 , β = 0.3 , t 1 = 0 , T 1 = 120 , I ( 0 ) = 1 . (right): Dependence of the annual average number of infected individuals I a v r = 1 n τ 1 0 365 n I ( χ ) d χ on the proportion of isolated people in Model (28) with immunity waning and periodic outbreaks. The parameter values are N 0 = 10 6 , β = 0.3 , τ 2 = 180 , I ( 0 ) = 1 .
Mathematics 12 03106 g003
System (28) is considered with the following initial conditions:
S ( θ ) = N 0 , I ( θ ) = 0 , : θ [ ( τ 1 + τ 2 ) , 0 ) ,
S ( 0 ) = S 0 > 0 , I ( 0 ) = I 0 > 0 , R ( 0 ) = 0 ,
where S 0 + I 0 = N 0 . Finally, we have
S ( t ) + I ( t ) + R ( t ) = N ( t ) , t 0 .
Examples of numerical simulations of the model with consecutive epidemic outbreaks and lockdowns are shown in Figure 4. Part of the population is isolated before the corresponding outbreak and returns when it is over. In the two simulations presented in the figure, we consider different proportions of isolated population for the same parameter values. The beginning and duration of the lockdowns are adapted accordingly to avoid the emergence of intermediate outbreaks.
The right panel of Figure 3 indicates that the annual average number of infected individuals for the model with immunity waning is a decreasing function with respect to the proportion of isolated people during lockdowns, and does not have a local minimum as in the model with permanent immunity. It is important to mention that as we increase the proportion of isolated people in Model (28), we have to increase the duration of lockdowns to obtain periodic outbreaks (Figure 4).

4. Full Model with Productive Individuals and Wealth

We now proceed to the analysis of the complete Models (5) and (6) with productive individuals and wealth. In the case of lockdowns, this model is completed by the following conditions:
N ( t j ) = ( 1 k j ) N 0 , S ( t j ) = S ( t j ) k j N 0 , P ( t j ) = P ( t j ) α j k j N 0 ,
N ( t j + T j ) = N 0 , S ( t j + T j ) = S ( t j + T j ) + k j N 0 , P ( t j + T j ) = P ( t j + T j ) + α j k j N 0 ,
which respectively determine the beginning of lockdown, its duration, and the proportion of isolated population. Here, 0 < k j < 1 , 0 α j 1 , j = 1 , 2 , . . . , m , and m N . Since isolated people can have different level of productivity, we introduce the coefficient α j for the proportion of isolated individuals who become unproductive during lockdown.

4.1. Influence of Epidemic on Economy without Lockdown

If the basic reproduction number is smaller than the critical value for which the oscillatory instability of the positive stationary solution occurs, i.e., 1 < 0 < c , then the number of infected individuals converges to some constant value and the value of wealth converges to another constant value (Figure 5). On the other hand, if the basic reproduction number exceeds the critical value c < 0 , then I ( t ) oscillates, leading to oscillation of wealth (Figure 6).
The epidemic can destabilize the economy. Recall that the stationary solution for wealth is determined using
a 1 W W + a 2 P s P s + a 3 = a 4 W + ( a 5 + a 6 W N ) N ,
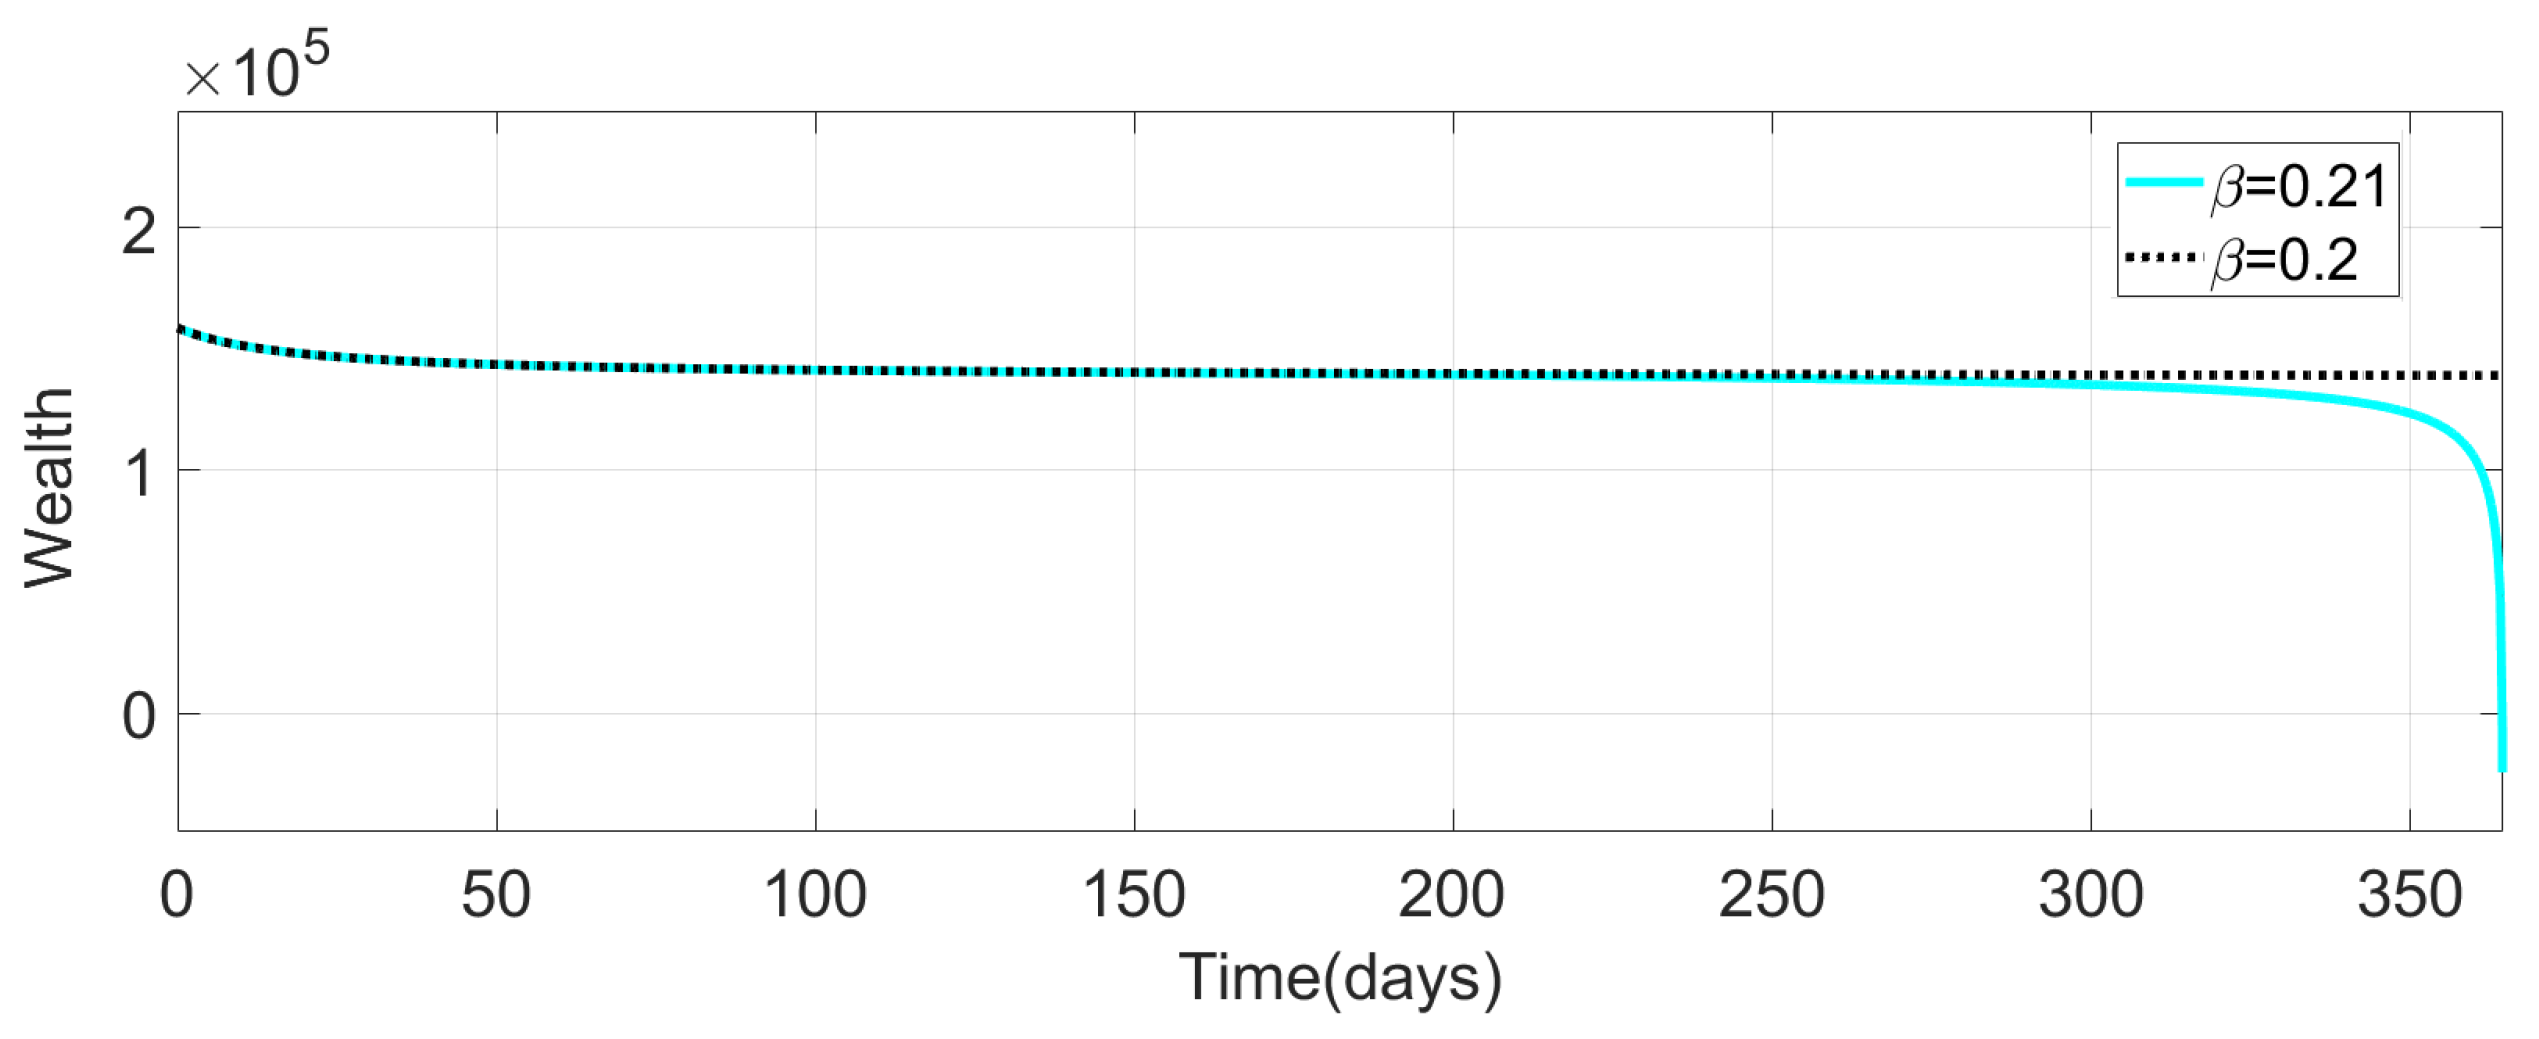
(see Equations (3) and (4)), where P s is the stationary value of the productive population, which is independent of wealth but depends on the number of infected and susceptible individuals. In the case without epidemic, where P s = N , Equation (33) can have two solutions, one of which is stable and determines the wealth of the population. In the case of weak infection such that the endemic solution is stable, the stationary solution for the productive population P s remains stable but decreases. If its value becomes sufficiently small, then Equation (33) does not have stationary solutions. The solution of Equation (5e) with any positive initial condition decreases and becomes negative. Negative wealth corresponds to an indebted economy; however, as the model considered here is not adapted to consider negative wealth, we stopped further simulations at this point (Figure 7). It is interesting to note that the level of wealth remains almost constant over a long time period before transitioning to abrupt decrease. Thus, epidemics can destabilize the economy, leading to the loss of positive wealth equilibrium. We illustrate this effect in the case of a weak epidemic without oscillations, although strong epidemic with oscillations can also cause wealth to decrease to negative values.

4.2. Influence of Lockdowns

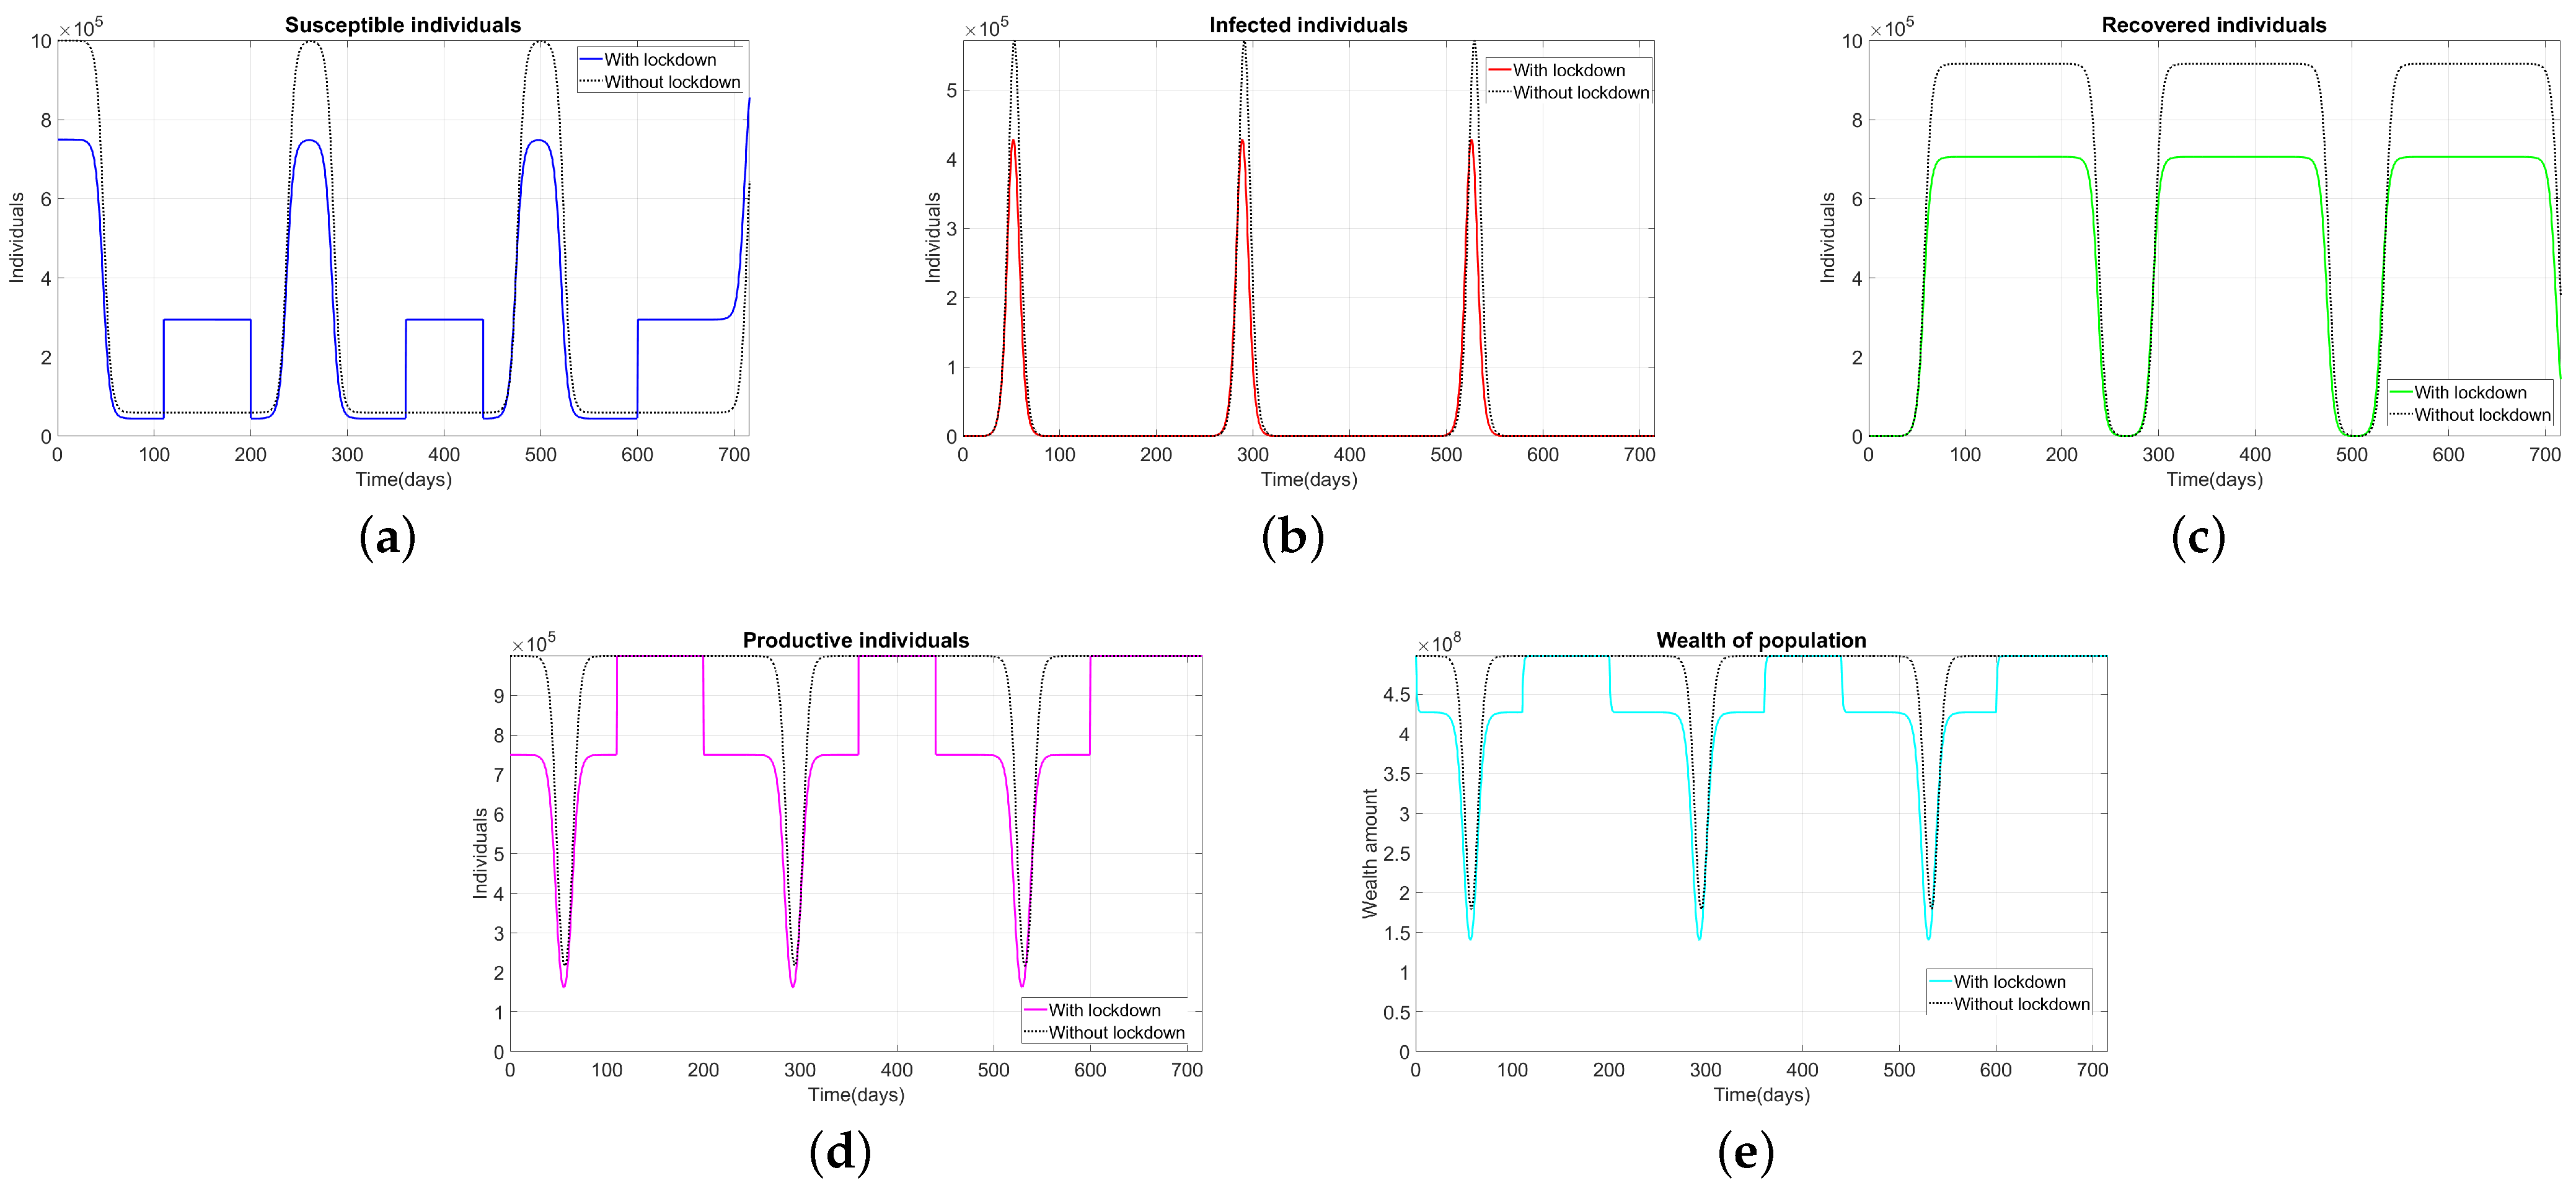
Next, we study the influence of lockdowns on the productive population and wealth. Figure 8 displays a comparison between System (5) with and without isolation. From this comparison, it can be concluded that isolation reduces the number of infected (Figure 8b). However, because the isolated population considered in this simulation does not contribute to wealth production ( α = 1 ), the number of productive individuals decreases during lockdown, leading to a decrease in the population’s wealth (Figure 8d,e).
Figure 7. Evolution of wealth in numerical simulations of Model (5) for initial conditions N = 10 6 , S ( 0 ) = N I ( 0 ) = P ( 0 ) , I ( 0 ) = 1 , R ( 0 ) = 0 , W ( 0 ) = 1.58 · 10 5 , time delays τ 1 = 5 , τ 2 = 180 , τ 3 = 7 , and other parameters a 1 = 10 6 , a 2 = 10 4 , a 3 = 10 4 , a 4 = 0.3 , a 5 = 0.8611 , a 6 = 0.15 . Wealth converges to a positive value for β = 0.2 ( 0 = 1 ) (black curve) or abruptly drops to negative values for β = 0.21 ( 0 = 1.05 ) (cyan curve).
Mathematics 12 03106 g007
The left panel in Figure 9 (magenta curve) confirms the previous result, with the annual average wealth as a decreasing function of the proportion of unproductive isolated individuals. However, if all the isolated people are productive, then the population wealth increases as the proportion of isolated people grows larger (cyan curve). If half of the isolated people are productive, then the annual average wealth is again a decreasing function with respect to the proportion of isolated individuals (blue curve), but this decrease is weaker than in the case where all isolated people are unproductive. With 78 % of individuals among the isolated population being productive ( α = 0.22 ), the wealth remains approximately constant (green curve).
The right panel of Figure 9 shows that the annual average number of wealth is an increasing function of immunity duration τ 2 . Moreover, as we increase the proportion of productivity among isolated people, the population’s wealth increases. From Figure 10, we can observe that if we increase the transmission rate and the disease duration, and consequently the basic reproduction number 0 , then the amount of wealth becomes smaller. Furthermore, as the percentage of productive individuals among the isolated people increases, the amount of wealth increases as well.

5. Discussion

In this work, we propose an epidemiological–economic model that incorporates a system of delay differential equations featuring three time delays. These delays correspond to the duration of the disease, the period of natural immunity, and the convalescence period. Our approach builds upon and combines insights from previous studies [33,37].
The reduction of the delay model (epidemic part) to an integral equation allows us to study stationary solutions of this model and their stability. A positive stationary solution appears for a basic reproduction number larger than 1. This solution loses its stability and leads to periodic oscillations if the basic reproduction number exceeds some critical value. We determine this critical value and the period of emerging oscillations. In addition, we determine the stationary solutions of the economic part of our model and study their stability.
Isolation affects the epidemic and economic dynamics, reduces the severity of the disease outbreak, and changes the population’s wealth. One of the main results of this work is the determination of the optimal proportion of isolated people. In the case of a single outbreak without immunity waning, this optimal choice represents the maximal proportion of isolated individuals for which the epidemic does not restart when the isolation period finishes. This condition allows us to determine this optimal proportion analytically. For example, if the basic reproduction number equals 3, then the optimal isolation proportion is 29 % of the total population, which reduces the total number of infected people by about 30 % . Hence, isolation can decrease the burden on both the public health system and the economy. However, if the proportion of isolated people is larger than the optimal value, then a secondary epidemic outbreak occurs after the end of lockdown. If this scenario is not anticipated, it can lead to a large number of infections and deaths, as was the case for COVID-19 in China (https://en.wikipedia.org/wiki/COVID-19_pandemic_in_mainland_China, accessed on 1 October 2024).
The influence of lockdown is different in the scenario with immunity waning and periodic outbreaks. Since lockdowns are repeated before each outbreak, it is possible to avoid secondary outbreaks even for a large proportion of isolated people; the duration of lockdown depends on this proportion and on the basic reproduction number.
Thus, while lockdowns can be beneficial in both scenarios, their duration and the proportion of isolated people should be adapted to each particular epidemic, otherwise the results can be unsatisfactory for public health and the economy.
We also study the influence of epidemics on the economy in the absence and presence of isolation. Increasing the basic reproduction number leads to increased disease severity and reduces the number of productive individuals, which in turn causes the deterioration of wealth. While imposing partial lockdowns reduces the epidemic, the resulting influence on the economy depends on the amount of productivity among the isolated population. If all isolated people are productive, then wealth increases; however, as the percentage of productivity among the isolated population is reduced, the wealth of the population deteriorates. In the numerical example considered in Figure 9, the level of wealth remains approximately constant if 78 % of isolated people are productive. This is an important parameter characterizing the economic efficacy of lockdowns. However, we have not obtained an analytical formula for this critical value, and it should be calculated numerically for each particular case.
Moreover, we show that epidemics can lead to the disappearance of a positive wealth equilibrium, with an abrupt transition to negative values of wealth. This happens due to the decrease in the proportion of productive individuals in the population. It is known from history that some epidemics have had important economic and social consequences due to the dramatic reduction in the productive population (https://en.wikipedia.org/wiki/Black_Death_in_England, accessed on 1 October 2024). Though we do not consider epidemic-induced deaths in this work, the action of epidemics on the economy through the productive population remains similar. These findings directly address the research aim presented in the introduction by providing a comprehensive analysis of the interplay between epidemiological dynamics and economic factors. Specifically, this study offers actionable insights into how policymakers can design more effective lockdown strategies that balance public health needs with economic sustainability. Future research should focus on refining these models by incorporating additional real-world data and extending the analysis to include vaccination and long-term immunity effects.
This study has some limitations. First, discrete delays prescribe single values of the disease duration and immunity waning instead of distributions. However, we have shown in previous works that such epidemic delay models provide a good approximation for models with distributed delays [31]. Furthermore, we did not consider exposed compartments, which may have some influence on the economic state of the population. These questions and some others represent interesting open questions for forthcoming works. These modeling approaches can be used for data analyses from different countries and for different epidemics and their influence on population wealth.

Author Contributions

Conceptualization, V.V.; methodology, V.V. and A.M.; software, I.P. and M.S.; investigation, I.P. and M.S.; writing—original draft preparation, M.S.; writing—review and editing, A.M., I.P., M.S. and V.V.; All authors have read and agreed to the published version of the manuscript.

Funding

This work was supported by the Ministry of Science and Higher Education of the Russian Federation (megagrant agreement No. 075-15-2022-1115).

Data Availability Statement

Publicly available datasets were analyzed in this study, the corresponding references are given in the text.

Conflicts of Interest

The authors declare no conflict of interest.

References

  1. Fisher-Hoch, S.; Hutwagner, L. Opportunistic candidiasis: An epidemic of the 1980s. Clin. Infect. Dis. 1995, 21, 897–904. [Google Scholar] [CrossRef] [PubMed]
  2. Chintu, C.; Athale, U.H.; Patil, P. Childhood cancers in Zambia before and after the HIV epidemic. Arch. Dis. Child. 1995, 73, 100–105. [Google Scholar] [CrossRef]
  3. Anderson, R.M.; Fraser, C.; Ghani, A.C.; Donnelly, C.A.; Riley, S.; Ferguson, N.M.; Leung, G.M.; Lam, T.H.; Hedley, A.J. Epidemiology, transmission dynamics and control of SARS: The 2002–2003 epidemic. Philos. Trans. R. Soc. London Ser. B Biol. Sci. 2004, 359, 1091–1105. [Google Scholar] [CrossRef]
  4. Lam, W.; Zhong, N.; Tan, W. Overview on SARS in Asia and the world. Respirology 2003, 8, S2–S5. [Google Scholar] [CrossRef] [PubMed]
  5. Chen, S.H.; Mallamace, F.; Mou, C.Y.; Broccio, M.; Corsaro, C.; Faraone, A.; Liu, L. The violation of the Stokes–Einstein relation in supercooled water. Proc. Natl. Acad. Sci. USA 2006, 103, 12974–12978. [Google Scholar] [CrossRef]
  6. Kilpatrick, A.M.; Chmura, A.A.; Gibbons, D.W.; Fleischer, R.C.; Marra, P.P.; Daszak, P. Predicting the global spread of H5N1 avian influenza. Proc. Natl. Acad. Sci. USA 2006, 103, 19368–19373. [Google Scholar] [CrossRef]
  7. Jain, S.; Kamimoto, L.; Bramley, A.M.; Schmitz, A.M.; Benoit, S.R.; Louie, J.; Sugerman, D.E.; Druckenmiller, J.K.; Ritger, K.A.; Chugh, R.; et al. Hospitalized patients with 2009 H1N1 influenza in the United States, April–June 2009. N. Engl. J. Med. 2009, 361, 1935–1944. [Google Scholar] [CrossRef] [PubMed]
  8. Girard, M.P.; Tam, J.S.; Assossou, O.M.; Kieny, M.P. The 2009 A (H1N1) influenza virus pandemic: A review. Vaccine 2010, 28, 4895–4902. [Google Scholar] [CrossRef]
  9. Briand, S.; Bertherat, E.; Cox, P.; Formenty, P.; Kieny, M.P.; Myhre, J.K.; Roth, C.; Shindo, N.; Dye, C. The international Ebola emergency. N. Engl. J. Med. 2014, 371, 1180–1183. [Google Scholar] [CrossRef]
  10. Kreuels, B.; Wichmann, D.; Emmerich, P.; Schmidt-Chanasit, J.; de Heer, G.; Kluge, S.; Sow, A.; Renné, T.; Günther, S.; Lohse, A.W.; et al. A case of severe Ebola virus infection complicated by gram-negative septicemia. N. Engl. J. Med. 2014, 371, 2394–2401. [Google Scholar] [CrossRef]
  11. Kapralov, M.; Khanna, S.; Sudan, M. Approximating matching size from random streams. In Proceedings of the 25th Annual ACM-SIAM Symposium on Discrete Algorithms, Portland, OR, USA, 5–7 January 2014; pp. 734–751. [Google Scholar]
  12. Almeida, R.; Qureshi, S. A fractional measles model having monotonic real statistical data for constant transmission rate of the disease. Fractal Fract. 2019, 3, 53. [Google Scholar] [CrossRef]
  13. Sharma, S.; Volpert, V.; Banerjee, M. Extended SEIQR type model for COVID-19 epidemic and data analysis. MedRxiv 2020. [Google Scholar] [CrossRef]
  14. Brauer, F.; Van den Driessche, P.; Wu, J.; Allen, L.J. Mathematical Epidemiology; Springer: Berlin/Heidelberg, Germany, 2008; Volume 1945. [Google Scholar]
  15. Hethcote, H.W. The mathematics of infectious diseases. SIAM Rev. 2000, 42, 599–653. [Google Scholar] [CrossRef]
  16. Keeling, M.J.; Rohani, P. Modeling Infectious Diseases in Humans and Animals; Princeton University Press: Princeton, NJ, USA, 2011. [Google Scholar]
  17. D’Onofrio, A.; Banerjee, M.; Manfredi, P. Spatial behavioural responses to the spread of an infectious disease can suppress Turing and Turing–Hopf patterning of the disease. Phys. A Stat. Mech. Appl. 2020, 545, 123773. [Google Scholar] [CrossRef]
  18. Sun, G.Q.; Jin, Z.; Liu, Q.X.; Li, L. Chaos induced by breakup of waves in a spatial epidemic model with nonlinear incidence rate. J. Stat. Mech. Theory Exp. 2008, 2008, P08011. [Google Scholar] [CrossRef]
  19. Bichara, D.; Iggidr, A. Multi-patch and multi-group epidemic models: A new framework. J. Math. Biol. 2018, 77, 107–134. [Google Scholar] [CrossRef] [PubMed]
  20. McCormack, R.K.; Allen, L.J. Multi-patch deterministic and stochastic models for wildlife diseases. J. Biol. Dyn. 2007, 1, 63–85. [Google Scholar] [CrossRef]
  21. Elbasha, E.H.; Gumel, A.B. Vaccination and herd immunity thresholds in heterogeneous populations. J. Math. Biol. 2021, 83, 73. [Google Scholar] [CrossRef]
  22. Aniţa, S.; Banerjee, M.; Ghosh, S.; Volpert, V. Vaccination in a two-group epidemic model. Appl. Math. Lett. 2021, 119, 107197. [Google Scholar] [CrossRef]
  23. Faniran, T.S.; Ali, A.; Al-Hazmi, N.E.; Asamoah, J.K.K.; Nofal, T.A.; Adewole, M.O. New variant of SARS-CoV-2 dynamics with imperfect vaccine. Complexity 2022, 2022, 1062180. [Google Scholar] [CrossRef]
  24. Ahmed, N.; Wei, Z.; Baleanu, D.; Rafiq, M.; Rehman, M. Spatio-temporal numerical modeling of reaction-diffusion measles epidemic system. Chaos Interdiscip. J. Nonlinear Sci. 2019, 29, 103101. [Google Scholar] [CrossRef] [PubMed]
  25. Filipe, J.; Maule, M. Effects of dispersal mechanisms on spatio-temporal development of epidemics. J. Theor. Biol. 2004, 226, 125–141. [Google Scholar] [CrossRef] [PubMed]
  26. Martcheva, M. An Introduction to Mathematical Epidemiology; Springer: Berling/Heidelberg, Germany, 2015; Volume 61. [Google Scholar]
  27. Brauer, F.; Castillo-Chavez, C.; Feng, Z. Mathematical Models in Epidemiology; Springer: Berling/Heidelberg, Germany, 2019; Volume 32. [Google Scholar]
  28. Hurd, H.S.; Kaneene, J.B. The application of simulation models and systems analysis in epidemiology: A review. Prev. Vet. Med. 1993, 15, 81–99. [Google Scholar] [CrossRef]
  29. Ghosh, S.; Volpert, V.; Banerjee, M. An epidemic model with time-distributed recovery and death rates. Bull. Math. Biol. 2022, 84, 78. [Google Scholar] [CrossRef]
  30. Saade, M.; Ghosh, S.; Banerjee, M.; Volpert, V. An epidemic model with time delays determined by the infectivity and disease durations. Math. Biosci. Eng. 2023, 20, 12864–12888. [Google Scholar] [CrossRef]
  31. Ghosh, S.; Volpert, V.; Banerjee, M. An epidemic model with time delay determined by the disease duration. Mathematics 2022, 10, 2561. [Google Scholar] [CrossRef]
  32. Saade, M.; Ghosh, S.; Banerjee, M.; Volpert, V. Delay epidemic models determined by latency, infection, and immunity duration. Math. Biosci. 2024, 370, 109155. [Google Scholar] [CrossRef] [PubMed]
  33. Saade, M.; Aniţa, S.; Volpert, V. Dynamics of Persistent Epidemic and Optimal Control of Vaccination. Mathematics 2023, 11, 3770. [Google Scholar] [CrossRef]
  34. Varona, L.; Gonzales, J.R. Dynamics of the impact of COVID-19 on the economic activity of Peru. PLoS ONE 2021, 16, e0244920. [Google Scholar] [CrossRef]
  35. Hsiang, S.; Allen, D.; Annan-Phan, S.; Bell, K.; Bolliger, I.; Chong, T.; Druckenmiller, H.; Huang, L.Y.; Hultgren, A.; Krasovich, E.; et al. The effect of large-scale anti-contagion policies on the COVID-19 pandemic. Nature 2020, 584, 262–267. [Google Scholar] [CrossRef]
  36. Loayza, N. Costs and Trade-Offs in the Fight against the COVID-19 Pandemic: A Developing Country Perspective; World Bank: Washington, DC, USA, 2020. [Google Scholar]
  37. Zincenko, A.; Petrovskii, S.; Volpert, V. An economic-demographic dynamical system. Math. Model. Nat. Phenom. 2018, 13, 27. [Google Scholar] [CrossRef]
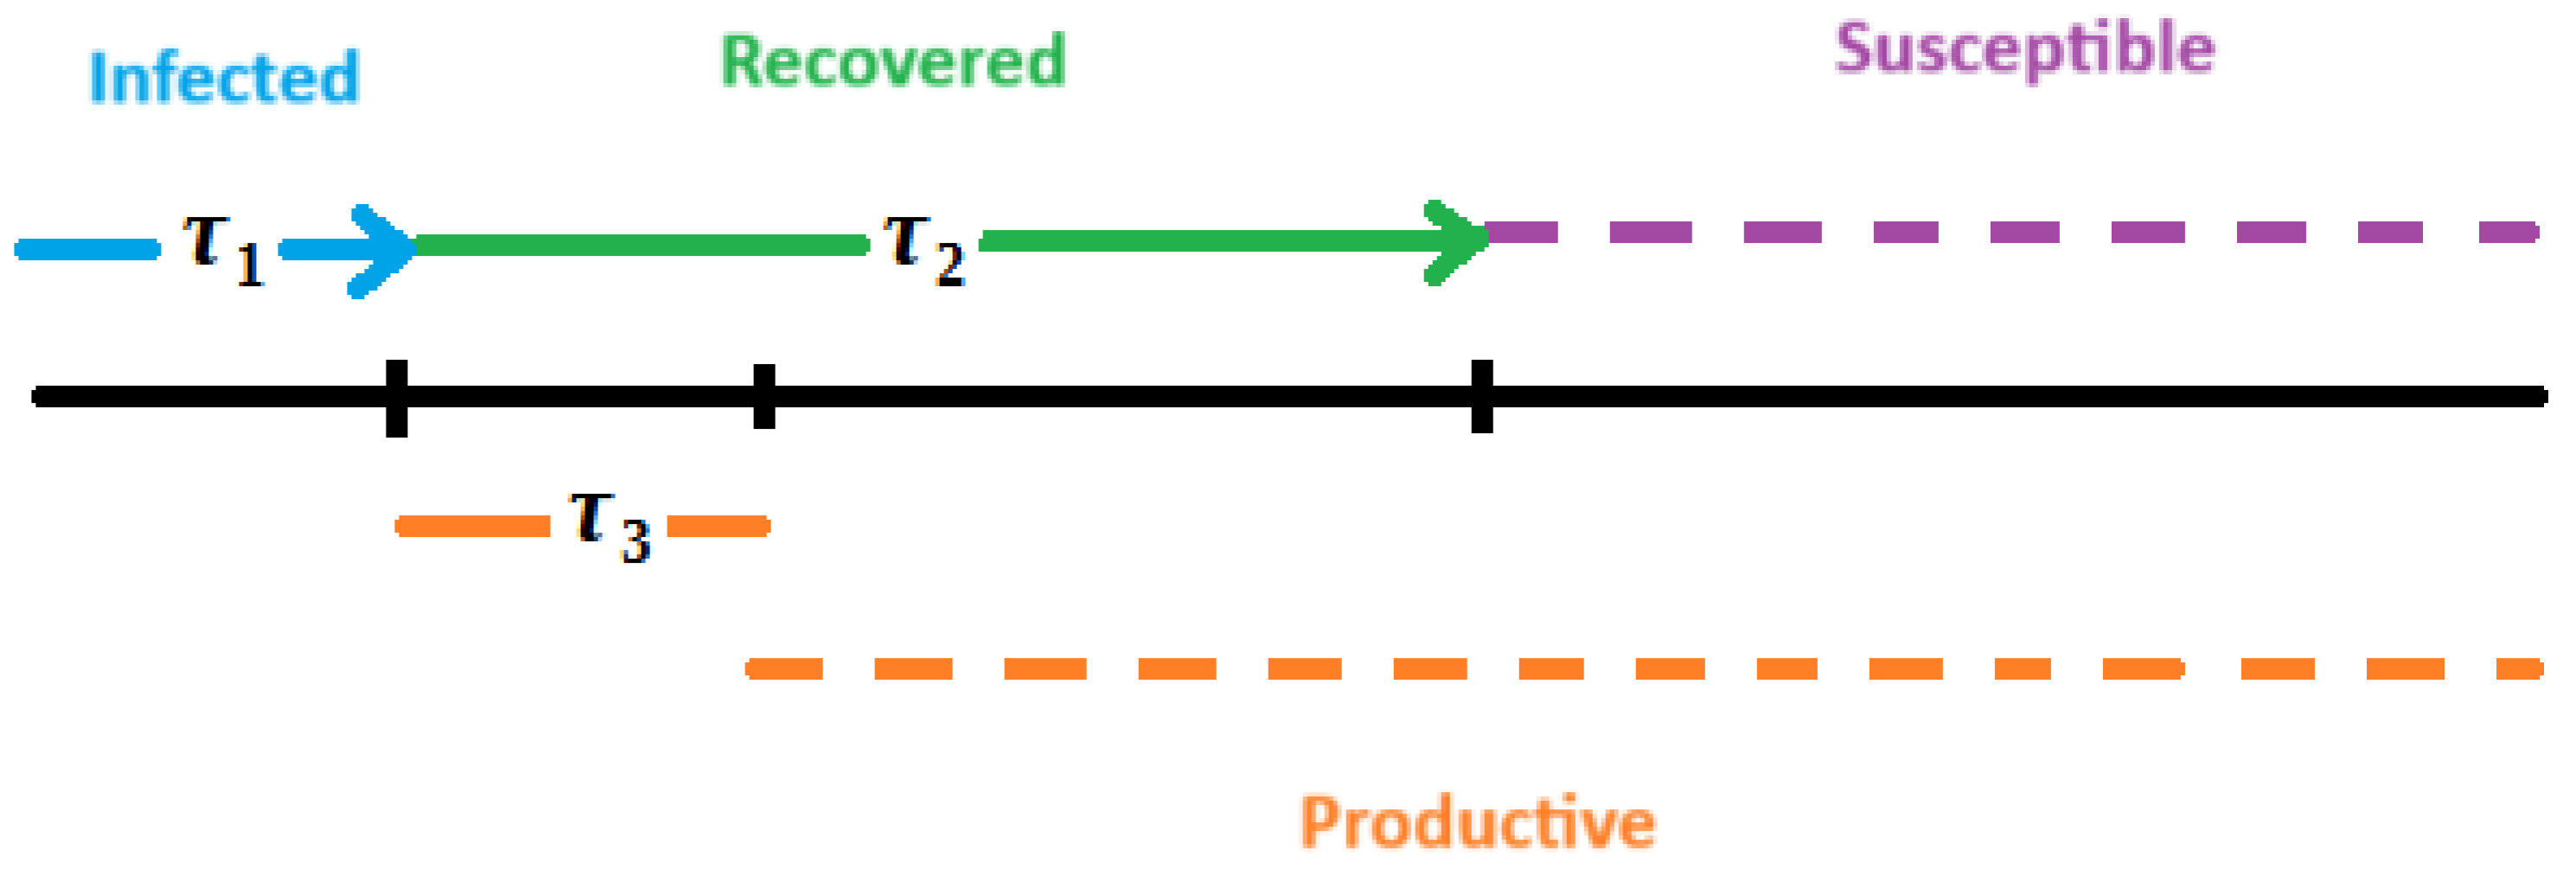
Figure 1. Diagram illustrating the model. Infected individuals become recovered after time interval τ 1 . Recovered individuals become susceptible again after a time interval τ 2 due to immunity waning. Recovered individuals are nonproductive during the convalescence period τ 3 and productive afterwards.
Mathematics 12 03106 g001
Figure 2. Susceptible, infected and recovered populations in numerical simulations of System (22) for initial conditions N 0 = 10 6 , S ( t ) = N 0 , I ( t ) = R ( t ) = 0 t [ τ 1 , 0 ) , S ( 0 ) = N 0 1 , I ( 0 ) = 1 , R ( 0 ) = 0 and parameters β = 0.3 , τ 1 = 10 . Panel (a): without isolation. Panel (b): a part of the population is isolated before epidemic outbreak and returns afterwards ( t 1 = 0 , T 1 = 120 , k 1 0.29 ) . Panel (c): t 1 = 0 , T 1 = 120 , k 1 = 0.6 .
Mathematics 12 03106 g002
Figure 4. Susceptible, infected, and recovered populations in numerical simulations of System (28) with parameter values β = 0.3 , τ 1 = 10 , τ 2 = 180 , N 0 = 10 6 , I ( 0 ) = 1 . In panel (a), we impose the following four lockdowns: { ( t 1 = 0 , T 1 = 130 , k 1 = 0.42 ) , ( t 2 = 215 , T 2 = 130 , k 2 = 0.42 ) , ( t 3 = 430 , T 3 = 130 , k 3 = 0.42 ) , ( t 4 = 635 , T 4 = 130 , k 4 = 0.42 ) } . The average annual number of infected individuals is I a v r = 682 , 405 . In panel (b), we impose the following four lockdowns: { ( t 1 = 0 , T 1 = 150 , k 1 = 0.5 ) , ( t 2 = 205 , T 2 = 150 , k 2 = 0.5 ) , ( t 3 = 410 , T 3 = 150 , k 3 = 0.5 ) , ( t 4 = 600 , T 4 = 150 , k 4 = 0.5 ) } . The average annual number of infected individuals is I a v r = 588,353.
Mathematics 12 03106 g004
Figure 5. Infected (a) and productive (b) populations and wealth (c) in numerical simulation of Model (5) with initial conditions N = 10 6 , S ( 0 ) = N 1 = P ( 0 ) , I ( 0 ) = 1 , R ( 0 ) = 0 , W ( 0 ) = 1.5045 × 10 7 , lags τ 1 = 7 , τ 2 = 180 , τ 3 = 7 , and parameters β = 0.15 , a 1 = 4 · 10 7 , a 2 = 10 6 , a 3 = 10 6 , a 4 = 0.5 , a 5 = 0.7 , a 6 = 0.7 . The number of infected individuals converges to a constant value after some damped oscillations. The same dynamics can be observed for the productive population and wealth.
Mathematics 12 03106 g005
Figure 6. Susceptible, infected, and recovered populations (a) and wealth (b) in numerical simulation of Model (5) for initial conditions N = 10 6 , S ( 0 ) = N 1 = P ( 0 ) , I ( 0 ) = 1 , R ( 0 ) = 0 , W ( 0 ) = 4.98 · 10 8 , lags τ 1 = 10 , τ 2 = 180 , τ 3 = 7 , and parameters β = 0.3 , a 1 = 10 9 , a 2 = a 3 = 10 6 , a 4 = 0.3 , a 5 = a 6 = 0.7 . Periodic epidemic outbreaks (a) lead to periodic decreases in wealth (b).
Mathematics 12 03106 g006
Figure 8. Susceptible (a), infected (b), recovered (c), and productive (d) populations and wealth (e) in numerical simulations of Model (5) with lockdown (colored) and without lockdown (black) for initial conditions N = 10 6 , S ( 0 ) = N 1 = P ( 0 ) , I ( 0 ) = 1 , R ( 0 ) = 0 , W ( 0 ) = 4.98 · 10 8 , time delays τ 1 = 7 , τ 2 = 180 , τ 3 = 7 , and parameters β = 0.3 , a 1 = 10 9 , a 2 = 10 6 , a 3 = 10 6 , a 4 = 0.3 , a 5 = 0.7 , a 6 = 0.7 . We impose three consecutive lockdowns ( t j , T j , k j ) , j { 1 , 2 , 3 } , as follows: t 1 = 0 , T 1 = 110 , k 1 = 0.3 , t 2 = 200 , T 2 = 160 , k 1 = 0.3 , t 3 = 440 , T 3 = 160 , k 3 = 0.3 . The isolated population is unproductive in this simulation ( α = 1 ).
Mathematics 12 03106 g008
Figure 9. Dependence of the annual average wealth W a v r = 1 n τ 1 0 365 n W ( η ) d η on the proportion of isolated population k ( 0 , 0.35 ) for τ 2 = 180 (left) and on the duration of immunity τ 2 (right) for k = 0.3 , W ( 0 ) = 4.98 · 10 8 , τ 1 = 10 , τ 3 = 7 , β = 0.3 , a 1 = 10 9 , a 2 = 10 6 , a 3 = 10 6 , a 4 = 0.3 , a 5 = 0.7 , a 6 = 0.7 , n = 2 . The lockdown durations are 100 days (left panel) and 120 days (right panel). The average wealth remains approximately constant for 78% of productive individuals among the isolated population.
Mathematics 12 03106 g009
Figure 10. Left: Dependence of annual average wealth W a v r = 1 n τ 1 0 365 n W ( η ) d η on the disease transmission rate β for τ 1 = 10 . Right: Dependence of average wealth on the disease duration τ 1 for β = 0.3 . System (5) is considered with initial conditions N 0 = 10 6 , S ( 0 ) = N 0 1 = P ( 0 ) , I ( 0 ) = 1 , R ( 0 ) = 0 , W ( 0 ) = 4.98 · 10 8 , time delays τ 2 = 180 , τ 3 = 7 , and parameters a 1 = 10 9 , a 2 = 10 6 , a 3 = 10 6 , a 4 = 0.3 , a 5 = 0.7 , a 6 = 0.7 , n = 2 . The lockdown durations are 150 days (left panel) and 120 days (right panel), and the proportion of isolated people is 0.3.
Mathematics 12 03106 g010
Disclaimer/Publisher’s Note: The statements, opinions and data contained in all publications are solely those of the individual author(s) and contributor(s) and not of MDPI and/or the editor(s). MDPI and/or the editor(s) disclaim responsibility for any injury to people or property resulting from any ideas, methods, instructions or products referred to in the content.