Article

A Novel Normal Contact Stiffness Model of Bi-Fractal Surface Joints

1
School of Mechanical Engineering, Xi’an University of Science and Technology, Xi’an 710054, China
2
School of Mechanical Engineering and Automation, Northeastern University, Shenyang 110819, China
*
Authors to whom correspondence should be addressed.
Mathematics 2024, 12(20), 3232; https://doi.org/10.3390/math12203232
Submission received: 8 September 2024 / Revised: 11 October 2024 / Accepted: 15 October 2024 / Published: 15 October 2024

Abstract

:
The contact stiffness of the mechanical joint usually becomes the weakest part of the stiffness for the whole machinery equipment, which is one of the important parameters affecting the dynamic characteristics of the engineering machinery. Based on the three-dimensional Weierstrass–Mandelbrot (WM) function, the novel normal contact stiffness model of the joint with the bi-fractal surface is proposed, which comprehensively considers the effects of elastoplastic deformation of asperity and friction factor. The effect of various parameters (fractal dimension, scaling parameter, material parameter, friction factor) on the normal contact stiffness of the joint is analyzed by numerical simulation. The normal contact stiffness of the joint increases with an increase in the fractal dimension, normal load, and material properties and decreases with an increase in the scaling parameter. Meanwhile, the fractal parameters of the equivalent rough surface of the joint are calculated by the structural function method. The experimental results show that when the load is between 14 and 38 N∙m, the error of the model is within 20%. The normal contact stiffness model of the bi-fractal surface joint can provide a theoretical basis for the analysis of the dynamic characteristics of the whole machine at the design stage.

1. Introduction

The large number of joints in large-scale mechanical equipment can produce dynamic characteristics such as contact stiffness and contact damping [1]. These dynamic characteristics have a great effect on the dynamic performance of the entire mechanical equipment, which affects the structural stability and operational accuracy [2,3]. Therefore, many scholars have carried out theoretical and experimental research [4].
Majumdar and Bhushan [5,6] first established a MB fractal contact model based on WM function and island area distribution function, which eliminates the defect that traditional statistical models are affected by instrument resolution and sampling length. Since the fractal contact model is objectively unique, many scholars have studied it. Xiao et al. [7] considered the elastic–plastic deformation mechanism of asperity and established a fractal model of contact stiffness of asperity from elastic to plastic deformation regions. Yu et al. [8] also found that there are multiple stages of deformation in asperity as the load increases. Zhao et al. [9] established a fractal model of normal contact stiffness considering the effect of friction factor and analyzed the variation of normal contact stiffness with friction factor. Meanwhile, a three-dimensional fractal model of contact stiffness considering friction factor has also been established [10]. In order to make the fractal model applicable to a curved surface, Zhao et al. [11] changed the size distribution function of the asperity contact points by introducing the area contact coefficient and converted the fractal contact stiffness model of the plane joint into the contact stiffness model of the curved joint. Xiong et al. [12] extended the fractal model of the curved joint to the calculation of the tangential contact damping of the spherical joint in the mechanical parts such as bearings and gears. Guan et al. [13,14] established a contact mechanics model between the piston and the cylinder of a spherical pump and analyzed the parameters of the piston radius and radial clearance as well as the material properties. Liu et al. [15] established a spindle-tool holder contact stiffness model based on fractal theory and a multi-scale contact mechanics model and analyzed the influence of cutting force and temperature on the contact stiffness of the spindle-toolholder. Fractal theory is not only used for planes and curved surfaces but also for characterizing surfaces with micro-structure. Zhang et al. [16] established a model of contact stiffness and damping of joints with micro-structured surfaces based on fractal theory to elucidate the effect of surface texture on stick slip vibration. Not only that, Bhushan and Majumdar [17] later found that when the structural function method is used to calculate the fractal parameters of a rough surface, the rough surface has different fractal parameters in two different regions, that is, it exhibits bi-fractal characteristics. Borri and Hu [18,19,20] also found that the rough surface has bi-fractal features.
However, a lot of theoretical research on the dynamic characteristics of the joints from different aspects has been carried out, and few scholars have analyzed the dynamic characteristics of the bi-fractal surface joints. In this paper, the normal contact stiffness of the bi-fractal surface joints is proposed, which innovatively takes into account the effects of elastoplastic deformation of the asperity and friction factor and uses a three-dimensional WM function to characterize the surface topography of the two contact surfaces of the joint. The proposed analytical model can provide a theoretical basis for the prediction of the dynamic characteristics of the whole machine at the design stage.
The main contributions of this work are summarized as: The proposed contact stiffness model adopts a three-dimensional WM function and considers the elastic–plastic deformation of asperities and friction factors. This not only accurately characterizes the morphology of fractal surfaces but also more realistically reflects the deformation of asperities and the contact characteristics of joint surfaces. The framework of this paper is as follows: In Section 2, a bi-fractal surface joint contact stiffness model is established. Firstly, based on the three-dimensional WM function and fractal theory, the contact model of single asperity in the elastic, elastoplastic, and plastic stages is established. Then the single asperity contact model is integrated by the area density distribution function to obtain the contact stiffness model of the joint. In Section 3, the effect of normal load, fractal parameters, friction factor, and material parameters on the contact stiffness of the bi-fractal surface joint is analyzed. In Section 4, the effectiveness of the model is verified by experiments. In Section 5, the conclusions obtained from previous analysis were presented.

2. Normal Contact Stiffness Modeling of Bi-Fractal Surface Joint

From a microscopic point of view, the bi-fractal surface joint is essentially formed by the contact of a large number of asperities on the two rough contact surfaces. The contact state of a single asperity has an important influence on the actual contact area, load, and contact stiffness of the entire joint. Therefore, the basis for studying the contact stiffness of the joint is firstly to analyze the contact state of a single pair of asperities, and then a contact stiffness model for predicting the bi-fractal surface joint is established.

2.1. Single Asperity Contact Analysis

The traditional fractal contact model is based on the WM function [21]. Komvopoulos [22] improved the traditional two-dimensional WM function and obtained a three-dimensional WM function that characterizes the fractal rough surface. The three-dimensional WM function is shown in Equation (1).
z ( x , y ) = L G L D 2 ln γ M 1 / 2 m = 1 M η = 0 η max γ D 3 η ·                           cos φ m , η cos 2 π γ η x 2 + y 2 1 / 2 L · cos tan 1 y x π m M + φ m , η
where z is the height of the asperity; L is the sampling length of the rough surface; G is the scaling parameter; D is the three-dimensional surface fractal dimension ( 2 < D < 3 ) ; γ is the parameters related to the frequency density; M is the number of peak ridges superimposed when forming a rough surface; η is the frequency index; and φ m , n is a random phase.
According to Equation (1), a three-dimensional rough surface profile can be obtained. The length of the three-dimensional surface sampling is calculated by L = 1 × 10 4   m ; the number of peaks and ridges superimposed on the rough surface is taken as M = 40 ; the parameters related to the frequency density is taken as γ = 1.5 , the 3D simulation of fractal surface topography at different fractal dimensions and scaling parameters as shown in Figure 1. From Figure 1a–c, it can be seen that when the scaling parameter is constant, the peak height of the asperity gradually decreases relative to the reference plane as the fractal dimension increased while its distribution density gradually increases. The surface becomes increasingly smooth; therefore, the fractal dimension reflects the surface roughness level of rough surfaces with bi-fractal characteristics. When the fractal dimension is constant, the density of asperity on rough surfaces remains basically unchanged as the scaling parameter increases, but the peak height of asperity gradually increases. The surface appears increasingly rough; therefore, the scaling parameter reflects the magnitude of the contour amplitude of bi-fractal surface joints.
Ignoring the details on smaller scales, then the three-dimensional WM function is approximated as a cosine wave [23], then Equation (1) can be expressed as follows:
z 0 ( x ) = G ( D 2 ) ( ln γ ) 1 / 2 ( 2 r ) ( 3 D ) cos φ 1 , n 0 cos π x r φ 1 , n 0
where r is the radius of the truncated circle formed by the contact of the two asperity; n 0 is the frequency index corresponding to the base length of the cosine wave; and n 0 = ln ( L / 2 r ) / ln γ .
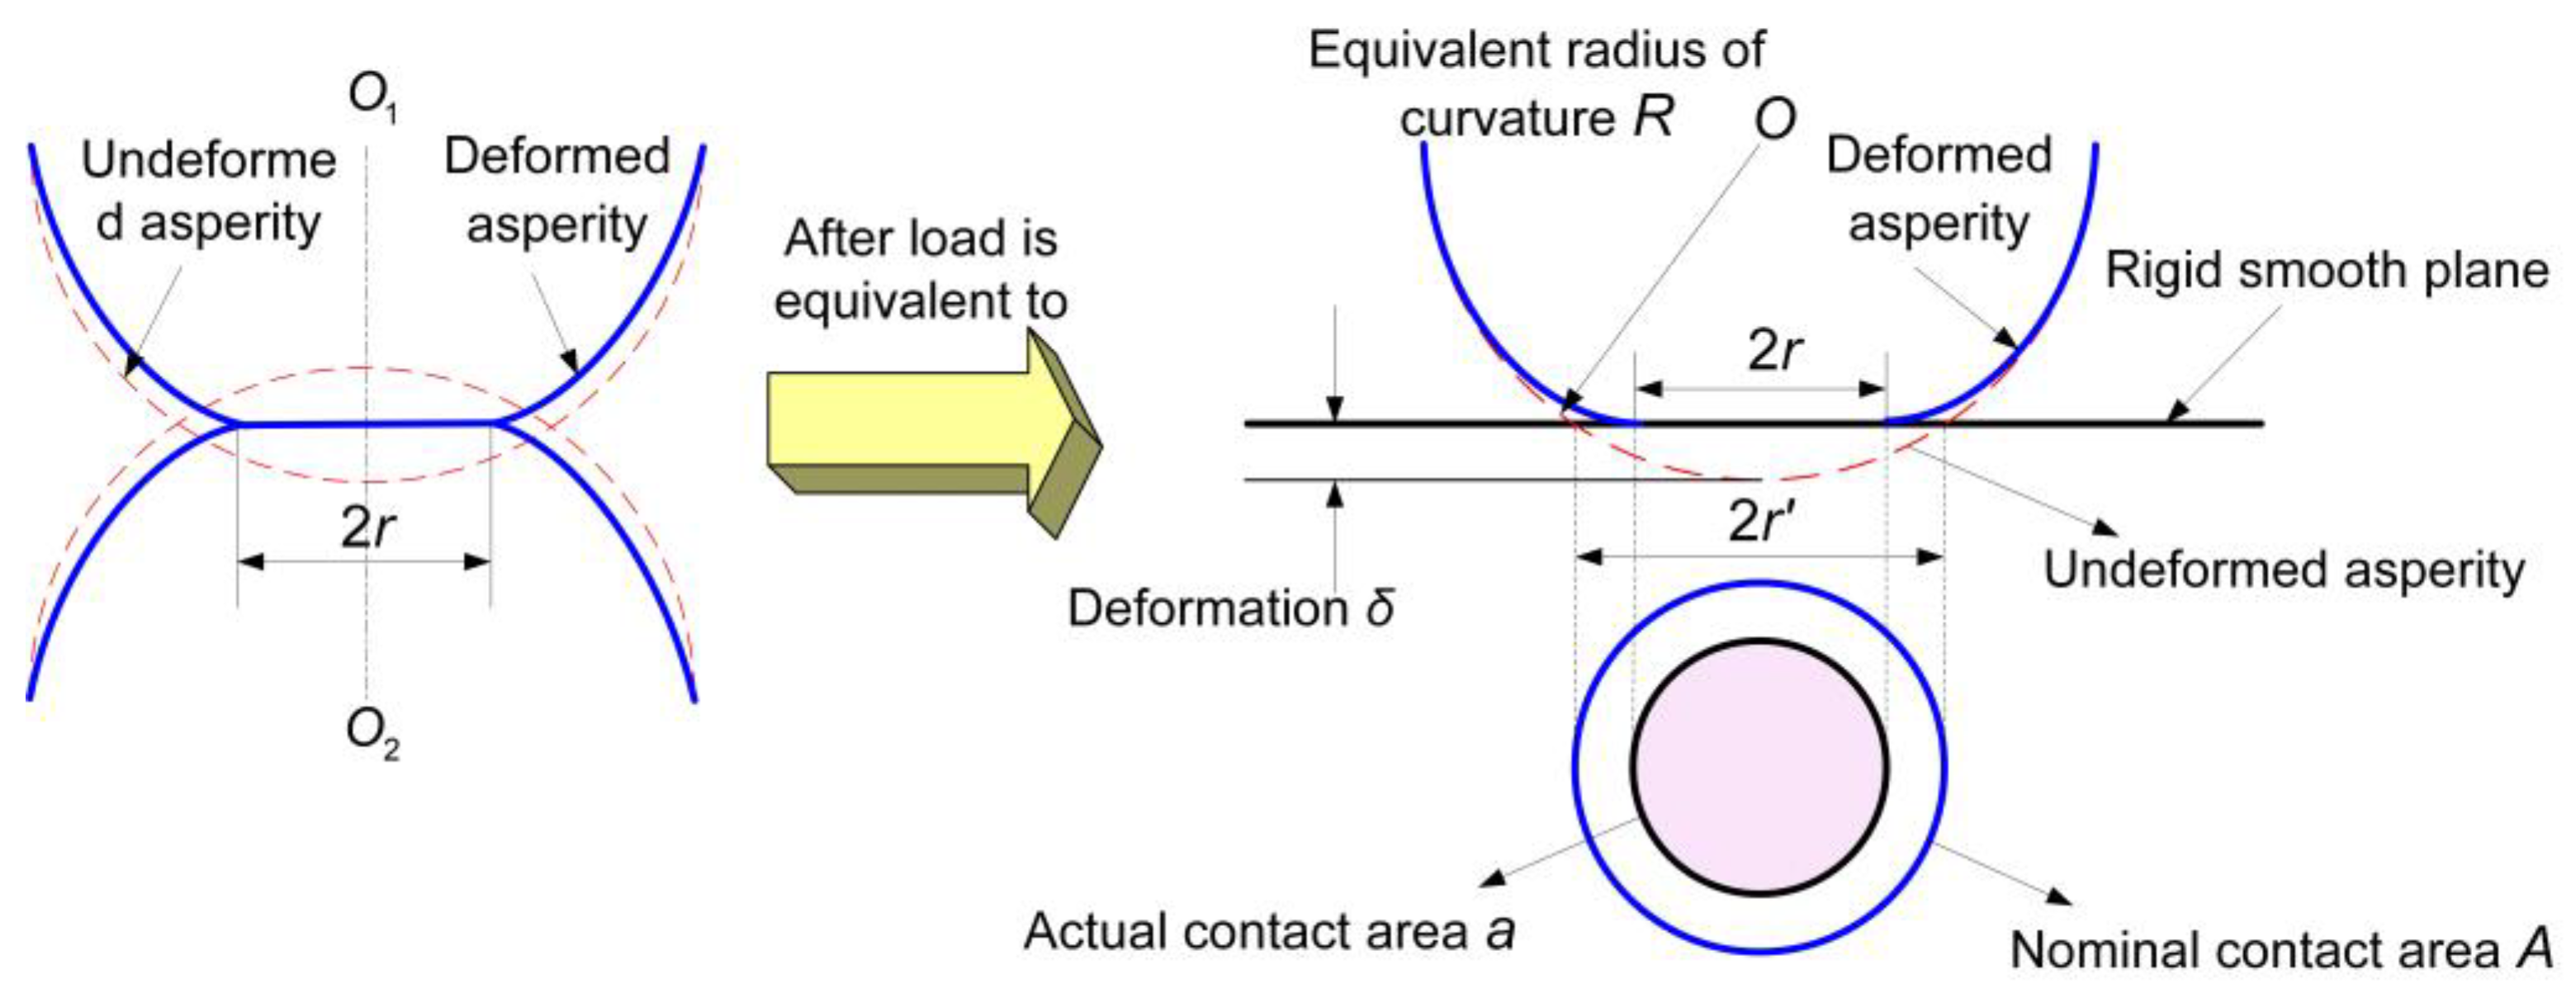
From Equation (2), the deformation of the asperity can be expressed by the difference between their peaks and troughs. When the two surfaces of the joint are in contact, at the microscopic level, the asperity of the two rough surfaces is actually in contact with each other. According to the Hertzian contact theory, it can be converted to an equivalent rough surface in contact with a rigid smooth plane, as shown in Figure 2.
The deformation of the asperity can be expressed as follows [24]:
δ = 2 ( 11 3 D ) / 2 G D 2 ln γ 1 / 2 π ( D 3 ) / 2 a ( 3 D ) / 2
Meanwhile, the radius of curvature of the asperity is calculated as follows:
R = 2 ( 3 D 11 ) / 2 π ( 1 D ) / 2 G 2 D a ( D 1 ) / 2 ln γ 1 / 2

2.1.1. Elastic Contact

When the deformation of the asperity is smaller than the elastic critical deformation ( δ < δ e c ), it is in the elastic deformation stage.
According to the Hertz contact theory, the relationship between the elastic load of the asperity and the deformation is calculated as follows:
p e ( δ ) = 4 3 E R 1 / 2 δ 3 / 2
where E is the equivalent elastic modulus of the joint, 1 / E = ( 1 ν 1 2 ) / E 1 + ( 1 ν 2 2 ) / E 2 , E 1 , E 2 is the elastic modulus of the two contact materials, ν 1 , ν 2 is the Poisson’s ratio of the two contact materials.
Then the normal elastic mean pressure of a single asperity is calculated as follows:
p e a ( δ ) = 1.1 k f σ y δ δ e c
Substituting Equations (3) and (4) into Equation (5), the expression of the elastic load and the contact area of the asperity is as follows:
p e ( a ) = 1 3 E π ( D 4 ) / 2 2 ( 15 3 D ) / 2 ( ln γ ) 1 / 2 G ( D 2 ) a ( 4 D ) / 2
The normal contact stiffness of the asperity in the elastic stage is as follows:
k n e ( a ) = d p e ( a ) d δ = 4 E 3 π 1 / 2 ( 4 D ) ( 3 D ) a 1 / 2
The elastic critical deformation of the asperity can be expressed as [23] follows:
δ e c = 3.3 π k f σ y 4 E 2 R
where k f is the interface friction coefficient, k f = 1 0.228 f                                 0 f 0.3 0.932 e 1.58 ( f 0.3 )             0.3 f 0.9 ; and σ y is the yield strength of the softer material in the two contact materials.
Substituting Equations (3) and (4) into Equation (9), the elastic critical contact area of the asperity is then calculated as follows:
a e c = 2 ( 3 D 11 ) / ( 2 D ) 3.3 k f σ y 4 E 2 / ( 2 D ) π ( 4 D ) / ( 2 D ) ln γ 1 / ( D 2 ) G 2

2.1.2. Plastic Contact

When the deformation of the asperity is larger than the elastic critical deformation ( δ > δ e c ), it is in the plastic deformation stage.
The expression of the plastic load and the contact area of the asperity is as follows:
p p ( a ) = H a
Therefore, the normal plastic mean pressure of a single asperity is as follows:
p p a ( δ ) = H = k σ y
The plastic critical deformation of the asperity from the elastoplastic interval to the plastic interval is [25] as follow:
δ p c = 279 161 1 / 0 . 117 δ ec 110 δ ec
From the Equations (3), (9), and (13), the plastic critical contact area of the asperity is
a p c = 2 ( 3 D 11 ) / ( 2 D ) 17.3 k f σ y 2 E 2 / ( 2 D ) π ( 4 D ) / ( 2 D ) ln γ 1 / ( D 2 ) G 2

2.1.3. Elastoplastic Contact

When the deformation of the asperity is greater than the elastic critical deformation and less than the plastic critical deformation ( δ e c < δ < δ p c ), it is in the elastoplastic deformation stage.
In this deformation stage, H it is not a constant value, so it is expressed by the average pressure H ( a ) , and H ( a ) the power function fitting empirical relationship is calculated as follows [26]:
H ( a ) = α σ y a a e c β
The continuity of the function should be satisfied, namely the following:
H ( a e c ) = p e a ( δ e c )
H ( a p c ) = p p a ( δ p c )
Substituting Equations (6) and (15) into Equation (16) gives the following:
  α = 1.1 k f
Substituting Equations (12), (15) and (18) into Equation (17) gives the following:
β = ( 2 D ) ln 1.1 k f / k 2 ( ln 11 ln 115 )
The expression of the elastoplastic load and the contact area of the asperity is calculated as follows:
p e p ( a ) = 1.1 k f σ y a e c β a β + 1
The normal contact stiffness of the asperity in the elastoplastic stage is calculated as follows:
k n e p ( a ) = d p e p ( a ) d δ = 2.2 ( β + 1 ) ( 3 D ) 2 ( 3 D 11 ) / 2 G ( 2 D ) ( ln γ ) 1 / 2 π ( 3 D ) / 2 k f σ y a e c β a ( 2 β + D 1 ) / 2

2.2. Bi-Fractal Surface Contact Analysis

2.2.1. Contact Mechanics of Bi-Fractal Surfaces

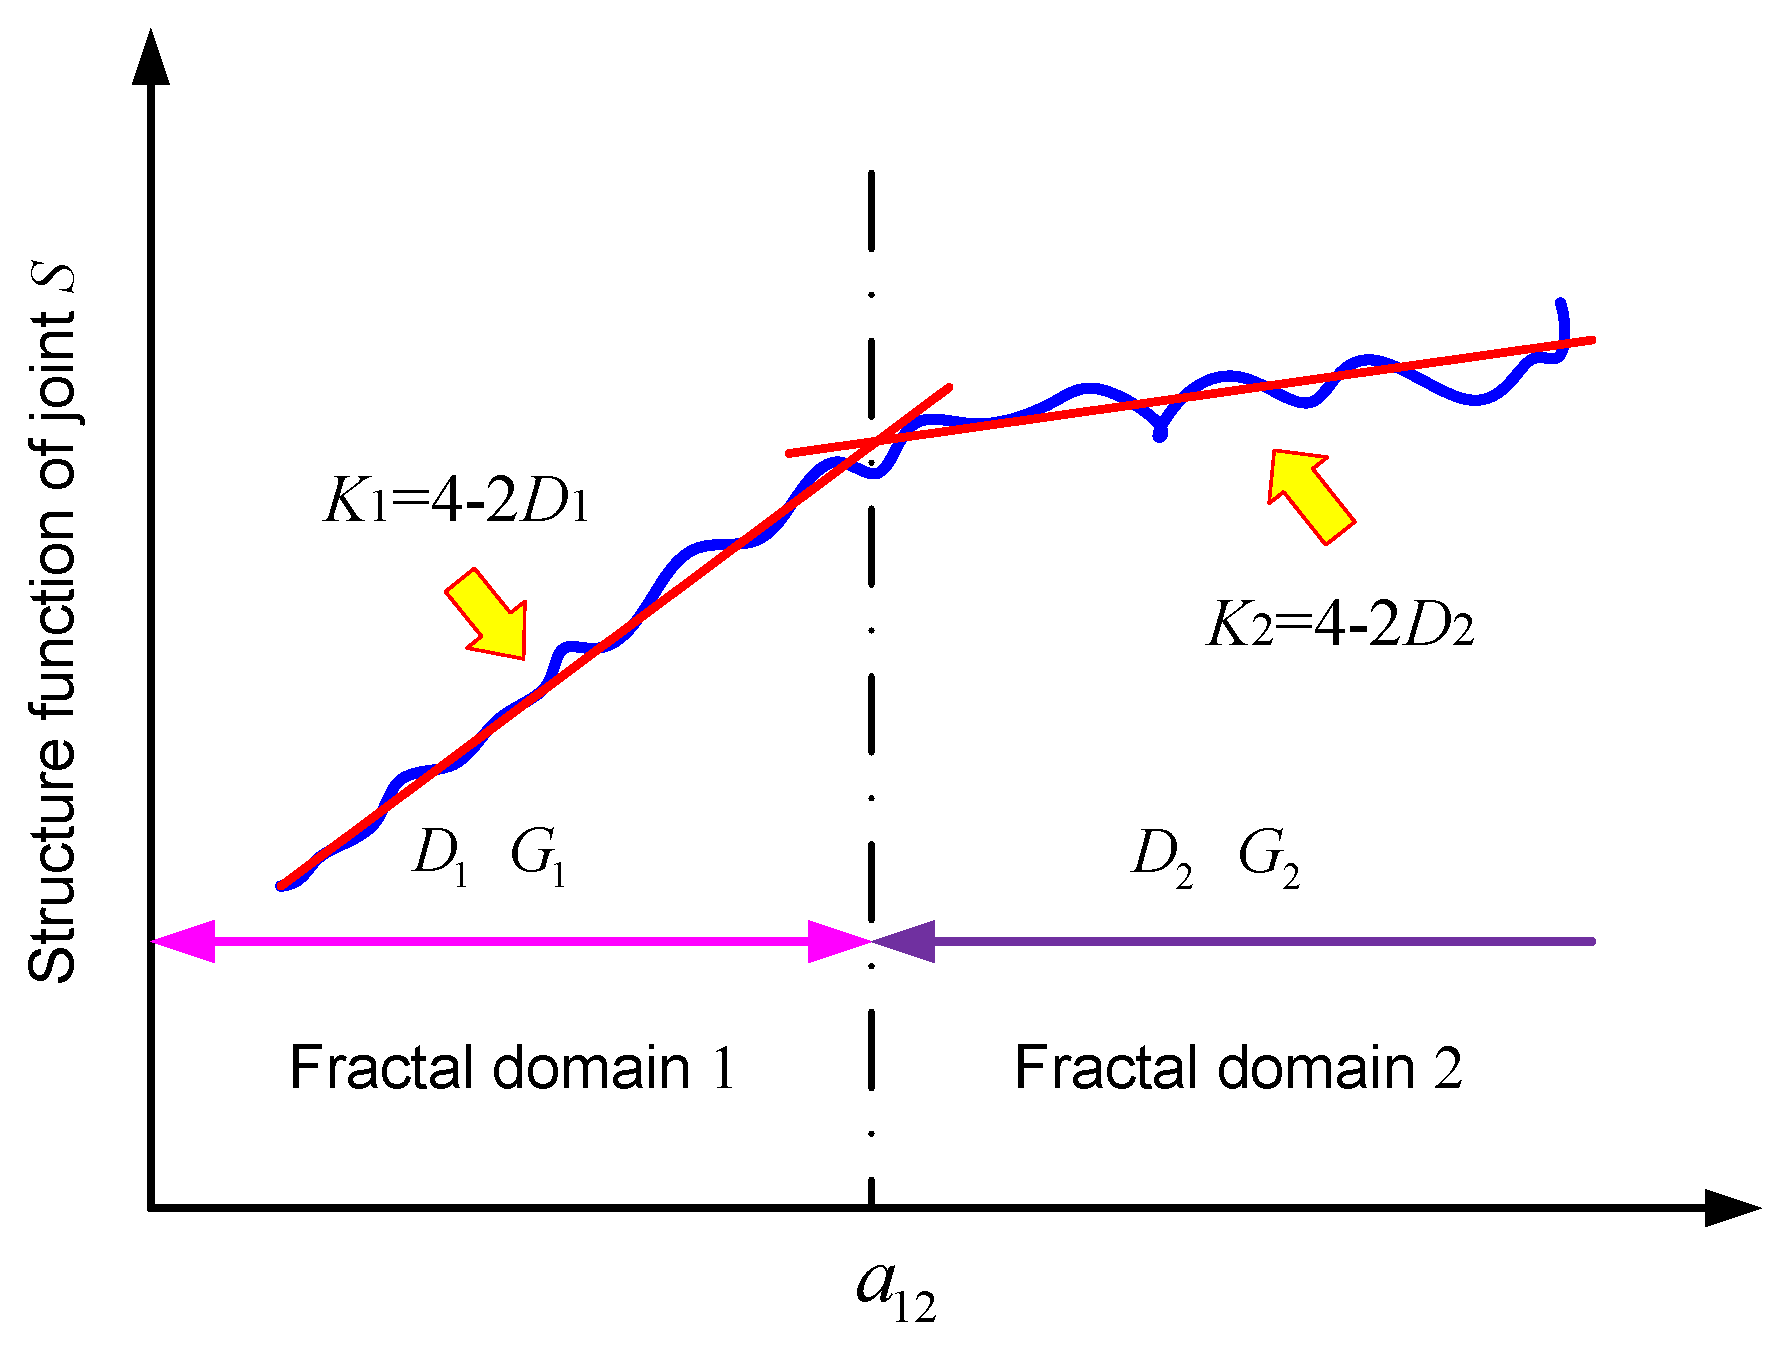
Most of the machined surface structure function graphs have two fractal intervals, as shown in Figure 3, each of which has its own elastic critical contact area, respectively denoted as a e c 1 and a e c 2 ; each has its own plastic critical contact area, which is recorded as a p c 1 and a p c 2 . There is a boundary contact area a 12 at the junction of the two fractal regions [27], a 12 = τ 12 2 ; according to the size relationship of a e c 1 , a e c 2 , a p c 1 , a p c 2 , and a 12 , the elastoplastic deformation of the single asperity of the bi-fractal surface joint is divided into the following six cases.
Case A: ( a p c 1 < a 12 and a e c 1 > a 12 )
When the actual contact area of a single asperity is satisfied a < a p c 1 , the deformation is plastic, and the elastoplastic deformation is satisfied a p c 1 < a < a 12 ;
Case B: ( a p c 1 < a e c 1 < a 12 )
When the actual contact area of a single asperity is satisfied a < a p c 1 , the deformation is plastic deformation, and when it is satisfied a p c 1 < a < a e c 1 , it is elastic–plastic deformation; the elastic deformation is satisfied a e c 1 < a < a 12 ;
Case C: ( a 12 < a p c 1 < a e c 1 )
All single asperity in the fractal domain 1 are plastically deformed;
Case D: ( a p c 2 < a 12 and a e c 2 > a 12 )
When the actual contact area of a single asperity is satisfied a 12 < a < a e c 2 , the deformation is elastoplastic deformation, and when it is satisfied a > a e c 2 , it is elastic deformation;
Case E: ( a p c 2 < a e c 2 < a 12 )
All single asperity in the fractal domain 2 are elastically deformed;
Case F: ( a 12 < a p c 2 < a e c 2 )
When the actual contact area of a single asperity is satisfied a 12 < a < a p c 2 , the deformation is plastic deformation, and when it is satisfied a p c 2 < a < a e c 2 , it is elastic–plastic deformation; the elastic deformation is satisfied a > a e c 2 ;

2.2.2. Area Density Distribution Function

At the same time, for the bi-fractal surface joint, the area density distribution function can be divided into the following two cases according to the relationship between the boundary contact area a 12 and the maximum contact area of single asperity a l .
Case I: (al < a12)
n 1 ( a ) = D 1 1 2 a l ( D 2 1 ) / 2 a ( D 1 + 1 ) / 2
Case II: (al > a12)
n 1 ( a ) = D 1 1 2 a l ( D 2 1 ) / 2 a 12 ( D 1 D 2 ) / 2 a ( D 1 + 1 ) / 2     ( a < a 12 )
n 2 ( a ) = D 2 1 2 a l ( D 2 1 ) / 2 a ( D 2 + 1 ) / 2   ( a 12 < a < a l )

2.3. Contact Stiffness of the Entire Joint

2.3.1. Total Real Contact Area

The actual contact area Ar of the joint includes an elastic contact area and a plastic contact area, and the contact area of the entire joint surface is obtained by integrating in each deformation zone.
The true contact area Ar of the bi-fractal surface joint can be expressed as follows:
A r = 0 a 12 n 1 ( a ) a d a + a 12 a l n 2 ( a ) a d a         = D 1 1 3 D 1 a l ( D 2 1 ) / 2 a 12 ( 3 D 2 ) / 2 + D 2 1 3 D 2 a l ( D 2 1 ) / 2 a l ( 3 D 2 ) / 2 a 12 ( 3 D 2 ) / 2
We divide Equation (25) to obtain the following:
A r * = D 1 1 3 D 1 a l * ( D 2 1 ) / 2 a 12 * ( 3 D 2 ) / 2 + D 2 1 3 D 2 a l * ( D 2 1 ) / 2 a l * ( 3 D 2 ) / 2 a 12 * ( 3 D 2 ) / 2
where A r is the dimensionless true contact area of the joint, A r * = A r / A a .

2.3.2. Total Normal Load

Through the previous analysis of Case A–Case F and Case I–Case II, since Case II indicates that the maximum asperity contact area enters the fractal zone 2, the joint surface exhibits a bi-fractal feature, thus resulting in various combinations. Comprehensive analysis of various combinations will make the work complicated. Therefore, for the convenience of research without loss of generality, only Case C + Case F is selected to analyze the normal load and normal contact stiffness of the joint surface. Other cases can be obtained similarly.
(1)
If the maximum contact area of a single asperity is larger than the elastic critical contact area, that is a l > a e c 2 , the total normal load of the bi-fractal surface joint is calculated as follows:
P = 0 a 12 p p ( a ) n 1 ( a ) d a + a 12 a p c 2 p p ( a ) n 2 ( a ) d a + a p c 2 a e c 2 p e p ( a ) n 2 ( a ) d a + a e c 2 a l p e ( a ) n 2 ( a ) d a
Substituting Equations (7), (11), (20), (23) and (24) into Equation (27), we can obtain
P = ( D 1 1 ) 3 D 1 H a l ( D 2 1 ) / 2 a 12 ( 3 D 2 ) / 2         + ( D 2 1 ) 3 D 2 H a l ( D 2 1 ) / 2 ( 110 ( 3 D 2 ) / ( 4 2 D 2 ) a e c 2 ( 3 D 2 ) / 2 a 12 ( 3 D 2 ) / 2 )         + 1.1 ( D 2 1 ) ( 3 + 2 β D 2 ) k f σ y a l ( D 2 1 ) / 2 a e c 2 ( 3 D 2 ) / 2 ( 1 110 ( 3 + 2 β D 2 ) / ( 4 2 D 2 ) )         + D 2 1 3 ( 5 2 D 2 ) E π ( D 2 4 ) / 2 2 ( 15 3 D 2 ) / 2 ( ln γ ) 1 / 2 G 2 ( D 2 2 ) a l ( D 2 1 ) / 2 ( a l ( 5 2 D 2 ) / 2 a e c 2 ( 5 2 D 2 ) / 2 )
(2)
If the maximum contact area of a single asperity is larger than the plastic critical contact area and smaller than the elastic critical contact area, that is a p c 2 < a l < a e c 2 , the total normal load of the bi-fractal surface joint is expressed as follows:
P = 0 a 12 p p ( a ) n 1 ( a ) d a + a 12 a p c 2 p p ( a ) n 2 ( a ) d a + a p c 2 a l p e p ( a ) n 2 ( a ) d a
Substituting Equations (11), (20), (23), and (24) into Equation (29), we obtain the following:
P = ( D 1 1 ) 3 D 1 H a l ( D 2 1 ) / 2 a 12 ( 3 D 2 ) / 2         + ( D 2 1 ) 3 D 2 H a l ( D 2 1 ) / 2 ( 110 ( 3 D 2 ) / ( 4 2 D 2 ) a e c 2 ( 3 D 2 ) / 2 a 12 ( 3 D 2 ) / 2 )         + 1.1 ( D 2 1 ) ( 3 + 2 β D 2 ) k f σ y a l ( D 2 1 ) / 2 a e c 2 ( 3 D 2 ) / 2 ( 1 110 ( 3 + 2 β D 2 ) / ( 4 2 D 2 ) )
(3)
If the maximum contact area of a single asperity is smaller than the plastic critical contact area, that is a l < a p c 2 , the total normal load of the bi-fractal surface joint is expressed as follows:
P = 0 a 12 p p ( a ) n 1 ( a ) d a + a 12 a l p p ( a ) n 2 ( a ) d a
Substituting Equations (11), (23) and (24) into Equation (31), we obtain the following:
P = ( D 1 1 ) 3 D 1 H a l ( D 2 1 ) / 2 a 12 ( 3 D 2 ) / 2         + ( D 2 1 ) 3 D 2 H a l ( D 2 1 ) / 2 ( 110 ( 3 D 2 ) / ( 4 2 D 2 ) a e c 2 ( 3 D 2 ) / 2 a 12 ( 3 D 2 ) / 2 )
Substituting P * = P / A a E , G * = G / A a , a l * = a l / A a , a c 1 * = a c 1 * / A a , a c 2 * = a c 2 * / A a , a 12 * = a 12 * / A a , φ = H / E to Equations (28), (30), and (32), the dimensionless form of Equations (28), (30), and (32) can be obtained.

2.3.3. Total Normal Contact Stiffness

The normal contact stiffness of a single asperity is integrated over area density distribution function, and the relationship between the total normal contact stiffness and the true contact area of the bi-fractal surface joint is obtained as follows:
(1)
If the maximum contact area of a single asperity is larger than the elastic critical contact area, that is a l > a e c 2 , the total normal contact stiffness of the bi-fractal surface joint is as follows:
K n = a p c 2 a e c 2 k n e p ( a ) n 2 ( a ) d a + a e c 2 a l k n e ( a ) n 2 ( a ) d a
Substituting Equations (8), (21) and (24) into Equation (33), we obtain the following:
K n = 4 E 3 π 1 / 2 ( 4 D 2 ) ( D 2 1 ) ( 2 D 2 ) ( 3 D 2 ) a l ( D 2 1 ) / 2 ( a l ( 2 D 2 ) / 2 a e c 2 ( 2 D 2 ) / 2 )             + 1.1 ( D 2 1 ) ( 3 D 2 ) ( β + 1 ) β 2 ( 3 D 2 11 ) / 2 G 2 ( 2 D 2 ) ( ln γ ) 1 / 2 π ( 3 D 2 ) / 2 k f σ y a l ( D 2 1 ) / 2 ( 1 110 β / ( 2 D 2 ) )
(2)
If the maximum contact area of a single asperity is larger than the plastic critical contact area and smaller than the elastic critical contact area, that is a p c 2 < a l < a e c 2 , the total normal contact stiffness of the bi-fractal surface joint is as follows:
K n = a p c 2 a l k n e p ( a ) n 2 ( a ) d a
Substituting Equations (21) and (24) into Equation (35), we obtain the following:
K n = 1.1 ( D 2 1 ) ( 3 D 2 ) ( β + 1 ) β 2 ( 3 D 2 11 ) / 2 G 2 ( 2 D 2 ) ( ln γ ) 1 / 2 π ( 3 D 2 ) / 2 k f σ y a l ( D 2 1 ) / 2 ( 1 110 β / ( 2 D 2 ) )
(3)
If the maximum contact area of a single asperity is smaller than the plastic critical contact area, that is a l < a p c 2 , due to the asperities of bi-fractal surface joint are all plastic, we can draw a conclusion that the total normal contact stiffness of the bi-fractal surface joint is zero.
K n = 0
Substituting K n * = K n / ( A a E ) , G * = G / A a , a l * = a l / A a , a c 1 * = a c 1 * / A a , a c 2 * = a c 2 * / A a , a 12 * = a 12 * / A a , φ = H / E to Equations (34) and (36), the dimensionless form of Equations (34) and (36) can be obtained.
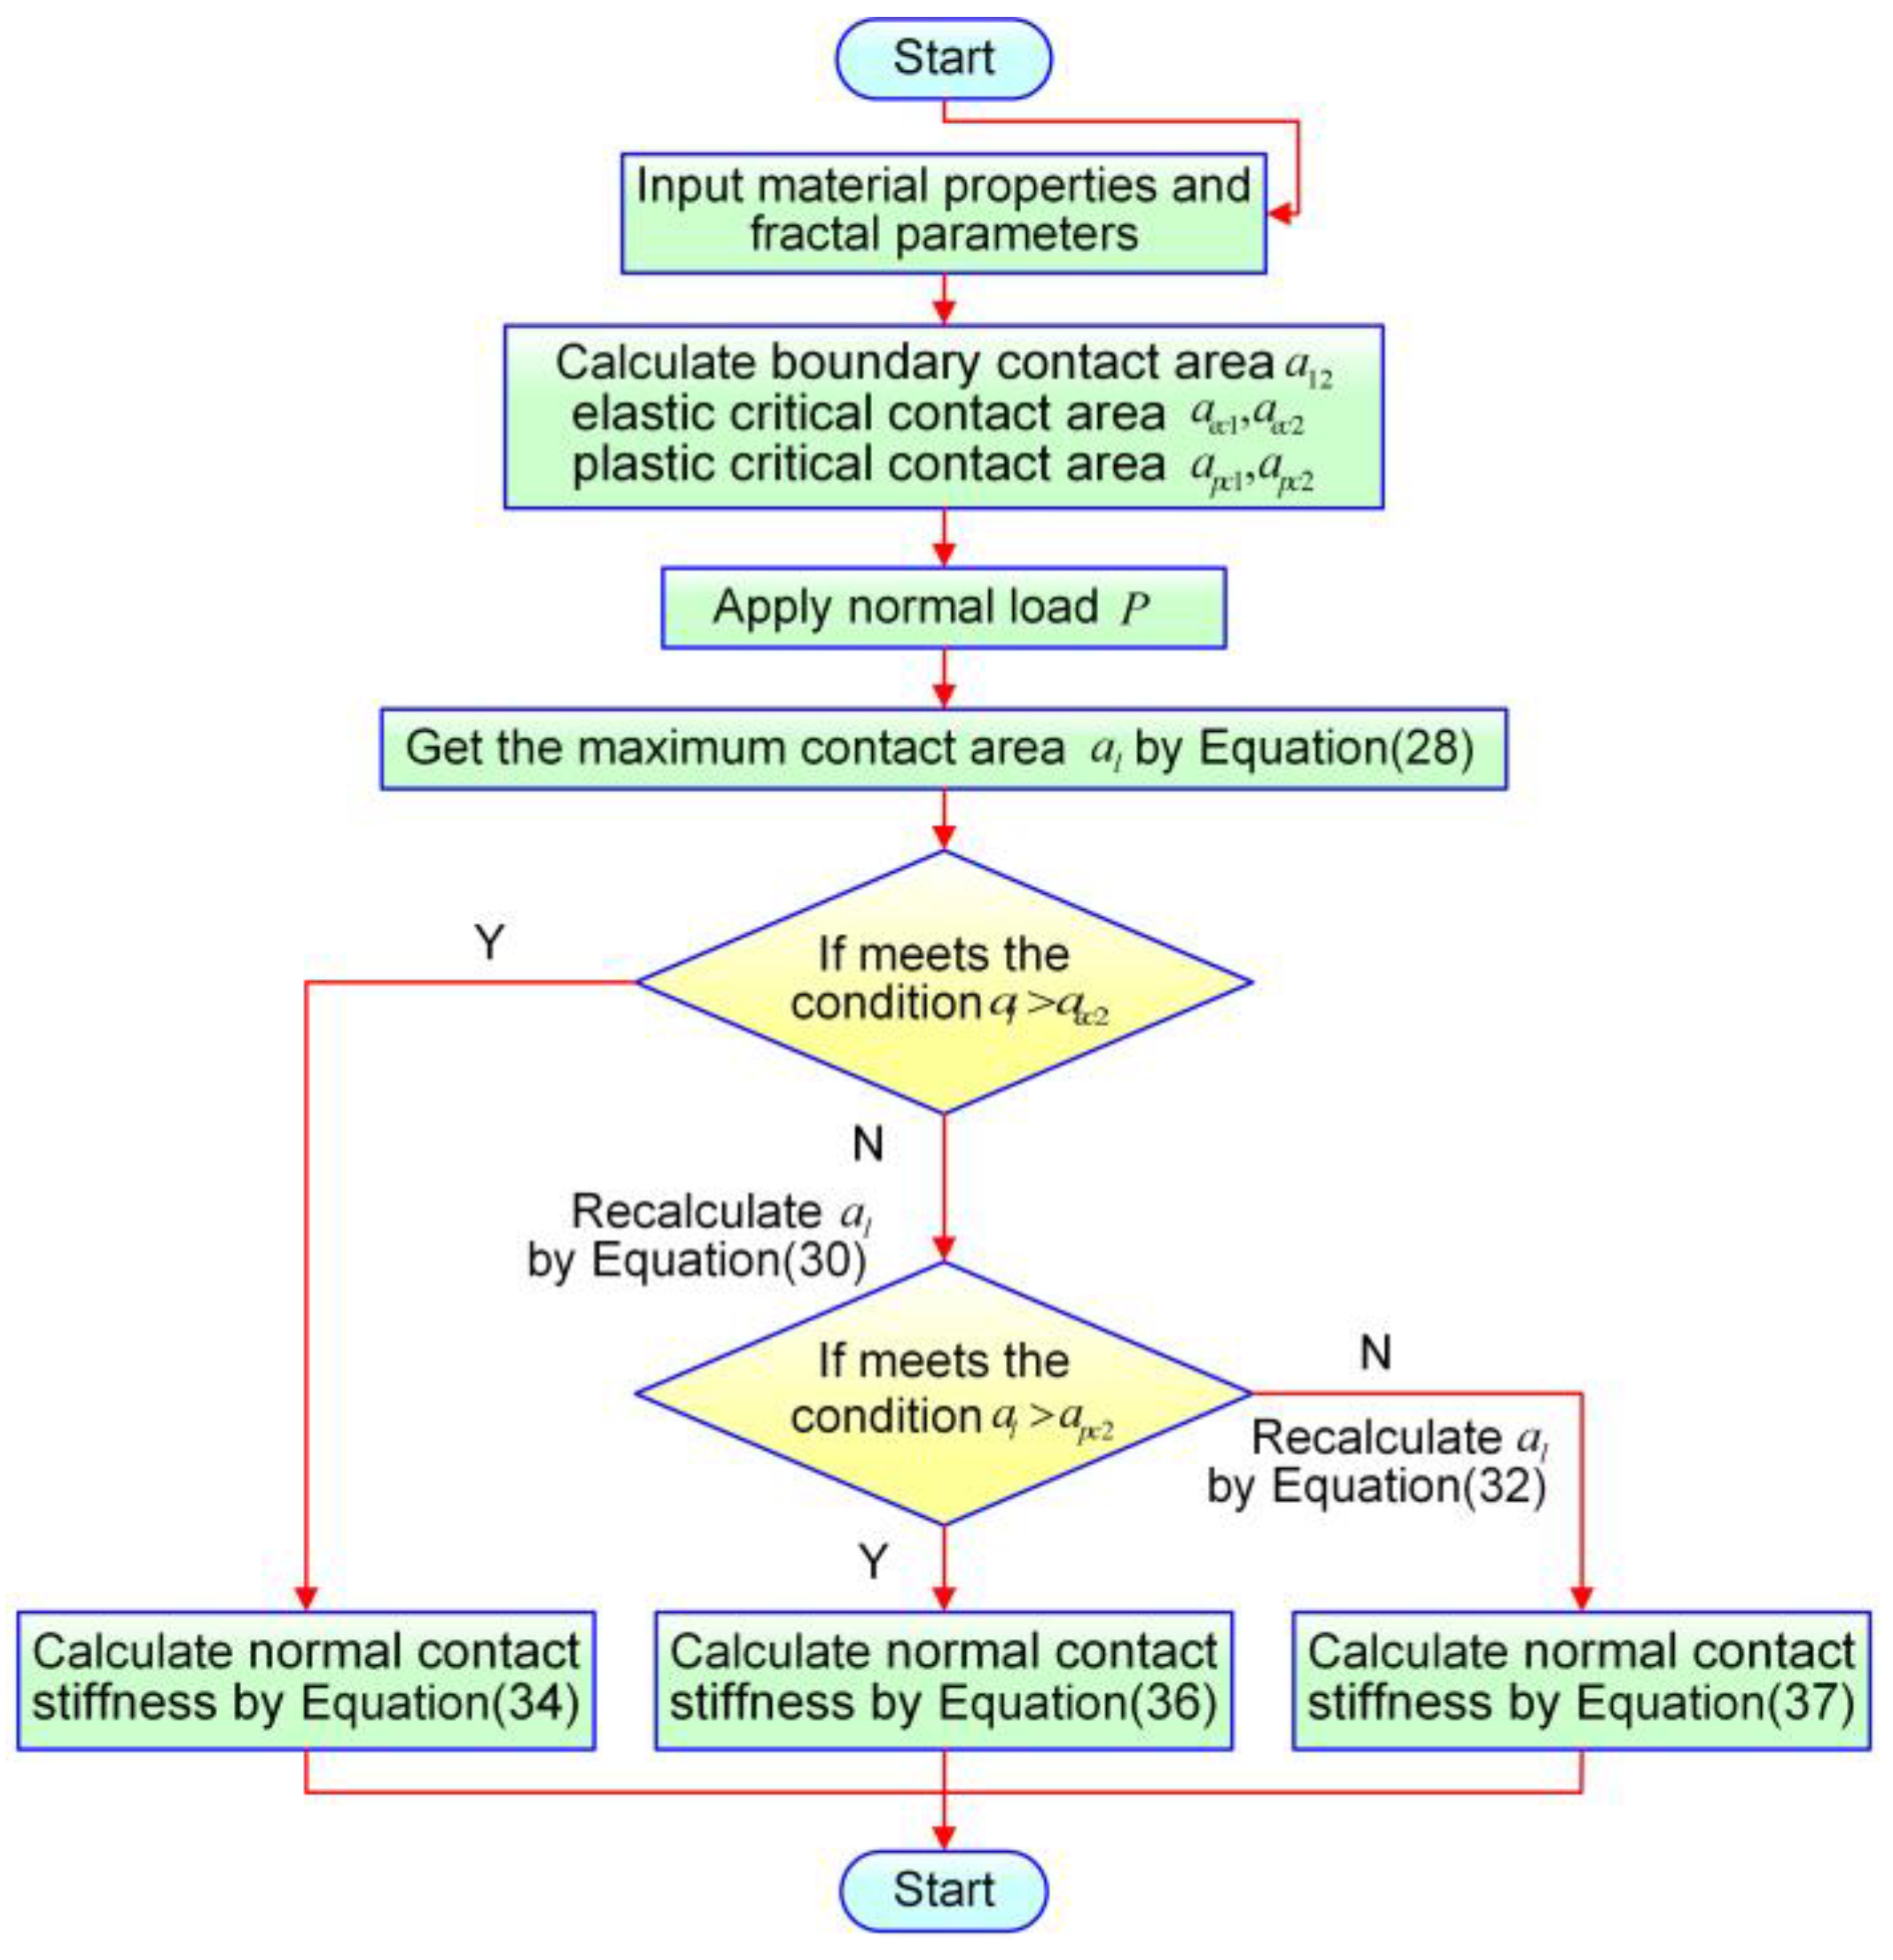
The contact stiffness of entire surface joint is a function of a p c , a e c , a 12 , a l , D , G , E and H . Material property parameters E and H are available from a given material. The fractal parameters D and G can be identified by the structural function method in Section 4.1. apc and aec are obtained by applying Equation (14) and Equation (10). The maximum contact area of the asperity a l is obtained by Equation (28), Equation (30), or Equation (32) because the normal load P is balanced with the external load. Therefore, by substituting the above parameters into Equation (34), Equation (36), or Equation (37), the contact stiffness of the bi-fractal surface joint can be obtained.
The flowchart of calculating the normal contact stiffness for the bi-fractal surface joint is shown in Figure 4.

3. Simulation Analysis of Normal Contact Stiffness

Such factors as the fractal parameters, the material properties, the normal load and the friction factor have a combined effect on the actual contact area and the normal contact stiffness of the bi-fractal surface joint. Therefore, it is essential to analyze the effect of the above factors on the contact stiffness and the actual contact area.

3.1. Real Contact Area

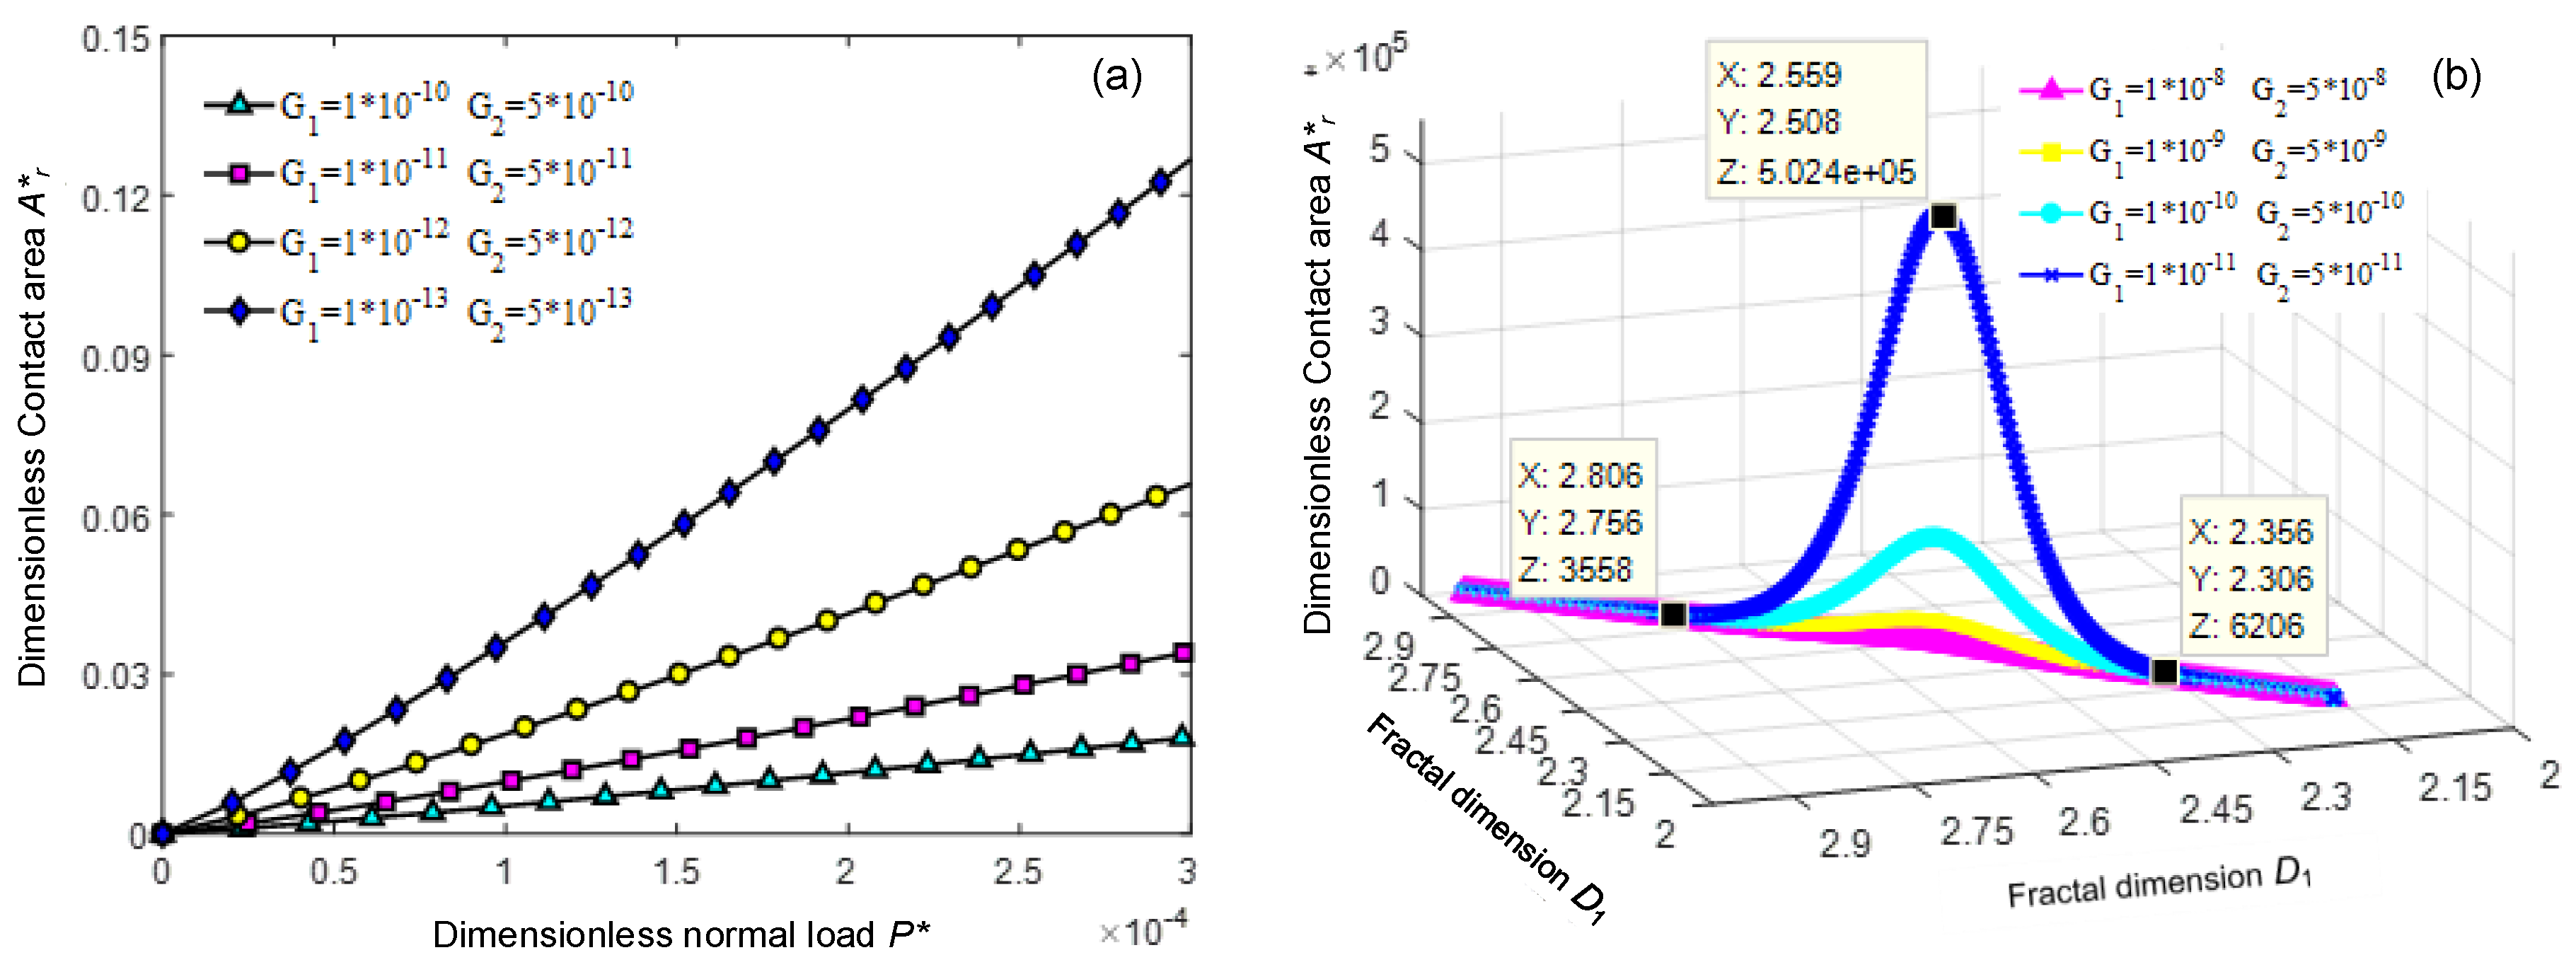
Figure 5a is the relationship between the dimensionless normal load, and the dimensionless true contact area of the bi-fractal surface joint under different scaling parameters. It can be seen from Figure 5a that when the fractal parameters are constant, the true contact area of the joint increases approximately linearly with an increase in the normal load. This is because when the normal load is increased, the contact area of a single asperity with larger curvature is increased, and the number of the asperity having a smaller radius of curvature is increased, so that the total actual contact area is increased.
Not only the normal load of the joint will affect the real contact area of the joint, but the fractal parameters also affect the true contact area of the joint. Figure 5b shows the relationship between the dimensionless true contact area of the bi-fractal surface joint and the fractal parameters. With an increasing fractal dimension, the real contact area of the bi-fractal surface joint tends to increase first and then decrease. When the fractal dimension is small, the real contact area of the joint increases slowly. When D 1 > 2.35 , D 2 > 2.3 , the contact area increased rapidly and reached a maximum, it then showed a downward trend. It can also be seen that the scaling parameter also has an important influence on the true contact area of the joint. The true contact area of the joint increases with a decrease in the scaling parameter.

3.2. Normal Contact Stiffness

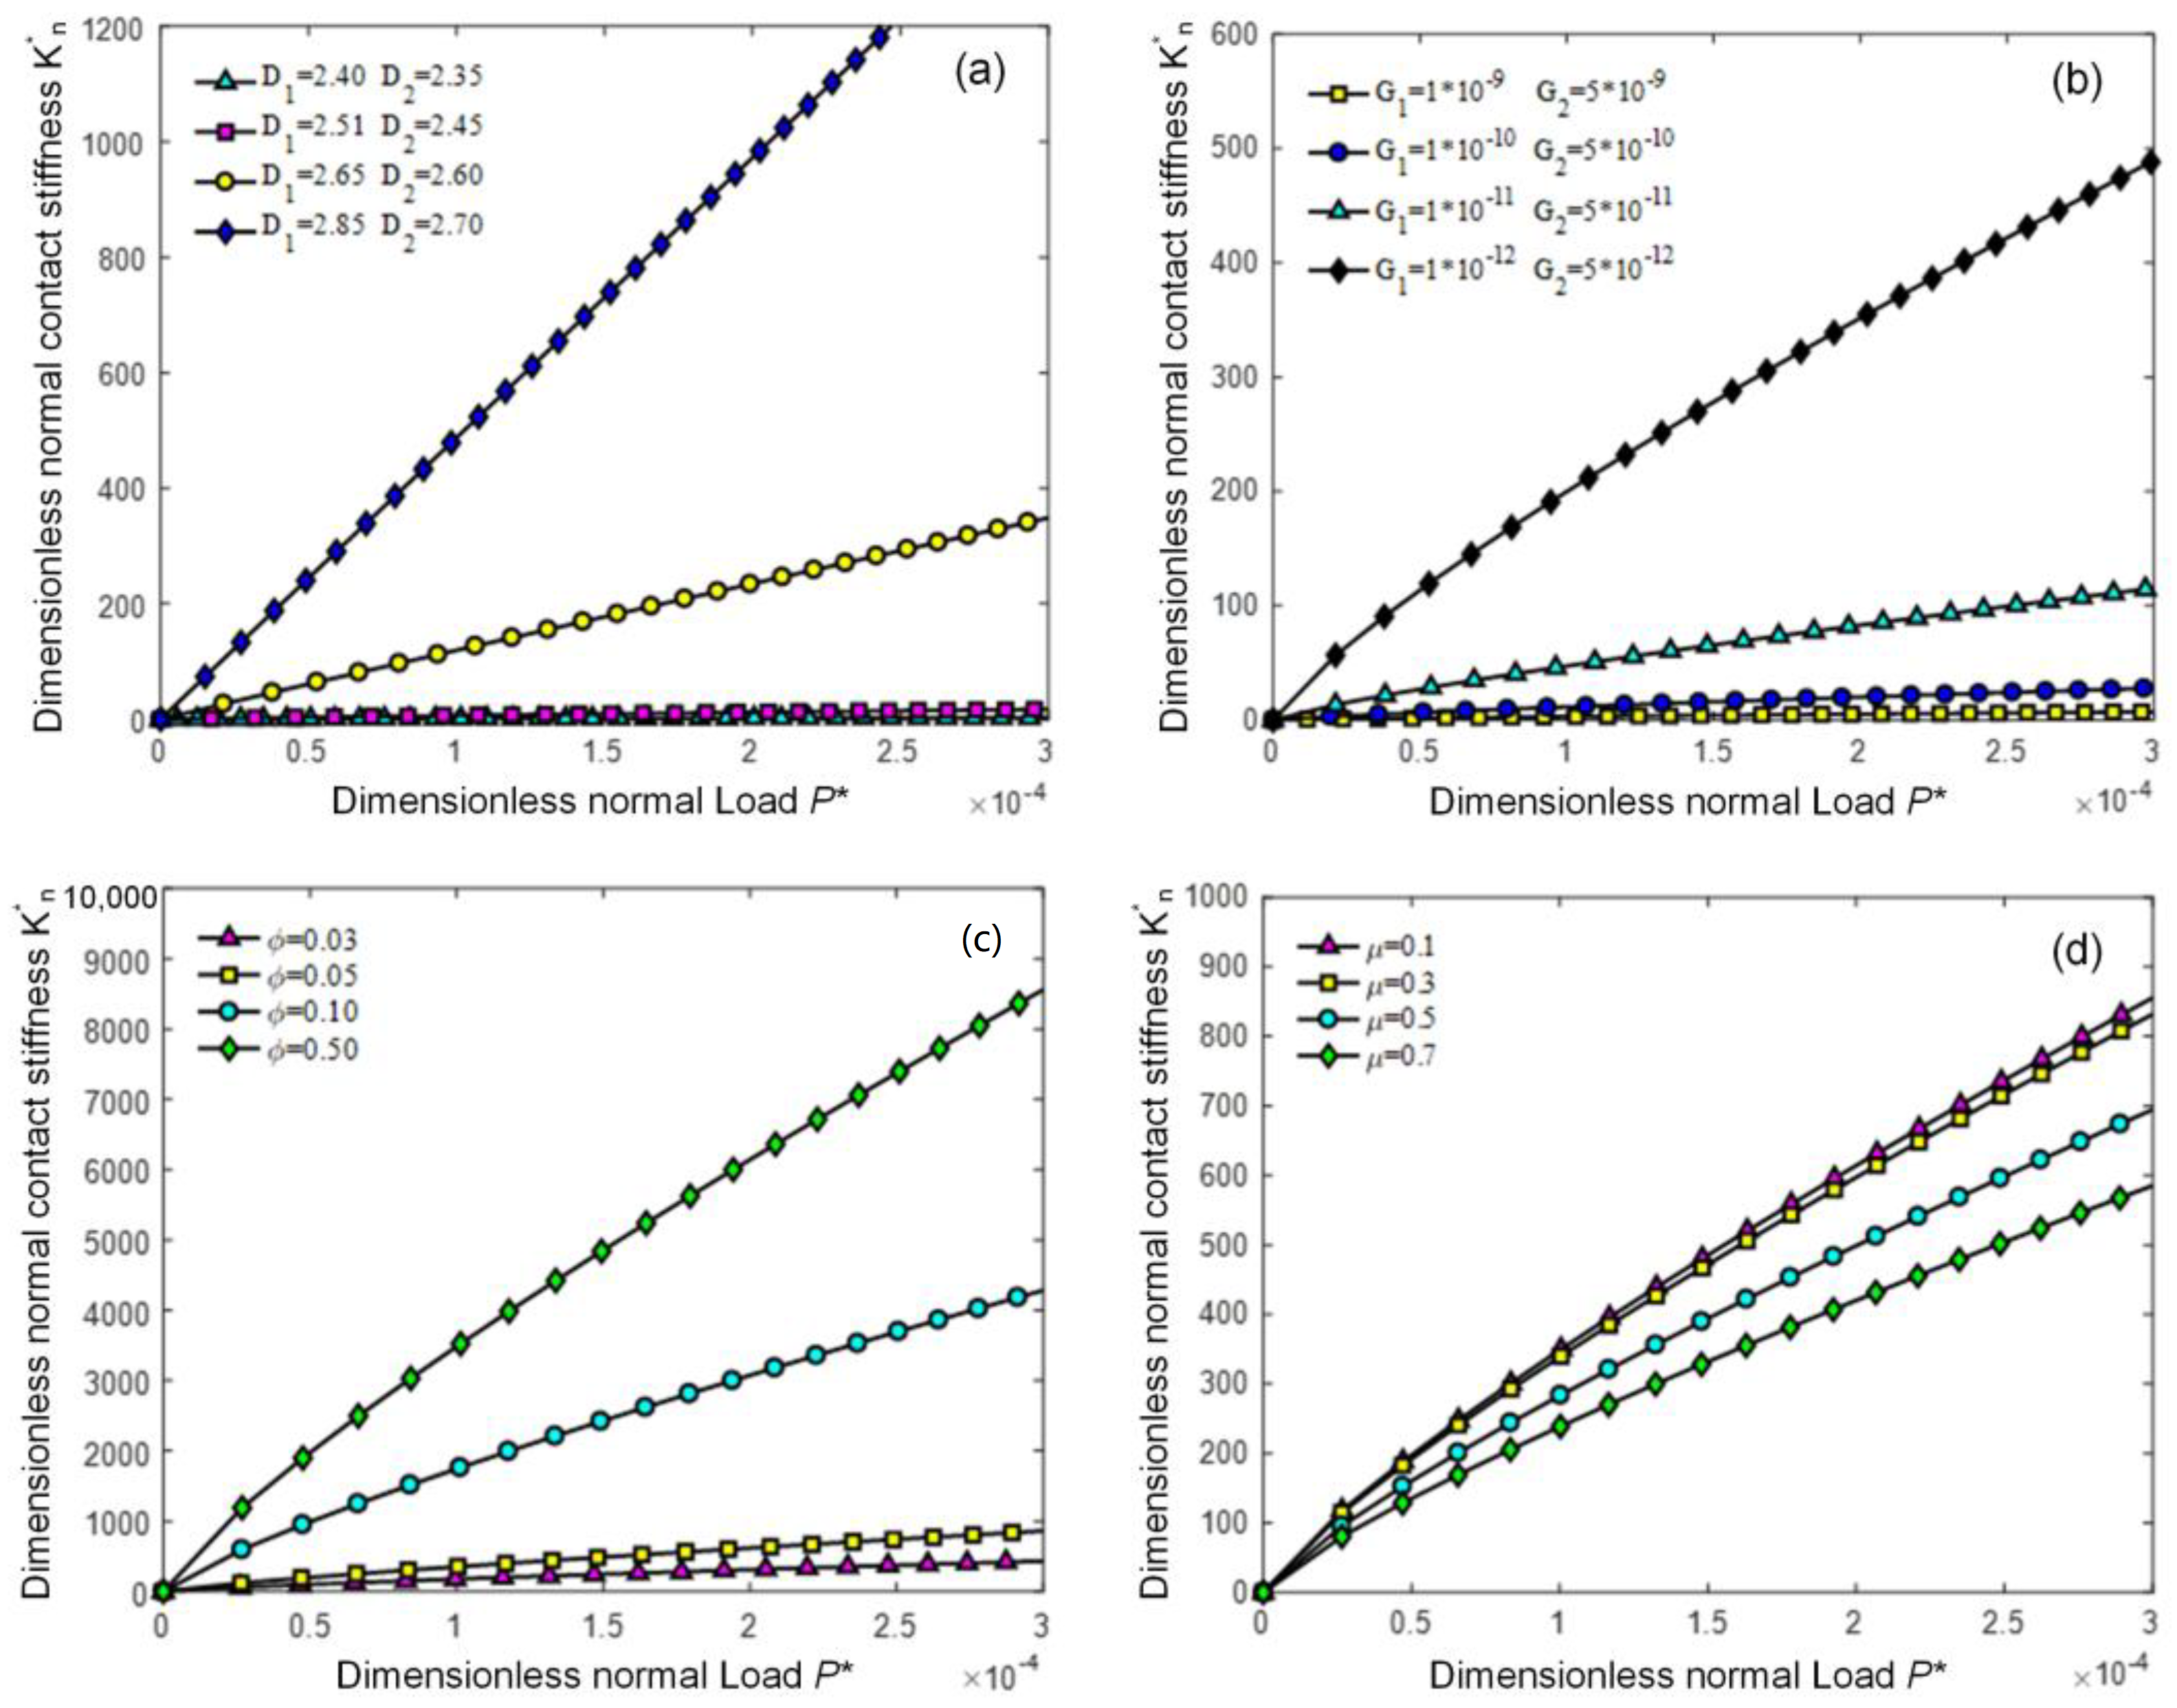
Figure 6a shows the relationship between the dimensionless normal contact stiffness and the dimensionless normal load of the bi-fractal surface joint under different fractal dimensions. It can be seen from Figure 6a that when the fractal dimension is constant, the normal contact stiffness of the joint increases approximately linearly with an increase in the normal load. Because when fractal parameters are constant, the actual contact area of the joint increases with an increase in the normal load, and the elastic critical contact area of the asperity does not change. This means that the elastic deformed asperity increases, so that the normal contact stiffness of the joint becomes larger; in the case where the normal load of the joint of the bi-fractal surface is constant, the normal contact stiffness of the joint increases with an increase in the fractal dimension.
Figure 6b shows the relationship between the dimensionless normal contact stiffness and the dimensionless normal load of the bi-fractal surface joint under different dimensionless scaling parameters. It can be seen from Figure 6b that when the scaling parameter is constant, the normal contact stiffness of the joint increases approximately linearly with an increase in the normal load. Because when the scaling parameter is constant, the actual contact area of the joint increases as the normal load increases and the elastic critical contact area of the asperity does not change, thus the contact area of the corresponding elastic deformation portion also increases. Therefore, the normal contact stiffness of the joint becomes larger; when the normal load of the joint is constant, the normal contact stiffness of the joint decreases as the scaling parameter increases because the scaling parameter increase will increase the elastic critical contact area of the asperity, resulting in a decrease in the normal contact stiffness of the joints.
Figure 6c shows the relationship between the dimensionless normal contact stiffness and the dimensionless normal load of the bi-fractal surface joint under different material parameters. It can be seen from Figure 6c that in the case where the normal load of the joint is constant, the normal contact stiffness of the joint increases with an increase in the material parameter, because the increasing material parameter means the yield strength of the softer material becomes larger. The increase in the yield strength of the softer material reduces the critical contact area of the asperity, resulting in an increase in the percentage of elastic deformation of the joint asperity; thereby, the contact stiffness increases.
Figure 6d shows the relationship between the dimensionless normal contact stiffness and the dimensionless normal load of the bi-fractal surface joint under different friction factors. It can be seen from Figure 6d that in the case where the normal load of the joint is constant, the normal contact stiffness of the joint decreases with an increase in the friction factor, and the deceleration is large when the friction factor is large. Therefore, in the calculation of the normal contact stiffness of the joint, the friction factor should not be ignored, especially the large friction factors.

4. Validity Verification of Model

In order to validate the effectiveness of the contact stiffness model proposed in this paper, the fractal parameters in the theoretical calculation expression of the normal contact stiffness for the bi-fractal surface joint are obtained through the structural function method, and the normal contact stiffness theoretical value of the bi-fractal surface joint is obtained based on Section 2. Then the experimental value of the normal contact stiffness obtained through the dynamic characteristic identification experiment of the rail slider joint. Finally, the theoretical and experimental results are compared and analyzed.

4.1. Experimental Equipment and Principle

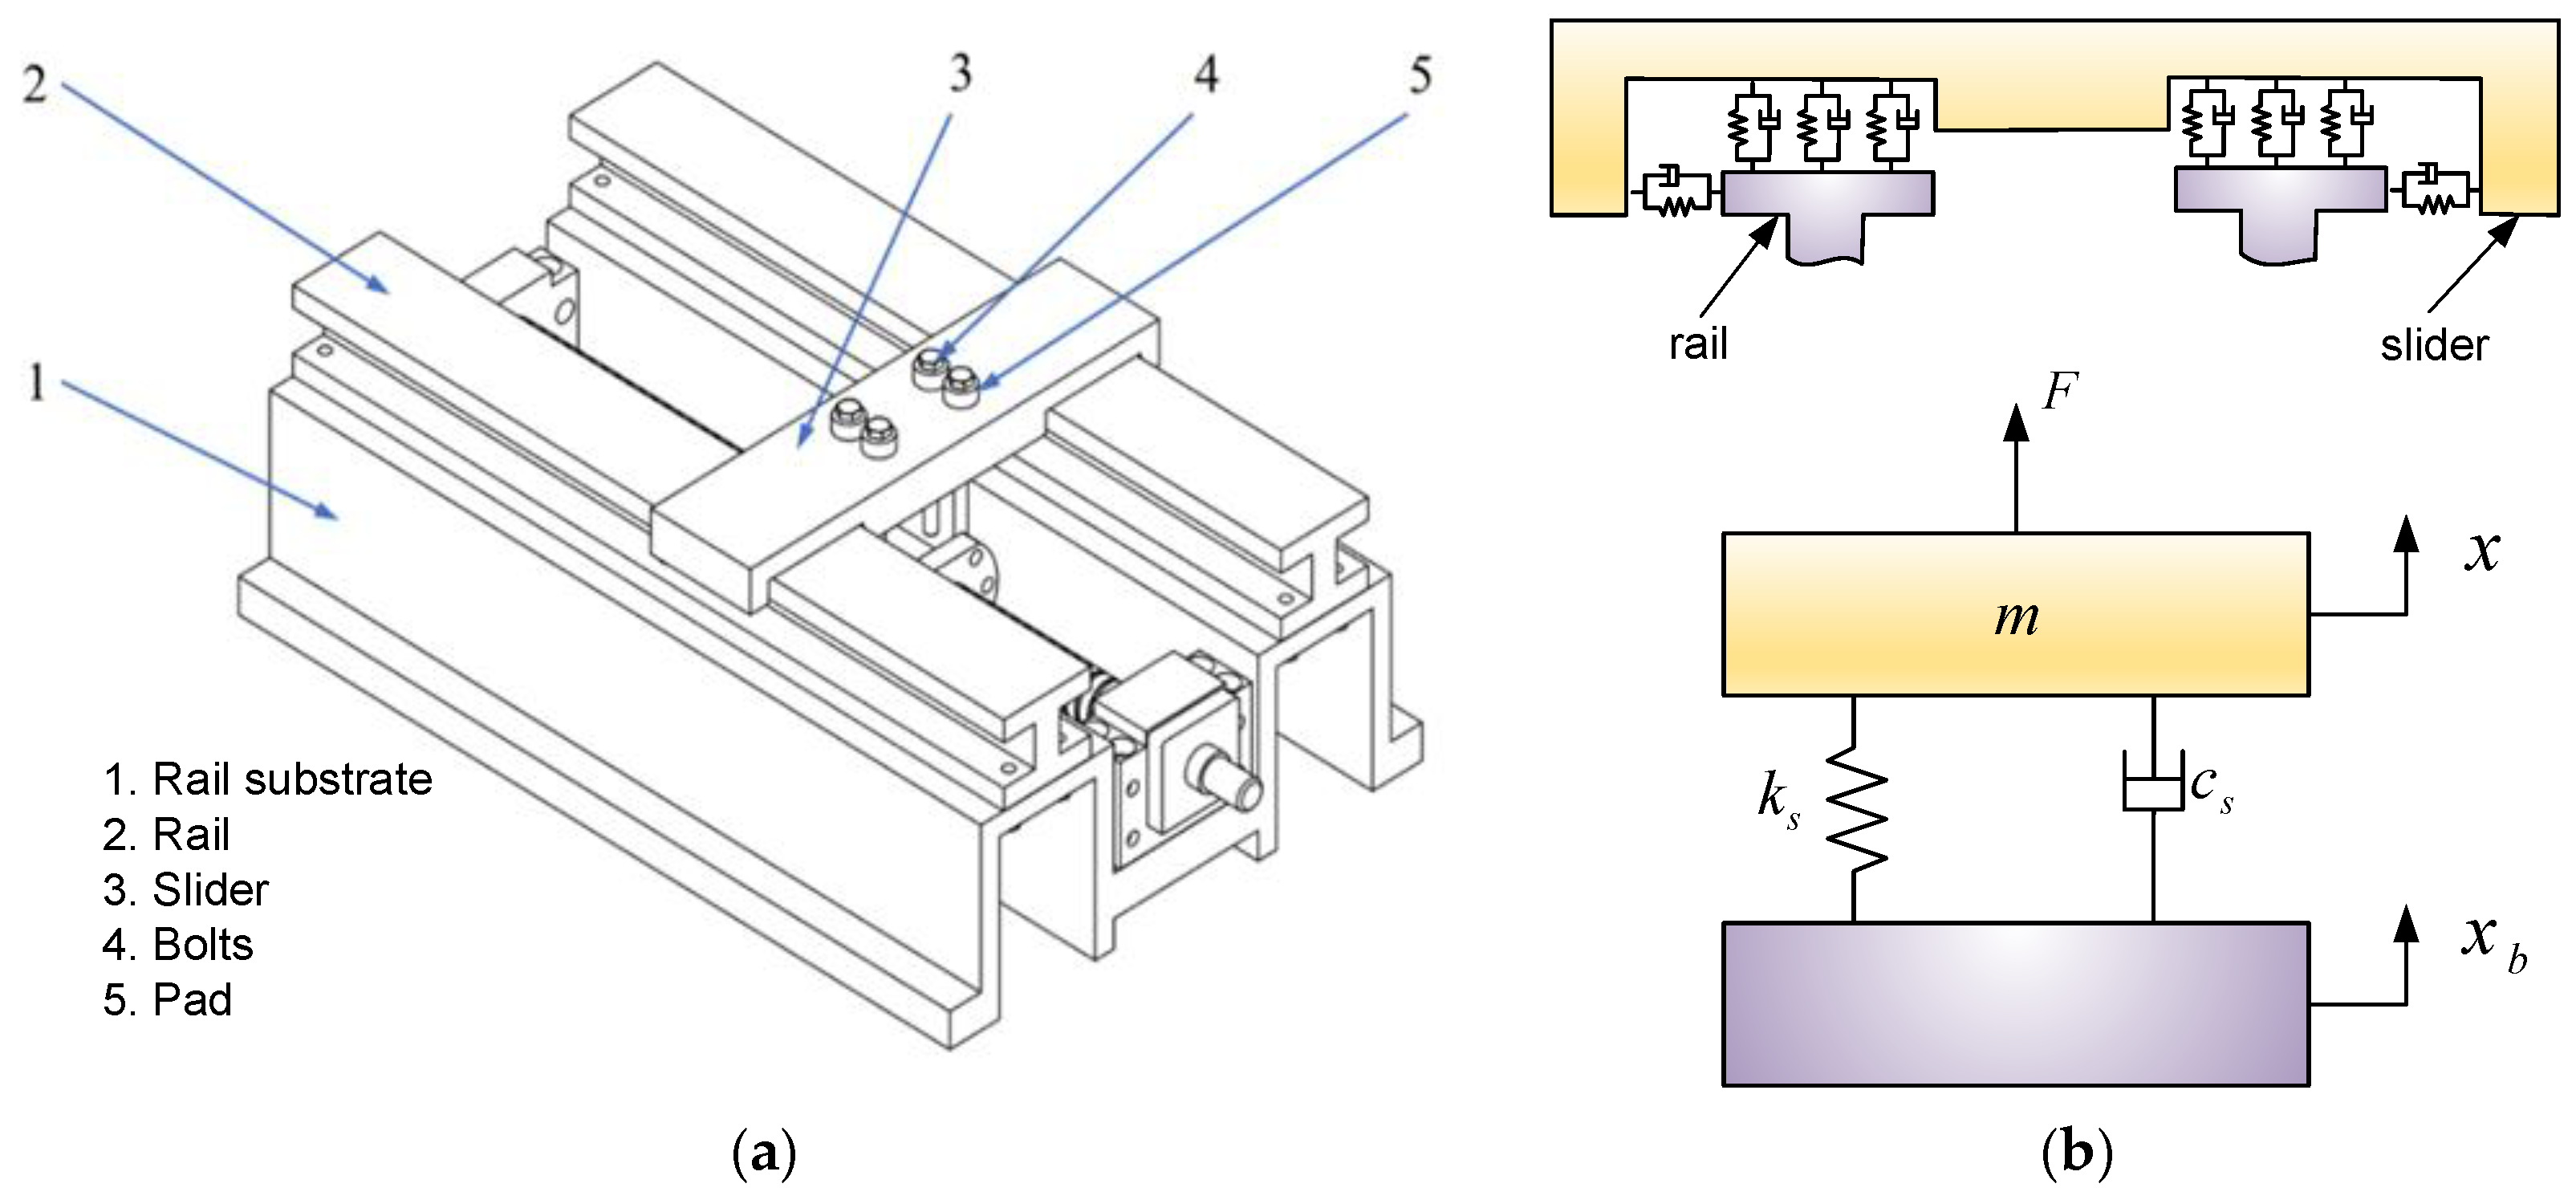
The schematic diagram of the rail slider joint is shown in Figure 7a. The material of the test platform rail base is HT300, the slider material is 45#steel, and the slider is used as the mass block. During the experimental testing, the normal load on the rail slider joint is changed by changing the pre-tightening force of the bolts on the slider. The joint characteristic parameter identification experiment uses the guide rail slider joint surface, and the guide rail slide test bench can be equivalent to a single degree of freedom vibration system, as shown in Figure 7b, k s and c s represents the equivalent stiffness and equivalent damping of the joint, respectively.
In the dynamic characteristic identification experiment of the joint, the normal excitation force is applied to the mass, and the motion equation of the mass under the excitation force can be expressed as follows [28]:
m x ¨ ( t ) + c s [ x ˙ ( t ) x ˙ b ( t ) ] + k s [ x ( t ) x b ( t ) ] = f ( t )
The equivalent frequency response function of the joint surface can be expressed as follows:
H ( ω ) = H X X b ( ω ) 1 m ω 2 [ k k · H X X b ( ω ) H X ( ω ) ]
In the dynamic characteristic parameter identification experiment of the joint, the FRF H X ( ω ) of the mass block and the FRF H X b ( ω ) of the fundamental are collected, and then the vector difference of the mass block and the fundamental FRF H X X b ( ω ) is calculated, and the FRF H ( ω ) of the equivalent single degree of freedom vibration system is obtained by Equation (39). Therefore, the contact stiffness of the joint can be obtained.

4.2. Solution of Surface Fractal Parameters

The two contact surfaces of the joint have bi-fractal characteristics. The contact stiffness analytical model of the bi-fractal surface joint needs to identify the fractal parameters of the two contact surfaces, and the structural function method is used to calculate the equivalent fractal parameters of the joint.
The structural function of a rough surface can be expressed as follows [29]:
S ( τ ) = z ( x + τ ) z ( x ) 2 = Γ ( 2 D 3 ) sin ( 2 D 3 ) π / 2 ( 4 2 D ) ln γ G 2 ( D 1 ) τ ( 4 2 D )
The linear equation of lg S ( τ ) lg τ is established on the double logarithmic coordinate system. The scaling parameter G and fractal dimension D can be calculated by the intercept of the straight line on the ordinate and the slope of the line, written as follows:
lg G = b lg Γ ( 2 D 3 ) sin ( 2 D 3 ) π / 2 / ( 4 2 D ) ln γ 2 ( D 1 )
D = 4 k 2
For the two rough surface contact problems of the mechanical joint, the structural function of the equivalent rough surface of the joint can be obtained by superposing the structural functions of the two rough contact surfaces, which can be expressed as follows:
S ( τ ) = S 1 ( τ ) + S 2 ( τ )
where S ( τ ) is the structural function of the equivalent rough surface of the joint; and S 1 ( τ ) and S 2 ( τ ) are the respective structural functions of the two contact surfaces. Therefore, according to Equations (41)–(43), the fractal parameters of the equivalent rough surface can be obtained.
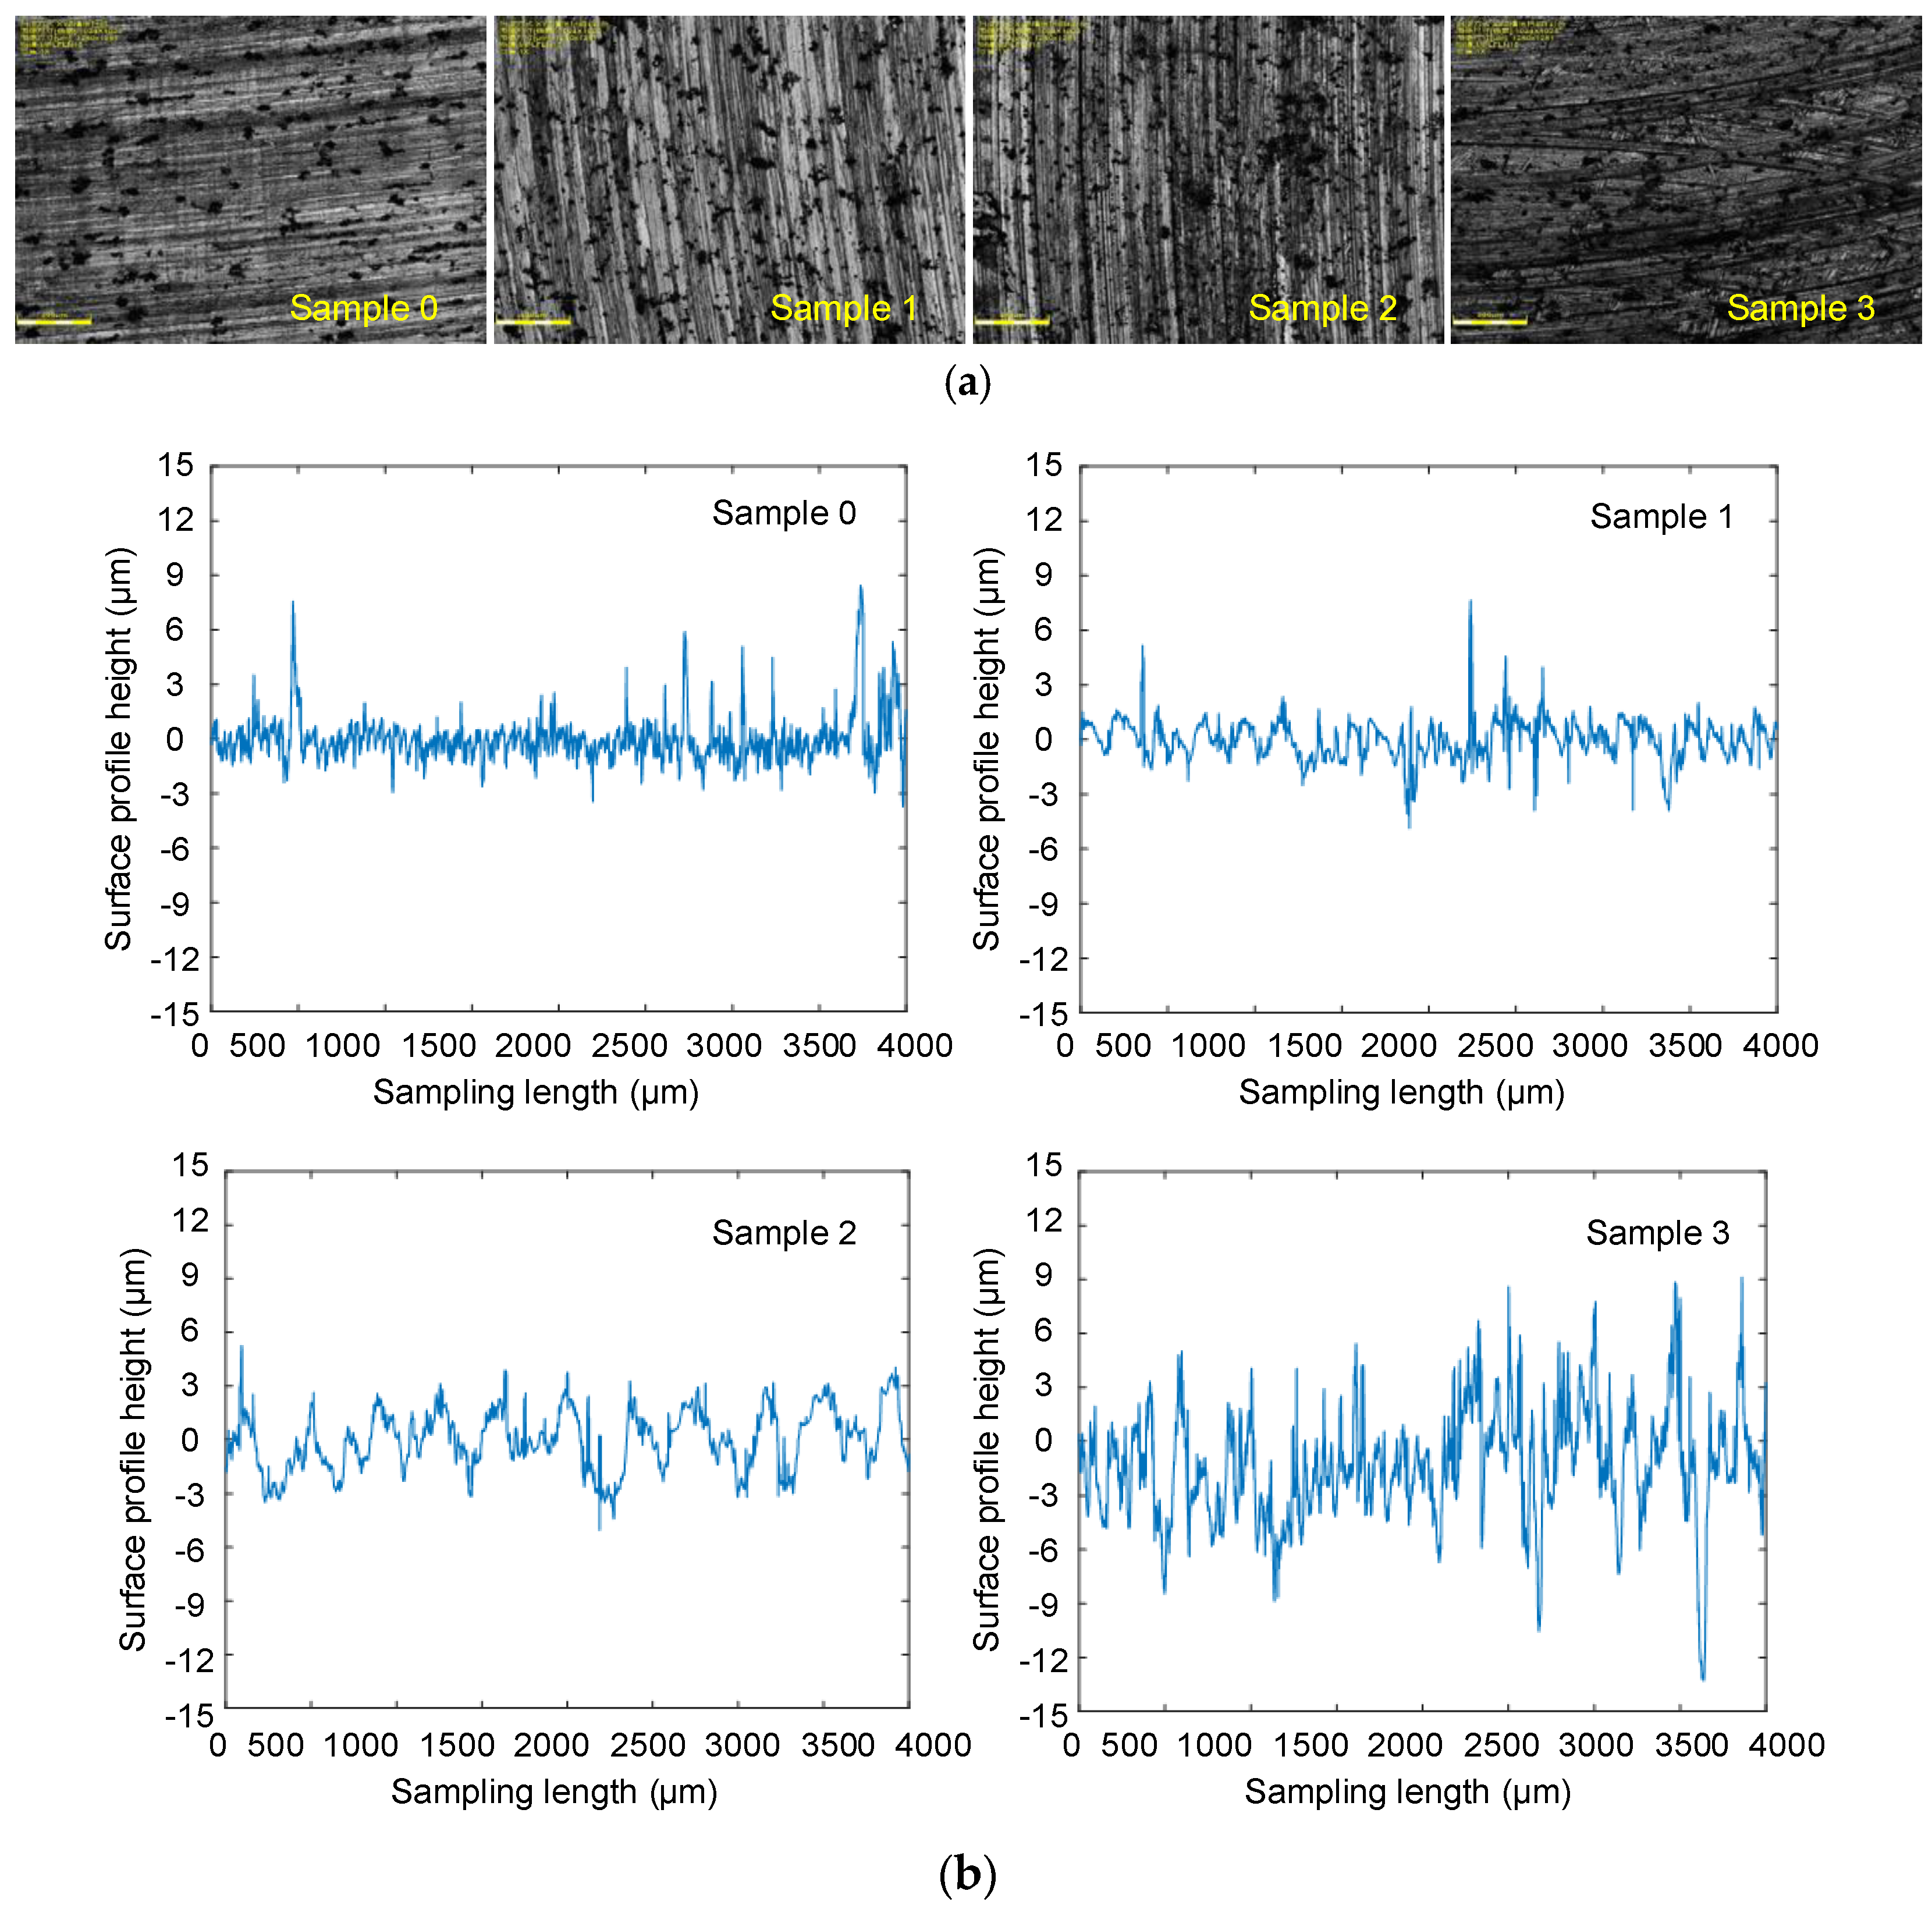
In order to verify the effectiveness of the model, the rough surface profile measurement of the three different sliders was measured with the Olympus LEXT OLS4100 laser digital scanning microscope (as shown in Figure 8). Since the actual slider surface topography profile cannot be measured directly on the measuring instrument, the test specimens with the same surface machining process as the rail and slider joint are fabricated. The relationship is as follows: the upper surface of the rail corresponds to the surface topography of sample 0, and the inner groove surfaces of sliders 1, 2, and 3 correspond to the surface topography of samples 1, 2, and 3.
Figure 9 shows the test results for four sets of samples.
Since the joint is formed by the contact of two rough surfaces and the structural function of the equivalent rough surface of the joint can be obtained according to Equation (43). Figure 10 shows the equivalent structural functions of three joints. Fractal parameters are derived from the effective section of structural function with self-affinity. The scaling parameter and fractal dimension are calculated by the intercept and slope of the fitting curve of the effective part for the equivalent structure function. The relation between the three-dimensional fractal dimension and the two-dimensional fractal dimension is D = D s + 1 [30].
Table 1 shows the fractal dimension and scaling parameter values of the equivalent rough surface calculated from the equivalent structural functions of each joint. By substituting this parameter into the proposed model, the theoretical contact stiffness of the joint can be calculated. From Table 1, it can be seen that the fractal parameters of the joint are different under different roughness levels.

4.3. Dynamic Characteristics Identification Experiment

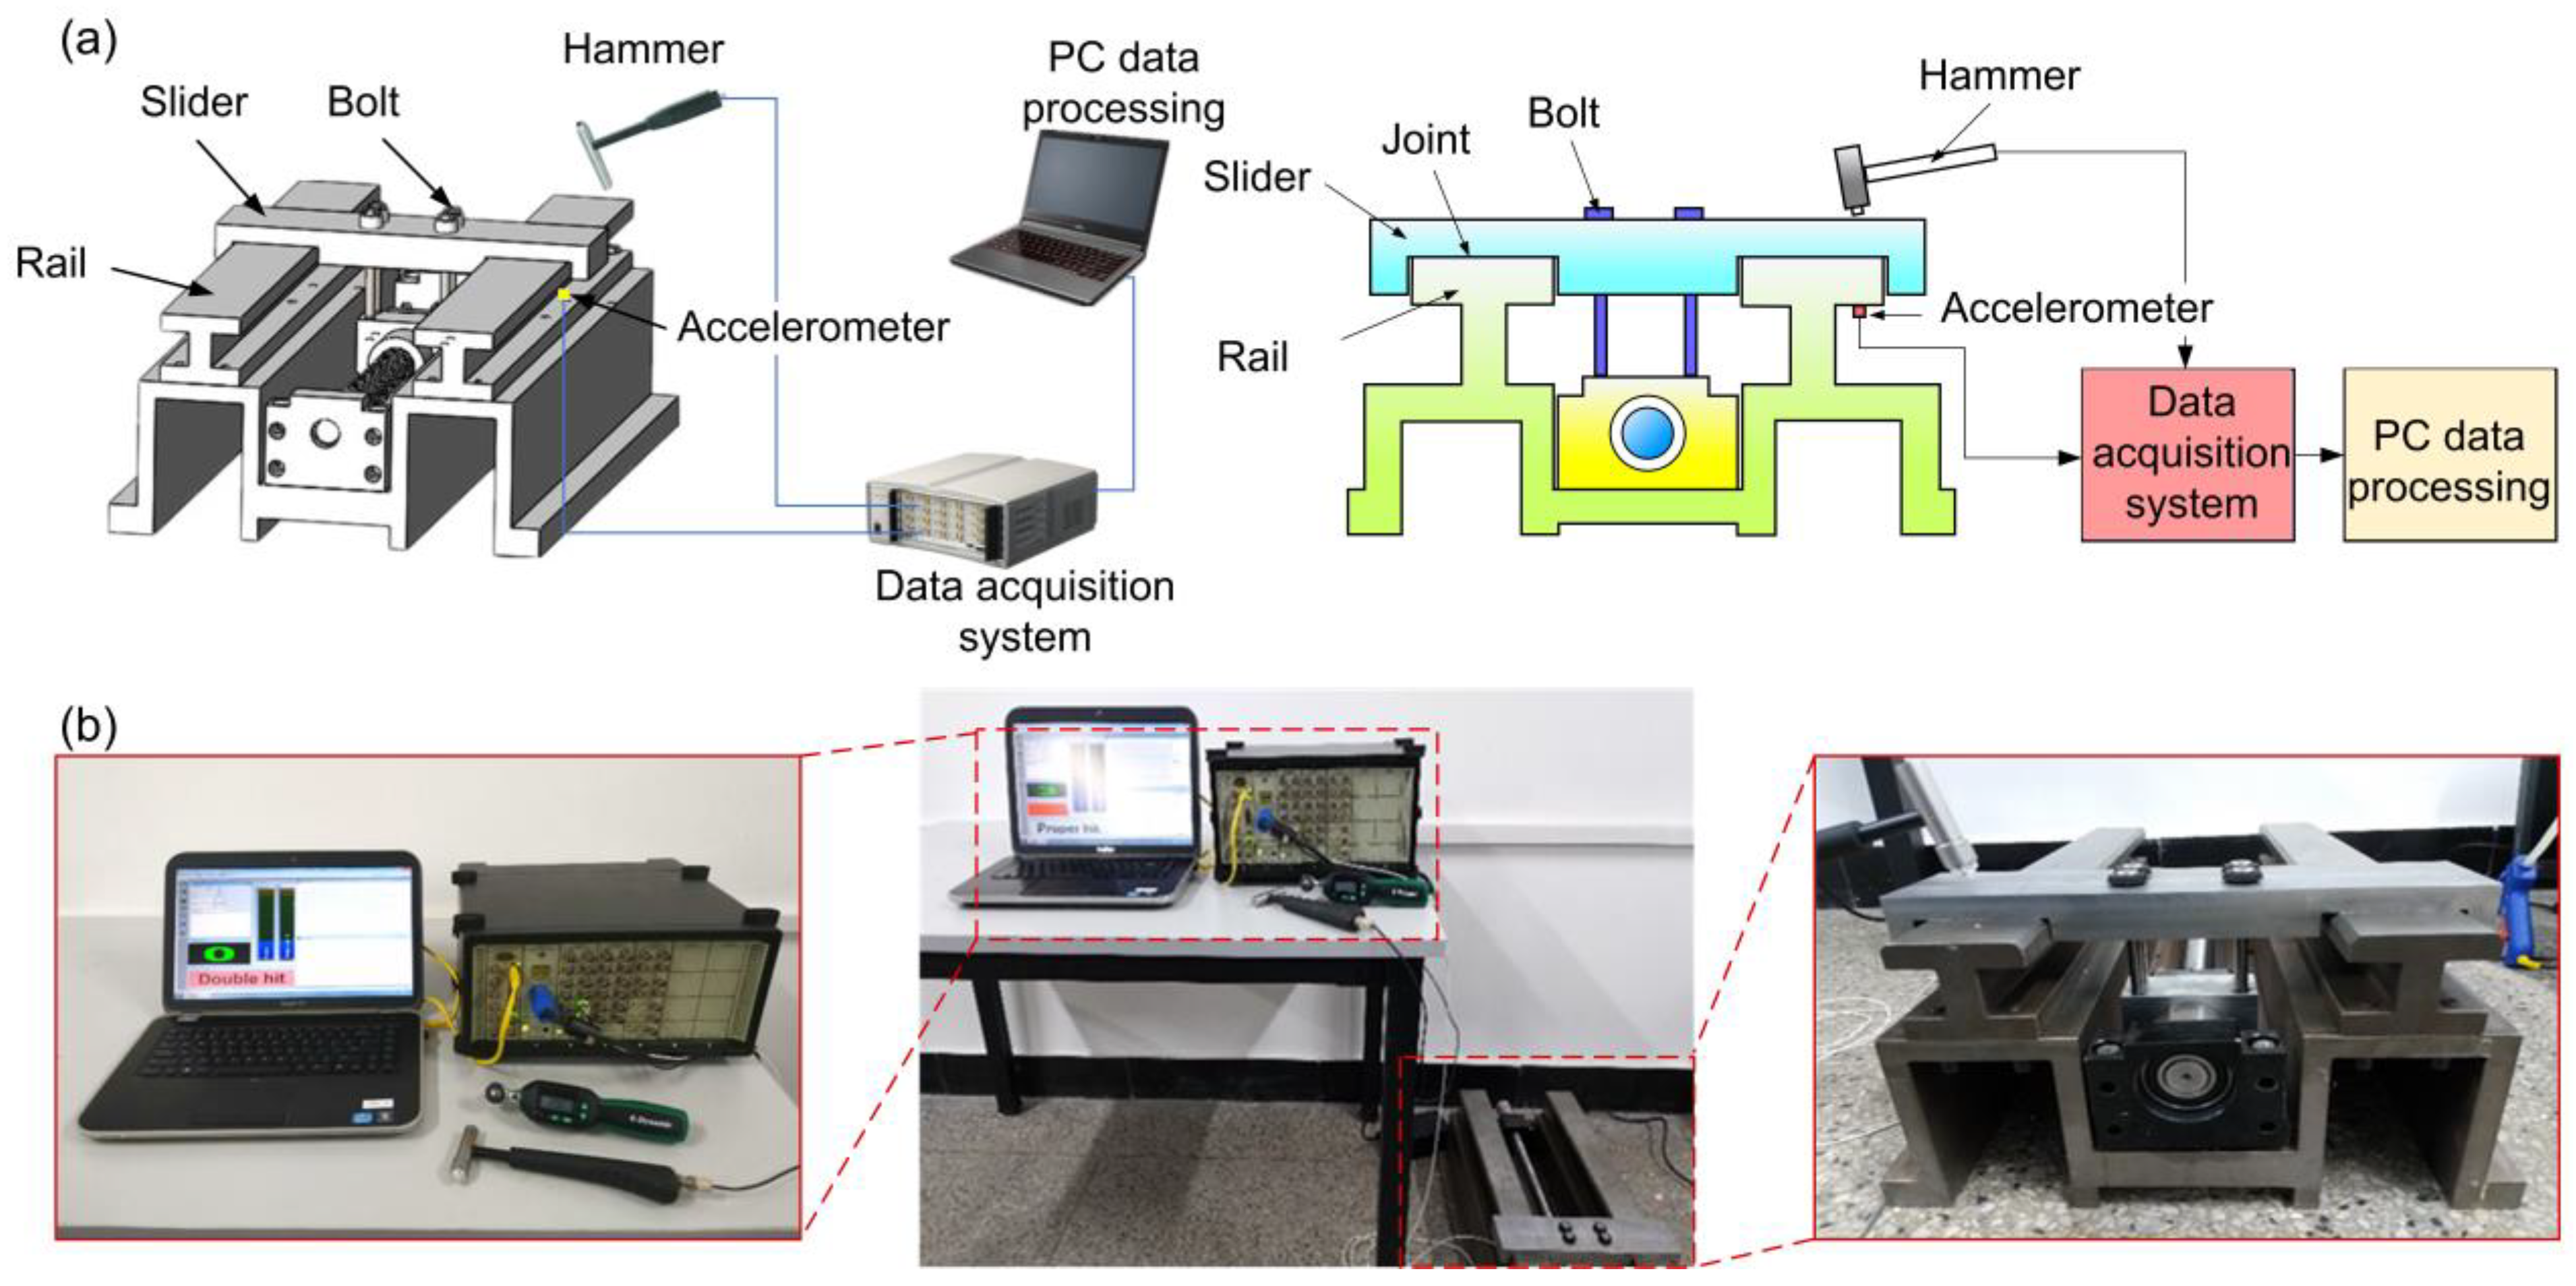
The test principle is shown in Figure 11a, and the test process is shown in Figure 11b. During the experiment, a digital torque wrench is used to change the torque of the loading bolt to change the normal load. The excitation force hammer is applied to the joint, and the response signal is picked up by the acceleration sensor and transmitted to the data acquisition system. The collected signal is analyzed by the computer to obtain the frequency response function of the system. Finally, the dynamic characteristic parameters of the joint are calculated by the peak resonance method and the half-power method.
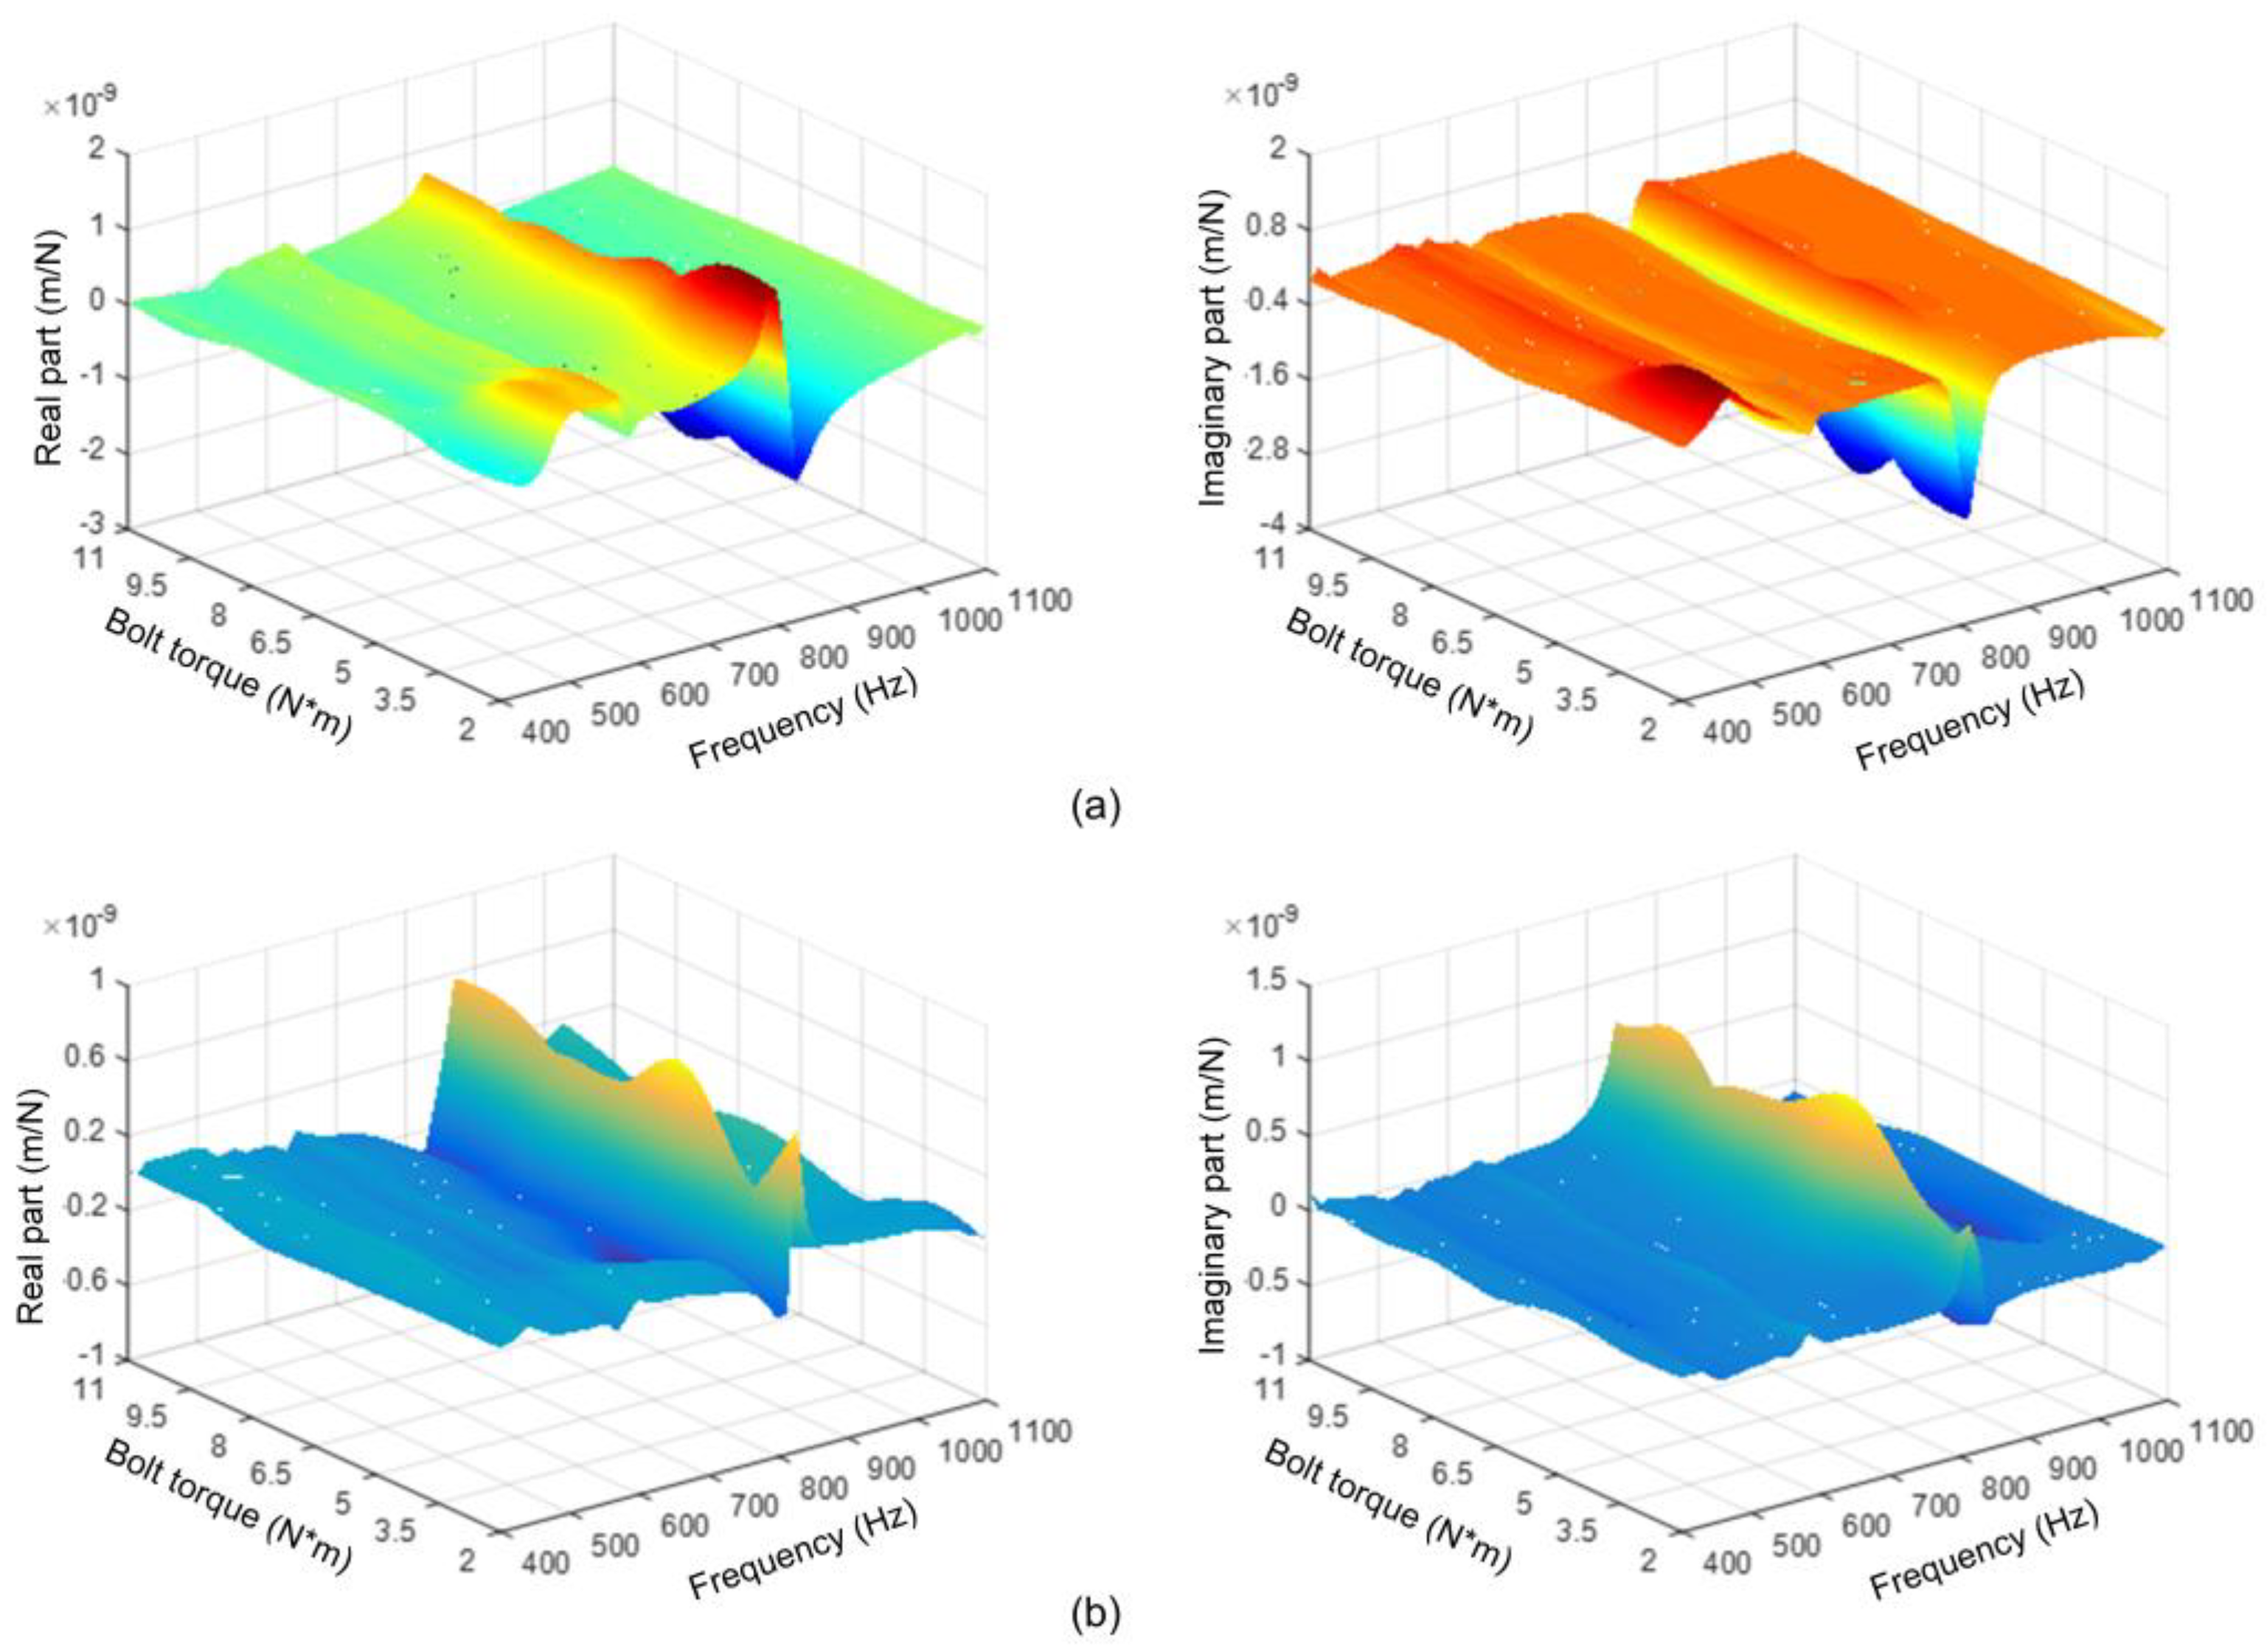
Figure 12a,b show the FRF diagrams of the slider and foundation structure of joint 1 under different normal loads, respectively. The equivalent FRF test results of the three joints are shown in Figure 13.
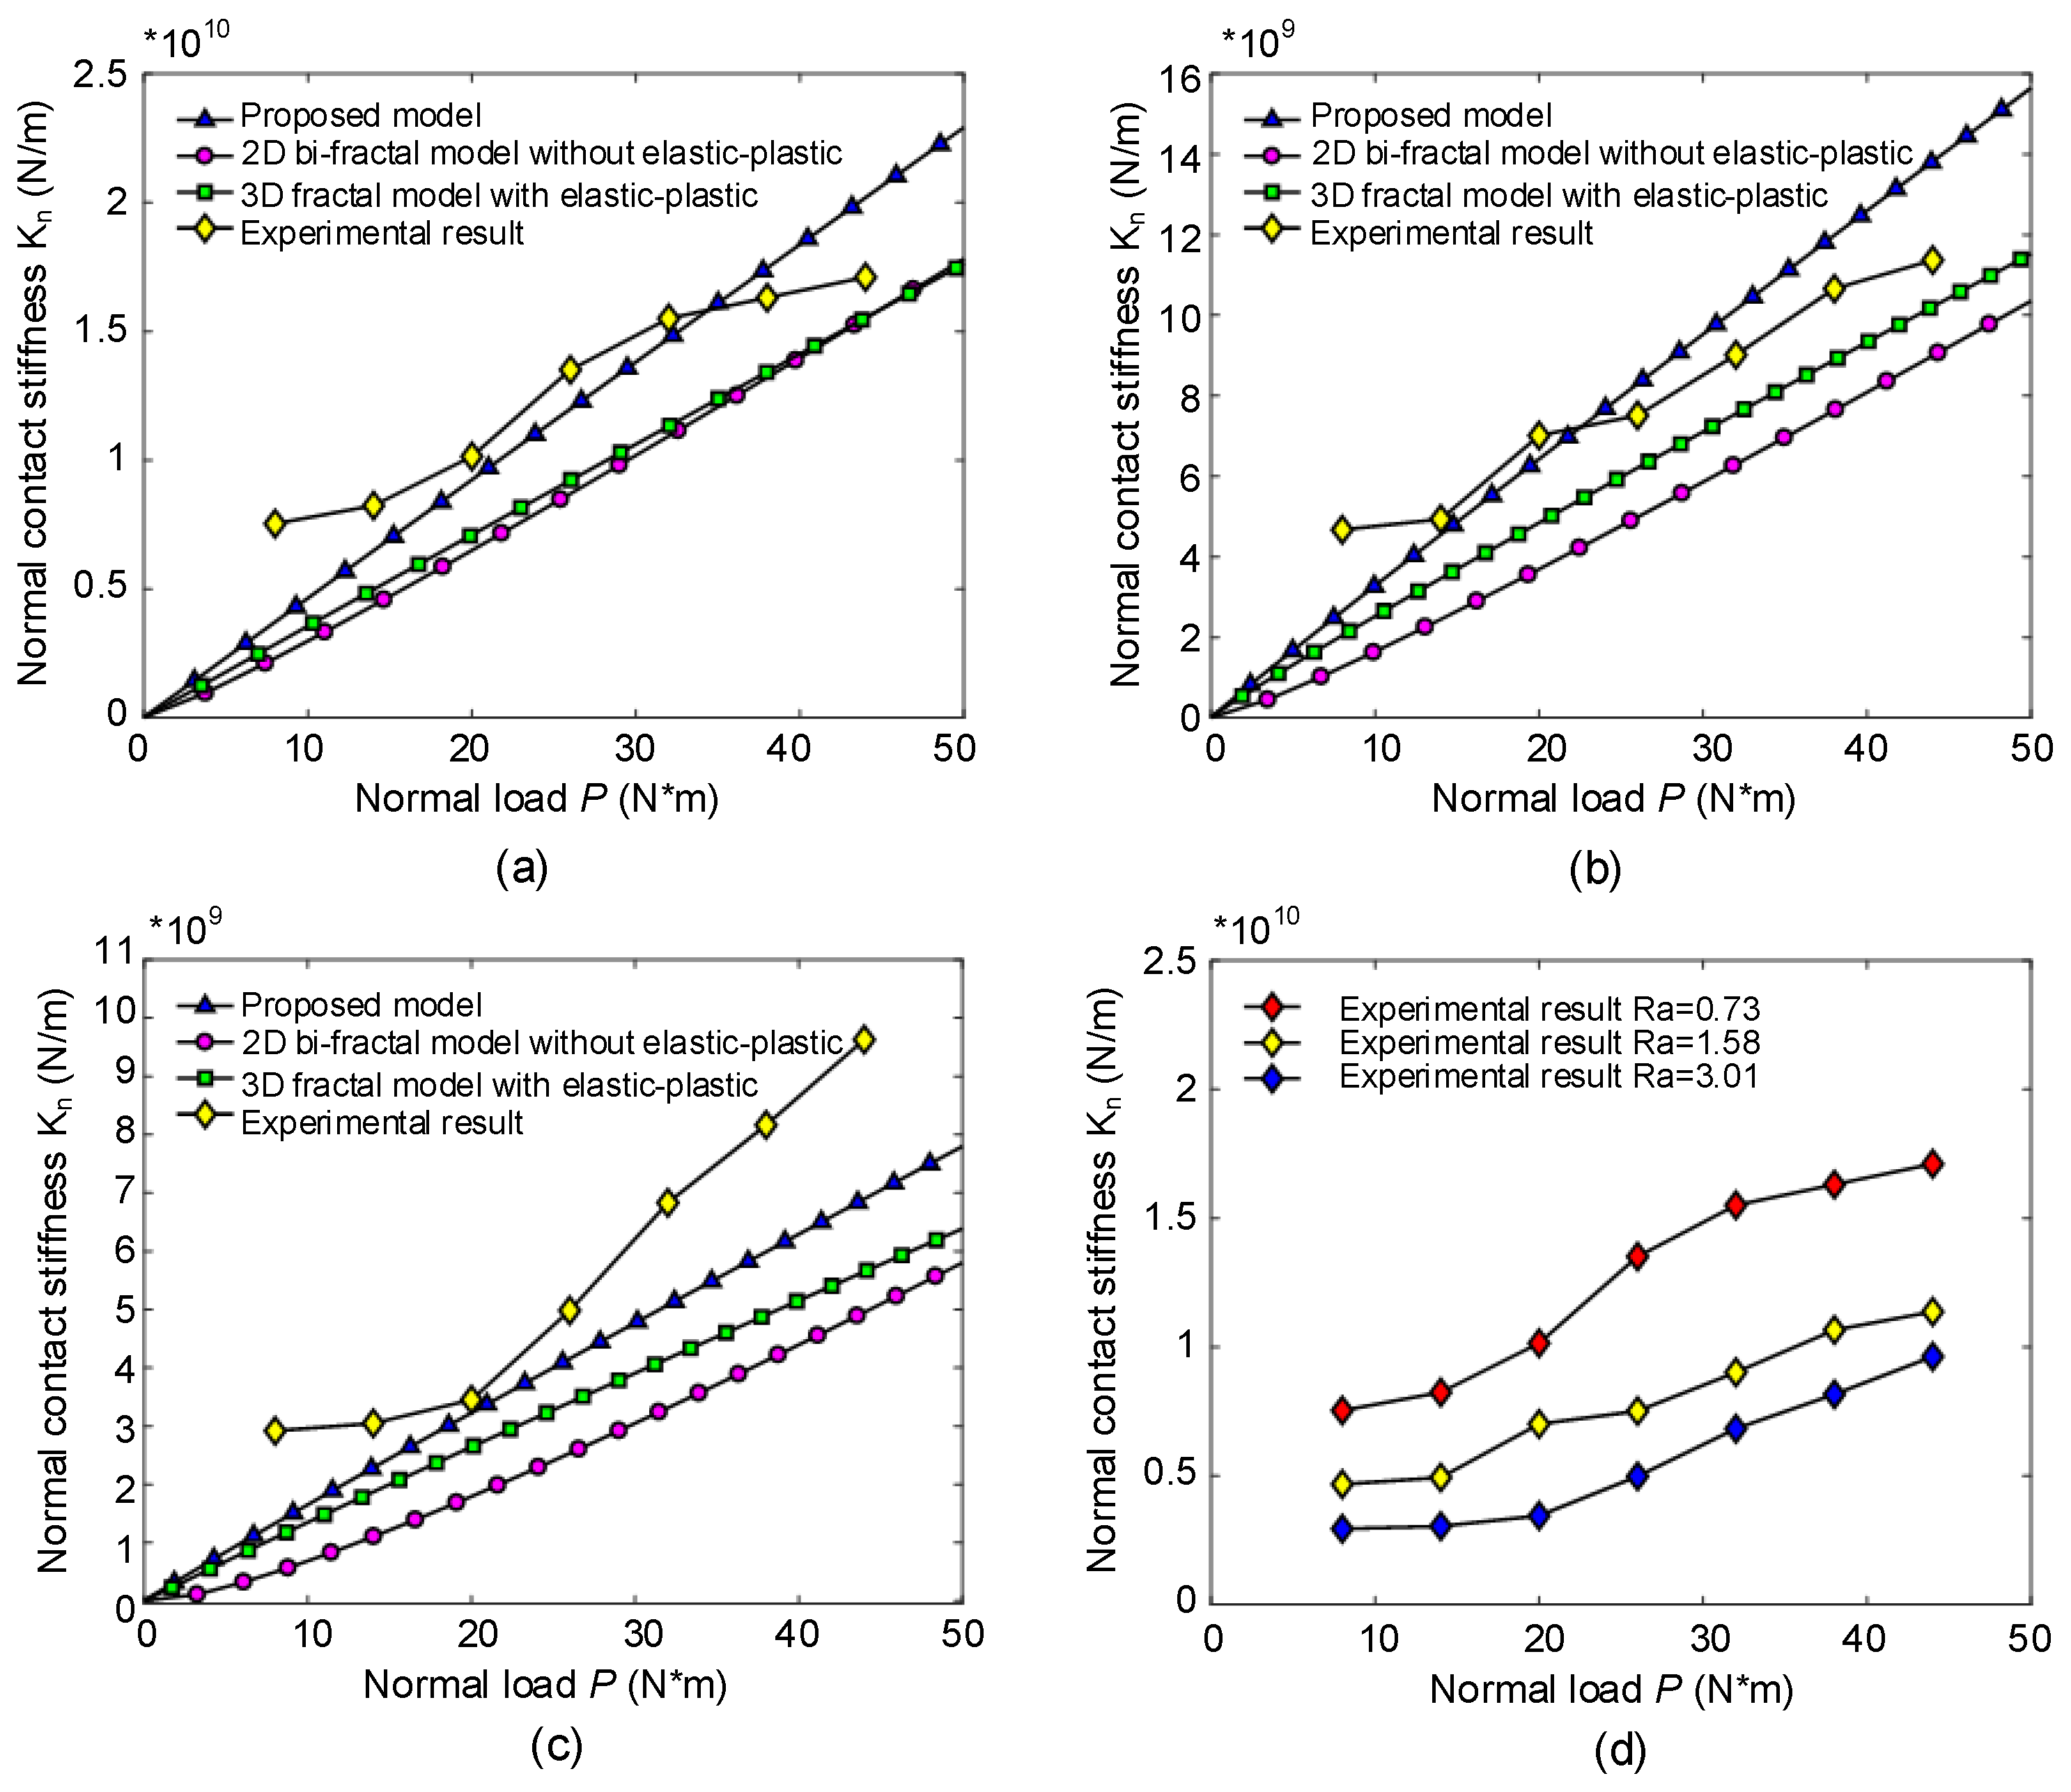
The experimental value of the contact stiffness of the joint can be calculated from Figure 13 and Equation (39). Figure 14 is the experimental results of the normal contact stiffness for the joint compared with the theoretical values of the model proposed in this paper and the other fractal model. From Figure 14, it can be seen that the experimental value of the normal contact stiffness for the joint increases with an increase in the normal load, which is consistent with the theoretical prediction trend. At the same time, it can be seen that considering the elastic–plastic deformation of asperity, the theoretical calculation results are more in line with the experimental values, which also indicates that the existence of elastic–plastic deformation stages on asperity and the generation of normal contact stiffness is reasonable. By comparing the three-dimensional fractal model (with elastic–plastic deformation of asperity) with the model proposed in this paper, it can be found that the bi-fractal model is more accurate in predicting the normal contact stiffness of the joint due to its ability to accurately characterize the true fractal characteristics of the rough surface at the joint. Figure 14d shows the experimental results of the normal contact stiffness of the joint under different roughness levels. From Figure 14d, it can be seen that under constant normal load, as the roughness of the joint contact surface increases, the normal contact stiffness of the joint gradually decreases. This is because under the same normal load, an increase in the roughness of the joint contact surface means a decrease in the actual contact area, which in turn reduces the normal contact stiffness of the joint.
Taking Joint 1 as an example, an error analysis was conducted on the normal contact stiffness model established in this paper. Table 2 shows the experimental results and theoretical predicted values of the normal contact stiffness of the joint under different normal loads. From Table 2, it can be seen that the experimental error is larger when the load is small or large. Under moderate loads, the theoretical calculation values of the model established in this paper are more consistent with the experimental results, with an average error of less than 15%.

5. Conclusions

The normal contact stiffness of the bi-fractal surface joints is proposed in this paper, which takes into account the effects of elastoplastic deformation of the asperity and friction factor. Through numerical simulation and experimental verification, the following conclusions are obtained:
(1)
Fractal dimension and scaling parameter are the main factors affecting the topography of the bi-fractal surface. The roughness of the bi-fractal surface decreases with the increase in the fractal dimension and the decrease in the scaling parameters.
(2)
The true contact area of the bi-fractal surface joint increases linearly with an increase in the normal load, increases first and then decreases with an increase in the fractal dimension, and monotonously increases with a decrease in the scaling parameter.
(3)
The normal contact stiffness of the bi-fractal surface joint is affected by fractal parameters, material properties, friction factor, and applied loads. The normal contact stiffness of the joint increases with an increase in the normal load. When the normal load is constant, the increase in the fractal dimension and the material properties are beneficial for increasing the joint contact stiffness of the joint. A reduction in the scaling parameter and friction factor increases the normal contact stiffness of the joint.
(4)
By comparing the traditional fractal model with the proposed model, it can be found that the bi-fractal model is more accurate in characterizing the true fractal features of the rough surface of the joint, so the theoretical calculation of this normal contact stiffness of the joint is more consistent with the experimental results.
It should be pointed out that the normal contact stiffness model of bi-fractal surface joints established in this study is expected to be further analyzed in the joint with oil media.

Author Contributions

P.X.: writing—original draft preparation, investigation, methodology, and validation; L.Z.: writing—review and editing, and funding acquisition; X.C.: funding acquisition and writing—review and editing. All authors have read and agreed to the published version of the manuscript.

Funding

The project is supported by the National Natural Science Foundation of China (No. 52274158 and No. 52375412), the Fundamental Research Funds for Central Universities (N2203011).

Data Availability Statement

Data are contained within the article.

Conflicts of Interest

The authors declare no conflicts of interest.

References

  1. Zhao, P.; Liu, J.; Gong, H.; Xue, F. A novel calculation method for torsional stiffness of flange-spigot structure in aeroengine rotors. Tribol. Int. 2024, 195, 109601. [Google Scholar] [CrossRef]
  2. Pan, W.; Sun, Y.; Li, X.; Song, H.; Guo, J. Contact mechanics modeling of fractal surface with complex multi-stage actual loading deformation. Appl. Math. Model. 2024, 128, 58–81. [Google Scholar] [CrossRef]
  3. Yu, X.; Sun, Y.; Wu, S. A complete deterministic model of point contact mixed lubrication coupling dual-mode effects of surface fractal characteristics. Int. J. Non-Linear Mech. 2024, 161, 104669. [Google Scholar] [CrossRef]
  4. Sun, Z.; Chen, S.; Tang, J.; Hu, Z.; Tao, X.; Wang, Q.; Yang, S.; Jiang, P. New deterministic model for calculating mesh stiffness and damping of rough-surface gears considering elastic–plastic contact and energy-dissipation mechanism. Mech. Syst. Signal Process. 2024, 216, 111502. [Google Scholar] [CrossRef]
  5. Shen, F.; Li, Y.-H.; Ke, L.-L. A novel fractal contact model based on size distribution law. Int. J. Mech. Sci. 2023, 249, 108255. [Google Scholar] [CrossRef]
  6. Zhao, Y.; Zhao, C.; Wang, L.; Wang, P. A rail corrugation evaluation method using fractal characterization based on structure function method. Wear 2022, 506-507, 204454. [Google Scholar] [CrossRef]
  7. Xiao, H.; Sun, Y.; Chen, Z. Fractal modeling of normal contact stiffness for rough surface contact considering the elastic–plastic deformation. J. Braz. Soc. Mech. Sci. Eng. 2019, 41, 11. [Google Scholar] [CrossRef]
  8. Yu, X.; Sun, Y.; Wu, S. Multi-stage contact model between fractal rough surfaces based on multi-scale asperity deformation. Appl. Math. Model. 2022, 109, 229–250. [Google Scholar] [CrossRef]
  9. Zhao, Z.; Han, H.; Wang, P.; Ma, H.; Zhang, S.; Yang, Y. An improved model for meshing characteristics analysis of spur gears considering fractal surface contact and friction. Mech. Mach. Theory 2021, 158, 104219. [Google Scholar] [CrossRef]
  10. Pan, W.; Li, X.; Wang, L.; Guo, N.; Mu, J. A normal contact stiffness fractal prediction model of dry-friction rough surface and experimental verification. Eur. J. Mech. A/Solids 2017, 66, 94–102. [Google Scholar] [CrossRef]
  11. Zhao, J.; Lin, M.; Song, X.; Wei, N. A modeling method for predicting the precision loss of the preload double-nut ball screw induced by raceway wear based on fractal theory. Wear 2021, 486-487, 204065. [Google Scholar] [CrossRef]
  12. Xiong, Y.; Zhou, Z.; Huang, K.; Cheng, Z.; Han, G. An improved fractal model for tangential contact damping of high contact ratio gear considering friction effect. Chaos. Solitons Fractals 2021, 153, 111510. [Google Scholar] [CrossRef]
  13. Guan, D.; Jing, L.; Hilton, H.H.; Gong, J.; Yang, Z. Tangential contact analysis of spherical pump based on fractal theory. Tribol. Int. 2018, 119, 531–538. [Google Scholar] [CrossRef]
  14. Guan, D.; Jing, L.; Gong, J.; Shen, H.; Hilton, H.H. Normal contact analysis for spherical pump based on fractal theory. Tribol. Int. 2018, 124, 117–123. [Google Scholar] [CrossRef]
  15. Liu, J.; Ma, C.; Wang, S.; Wang, S.; Yang, B. Contact stiffness of spindle-tool holder based on fractal theory and multi-scale contact mechanics model. Mech. Syst. Signal Process. 2019, 119, 363–379. [Google Scholar] [CrossRef]
  16. Zhang, Q.; Liu, Q.-A.; Mo, J.; Xiang, Z.; Wang, Q.; Zhai, C.; Zhu, S. Analysis of contact characteristics and dynamic response of joint interface with surface micro-grooved texture based on fractal theory. Mech. Syst. Signal Process. 2024, 218, 111553. [Google Scholar] [CrossRef]
  17. Bhushan, B.; Majumdar, A. Elastic-plastic contact model for bifractal surfaces. Wear 1992, 153, 53–64. [Google Scholar] [CrossRef]
  18. Borri, C.; Paggi, M. Topology simulation and contact mechanics of bifractal rough surfaces, Proceedings of the Institution of Mechanical Engineers. Part J J. Eng. Tribol. 2016, 230, 1345–1358. [Google Scholar] [CrossRef]
  19. Borri, C.; Paggi, M. Topological characterization of antireflective and hydrophobic rough surfaces: Are random process theory and fractal modeling applicable? J. Phys. D Appl. Phys. 2015, 48, 045301. [Google Scholar] [CrossRef]
  20. Hu, S.; Huang, W.; Shi, X.; Peng, Z.; Liu, X. Bi-fractal feature of bi-Gaussian stratified surfaces. Tribol. Int. 2019, 134, 427–434. [Google Scholar] [CrossRef]
  21. Meng, F.; Xia, H.; Zhang, X.; Wang, J.; Jin, Y. Study on nonlinear dynamic characteristics of gear system with 3D anisotropic rough tooth surface based on fractal theory. Int. J. Non-Linear Mech. 2023, 150, 104366. [Google Scholar] [CrossRef]
  22. Komvopoulos, K.; Ye, N. Three-dimensional contact analysis of elastic-plastic layered media with fractal surface topographies. J. Tribol. 2001, 123, 632–640. [Google Scholar] [CrossRef]
  23. Pan, W.; Li, X.; Wang, L.; Mu, J.; Yang, Z. A loading fractal prediction model developed for dry-friction rough joint surfaces considering elastic–plastic contact. Acta Mech. 2018, 229, 2149–2162. [Google Scholar] [CrossRef]
  24. Yu, X.; Sun, Y.; Liu, M.; Wu, S. Analytical description of the wear process using a multi-stage contact fractal approach. Wear 2024, 549, 205364. [Google Scholar] [CrossRef]
  25. Kogut, L.; Etsion, I. Elastic-plastic contact analysis of a sphere and a rigid flat. J. Appl. Mech. 2002, 69, 657–662. [Google Scholar] [CrossRef]
  26. Tian, H.; Zhong, X.; Zhao, C.; Zhao, X. One loading model of joint interface considering elastoplastic and variation of hardness with surface depth. J. Mech. Eng. 2015, 51, 90–104. [Google Scholar] [CrossRef]
  27. Čelič, D.; Boltežar, M. The influence of the coordinate reduction on the identification of the joint dynamic properties. Mech. Syst. Signal Process. 2009, 23, 1260–1271. [Google Scholar] [CrossRef]
  28. Liao, J.; Zhang, J.; Feng, P.; Yu, D.; Wu, Z. Identification of contact stiffness of shrink-fit tool-holder joint based on fractal theory. Int. J. Adv. Manuf. Technol. 2017, 90, 2173–2184. [Google Scholar] [CrossRef]
  29. Wu, J. Characterization of fractal surfaces. Wear 2000, 239, 36–47. [Google Scholar] [CrossRef]
  30. Liu, Z.; Jiang, K.; Zhang, C.; Zhao, Y.; Tian, Y. A stiffness model of a joint surface with inclination based on fractal theory. Precis. Eng. 2020, 62, 47–61. [Google Scholar] [CrossRef]
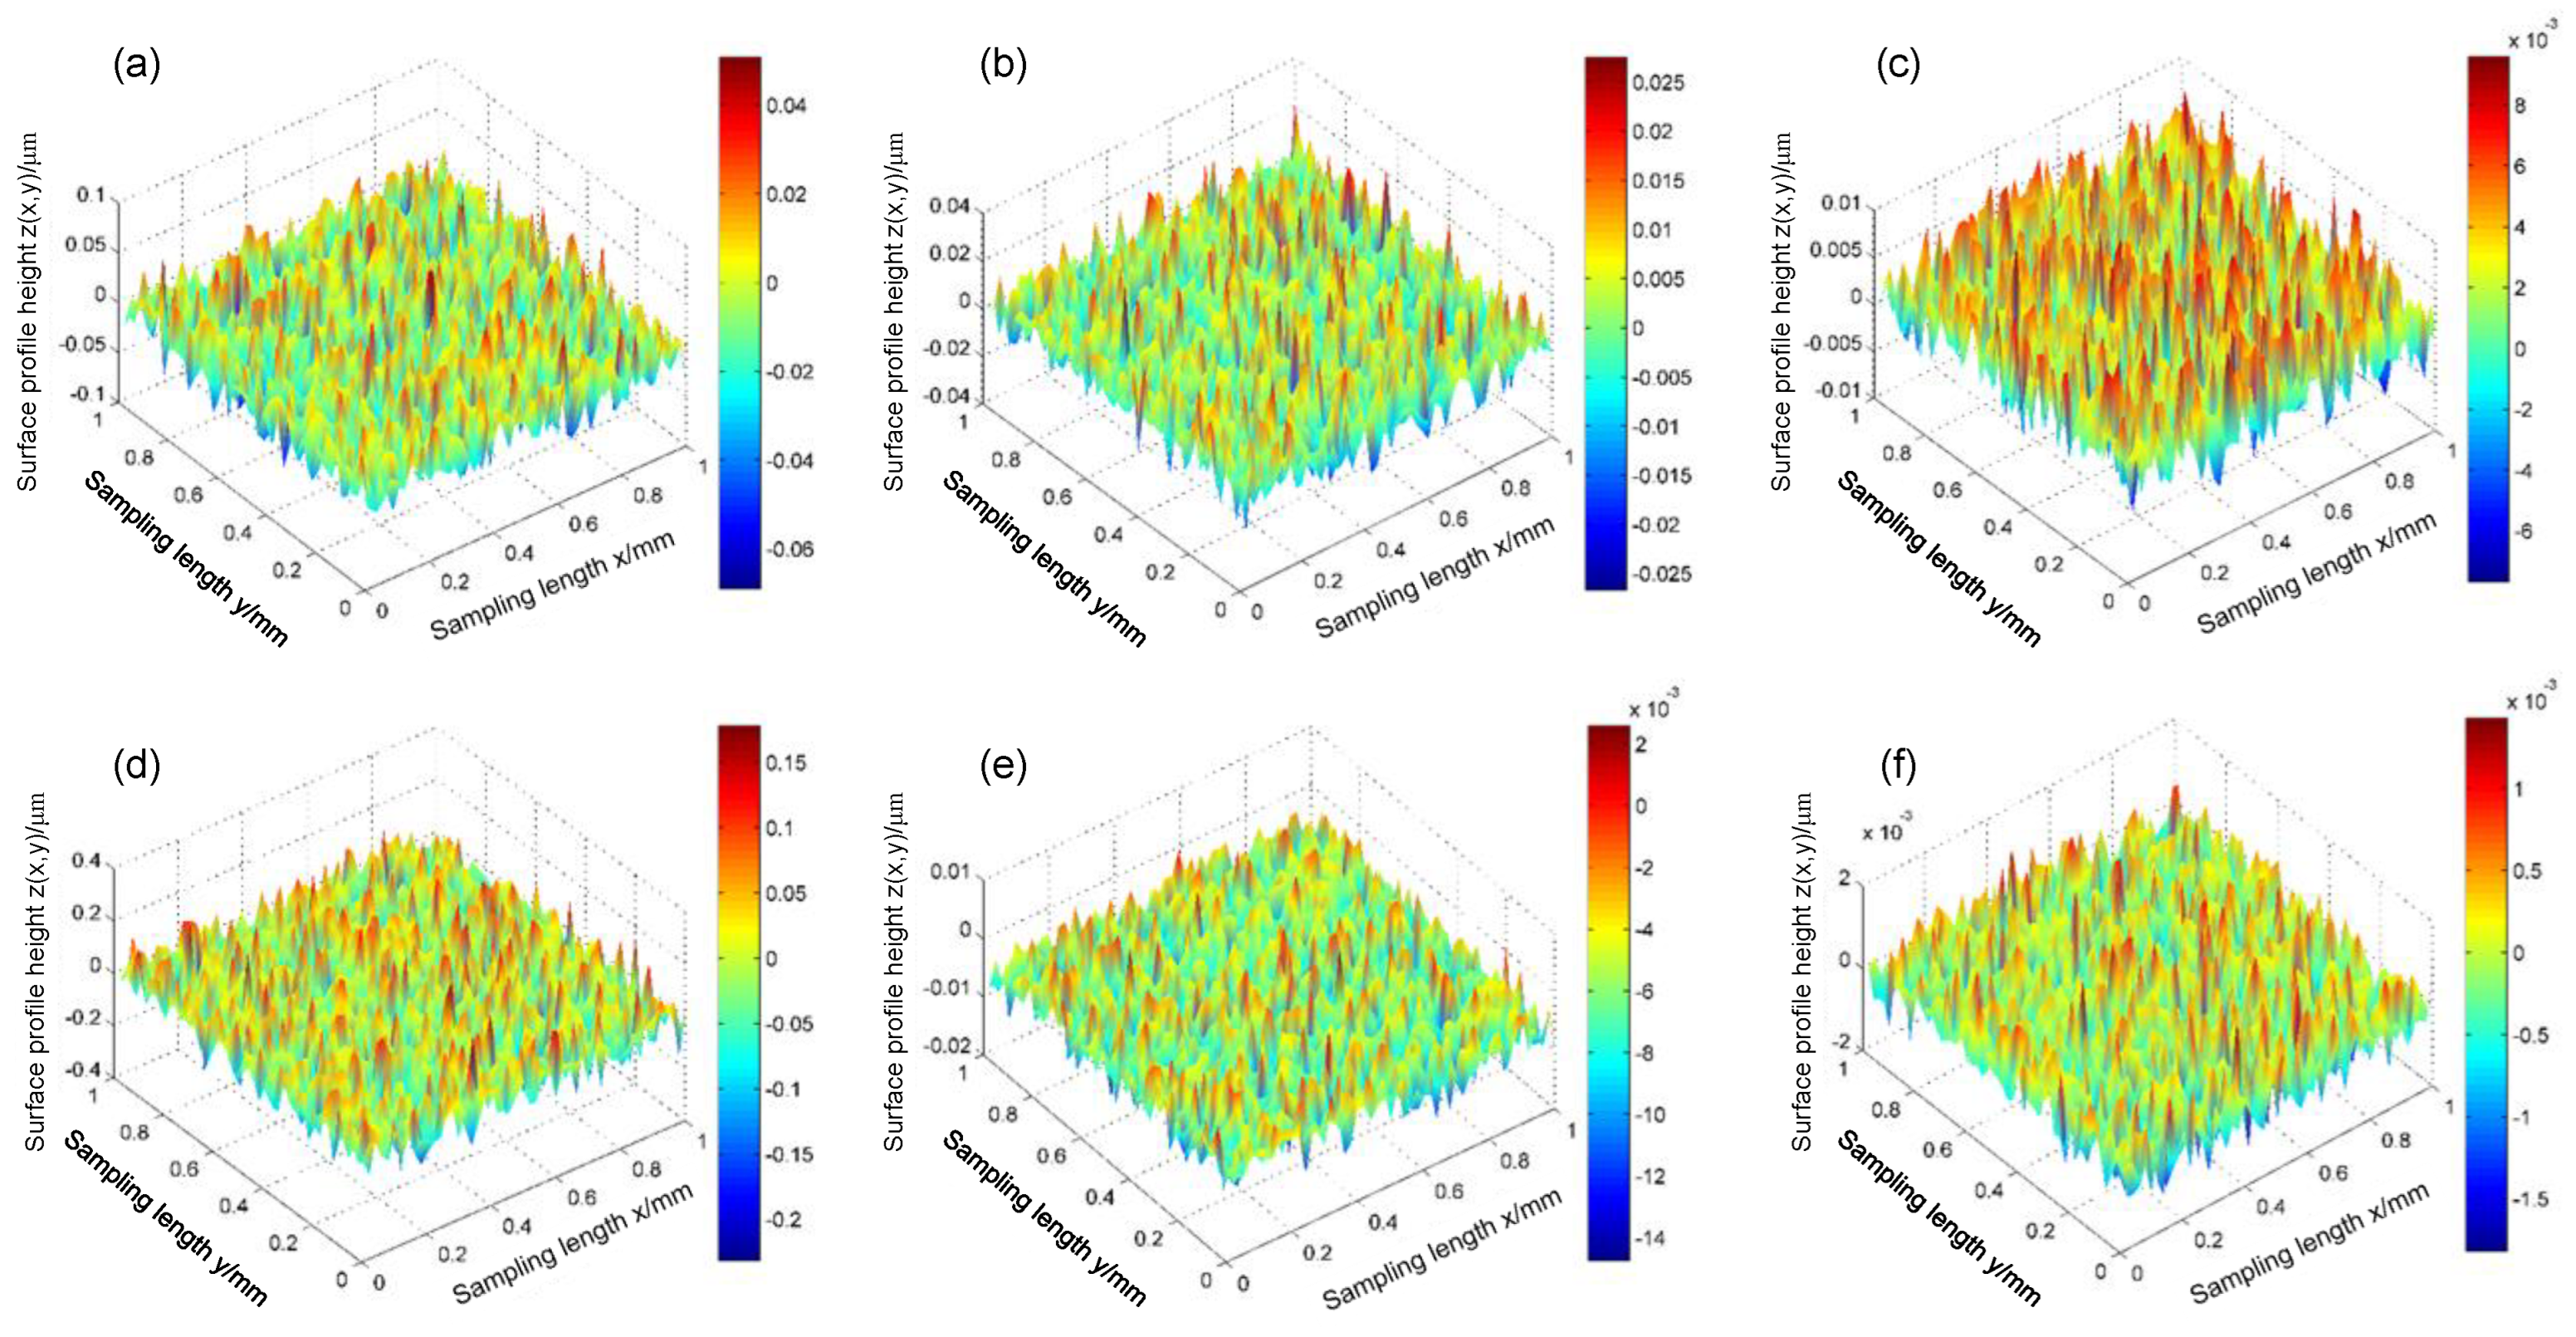
Figure 1. The 3D simulation of fractal surface topography. G 1 = 5 × 10 7   m , G 2 = 1 × 10 7   m : (a) D 1 = 2.3 ,   D 2 = 2.2 , (b) D 1 = 2.5 ,   D 2 = 2.4 , (c) D 1 = 2.9 ,   D 2 = 2.8 . D 1 = 2.7 ,   D 2 = 2.4 (d) G 1 = 5 × 10 8   m , G 2 = 1 × 10 8   m , (e) G 1 = 5 × 10 10   m , G 2 = 1 × 10 10   m , (f) G 1 = 5 × 10 11   m , G 2 = 1 × 10 11   m .
Mathematics 12 03232 g001
Figure 2. Schematic diagram of equivalent deformation of rough surface asperity.
Mathematics 12 03232 g002
Figure 3. Structure function diagram of the bi-fractal surface joint.
Mathematics 12 03232 g003
Figure 4. Flowchart of calculating the normal contact stiffness for the bi-fractal surface joint.
Mathematics 12 03232 g004
Figure 5. (a) Relationship between true contact area and normal load of joint; (b) Relationship between real contact area and fractal parameters of joint.
Mathematics 12 03232 g005
Figure 6. Relationship between different factors and normal contact stiffness. (a) Different fractal dimensions; (b) Different scaling parameter; (c) Different material parameters; (d) Different friction factor.
Mathematics 12 03232 g006
Figure 7. The rail slider joint. (a) The schematic diagram; (b) The equivalent mechanical model.
Mathematics 12 03232 g007
Figure 8. (a) Slider with different surface roughness; (b) Process diagram of sample surface profile measurement.
Mathematics 12 03232 g008
Figure 9. (a) Surface morphology of sliding rails with different roughness; (b) Surface profile of sliding rails with different roughness.
Mathematics 12 03232 g009
Figure 10. The equivalent structure function of the joint surface. (a) Joint 1, (b) Joint 2, (c) Joint 3.
Mathematics 12 03232 g010
Figure 11. Testing of dynamic characteristics of joints. (a) Schematic diagram of test, (b) The process of dynamic characteristic test.
Mathematics 12 03232 g011
Figure 12. The FRF diagrams of joint 1 under different normal loads. (a) The slider; (b) The foundation structure.
Mathematics 12 03232 g012
Figure 13. Equivalent FRF. (a) Joint 1; (b) Joint 2; (c) Joint 3.
Mathematics 12 03232 g013
Figure 14. Comparison of theoretical and experimental of the normal contact stiffness. (a) Joint 1, (b) Joint 2, (c) Joint 3. (d) Comparison of experimental results for joint with different roughness.
Mathematics 12 03232 g014
Table 1. Fractal parameters of equivalent rough surface.
Joint NumberFractal Dimension D 1 , D 2 Scaling Parameter G 1 , G 2 ( m )
12.51625.9058 × 10−7
2.78281.1811 × 10−6
22.48533.7237 × 10−7
2.70548.9543 × 10−7
32.46136.4363 × 10−7
2.67791.3073 × 10−6
Table 2. Prediction error of normal contact stiffness model of joint 1.
Normal Load
P ( N m )
Experimental Results
K   ( × 10 10 N/m)
Theoretical Results
K n   ( × 10 10 N/m)
Error (%)
80.77400.380250.9
140.82400.662619.6
201.01500.94397.0
261.35101.22449.4
321.55041.50353.0
381.63051.78379.4
441.71072.062720.6
Disclaimer/Publisher’s Note: The statements, opinions and data contained in all publications are solely those of the individual author(s) and contributor(s) and not of MDPI and/or the editor(s). MDPI and/or the editor(s) disclaim responsibility for any injury to people or property resulting from any ideas, methods, instructions or products referred to in the content.