Abstract
This paper introduces a novel methodology for measuring and decomposing multidimensional inequality, allowing for the breakdown of overall inequality into contributions from distinct dimensions. This approach offers valuable insights for sustainable business development by identifying economic sectors where Environmental, Social, or Governance (ESG) practices are most unequal and thus may benefit from policy intervention. Additionally, it explores the relationship between company size and sustainability, highlighting that the most concentrated sectors tend to exhibit the greatest ESG inequality. Applying this methodology to a sample of over 1000 small and medium-sized enterprises across various sectors in Italy, our analysis of the multidimensional index for 2022 reveals notable disparities in corporate financial performance and ESG adoption. Specifically, the manufacturing sector exhibited the highest inequality in financial performance, with an index of 0.77, indicating significant variation in financial health and firm size. Conversely, the financial services sector showed lower financial inequality, with an index of 0.23, suggesting more uniform outcomes. On the ESG front, the financial sector demonstrated the highest inequality, particularly in environmental and social dimensions, with an average Gini coefficient of 0.26, while the manufacturing sector displayed a more consistent ESG performance, with an average Gini of 0.19. These findings underscore sector-specific patterns in financial and ESG dimensions, providing a foundation for targeted interventions to reduce disparities.
Keywords:
inequality measurement; multidimensional inequality; market inequality; ESG; decomposition analysis; sustainable growth MSC:
37M10; 62H86; 91B82
1. Introduction
Inequality is a pressing global issue that affects individual opportunities, business growth, and overall societal well-being. As a complex and multifaceted concept, inequality manifests in various ways and impacts several aspects of society. On an individual level, inequality can lead to an uneven distribution of resources, opportunities, and privileges within and between societies [1,2]. At the corporate level, inequality among companies can lead to market concentration and a lack of competition. This, in turn, may stifle economic opportunity, growth, and sustainability by creating barriers to entry for smaller firms and fostering monopolistic practices. Understanding the diverse dimensions of inequality is crucial for crafting effective policies and strategies to address this critical challenge.
Traditional measures of inequality, such as the Gini coefficient, Lorenz curve, and Theil index [3,4,5], are primarily designed to capture income or wealth disparities along a single dimension. However, these one-dimensional approaches may oversimplify the complexity of inequality, overlooking how various economic, social, and environmental factors interact to shape disparities at both individual and corporate levels. Addressing this gap requires a multidimensional approach to inequality that reflects its broader, interconnected dimensions [6,7,8].
This paper contributes to the study of inequality in two primary ways. First, we advance the literature on inequality measurement by introducing a novel methodology for measuring and decomposing multidimensional inequality. Building on Fourier-based methods developed by [9,10,11] and multidimensional decomposition by [12], we extend the traditional Gini index to a multivariate framework. This methodological innovation allows us to disaggregate overall inequality into distinct components, providing valuable insights into the specific sources and drivers of inequality. This approach is particularly relevant in contexts where a single dimension may capture only a limited aspect of inequality, while a full understanding requires consideration of all interacting elements.
Second, we apply this generalized multidimensional index to assess inequalities in Environmental, Social, and Governance (ESG) adoption among small and medium-sized enterprises (SMEs). This application offers critical insights for policymakers, highlighting specific areas where interventions could reduce disparities, promote sustainable business practices, and support inclusive economic growth. By linking corporate financial performance and ESG dimensions of inequality, our approach offers data-driven evidence to guide targeted policies aimed at fostering more equitable and resilient economies.
Our methodology incorporates Fourier transforms [10,11,13] to address the challenges of analyzing multidimensional inequality. Fourier transforms enable the decomposition of complex, multivariate data into frequency components, offering a unique lens through which to observe variations in ESG practices across different sectors. By applying Fourier analysis, we can identify specific patterns in inequality that correspond to particular disparities within and across sectors, such as variations in ESG scores. This analytical approach not only facilitates a deeper understanding of how inequality manifests across multiple dimensions but also aids in isolating the contributions of each ESG factor within a unified framework.
In this study, we apply this framework to Italian SMEs, focusing on inequalities in both corporate financial performance and ESG adoption. By examining disparities in ESG practices, we aim to provide insights for policy interventions that can reduce inequality, support sustainable growth, and enhance SMEs’ contributions to the broader economy. In doing so, this study not only advances the literature on multidimensional inequality but also addresses an important gap in the analysis of inequality among SMEs; a critical component of economic development and job creation.
2. Literature Review
The measurement of inequality has a well-established history in economics and social research. Traditional metrics like the Gini coefficient [3,14], Lorenz curve [4,15], Theil index [5], and Atkinson index [16] are primarily for quantifying income inequality. Although these measures are valuable and provide foundational insights, they are limited by their one-dimensional focus, missing the broader, multidimensional aspects of inequality. Studies like [17,18,19] have advocated for multidimensional approaches. Ref. [20] proposed the concept of multidimensional inequality, which involves integrating various social and economic factors.
Multidimensional inequality research has further advanced through methodologies such as the Generalized Entropy Index (GEI) by [21] and entropy measures by [22,23] for multidimensional contexts. Ref. [24] extended the Gini index to accommodate multidimensional analysis. More recent contributions, including those by [25] with Principal Component Analysis (PCA), illustrate the potential of statistical techniques for summarizing complex data. Despite these advancements, practical implementation of multidimensional measures remains limited, partly due to methodological complexity.
The application of multidimensional approaches is prominent in policy-driven metrics like the Human Development Index (HDI) and the Multidimensional Poverty Index (MPI) developed by the United Nations Development Programme [26,27]. These indices consider various dimensions, such as health, education, and income, but they face challenges regarding the selection of indicators and assignment of the appropriate weights [28,29].
Ref. [8] explored the transition from traditional, income-based inequality measures to multidimensional approaches, emphasizing broader well-being aspects. Ref. [11] introduced a Fourier-based inequality index that quantifies multidimensional inhomogeneity in social phenomena, while [7] highlighted the limitations of income-focused inequality metrics and underscored how well-being disparities are better understood across multiple dimensions.
In the business context, ESG factors are increasingly recognized for their relevance to multidimensional inequality. Research by [30,31] demonstrates that firms with high ESG standards often experience better financial outcomes, while studies by [32,33] indicate that market concentration influences ESG adoption in larger firms. However, there remains a gap in understanding how ESG factors intersect with financial inequality within SMEs.
However, ESG-related inequality remains underexplored, particularly among small and medium-sized enterprises (SMEs). Although SMEs play a crucial role in economic development and sustainability, few studies have analyzed how financial metrics and ESG factors intersect within this segment. Our study builds on recent works by applying a multidimensional inequality measure to ESG practices among SMEs, focusing on sector-specific disparities in Italy. By extending the Gini index into a multivariate framework and incorporating Fourier-based methods, we aim to address the limitations of traditional, one-dimensional approaches and provide insights that are directly relevant to policymaking.
This research contributes to the literature by (1) advancing multidimensional inequality measurement methodologies and (2) applying these methods to ESG factors among SMEs, offering a detailed analysis of sectoral inequalities. The findings are intended to support policymakers in designing targeted interventions that promote equitable and sustainable development across various sectors.
3. Methodology
In this section, we present the methodology used to measure and decompose inequality. We cover the traditional Gini index, introduce the Fourier one-dimensional inequality index, and expand to the Fourier multidimensional inequality index. Finally, we detail the decomposition of the Fourier multidimensional inequality index.
3.1. Gini Index
The Gini index is a widely recognized measure of inequality that quantifies the distribution of wealth or income within a population [3]. It is calculated as twice the area between the line of equality and the Lorenz curve, represented by the function , for , where and . The Gini index can be determined by the following:
For a random vector with values , the Gini index G is calculated using the following formula:
where and are individual values of wealth or income, n is the total number of individuals, and is the mean value. This formulation captures inequality within a given dataset, yielding a value of 0 for absolute equality and 1 for absolute inequality. A smaller number indicates less inequality in the distribution.
3.2. Fourier One-Dimensional Inequality Index (F1II)
The Fourier One-dimensional Inequality Index (F1II), introduced by [10], offers a novel approach to measuring inequality by utilizing Fourier transforms. Unlike traditional inequality indices that operate in the spatial domain, F1II leverages the frequency domain, decomposing a function representing a dataset into its constituent frequencies. This transformation allows for an in-depth analysis of the inequality structure by identifying and isolating patterns and periodicities within the data, which can provide valuable insights into the specific factors that contribute to inequality.
The Fourier transform enables the identification of dominant frequencies within the distribution, which are indicative of recurring patterns or irregularities in the spread of resources, financial outcomes, or ESG practices. Higher frequencies typically capture abrupt changes or significant inequalities, while lower frequencies can reveal more gradual variations or consistent distribution patterns. By analyzing these frequencies, F1II offers a comprehensive framework that enhances the understanding of inequality through a new perspective, aiding policymakers and researchers in identifying areas that may require intervention.
The Fourier one-dimensional inequality index (F1II) is given as follows:
where is the Fourier transform of the distribution function , and is its gradient. The Fourier transform itself is given as follows:
This measure evaluates the deviation between the scaled Fourier transform and its derivative, normalized by the derivative of the Fourier transform at zero. The formulation of does not inherently constrain values to be less than 1. Depending on the distribution F, the supremum of the expression might exceed 1.
For a Gaussian probability measure F of mean and variance , the closed-form expression for the one-dimensional Fourier inequality measure is given by [10] as follows:
This expression shows that the measure is proportional to the coefficient of variation , with an explicit constant that is strictly less than one.
Proof.
A Gaussian distribution with mean and variance is characterized by the following Fourier transform:
From this, we have . Now, using the definition of :
We substitute the expressions for and :
Since the absolute value of is 1, and the absolute value of is 1, we obtain the following:
To find the supremum, we need to maximize the function
To find the maximum, we take the derivative and set it to zero:
Since the exponential term is never zero, we have the following:
To confirm that this is a maximum, we check the second derivative or simply note the behavior of . Since tends to zero as , is indeed a maximum. Thus:
□
Values of within the range can be interpreted similarly to traditional inequality indices, where values closer to 1 indicate higher inequality and values closer to 0 indicate lower inequality. When , this shows extreme deviations in the Fourier domain. In practical terms, it could signify distributions with very high variance or heavy-tailed distributions, where the inequality structure is much more pronounced.
3.3. Fourier Multidimensional Inequality Index (FMII)
The Fourier multidimensional inequality index, as introduced by [9], extends the one-dimensional approach to multiple dimensions, allowing for the assessment of inequality across correlated factors. This index enables the assessment of inequality in contexts where multiple, potentially correlated factors interact, such as in evaluating ESG (Environmental, Social, and Governance) inequality.
The Fourier multidimensional inequality index is formulated as follows:
where , denotes the gradient of the Fourier transform with respect to its argument . The Fourier transform itself is given as follows:
This measure evaluates the deviation between the scaled Fourier transform and its gradient, normalized by the gradient of the Fourier transform at the origin. This multidimensional approach allows for the assessment of inequality in a framework that accounts for the correlations between different dimensions, providing a more comprehensive measure of inequality.
The multidimensional Fourier inequality measure for a multivariate Gaussian distribution with mean such that , and positive-definite covariance matrix , is given by [9] as follows:
Proof.
The Fourier transform of the distribution function of a multivariate Gaussian variable in , with mean vector and positive semi-definite covariance matrix is given by the following expression:
From this, we have . We need to maximize the following expression:
Since and the modulus of is 1, we obtain the following:
To maximize this, note that . This is maximized when:
From the earlier derivation:
The magnitude of a vector is . Thus, .
For the expression to be zero, the term inside the parentheses must be zero:
This simplifies to the following:
This defines an ellipsoid, which maximizes the function at At this point, we need to substitute this back into :
Simplifying, we obtain:
Thus,
□
Unlike the one-dimensional index, the Fourier multidimensional inequality index can accommodate negative values. This is because it relies on the Mahalanobis distance, , which measures the distance between a point and a distribution. The Mahalanobis distance is always positive, regardless of the sign of the mean values.
The interpretation of follows a similar rationale to the . That is, values close to 0 indicate low inequality in the multidimensional distribution. This situation corresponds to cases where the data points are evenly distributed across the multiple dimensions considered. Values close to 1 signify higher inequality, with data points more unevenly distributed among the dimensions. Values greater than 1 indicate that the distribution has significant variations or heavy tails, leading to pronounced inequality across the multiple dimensions.
3.4. Decomposition of Fourier Multidimensional Inequality Index
The Fourier multidimensional inequality index can be decomposed to analyze its components and understand how each contributes to the overall measure of inequality. This decomposition is essential for identifying which dimensions or factors significantly impact the overall disparity within the system.
We define the Marginal Inequality Index (MII) as a measure of the sensitivity of the Fourier multidimensional inequality index to changes in the mean of dimension i, denoted as . It is expressed as follows:
where denotes the i-th element of the vector .
Proof.
To find , we need to differentiate with respect to .
The gradient with respect to is as follows:
Thus, the partial derivative with respect to is as follows:
□
This expression shows how changes in response to variations in the mean of dimension i, taking into account the covariance structure represented by . The negative sign indicates that decreases as increases, assuming the other dimensions remain constant. Thus, provides insights into how changes in specific dimensions affect the overall inequality index .
The MII is crucial for analyzing how inequalities in particular dimensions contribute to the multidimensional inequality measured by . It highlights which dimensions or factors of a multivariate distribution disproportionately influence the overall inequality, helping to target specific areas for improvement or further investigation in complex systems.
4. Application
This study investigates the relationship between disparities in Corporate Financial Performance (CFP) and Environmental, Social, and Governance (ESG) outcomes across various sectors within the Italian market. There is a growing demand for companies to deliver strong financial results while contributing positively to investments’ sustainability and ethical impact. Inequality in CFP, which manifests as disparities in profitability, revenue growth, and market concentration, can significantly influence ESG outcomes. Conversely, a company’s ESG performance can impact its financial performance, either enhancing or undermining it depending on various factors. Investigating these relationships requires robust tools to assess inequalities across these dimensions. Traditional unidimensional inequality indices often fall short of capturing the complexity and interrelations of these factors.
The Fourier Multidimensional Inequality Index (FMII) offers a powerful approach by leveraging the Fourier transform to provide a comprehensive analysis of ESG score distributions. This method allows for a comprehensive assessment of inequality across multiple dimensions, capturing interactions and correlations between financial performance and ESG metrics.
Additionally, both unidimensional and multidimensional indexes will be applied to quantify the extent of inequality in financial performance. By examining how financial metrics such as revenue, profit, and assets influence market inequality and, consequently, market concentration, this analysis helps uncover whether market concentration affects inequality in ESG adoption. Understanding these dynamics is crucial for identifying imbalances in sustainable development and effectively addressing them. This comprehensive approach not only sheds light on the current state of inequality but also provides actionable insights for policymakers and business leaders to promote more equitable and sustainable economic growth.
4.1. Data
Our study utilizes annual balance sheet data from top-listed SMEs across various sectors in Italy, covering the period from 2020 to 2022. The data are sourced from the Modefinance database, a FinTech company accredited as a Credit Rating Agency by the European Securities and Markets Authority. The data provide a credible and high-quality basis for analysis and are representative of the actual economic sectors. We selected companies among those receiving an ESG score based on their market capitalization, industry representation, and data availability, ensuring a diverse and representative sample of SMEs within each sector.
The dataset includes ESG scores derived from key indicators of environmental sustainability, social responsibility, and governance practices, with criteria that align with widely recognized ESG standards. Environmental indicators include metrics on carbon emissions, resource efficiency, and waste management; social indicators cover employee welfare, diversity, and community impact; and governance criteria address board composition, shareholder rights, and transparency. For consistency, we categorize economic sectors into five broader groups in accordance with the Global Industry Classification Standard (GICS), facilitating a structured comparison of financial and ESG performance across sectors.
To ensure the quality and reliability of the data, the following exclusion criteria were applied: (1) records with missing financial data, (2) records with missing sector classification, (3) records with missing ESG scores, (4) companies with total assets below 1,000,000 EUR, and (5) companies with turnover below 1,000,000 EUR. After applying these filters, a total of 1062 valid samples were retained for the analysis. Table 1 displays the distribution of SMEs across sectors. Out of a total of 1062 companies, 351 (33.05%) are from the consumer sector, 14 (1.32%) are from the financial sector, 55 (5.18%) are from health and essential utilities, 579 (54.52%) are from manufacturing, and 63 (5.93%) are from the technology and communication industries.

Table 1.
Distribution of companies by sector classification.
4.1.1. ESG Metrics
We first consider a summary analysis of ESG adoption by the considered SME companies. The ESG indicators reflect companies’ performance in environmental sustainability, social responsibility, and governance practices. The ESG scores provide an important dimension to assess investments’ ethical impacts and sustainability.
Table 2 provides a comprehensive overview of the ESG metrics across various sectors. The overall ESG scores (ESG) exhibit moderate variability, clustering around a mean of 0.65, indicating a consistent, though not uniform, performance in sustainability practices. Environmental scores (E.Sc) are notably higher on average (0.76), suggesting that companies are generally performing better in environmental sustainability. In contrast, social scores (S.Sc) are considerably lower, averaging 0.51, with significant variability, reflecting diverse levels of commitment to social responsibility. Governance scores (G.Sc) demonstrate moderate variability, with an average score of 0.62, indicating that governance practices across companies are relatively consistent but leave room for improvement.
Table 2.
Summary statistics for ESG metrics.
These summary statistics highlight varying levels of commitment to environmental, social, and governance practices among companies. Understanding these disparities is crucial for policymakers, investors, and other stakeholders who aim to address inequality and foster sustainable business development. By identifying where gaps exist, targeted strategies can be developed to promote more equitable and effective ESG practices across different sectors.
Table 3 offers a detailed snapshot of the ESG metrics across various sectors, providing insights into the performance and variability within each domain. The overall ESG scores reveal moderate consistency across sectors, with mean values ranging from 0.61 to 0.73. This suggests a relatively even distribution of general sustainability practices among companies in different industries.
Table 3.
Statistics for ESG metrics by sector. Values are means with standard deviations in parentheses.
The environmental scores (E.Sc) are notably higher on average, particularly in the financial (0.91) and technology and communication (0.86) sectors, indicating a strong emphasis on environmental sustainability within these industries. However, the higher standard deviations in this category, especially in the consumer sector (0.19), suggest significant variability in how companies within the same sector approach environmental responsibilities.
In contrast, the social scores (S.Sc) are lower across all sectors, with averages hovering around 0.49 to 0.53. This indicates a weaker performance in social responsibility practices, coupled with substantial variability, particularly in the financial sector (standard deviation of 0.30). This finding highlights potential areas for improvement in addressing social factors such as employee welfare, community engagement, and human rights.
The governance scores (G.Sc) are relatively consistent, with mean values ranging from 0.59 to 0.70. This suggests that governance practices are fairly standardized across sectors, though there is still room for enhancement, especially in sectors like manufacturing, which shows a slightly lower average (0.63).
Overall, the table illustrates important disparities in ESG performance across sectors. The higher variability in environmental and social scores, in particular, underscores the need for sector-specific strategies to promote more uniform adoption of sustainable practices.
4.1.2. Financial Metrics
To understand the possible impact of financial metrics, which can measure market concentration and financial inequalities, we extracted a variety of financial indicators from the balance sheets of each company to examine their economic status and performance among economic sectors. Table 4 presents a list and description of the considered financial indicators.
Table 4.
Description of key financial metrics.
Table 5 provides summary statistics of the key financial indicators metrics for 2022. Total Assets (TASS) exhibit a broad range from EUR 1151.23 to EUR 14,392,422.00, with a high standard deviation indicating significant variability across companies. The mean value is relatively high (EUR 173,476.54), suggesting that there are companies with substantial asset holdings. Shareholders’ Funds (SFND) also show notable variation, with a high standard deviation and some negative values indicating negative equity for certain companies. The mean is considerably lower than the maximum, highlighting the impact of a few companies with exceptionally high shareholders’ funds. Turnover (TOVR) displays a large range (from EUR 1288.97 to EUR 10,587,145.00) and a high standard deviation, reflecting significant differences in revenue generation among companies. The mean turnover is elevated by companies with very high revenues. Net Income (NINC) varies widely, with some companies reporting significant losses (EUR −331,989.00) and others substantial profits (EUR 1,502,054.00). The high standard deviation relative to the mean suggests a highly skewed distribution. EBITDA (EBTD) shows substantial variability, with a wide range from EUR −303,716.00 to very high values (EUR 2,095,592.00), indicating diverse levels of operational efficiency and profitability among companies.
Table 5.
Summary statistics for financial indicators—2022 annual data.
Overall, the summary statistics of the data reveal significant variability across financial metrics, indicating a wide range of company sizes, financial health, and performance levels, pointing towards high inequality and market concentration.
Table 6 presents a detailed summary of financial metrics by sector, with means and standard deviations provided in parentheses.
Table 6.
Statistics for financial metrics by sector. Values are means with standard deviations in parentheses.
- Total Assets (TASS): The health and essential utilities sector has the highest average total assets of 473,270.43, but it also exhibits substantial variability, as indicated by a standard deviation of 1,592,466.37. This suggests the presence of both very large and much smaller companies within this sector. In contrast, sectors like consumer and technology and communication have lower average total assets and more consistent sizes, as reflected in their lower standard deviations.
- Sales Fund (SFND): Health and essential utilities again leads, with an average sales fund of 117,960.61, coupled with a high standard deviation of 432,085.41, indicating significant disparities among companies. The financial sector shows the lowest average sales fund at 33,415.13, with less variability compared to health and essential utilities.
- Turnover (TOVR): The health and essential utilities sector has the highest average turnover of 641,996.56, but with considerable variability, as reflected in a standard deviation of 1,642,643.57. This contrasts with the manufacturing and consumer sectors, which have lower average turnovers and more moderate variability.
- Net Income (NINC): While the consumer, health and essential utilities, and manufacturing sectors show positive average net incomes, they also display considerable variability. Notably, the technology and communication sector has a negative average net income of −2762.06, indicating profitability challenges within this sector, along with high variability.
- Earnings Before Taxes and Depreciation (EBTD): The health and essential utilities sector has the highest average EBTD of 37,082.42, but this is accompanied by significant variability, with a standard deviation of 145,207.52. The financial sector has the lowest average EBTD of 7094.64, with less variability.
In summary, the health and essential utilities sector shows the highest averages across most financial metrics, but also the greatest variability, indicating a wide range of financial performance within the sector. The technology and communication sector struggles with profitability, as evidenced by a negative average net income. Sectors such as consumer and manufacturing exhibit more stable financial performance with moderate variability, suggesting a more uniform industry structure.
These findings underscore the importance of considering sector-specific dynamics when addressing financial inequality and promoting sustainable business development.
4.1.3. Correlation Between ESG and Financial Metrics
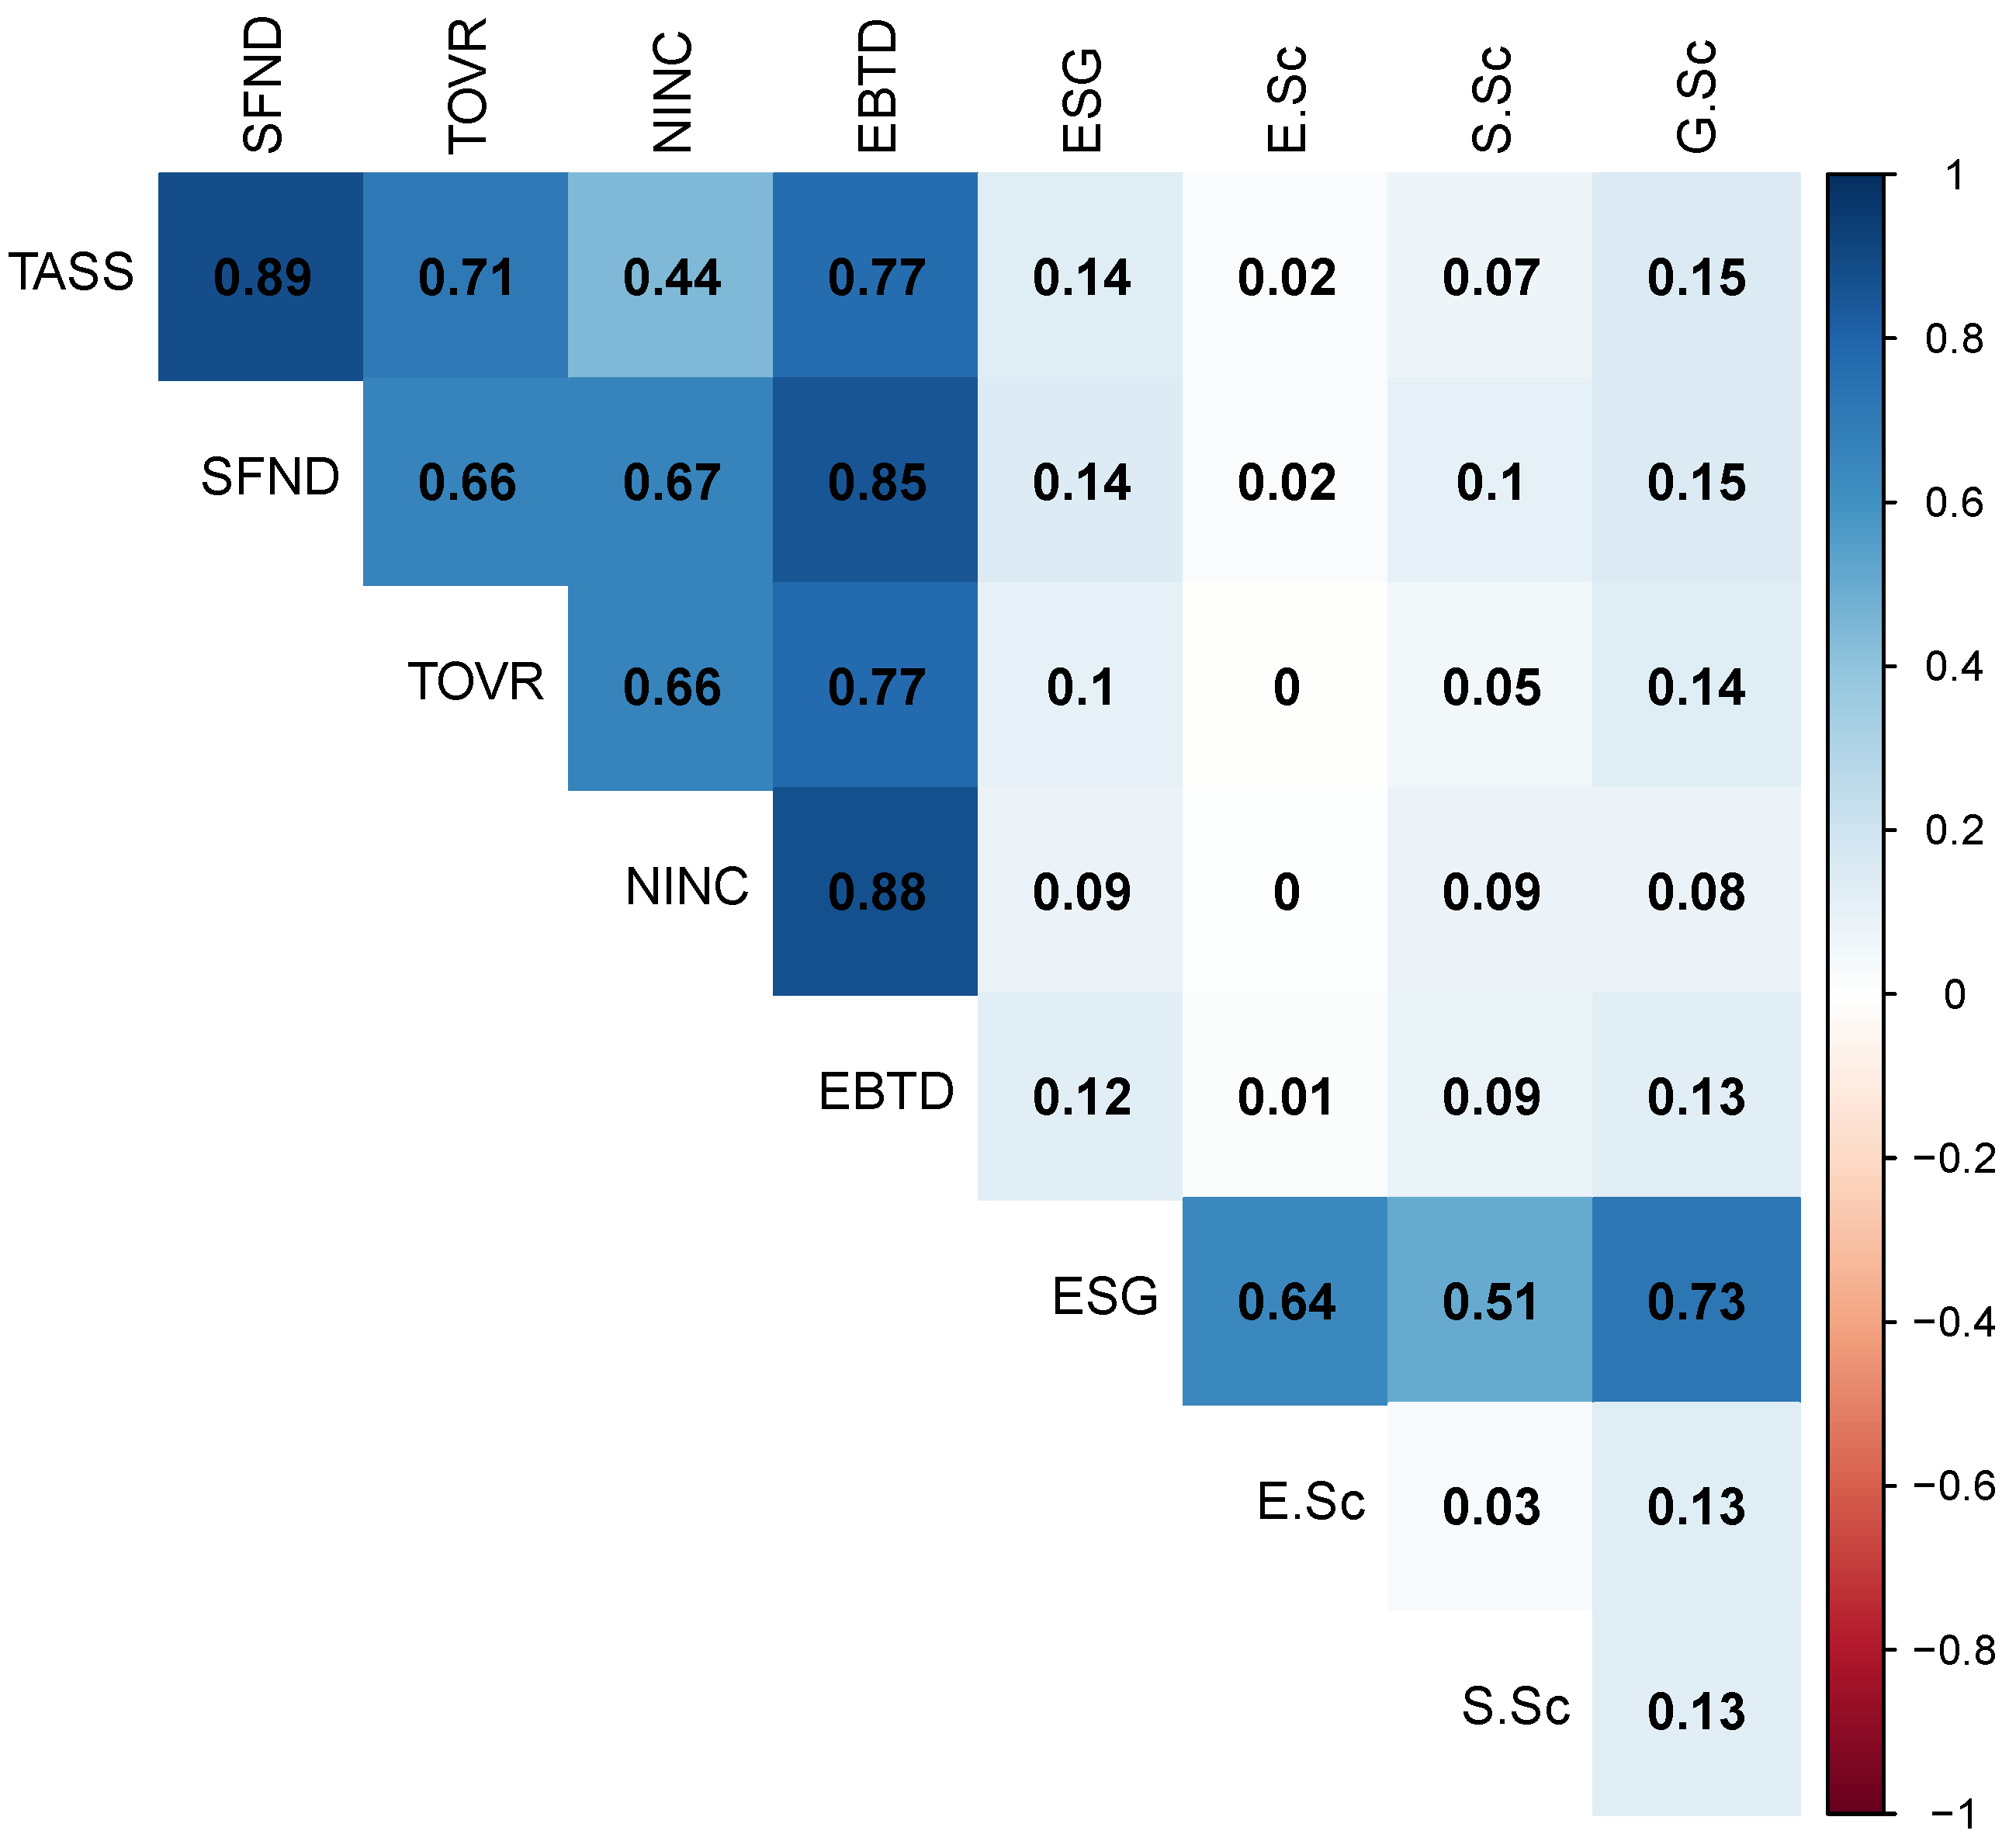
The correlation matrix in Figure 1 presents the relationships between financial indicators and ESG scores for SMEs in 2022.

Figure 1.
Correlation matrix of financial indicators and ESG scores for 2022.
The figure shows that the overall ESG scores have weak correlations with financial indicators. Environmental scores (E.Sc) are strongly correlated with the overall ESG score but uncorrelated with financial indicators. Social scores (S.Sc) are moderately correlated with ESG and weakly correlated with financial indicators. Governance scores (G.Sc) are strongly correlated with ESG and have the highest correlation with financial indicators among the individual ESG scores.
The weak correlation between overall ESG scores and financial indicators suggests that while companies with higher ESG scores tend to perform slightly better financially, this relationship is not strong. This implies that higher ESG performance may not directly translate into significantly better financial outcomes for SMEs, though there is a slight positive trend.
Environmental scores (E.Sc) show a strong correlation with the overall ESG score, indicating that environmental performance is a major component of the overall ESG rating. However, the lack of correlation between environmental scores and financial indicators suggests that environmental initiatives alone do not significantly influence financial performance in this sample.
Social scores (S.Sc) display a moderate correlation with the overall ESG score, showing their partial contribution to the overall ESG performance. Their weak correlation with financial indicators indicates that while social responsibility practices are recognized within the ESG framework, they do not strongly impact financial outcomes for SMEs.
Governance scores (G.Sc) show the strongest correlation with both the overall ESG score and financial indicators, suggesting that governance practices not only contribute significantly to overall ESG performance but also have the most direct impact on financial health among the ESG components. Good governance practices appear to be more closely linked to financial success in SMEs.
In summary, the correlations between ESG scores and financial metrics highlight the complexity of this relationship. While ESG performance, particularly in governance, is associated with better financial outcomes, the correlation is not overwhelmingly strong. This indicates that financial and non-financial performance in SMEs are related, but the influence of ESG factors on financial success varies across the environmental, social, and governance dimensions. Disentangling these components is essential for understanding how different aspects of ESG contribute to the financial and overall sustainability of SMEs.
4.2. Results
The ESG scores and the financial data were analyzed using the Gini, Fourier one-dimensional, and Fourier multidimensional inequality indices to assess inequality across the different sectors. The analysis involved the following steps:
- Data normalization: The financial metrics and ESG scores were normalized to ensure comparability across different scales and units. Before applying the Gini and Fourier one-dimensional index, the financial metrics and ESG scores were normalized to ensure comparability across different scales and units. This involves rescaling scores to a standard range, such as 0 to 1, using min–max scaling:
- Gini and Fourier one-dimensional inequality index: This index was calculated to identify the distribution patterns within each sector, providing insights into the inequality of individual dimensions.
- Fourier multidimensional inequality index: The FMII was used to integrate the various dimensions (financial and ESG metrics) into a comprehensive inequality assessment.
- Marginal inequality index: This was calculated to decompose the FMII, identifying the contribution of each sector to the overall multidimensional inequality.
The application of the Gini, F1II, and FMII to the ESG and financial data across different sectors yielded the following insights:
4.2.1. Unidimensional ESG Inequality Analysis
Table 7 displays the inequality in Environmental, Social, and Governance (ESG) scores across different sectors.
Table 7.
Inequality by ESG Scores across Sectors.
- Overall ESG scores: The financial sector exhibits the highest overall ESG score inequality, reflected in the Gini index (0.3194), indicating the largest disparity in ESG performance among companies in this sector. The manufacturing sector shows the lowest overall ESG score inequality (0.1581), reflecting a more uniform distribution of ESG scores among companies.
- Environmental (E) scores: The financial sector has the highest inequality in Environmental scores (0.0714) according to the Gini index, suggesting significant variation in how companies within this sector handle environmental issues. Both the consumer and manufacturing sectors have the lowest inequality in environmental scores (0.1271 and 0.0871, respectively), indicating more consistency in environmental performance among companies.
- Social (S) scores: The financial sector shows the highest inequality in social scores (0.3920) reflected in the Gini index, highlighting the greatest disparity in social performance among companies. The health and essential utility sector has the lowest social score inequality (0.2950), suggesting a more even distribution of social performance among companies in this sector.
- Governance (G) scores: The consumer sector has the highest inequality in governance scores (0.2167) based on the Gini index, showing significant variability in governance practices among companies. The health and essential utility sector exhibits the lowest governance score inequality (0.1644), reflecting more uniform governance practices.
The financial sector shows the highest inequality in ESG scores (0.1788), environmental scores (0.0873), and social scores (0.2205) according to the F1II. This indicates significant disparities in ESG performance metrics across companies in the financial sector. The manufacturing sector shows the lowest inequality in overall ESG scores (0.0854) and social scores (0.1499), suggesting a more uniform distribution of these scores.
Similar to the F1II, the financial sector shows the highest inequality in ESG scores (0.1694) and social scores (0.2088), indicating pronounced disparities in these areas. The manufacturing sector maintains the lowest inequality for overall ESG scores (0.0853) and social scores (0.1497), reinforcing the consistency in performance within this sector.
The different metrics (Gini and F1II) provide a consistent view of the inequality, though specific values vary slightly based on the underlying assumptions of the metric used.
In summary, the analysis of these ESG indicators reveals which sectors are more unequal in terms of ESG adoption. The result shows that, on average, the financial sector consistently shows the highest inequality across ESG metrics, particularly in environmental and social scores, suggesting significant variability in how companies in this sector manage ESG issues. The consumer sector shows high variability in governance practices, indicating that companies within this sector may benefit from adopting standardized governance frameworks to ensure more uniform practices. The manufacturing sector displays the lowest inequality, suggesting a strong focus on these areas, providing a stable foundation for further improvements in ESG performance.
4.2.2. Unidimensional Financial Inequality Analysis
The Gini coefficient and the Fourier one-dimensional index were applied to each sector to examine the inequality of individual financial indicators. Table 8 provides a detailed comparison of inequality across various financial indicators within different sectors. These metrics offer valuable insights into the distribution patterns of financial indicators, helping to identify areas of significant disparity and providing a basis for targeted interventions.
Table 8.
Inequality by individual financial indicators across sectors—2022.
- Total assets (TASS) and market power:
- Highest inequality: Gini: 0.8047 (Health.Util), F1II: 1.2567 (Manufacturing)
- Lowest inequality: Gini: 0.5832 (Financials), F1II: 0.3779 (Financials)
According to the Gini index, the health and essential utility sector displayed the highest inequality in company sizes and market power. This suggests a significant disparity in how assets and market power are distributed among companies in this sector. Conversely, the Fourier One-Dimensional Inequality Index (F1II) points to the manufacturing sector as having the greatest disparity in company sizes and market power. This metric highlights a substantial variance in the distribution of these attributes within the manufacturing sector. Both the Gini and F1II show that the financial sector stands out with the lowest variance in company sizes and market power, suggesting a more uniform distribution compared to other sectors.
- Shareholders’ funds (SFND) and net worth:
- Highest inequality: Gini: 0.7384 (Consumer), F1II: 1.1795 (Manufacturing)
- Lowest inequality: Gini: 0.3366 (Financials), F1II: 0.2047 (Financials)
The F1II indicates that the manufacturing sector has significant variance in shareholders’ funds, leading to notable differences in net worth among companies. This suggests that there is a wide range in the financial strength of companies within this sector. On the other hand, the financial sector displays relatively uniform shareholders’ funds, suggesting less disparity in financial resources among companies.
- Turnover (TOVR) and productivity:
- Highest inequality: Gini: 0.8381 (Health.Util), F1II: 1.1201 (Manufacturing)
- Lowest Inequality: Gini: 0.5885 (Tech.Com), F1II: 0.3922 (Tech.Com)
- The manufacturing sector shows considerable variability in turnover, reflecting significant differences in productivity among companies. This indicates a diverse range of productivity levels within the sector. In contrast, the technology and communication sector demonstrates lower turnover disparity, suggesting more uniform productivity levels among companies in this sector.
- Net income (NINC) and profitability:
- Highest inequality: Gini: 0.1692 (Financials), F1II: 0.2001 (Consumer)
- Lowest inequality: Gini: 0.0251 (Tech.Com), F1II: 0.0389 (Tech.Com)
The consumer sector is noted for the highest variance in net income, indicating substantial differences in profitability among companies. This suggests a wide range of financial performance within the sector. The technology and communication sector, however, has the lowest net income variance, implying that profitability levels are more consistent across companies in this sector.
- EBITDA (EBTD) and operational efficiency:
- Highest inequality: Gini: 0.5311 (Tech.Com), F1II: 0.4296 (Tech.Com)
- Lowest inequality: Gini: 0.0646 (Manufacturing), F1II: 0.1212 (Manufacturing)
The technology and communication sector shows the highest variance in EBITDA, reflecting notable differences in operational efficiency among companies. This suggests significant disparities in how effectively companies in this sector manage their operations. In contrast, the manufacturing sector exhibits more consistent EBITDA, indicating a more uniform level of operational efficiency across companies.
The Gini coefficient and the F1II provide consistent insights into the inequality across sectors, though the specific values can differ slightly based on the distribution assumptions.
The table highlights that on average, sectors like manufacturing, health and essential utility services, and technology and communication tend to have higher variability in certain metrics (e.g., total assets, turnover, and EBITDA) compared to others like the financial and consumer sectors. This variability may reflect underlying differences in sector dynamics and business models.
High financial inequality within a sector implies a well-diversified composition of companies, reducing systemic risks associated with negative economic events. The presence of large companies (as indicated by high total assets, turnover, shareholders’ funds, EBITDA, or net income) within a sector suggests the potential for higher financial impact in the case of adverse events, but this also highlights that a mix of company sizes that can mitigate risks for society.
4.3. Multidimensional Analysis of ESG and Financial Inequalities
Table 9 shows the Fourier Multidimensional Inequality Index (FMII) for the years 2020, 2021, and 2022, as well as the inequality in ESG scores across different sectors.
Table 9.
Fouier Multidimensional inequality index by financial indicators and ESG scores across sectors.
4.3.1. Financial Indicators
- Consumer sector: Financial inequality has slightly increased over the years, with FMII rising from 0.4809 in 2020 to 0.5162 in 2022. This suggests growing financial disparity among companies in this sector.
- Financial sector: The FMII showed a decrease from 0.3124 in 2020 to 0.2297 in 2022, indicating a reduction in financial inequality within the sector. This trend suggests increasing financial uniformity among companies.
- Health and essential utilities sector: The FMII fluctuated, with a decrease in 2021 followed by an increase in 2022. This sector showed significant variability in financial inequality, suggesting diverse financial conditions among companies.
- Manufacturing sector: This sector had consistently high FMII values (above 0.74), indicating persistent and significant financial inequality. This suggests a wide range of financial performances among companies.
- Technology and communication sector: A slight increase in FMII from 0.3444 in 2020 to 0.3645 in 2022 indicates rising financial inequality. However, this sector remained relatively stable compared to the others.
4.3.2. ESG Scores
- Consumer sector: The low ESG score inequality (0.0554) indicates a fairly uniform adoption of ESG practices among companies in this sector.
- Financial sector: The lowest ESG score inequality (0.0227) suggests very consistent ESG practices within this sector, reflecting a high level of uniformity in ESG performance.
- Health and essential utilities sector: The moderate ESG score inequality (0.0435) points to some variability in ESG adoption, but it is not as pronounced as in the financial or manufacturing sectors.
- Manufacturing sector: The low ESG score inequality (0.0479) suggests more consistent ESG performance among companies, despite high financial inequality.
- Technology and communication sector: The low ESG score inequality (0.0283) indicates a consistent adoption of ESG practices across companies in this sector.
The Financial sector consistently shows the highest inequality across ESG metrics, particularly in environmental and social scores, suggesting significant variability in how companies in this sector manage ESG issues. The manufacturing sector generally displays lower inequality in ESG scores, indicating more uniform ESG performance. The consumer, health and utilities, and technology and communication sectors exhibit varying levels of financial and ESG inequalities, reflecting the diverse dynamics and challenges within each sector.
4.4. Inequality Decomposition
This section analyzes the decomposition of inequality by examining both ESG metrics and financial indicators across different sectors. The goal is to identify which factors contribute most to inequality within each sector.
4.4.1. ESG Inequality Decomposition
Table 10 highlights the marginal inequality indices for different ESG metrics across sectors. The key findings are given below.
Table 10.
Marginal inequality index by ESG scores across sectors.
- Consumer sector: All ESG scores contribute negatively to inequality, with G.Sc (−4.5282) being the largest contributor, indicating significant disparities in governance practices.
- Financial sector: Mixed contributions with S.Sc (0.1877) showing a small positive contribution, and E.Sc (−2.0001) and G.Sc (−0.7767) showing negative contributions, indicating variability primarily in environmental and governance practices.
- Health and essential utilities sector: The largest negative contribution is from G.Sc (−2.9425), suggesting substantial disparities in governance practices, with E.Sc (−2.7067) and S.Sc (−0.6398) also contributing negatively.
- Manufacturing sector: E.Sc (−3.3116) shows the largest negative contribution, indicating significant variability in environmental practices, followed by G.Sc (−2.7077).
- Technology and communication sector: The contributions are primarily negative, with G.Sc (−1.5539) being the largest, indicating significant governance disparities.
The financial sector shows the highest inequality in both financial indicators and ESG metrics. Financial inequality is driven by net income and earnings disparities, while ESG inequality is mainly due to governance and environmental practices. The manufacturing sector exhibits high financial inequality but more uniform ESG performance. The consumer, health and essential utilities, and technology and communication sectors show varying levels of inequality, reflecting diverse sectoral dynamics.
4.4.2. Financial Inequality Decomposition
Table 11 displays the marginal inequality indices for different financial indicators across sectors. The key results are given below.
Table 11.
Marginal inequality index by financial indicators across sectors.
- Consumer sector: Marginal contributions to inequality are generally low, with EBTD (0.0009) being the most significant positive contributor. This suggests that disparities in earnings before taxes and depreciation are the most pronounced within this sector.
- Financial sector: The sector shows a mixed contribution to inequality, with NINC (0.0030) being the largest positive contributor and EBTD (−0.0078) being the most significant negative contributor, suggesting that income disparities are more impactful than earnings disparities.
- Health and essential utilities sector: NINC (0.0022) contributes positively to inequality, indicating that net income disparities are a key factor. Other metrics show smaller negative contributions.
- Manufacturing sector: The NINC (0.0010) and EBTD (0.0029) are the primary positive contributors, highlighting significant disparities in net income and earnings within the sector.
- Technology and communication sector: The contributions are generally low, with EBTD (−0.0002) and NINC (−0.0003) showing slight negative contributions, indicating lower levels of disparity compared to other sectors.
5. Practical Implications
Understanding the decomposition of inequality across different sectors and dimensions provides several practical implications for policymakers, investors, and business leaders.
For policymakers, targeted regulations are essential to address sector-specific inequalities. In the financial sector, the high inequality in ESG scores, particularly in environmental and social dimensions, suggests the need for stricter ESG reporting and compliance requirements. In the manufacturing sector, where financial disparities, especially in net income and EBITDA, are notable, targeted fiscal policies and support programs could help reduce inequality and enhance sector stability. Additionally, sector-specific support is crucial for sectors like the consumer sector, where relatively lower inequality in financial indicators contrasts with significant disparities in governance, indicating a need for policies that promote better governance practices. For the health and essential utilities sector, policies encouraging both financial stability and uniform ESG performance are necessary due to moderate inequality in both financial and ESG scores. Furthermore, high inequality within the financial sector indicates systemic risks, necessitating cross-sectoral strategies to mitigate potential financial crises triggered by disparities within this sector.
For investors, understanding inequality decomposition can inform more strategic investment decisions. Investors should exercise caution when investing in sectors with high ESG score variability, such as the financial sector. Prioritizing investments in companies with consistent and high ESG performance can mitigate risks and align with sustainable investment goals. Additionally, high financial inequality in sectors like manufacturing suggests the presence of both high-risk and high-reward opportunities. Therefore, diversifying investments within these sectors can balance potential gains and risks. Investors should also conduct thorough due diligence, especially in sectors with high inequality, to understand the financial health and ESG practices of companies, helping to identify both high-potential investments and potential risks.
For business leaders, benchmarking and adopting best practices are crucial for performance improvement, especially in sectors with high inequality. Companies should benchmark their performance against peers to identify areas for improvement and adopt best practices in ESG and financial management to enhance overall sector performance and individual company resilience. In sectors with significant ESG score variability, companies should integrate robust ESG practices into their operations, improving scores and attracting ESG-conscious investors. Additionally, sectors like the consumer sector and health and essential utilities, which exhibit notable governance disparities, should prioritize governance reforms to strengthen corporate governance frameworks, enhancing company reputation, operational efficiency, and stakeholder trust.
Overall, this analysis underscores the need for concerted efforts to reduce inequality within sectors, achieved through a combination of regulatory policies, corporate initiatives, and investment strategies focused on promoting financial stability and sustainable practices. By addressing identified inequalities, sectors can become more resilient to economic shocks and better positioned to contribute to sustainable economic growth. The practical implications highlight the importance of a multifaceted approach to addressing sectoral inequalities, requiring collaboration among policymakers, investors, and business leaders to implement strategies that enhance financial and ESG performance, thereby promoting overall economic stability and sustainable development.
6. Discussion
This paper introduces a novel methodology for measuring and decomposing multidimensional inequality, applied specifically to analyze the inequality in ESG adoption among SMEs. Our study reveals significant sectoral disparities, where both financial metrics and ESG factors contribute notably to overall market inequality.
The financial sector stands out with the highest inequality in ESG metrics, especially in environmental and social dimensions. This reflects substantial differences in how companies within this sector manage ESG issues, with some leading in sustainability practices while others fall behind. Conversely, the manufacturing sector shows lower inequality in ESG performance, suggesting more consistent adoption of sustainable practices across companies in this industry.
In terms of corporate financial performance, sectors like manufacturing and health and essential utilities exhibit higher variability, indicating a diverse range of company sizes and financial health. This diversity could reduce systemic risks by buffering economic downturns, as both large and small companies are represented. On the other hand, sectors such as financial and consumer services show lower variability in financial performance, suggesting more uniform outcomes across firms.
The findings from this study are not only relevant to the SME sector in Italy but can also be extended to a broader global context. Policymakers in various regions can use these insights to craft sector-specific regulations and support programs aimed at reducing inequality and promoting sustainable development. By considering ESG factors alongside financial performance, policies can be designed to balance economic growth with social and environmental responsibility.
For investors, understanding the interplay between financial health and ESG practices can inform investment strategies that prioritize long-term resilience and sustainability. Companies in sectors with high ESG inequality may face higher risks, while those demonstrating consistent ESG practices could offer more stable returns. Business leaders can use this framework to assess their own performance relative to industry peers, identify areas for improvement, and adopt best practices that enhance their ESG standings.
Beyond the immediate application to SMEs, the methodology introduced here can be applied across larger corporations, different economies, and industries. The ability to measure multidimensional inequality provides valuable insights for governments, corporations, and investors to understand and address inequalities in a comprehensive manner. This research lays the foundation for future studies on multidimensional inequality, particularly in contexts where both financial and non-financial factors, such as sustainability, play a crucial role in shaping market outcomes.
In conclusion, by integrating both financial performance and ESG considerations, this study highlights the importance of a comprehensive approach to addressing inequality. The results contribute to the ongoing effort to create more inclusive and sustainable economic systems, offering practical insights for policymakers, investors, and business leaders alike.
The main limitation of the proposed inequality measure is that it is not bounded between 0 and 1 like the Gini index; therefore, its interpretation is more difficult and requires a relative comparison. This aspect, however, is common to other important measures of variability, such as the coefficient of variation and the mean squared error.
Author Contributions
Conceptualization, D.F.A. and P.G.; Methodology, D.F.A. and P.G.; Software, D.F.A.; Validation, D.F.A. and P.G.; Formal analysis, D.F.A. and P.G.; Investigation, D.F.A. and P.G.; Resources, D.F.A.; Data curation, D.F.A. and P.G.; Writing—original draft, D.F.A. and P.G.; Writing—review & editing, D.F.A. and P.G.; Visualization, D.F.A. and P.G.; Supervision, D.F.A. and P.G.; Project administration, D.F.A. and P.G.; Funding acquisition, P.G. All authors have read and agreed to the published version of the manuscript.
Funding
This research received no external funding.
Data Availability Statement
The data presented in this study are available on request from the corresponding author.
Conflicts of Interest
The authors declare no conflicts of interest.
Nomenclature
| ESG | Environmental, Social, and Governance |
| SMEs | Small and Medium-sized Enterprises |
| GEI | Generalized Entropy Index |
| PCA | Principal Component Analysis |
| HDI | Human Development Index |
| MPI | Multidimensional Poverty Index |
| UNDP | United Nations Development Programme |
| F1II | Fourier One-dimensional Inequality Index |
| FMII | Fourier Multidimensional Inequality Index |
| MII | Marginal Inequality Index |
| GICS | Global Industry Classification Standard |
| E.Sc | Environmental Scores |
| S.Sc | Social Scores |
| G.Sc | Governance Scores |
| Health.Util | Healthcare and Essential Utility Services |
| Tech.Com | Information Technology and Communication Industries |
| TASS | Total Asset |
| TOVR | Turnover |
| SFND | Shareholders’ Funds |
| NINC | Net Income |
| EBTD | EBITDA |
| EBITDA | Earnings Before Interest, Taxes, Depreciation, and Amortization |
References
- Sen, A. Development as Freedom; Oxford University Press: Oxford, UK, 1999. [Google Scholar]
- Rawls, J. A Theory of Justice; Harvard University Press: Cambridge, MA, USA, 1971. [Google Scholar]
- Gini, C. Measurement of Inequality of Incomes. Econ. J. 1921, 31, 124–125. [Google Scholar] [CrossRef]
- Lorenz, M.O. Methods of Measuring the Concentration of Wealth. Publ. Am. Stat. Assoc. 1905, 9, 209–219. [Google Scholar] [CrossRef]
- Theil, H. Economics and Information Theory; Nort-Holland: Amsterdam, The Netherlands, 1967. [Google Scholar]
- Milanovic, B. Global Inequality: A New Approach for the Age of Globalization; Harvard University Press: Cambridge, MA, USA, 2016. [Google Scholar]
- Dhongde, S.; Pattanaik, P.K.; Xu, Y. Inequality in Multidimensional Well-being in the United States. Rev. Income Wealth 2024, 70, 820–839. [Google Scholar] [CrossRef]
- Andreoli, F.; Zoli, C. From Unidimensional to Multidimensional Inequality: A Review. Metron 2020, 78, 5–42. [Google Scholar] [CrossRef]
- Giudici, P.; Raffinetti, E.; Toscani, G. Measuring Multidimensional Inequality: A New Proposal based on the Fourier Transform. arXiv 2024, arXiv:2401.14012. [Google Scholar] [CrossRef]
- Toscani, G. On Fourier-based Inequality Indices. Entropy 2022, 24, 1393. [Google Scholar] [CrossRef]
- Toscani, G. Measuring Multidimensional Heterogeneity in Emergent Social Phenomena. Eur. J. Appl. Math. 2024, 1, 1–12. [Google Scholar] [CrossRef]
- Ahelegbey, D.F.; Giudici, P. NetVIX—A Network Volatility Index of Financial Markets. Phys. A Stat. Mech. Appl. 2022, 597, 127017. [Google Scholar] [CrossRef]
- Brigham, E.O. The Fast Fourier Transform and Its Applications; Prentice-Hall, Inc.: Wilmington, DE, USA, 1988. [Google Scholar]
- De Maio, F.G. Income Inequality Measures. J. Epidemiol. Community Health 2007, 61, 849–852. [Google Scholar] [CrossRef]
- Cowell, F.A. Measuring Inequality; Oxford University Press: Oxford, UK, 2011. [Google Scholar]
- Atkinson, A.B. On the Measurement of Inequality. J. Econ. Theory 1970, 2, 244–263. [Google Scholar] [CrossRef]
- Kolm, S.C. Multidimensional Egalitarianisms. Q. J. Econ. 1977, 91, 1–13. [Google Scholar] [CrossRef]
- Atkinson, A.B.; Bourguignon, F. The Comparison of Multi-Dimensioned Distributions of Economic Status. Rev. Econ. Stud. 1982, 49, 183–201. [Google Scholar] [CrossRef]
- Maasoumi, E. The Measurement and Decomposition of Multi-Dimensional Inequality. Econometrica 1986, 54, 991–997. [Google Scholar] [CrossRef]
- Sen, A. Inequality Reexamined; Harvard University Press: Cambridge, MA, USA, 1995. [Google Scholar]
- Shorrocks, A.F. The Class of Additively Decomposable Inequality Measures. Econom. J. Econom. Soc. 1980, 48, 613–625. [Google Scholar] [CrossRef]
- Gray, R.M. Entropy and Information Theory; Springer Science & Business Media: Berlin/Heidelberg, Germany, 2011. [Google Scholar]
- Kullback, S. Information Theory and Statistics; Courier Corporation: North Chelmsford, MA, USA, 1997. [Google Scholar]
- Banerjee, A.K. A Multidimensional Gini Index. Math. Soc. Sci. 2010, 60, 87–93. [Google Scholar] [CrossRef]
- Johnson, R.A.; Wichern, D.W. Applied Multivariate Statistical Analysis, 6th ed.; Pearson Prentice Hall: Upper Saddle River, NJ, USA, 2007. [Google Scholar]
- UNDP. Human Development Report 1990; Oxford University Press: New York, NY, USA, 1990. [Google Scholar]
- Alkire, S.; Foster, J. Counting and Multidimensional Poverty Measurement. J. Public Econ. 2011, 95, 476–487. [Google Scholar] [CrossRef]
- Robeyns, I. The Capability Approach: A Theoretical Survey. J. Hum. Dev. 2005, 6, 93–117. [Google Scholar] [CrossRef]
- Alkire, S.; Santos, M.E. Measuring Acute Poverty in the Developing World: Robustness and Scope of the Multidimensional Poverty Index. World Dev. 2014, 59, 251–274. [Google Scholar] [CrossRef]
- Friede, G.; Busch, T.; Bassen, A. ESG and Financial Performance: Aggregated Evidence from more than 2000 Empirical Studies. J. Sustain. Financ. Invest. 2015, 5, 210–233. [Google Scholar] [CrossRef]
- Alshehhi, A.; Nobanee, H.; Khare, N. The Impact of Sustainability Practices on Corporate Financial Performance: Literature Trends and Future Research Potential. Sustainability 2018, 10, 494. [Google Scholar] [CrossRef]
- Saeed, A.; Alnori, F.; Yaqoob, G. Corporate Social Responsibility, Industry Concentration, and Firm Performance: Evidence from Emerging Asian Economies. Res. Int. Bus. Financ. 2023, 64, 101864. [Google Scholar] [CrossRef]
- Zheng, S.; Zhang, Q.; Zhang, P. Can Customer Concentration Affect Corporate ESG Performance? Financ. Res. Lett. 2023, 58, 104432. [Google Scholar] [CrossRef]
Disclaimer/Publisher’s Note: The statements, opinions and data contained in all publications are solely those of the individual author(s) and contributor(s) and not of MDPI and/or the editor(s). MDPI and/or the editor(s) disclaim responsibility for any injury to people or property resulting from any ideas, methods, instructions or products referred to in the content. |
© 2024 by the authors. Licensee MDPI, Basel, Switzerland. This article is an open access article distributed under the terms and conditions of the Creative Commons Attribution (CC BY) license (https://creativecommons.org/licenses/by/4.0/).