Article

An M/G/1 Queue with Repeated Orbit While in Service

1
Department of Industrial Engineering & Management, Ariel University, Ariel 40700, Israel
2
Department of Statistics and Operations Research, Tel Aviv University, Tel Aviv 69978, Israel
*
Author to whom correspondence should be addressed.
Mathematics 2024, 12(23), 3722; https://doi.org/10.3390/math12233722
Submission received: 29 October 2024 / Revised: 15 November 2024 / Accepted: 19 November 2024 / Published: 27 November 2024
(This article belongs to the Special Issue Queueing Systems Models and Their Applications)

Abstract

:
Orbit and retrial queues have been studied extensively in the literature. A key assumption in most of these works is that customers “go to orbit” when they are blocked upon arrival. However, real-life situations exist in which customers opt to go to orbit to efficiently use their orbit time rather than residing dormant at the service station while waiting for their service to be completed. This paper studies such a system, extending the scope of traditional orbit and retrial queues. We consider an M/G/1 queue where customers repeatedly go to orbit while their service remains in progress. That is, if a customer’s service is not completed by within a specified “patience time”, the customer goes to orbit for a random “orbit time”. When the customer orbits, the server continues rendering her/his service. If, on return, the service is already completed, the customer leaves the system. Otherwise, s/he waits for another patience time. This policy is repeated until service completion. We analyze such an intricate system by applying the supplementary variable technique and using Laplace–Stieltjes transforms. Performance measures are derived, and a comparison analysis is provided between various service time distributions.

1. Introduction

Orbit and retrial queues have been studied extensively in the queueing literature. The vast number of related works has been summarized in several publications, such as (i) the monograph by Falin and Tempelton [1], based on a careful analysis of several hundred publications; (ii) the comprehensive text by Artalejo and Gomez-Coral [2], which presents motivating examples in telephone and computer networks, while establishing a comparative analysis of retrial queues versus standard queues with waiting lines and queues with losses; (iii) a Special Issue (ANOR, Vol. 247) on Retrial Queues and Related Models edited by Gomez-Coral and Phung-Duc [3], comprising contributions by well-known experts in retrial and related queues; and many other references. A key assumption in most of these works is that customers who are blocked upon arrival immediately leave the system and “go to orbit” before their service even starts. After a random orbit time, they reattempt to gain admission to the service system. Many examples of retrial and orbit queues and their applications in daily life systems may be found in call centers, telecommunication systems, computer networks, and so-called “ticket queues” [4]. However, real-life situations exist in which customers may opt (or are obliged) to go to orbit while their service remains in progress. For example, consider a patient who passes a sequence of health examinations and related tests. It is unnecessary to wait for the results of one examination (e.g., blood test) before proceeding (i.e., “going to orbit”) to the next stage. Such a procedure reduces the customer’s overall treatment time. Another example is encountered in a supermarket delicatessen area where a customer may leave the area (i.e., go to orbit) and continue shopping while the order is being prepared. Similarly, a customer who brings her/his car to a garage and leaves the garage to perform some other errands before returning is a further example. Our model is also applicable to the construction area: when concrete is poured, the project is halted until the concrete is completely dry. This delay time is random, depending on external conditions. Thus, between the repeated tests, until the concrete is ready, the team is employed in other projects. Finally, we mention the field of aviation. Delaying flights to an unknown date forces the passenger to repeatedly check the status of their flight; in between checks, they utilize their time on other errands.
The above examples show that orbiting while in service may utilize customers’ time and increase overall efficiency. Yet, it appears that the queueing literature has given minimal attention to these scenarios. Only recently, Hanukov and Yechiali [5] extended the scope of analysis of traditional orbit and retrial queues by studying an M/G/1 queueing system where impatient and time-use-oriented customers go to orbit while their service remains in progress to efficiently use their scarce time, rather than wait dormant at the service station until their service is completed. In that work, each customer served may exercise the “go to orbit” option no more than once during her/his service period. Nevertheless, customers may go to orbit and back multiple times while their service is in progress. Hanukov [6] analyzed this version for the M/M/1 queue with a limited number of customers in orbit by applying the matrix geometric technique. In the current paper, we further expand the scope of analysis of “orbit while in service” queues by studying an M/G/1 queueing system with an unlimited number of customers in orbit, where each customer may repeatedly go to orbit and back while her/his service is being processed.
Specifically, each customer whose service has begun (after reaching the head of the line) waits inside the system for a random amount of time (called “patience time”) and then, if the service has not yet been completed, goes to orbit for a random amount of time (called “orbit time”) before returning to the system to determine the status of her/his service. While the customer is in orbit, the server continues rendering service for that customer. On the customer’s return, if the service has not yet been completed, s/he again waits inside the system for a “patience time,” at the end of which, if the service is not yet completed, s/he takes another orbit time outside the system. The customer continues acting according to this policy until the service is completed, either when the customer is in the system or still orbiting. If the customer’s service is completed while s/he is in orbit, the server proceeds to serve the next customers in the queue (if any). We aim to analyze this intricate system and derive its performance measures.
An important tool in our analysis is the supplementary variable technique (SVT), which is frequently used in the context of queueing systems analyses. In contrast to models having one (or more) bounded dimension, and thus allowing the use of matrix-geometric methods (see, e.g., [6]), the current model deals with a system having two unbounded dimensions of the state space, which leads to the use of SVT technique. In general, two kinds of supplementary variables are considered in the literature. One is the elapsed service (or arrival) time; the other is the remaining service (or arrival) time. The use of the SVT for the elapsed service time was first applied by Kosten [7] and Knessl et al. [8]. The method of using the remaining service time as the supplementary variable was first proposed by Henderson [9] and later used by Klimko and Neuts [10] and Minh [11]. The SVT has also been used in inventory models and reliability analyses [12]; see also Cohen [13] Ch. II.6.
In the current paper, applying the SVT enables the derivation of closed-form expressions for the probability generating function (PGF) and the mean number of customers in the system. Note that here we use the SVT for the elapsed service time, since using the SVT for the remaining service time mainly leads to recursive expressions (see, e.g., [12,14]).
Other contributions are as follows:
-
We derive the Laplace–Stieltjes transforms (LSTs) for the following customer sojourn times: (a) V = the service-related sojourn time of a customer in the system calculated from the instant s/he starts service until departure, including time in orbit; and (b) H = the length of time a customer remains in orbit after her/his service has been completed.
-
For an arbitrary customer, we obtain the mean number of orbits until departure.
-
We provide a comparison study of various performance measures considering different service time distributions, including the family of gamma distributions (spanning the range between the exponential and deterministic distributions), as well as the uniform distribution. The comparison study reveals the following qualitative conclusions:
(i).
As customers spend more time in orbit and the service time variance decreases, a higher improvement is achieved in the system’s performance.
(ii).
If customers go more often to orbit (i.e., their patience time is shorter), or when they spend longer periods in orbit, their sojourn time inside the system is reduced, implying more efficient time use. However, their mean total time in the system (service plus orbit) is higher.
(iii).
The mean total sojourn time in the system (inside and in orbit) is highest when the service time is deterministic, and the lowest values are obtained when the service time is exponential. Conversely, a lower mean sojourn time excluding orbit is achieved when the service time is deterministic, while the highest is when the service time is exponential.
(iv).
The service time variance affects the mean number of orbits in opposite directions. In some cases, it is higher under the uniform distribution than under the exponential distribution, while in other cases, the opposite occurs.
The paper continues as follows: Section 2 presents a short literature review of related models. Section 3 describes the paper’s model and depicts a flow scheme of the system. Applying the SVT, Section 4 derives the PGF and the mean number of customers in the system. Section 5 derives the LSTs of various sojourn times, and Section 6 presents a comparison study. Section 7 provides concluding remarks and managerial insights.

2. Related Literature

In addition to the manuscripts [1,2] and the special issue [3] cited in the introduction, many papers addressing orbit and retrial queues have appeared in the literature. For example, Kulkarni and Choi [15] consider a single server retrial queue where the server is subject to breakdowns and repairs. Two models are considered. In model I, the failed server cannot be occupied, and a customer whose service is interrupted either leaves the system or rejoins the retrial group. In model II, a customer whose service is interrupted by a failure remains with the server and restarts service when the repair process is completed. Recently, Kerner and Shmuel-Bittner [16] investigated strategic customer behavior in a hybrid M/M/1 queue with retrials. Both the Nash equilibrium and socially optimal retrial rates were studied. Fiems [17] studies the M/D/1 system with constant retrial times. The author derives explicit expressions for the distribution of the number of retrials and shows that it follows a geometric distribution. Dimitriou [18] considers a single-server retrial queue with event-dependent arrival rates. Performance measures are explicitly derived, and extensive numerical examples are provided, investigating the impact of event dependency. Jeganathan et al. [19] study a retrial queueing-inventory system where junior servers approach a single senior server on behalf of customers. Hu et al. [20] investigate customer retrials in call centers while considering service quality regarding the service speed. The authors reveal that high service quality and fast pick-up speed reduce retrials. It is revealed that, compared to business customers, private customers are more sensitive to quality but less sensitive to speed. Zhang and Wang [21] consider retrial queueing systems with boundedly rational customers. The authors find that the revenue-optimal price is no longer socially efficient generally but depends on the retrial rate. Furthermore, a threshold exists such that the socially optimal price exceeds the revenue-optimal one when the retrial rate is below this threshold; otherwise, the revenue-optimal price is greater. Xu et al. [22] analyze a retrial queueing system with priorities, where a new external arrival either expels the customer being served from the system and directly starts service or joins the retrial orbit. The server has multiple vacations whenever the orbit is empty of customers. Won et al. [23] consider an M/G/1 retrial queue with two types of calls: incoming calls made by regular customers and outgoing calls made by the server during its idle time. The service times of incoming and outgoing calls have non-identical distributions. The main interest of the paper is to analyze the waiting time distribution. Avrachenkov and Yechiali [24] investigate retrial networks and their application to internet data traffic, considering several benchmark retrial models. In all these works, customers go to orbit before joining the queue or before their service starts. Conversely, in our work, customers go to orbit while their service remains in progress.
Another stream of literature related to our work addresses so-called “impatient” customers who abandon the system if their waiting time before service initiation becomes too long. This topic has also been widely studied. Yechiali [25] investigates queues in which customers become impatient when the system is down and derives various quality-of-service measures: the mean sojourn time of a served customer, proportion of customers served, rate of lost customers due to disasters, and rate of abandonments due to impatience. Liu and Li [26] investigate a double-ended queue with first-come-first-match discipline under impatient customer behavior. The authors express the system as a level-dependent quasi-birth-and-death process with an infinite number of phases and provide a method to investigate the sojourn time of any arriving customer. Aalto [27] considers the optimal scheduling problem in a multi-server queue with impatient customers belonging to multiple classes. It is assumed that the scheduler cannot anticipate the expiration of the abandonment times but only knows their distributions and how long each customer has been in the system. Manitz and Piehl [28] investigate a multistage call center (comprising a front and a back office) and impatient customers. The main question is how many agents are necessary and how they should be allocated to maintain a service-level threshold and reduce the customer’s expected waiting time. Lv et al. [29] analyze an M/M/c retrial queueing system with server working breakdown and impatient customers. Numerical experiments are conducted to assess the system’s steady-state performance indicators. Altman and Yechiali [30,31] study cases where customers become impatient and leave the system only when the server is on vacation. Namely, an arriving customer who finds that the server is on vacation activates a random “impatience timer”, such that if the system does not become available by the time the timer expires, the customer leaves the system. Inoue et al. [32] study a service system in which arriving customers are provided with information about the delay they will experience. Based on this information, they decide to wait for service or leave the system. Specifically, every customer has a patience threshold and balks if the observed delay exceeds the threshold. The main objective is to estimate the parameters of the customer patience-level distribution and the corresponding potential arrival rate, using knowledge of the actual queue-length process only. Bassamboo et al. [33] study scheduling multi-class impatient customers in queueing systems comprising parallel servers. The authors propose a multi-class time-in-queue policy that prioritizes across customer classes and within each class using a simple rule. For further discussion on customer impatience, see a recent survey paper [34] that develops a classification scheme of queueing models with customer impatience that includes vacation, feedback, priority service, and retention of reneging customers. It should be indicated that in all the above-mentioned “impatience” papers, the customers abandon the system permanently before their service has begun. Conversely, in our work, impatient customers do not leave the system but repeatedly go to orbit and back during their service process until it is completed.
It should be noted that models where customers “go to orbit” are inherently different from models where servers, not customers, go to “vacation”, usually when the system becomes empty. Notable works on server vacations are [35,36,37,38]. For recent works dealing with vacations, among others, we mention, e.g., [39,40,41].
Another related set of models is queueing systems with feedback. In those models, if service is not successful, the customer repeats her/his service process. Recent related literature can be found in, e.g., [42,43,44,45]. In the latter papers, the customers may rejoin the system after their service has failed. In contrast, in our model, customers rejoin the system when the service is still in progress.

3. Model Description

Consider a single-server queueing system where customer arrival follows a Poisson process with rate  λ . The service time is a random variable, B, with probability density function  f B ( t ) , cumulative distribution function  F B ( t ) , complementary cumulative distribution function  F ¯ B ( t ) = 1 F B ( t ) , and  LST E [ e s B ] = B ˜ ( s ) . After a customer’s service starts, s/he is willing to wait a random “patience time” T, exponentially distributed with parameter  α ( T E x p ( α ) ) ,  for the service to be completed. If the service is completed before the patience time expires (i.e.,  B T ), the customer leaves the system on service completion. However, if the service has not been completed by time T (i.e.,  T < B ), the customer goes to orbit for a random “orbit time”  X E x p ( β ) . While the customer is in orbit, the server continues rendering service for that customer. When the customer returns from orbit and finds that her/his service is already completed (i.e.,  B < T + X ), s/he picks her/his order and leaves the system. Otherwise, s/he waits again in the system for another patience time  T 2 T . If the service has not been completed by that time  ( T 2 < B T X ) , s/he leaves again for another orbit time,  X 2 X . This process is repeated until the customer’s service is completed, whether s/he is inside the system or in orbit at the service completion instant. If a customer’s service is completed while s/he is in orbit, the server continues serving the next customers (if any) in the queue. Figure 1 depicts the flow scheme of the system.

4. Formulation and Analysis

Consider the system in a steady state. Let  L { 0 , 1 , 2 , }  denote the number of customers in the system (not including those in orbit), and let  S { 1 , 2 }  denote the status of the served customer as follows:
S = 1 t h e c u s t o m e r i s i n t h e s y s t e m 2 t h e c u s t o m e r i s i n o r b i t
Let  U R +  denote the elapsed time since the start of service of the served customer (including orbit if applicable). Then,  { L , S , U }  defines the system’s state space. Let  p ( n , m , u )  denote the density function for the state  { L = n , S = m , U = u } n = 0 , 1 , 2 , m = 1 , 2 u 0 . Additionally, let  p ( 0 )  denote the probability of zero customers in the system and no orbiting customer in service.
We proceed to derive the mean number of customers in the system, not including those in orbit. For this purpose, we first define the following partial PGFs corresponding to the two possible values of  m = 1 , 2 :
G 1 ( z , u ) = n = 1 p ( n , 1 , u ) z n ,   G 2 ( z , u ) = n = 0 p ( n , 2 , u ) z n
The partial PGFs,  G 1 ( z , u )  and  G 2 ( z , u ) , are given in the following lemma.
Lemma 1.
G 1 ( z , u )  and  G 2 ( z , u )  are given as a function of    p ( 0 )  as follows:
G 1 ( z , u ) = z λ ( 1 z ) p ( 0 ) ( α + β ) ( B ˜ ( λ ( 1 z ) ) z ) β e λ ( 1 z ) u F ¯ B ( u ) + α e ( λ ( 1 z ) + α + β ) u F ¯ B ( u )
G 2 ( z , u ) = α λ ( 1 z ) p ( 0 ) ( α + β ) ( B ˜ ( λ ( 1 z ) ) z ) e λ ( 1 z ) u F ¯ B ( u ) e ( λ ( 1 z ) + α + β ) u F ¯ B ( u )
Proof. 
We apply the SVT. Let  μ ( u )  be the hazard rate function of the service time. Then, the density function  p ( n , m , u )  satisfies the following equations:
p ( n , 1 , u + h ) = λ h p ( n 1 , 1 , u ) + β h p ( n 1 , 2 , u ) + [ 1 ( λ + μ ( u ) + α ) h ] p ( n , 1 , u ) + o ( h ) n = 1 , 2 , 3 , ,   u > 0 , where   p ( 0 , 1 , u ) = 0 , and
p ( n , 2 , u + h ) = λ h p ( n 1 , 2 , u ) + α h p ( n + 1 , 1 , u ) + [ 1 ( λ + μ ( u ) + β ) h ] p ( n , 2 , u ) + o ( h ) n = 0 , 1 , 2 , ,   u > 0 ,   where   p ( 1 , 2 , u ) = 0 ,
where  lim h 0 o ( h ) h = 0 .
The first term in Equations (3) and (4) refers to the arrival of a new customer. The second term of Equation (3) refers to the orbit termination, and the second term of Equation (4) refers to the patience time termination. The last term in Equations (3) and (4) refers to the corresponding complementary event.
Dividing Equations (3) and (4) by h, and letting  h 0  leads to
d d u p ( n , 1 , u ) = λ p ( n 1 , 1 , u ) + β p ( n 1 , 2 , u ) ( λ + μ ( u ) + α ) p ( n , 1 , u ) ,   n = 1 , 2 , 3 ,
d d u p ( n , 2 , u ) = λ p ( n 1 , 2 , u ) + α p ( n + 1 , 1 , u ) ( λ + μ ( u ) + β ) p ( n , 2 , u ) ,   n = 0 , 1 , 2 , .
Multiplying Equations (5) and (6) by the corresponding  z n  and summing over all n, we obtain the following set of differential equations for the two PGFs,  G m ( z , u ) m = 1 , 2 :
d d u G 1 ( z , u ) = [ λ ( z 1 ) μ ( u ) α ] G 1 ( z , u ) + β z G 2 ( z , u ) ,
d d u G 2 ( z , u ) = [ λ ( z 1 ) μ ( u ) β ] G 2 ( z , u ) + α z 1 G 1 ( z , u ) .
Using the Maple software, the solution of Equations (7) and (8) is given by
G 1 ( z , u ) = C 1 e λ ( 1 z ) u 0 u μ ( t ) d t + C 2 e ( λ ( 1 z ) + α + β ) u 0 u μ ( t ) d t ,
G 2 ( z , u ) = C 1 α ( β z ) 1 e λ ( 1 z ) u 0 u μ ( t ) d t C 2 z 1 e ( λ ( 1 z ) + α + β ) u 0 u μ ( t ) d t
Substituting the identity  F ¯ B ( u ) = e 0 u μ ( t ) d t  (see, e.g., Ross, page 389 [46]) into Equations (9) and (10) leads to
G 1 ( z , u ) = C 1 e λ ( 1 z ) u F ¯ B ( u ) + C 2 e ( λ ( 1 z ) + α + β ) u F ¯ B ( u ) ,
G 2 ( z , u ) = C 1 α ( β z ) 1 e λ ( 1 z ) u F ¯ B ( u ) C 2 z 1 e ( λ ( 1 z ) + α + β ) u F ¯ B ( u ) .
The constants  C 1  and  C 2  are derived by substituting the initial condition  u = 0  into Equations (11) and (12). Setting  F ¯ B ( 0 ) = 1  and  G 2 ( z , 0 ) = 0  leads to
G 1 ( z , 0 ) = C 1 + C 2 ,
0 = C 1 α ( β z ) 1 C 2 z 1 .
The solution of Equations (13) and (14) is
C 1 = β ( α + β ) 1 G 1 ( z , 0 ) ,
C 2 = α ( α + β ) 1 G 1 ( z , 0 ) .
Substituting Equations (15) and (16) into Equations (11) and (12), we obtain  G 1 ( z , u )  and  G 2 ( z , u )  as a function of  G 1 ( z , 0 ) :
G 1 ( z , u ) = G 1 ( z , 0 ) α + β β e λ ( z 1 ) u F ¯ B ( u ) + α e ( λ ( z 1 ) α β ) u F ¯ B ( u ) ,
G 2 ( z , u ) = α G 1 ( z , 0 ) z ( α + β ) e λ ( z 1 ) u F ¯ B ( u ) e ( λ ( z 1 ) α β ) u F ¯ B ( u ) .
To complete our analysis, we derive  G 1 ( z , 0 )  as follows: Define
p ( 1 , 1 , 0 ) = 0 [ p ( 2 , 1 , u ) + p ( 1 , 2 , u ) ] μ ( u ) d u + λ p ( 0 ) ,
p ( n , 1 , 0 ) = 0 [ p ( n + 1 , 1 , u ) + p ( n , 2 , u ) ) ] μ ( u ) d u ,   n = 2 , 3 , 4 , ,
corresponding to the transition from state  ( n + 1 , 1 , u )  and state  ( n , 2 , u )  to state  ( n , 1 , 0 )  due to a service termination. The last term in Equation (19) expresses the event of a customer’s arrival.
Multiplying Equations (19) and (20) by  z n  and summing over all n, we obtain
z G 1 ( z , 0 ) = 0 ( G 1 ( z , u ) z p ( 1 , 1 , u ) + z G 2 ( z , u ) z p ( 0 , 2 , u ) ) μ ( u ) d u + z 2 λ p ( 0 ) .
To derive the right-hand side of (21), we use the balance equation:
λ p ( 0 ) = 0 [ p ( 1 , 1 , u ) + p ( 0 , 2 , u ) ] μ ( u ) ) d u .
Substituting Equation (22) into Equation (21) leads to
z G 1 ( z , 0 ) = 0 G 1 ( z , u ) + z G 2 ( z , u ) μ ( u ) d u z λ p ( 0 ) + z 2 λ p ( 0 ) .
Substituting  F ¯ B ( u ) μ ( u ) = f B ( u ) , and Equations (17) and (18) into Equation (23), we obtain, after some algebra,
G 1 ( z , 0 ) = z λ ( 1 z ) p ( 0 ) ( B ˜ ( λ ( 1 z ) ) z ) .
The proof of Lemma 1 is completed by substituting Equation (24) into Equation (17) and into Equation (18). □
We further define  p ( n , m ) = P ( L = n , S = m )  and the two partial PGFs of the number of customers in the system:
G 1 ( z ) = n = 1 p ( n , 1 ) z n = 0 G 1 ( z , u ) d u ,
G 2 ( z ) = n = 0 p ( n , 2 ) z n = 0 G 2 ( z , u ) d u .
Theorem 1.
The partial PGFs   G 1 ( z )  and  G 2 ( z )  are given by
G 1 ( z ) = z ( 1 λ E [ B ] ) ( α + β ) ( B ˜ ( λ ( 1 z ) ) z ) β ( 1 B ˜ ( λ ( 1 z ) ) ) + λ α ( 1 z ) ( 1 B ˜ ( λ ( 1 z ) + α + β ) ) ( ( λ ( 1 z ) + α + β ) ) ,
G 2 ( z ) = α ( 1 λ E [ B ] ) ( α + β ) ( B ˜ ( λ ( 1 z ) ) z ) ( 1 B ˜ ( λ ( 1 z ) ) ) λ ( 1 z ) ( 1 B ˜ ( λ ( 1 z ) + α + β ) ) ( λ ( 1 z ) + α + β ) .
Proof. 
For an arbitrary function  g ( z ) , we use the identity
0 e g ( z ) u F ¯ B ( u ) d u = 1 B ˜ ( g ( z ) ) g ( z )
(see Ross, page 390 [46]). Then, substituting Equations (24)–(26) into Equations (17) and (18), and applying identity (29), the PGFs can be expressed as functions of  p ( 0 )  as follows:
G 1 ( z ) = p ( 0 ) z β ( 1 B ˜ ( λ ( 1 z ) ) ) ( α + β ) ( B ˜ ( λ ( 1 z ) ) z ) + z λ α ( 1 z ) ( 1 B ˜ ( λ ( 1 z ) + α + β ) ) ( α + β ) ( B ˜ ( λ ( 1 z ) ) z ) ( ( λ ( 1 z ) + α + β ) ) ,
G 2 ( z ) = p ( 0 ) α ( 1 B ˜ ( λ ( 1 z ) ) ) ( α + β ) ( B ˜ ( λ ( 1 z ) ) z ) λ α ( 1 z ) ( 1 B ˜ ( λ ( 1 z ) + α + β ) ) ( α + β ) ( B ˜ ( λ ( 1 z ) ) z ) ( ( λ ( 1 z ) + α + β ) ) .
Now,  p ( 0 )  is calculated by solving  p ( 0 ) + G 1 ( z = 1 ) + G 2 ( z = 1 ) = 1  and using L’Hôpital’s rule. As expected,  p ( 0 )  is given by
p ( 0 ) = 1 λ E [ B ] .
Substituting Equation (32) into Equations (30) and (31) proves Theorem 1. □
Two points should be mentioned.
(i).
The time that customers spend in orbit does not affect the utilization of the server, as expressed in Equation (32).
(ii).
If the customer’s patience time is unbounded, or if the orbit time tends to zero, we obtain the PGF of the number of customers in the classical M/G/1 queue, namely,
p ( 0 ) + G 1 ( z ) + G 2 ( z ) α 0 ( 1 z ) B ˜ ( λ ( 1 z ) ) B ˜ ( λ ( 1 z ) ) z 1 λ E [ B ] ,
p ( 0 ) + G 1 ( z ) + G 2 ( z ) β ( 1 z ) B ˜ ( λ ( 1 z ) ) B ˜ ( λ ( 1 z ) ) z 1 λ E [ B ] .
Finally, the mean number of customers in the system,  E [ L ] , is given in the next theorem.
Theorem 2.
E [ L ] = λ E [ B ] + λ 2 E [ B 2 ] 2 ( 1 λ E [ B ] ) α λ α + β E [ B ] 1 B ˜ ( α + β ) α + β .
Proof. 
Applying  E [ L ] = d G 1 ( z ) d z z = 1 + d G 2 ( z ) d z z = 1  and using L’Hôpital’s rule leads to Equation (30). □
Note that Equation (33) can be written as
E [ L ] = E [ L M / G / 1 ] α λ α + β E [ B ] 1 B ˜ ( α + β ) α + β ,
where  E [ L M / G / 1 ]  is the mean number of customers in the system in the classical M/G/1 queue.
Stability condition. It is instructive to emphasize that the system’s stability condition is identical to that of the classical M/G/1 queue, namely,  λ E [ B ] < 1 . This follows since service is not interrupted and the server continues rendering service when the customers go to orbit. Formally, the above condition is obtained as a result of  p ( 0 ) > 0  (see, Equation (32)).

5. Customer’s Sojourn Times and Number of Orbits

In this section, we derive LSTs of two important sojourn times and calculate the mean number of orbits of an arbitrary customer. Specifically, we focus on (i) a customer’s sojourn time from the moment s/he starts service until her/his departure (including orbit time), (ii) the orbit time of a customer after her/his service is completed, and (iii) the number of orbit excursions made by an arbitrary customer.
To this end, we first define the following random variables.
Let  T ( k ) = i = 1 k T i  be the sum of k independent patience times  T i , each distributed as T. Since  T E x p ( α ) T ( k )  is Erlang distributed with k stages, that is,  T ( k ) E r l a n g ( k , α ) . Similarly, let  X ( k ) = i = 1 k X i  be the sum of k independent orbit times  X i , each distributed as  X E x p ( β ) , implying that  X ( k ) E r l a n g ( k , β ) .
Define  Y ( k ) = T ( k ) + X ( k ) . The probability distribution function of  Y ( k )  is given by
F Y ( k ) ( y ) P ( Y ( k ) y ) = t = 0 y f T ( k ) ( t ) x = 0 y t f X ( k ) ( x ) d x d t = t = 0 y α k t k 1 e α t ( k 1 ) ! x = 0 y t β k x k 1 e β x ( k 1 ) ! d x d t .
The density function of  Y ( k )  is
f Y ( k ) ( y ) = d F Y ( k ) ( y ) d y .
For example, for  k = 1 , we have
F Y ( 1 ) ( y ) = 1 + β e α y α e β y α β   and   f Y ( 1 ) ( y ) = α β ( e β y e α y ) α β .
For  k = 2 , we obtain
F Y ( 2 ) ( y ) = 1 + β 2 ( β 3 α α ( α β ) y ) e α y α 2 ( α 3 β β ( β α ) y ) e β y ( α β ) 3 ,
f Y ( 2 ) ( y ) = α 2 β 2 ( ( ( β α ) y 2 ) e α y ( ( α β ) y 2 ) e β y ) α β .
Let V denote the sojourn time of a customer in the system from the moment s/he starts service until her/his departure, including the time in orbit.
Theorem 3.
The LST of V is given by
V ˜ ( s ) = b = 0 t = 0 b x = b t e s ( t + x ) f B ( b ) f T ( t ) f X ( x ) d x d t d b + k = 2 b = 0 y = 0 b t = 0 b y x = b y t e s ( y + t + x ) f B ( b ) f Y ( k 1 ) ( y ) f T ( t ) f X ( x ) d x d t d y d b + b = 0 t = b e s b f B ( b ) f T ( t ) d t d b + k = 1 b = 0 y = 0 b t = b y e s b f B ( b ) f Y ( k ) ( y ) f T ( t ) d t d y d b .
Proof. 
Two possible scenarios exist: (i) the customer goes to orbit  k  times, and the service is completed while s/he is in orbit. Under this scenario, the customer’s sojourn time is  Y ( k ) ,  the sum of k independent patience times plus k independent orbit times; (ii) the customer goes to orbit  k  times, and the service is completed while s/he is in the system. Under this scenario, the customer’s sojourn time is equal to the service time, B. Considering these two scenarios, V is equal to
V = Y ( k ) i f Y ( k 1 ) + T k < B < Y ( k ) , k = 1 , 2 , 3 , , B   i f Y ( k ) < B < Y ( k ) + T k + 1 , k = 0 , 1 , 2 , 3 , .
Note that  T k  refers to a customer’s  k t h  patience time, where all  T k  are independent and identically distributed (i.i.d.) as T.
Applying Equation (37), the LST of V is given by
V ˜ ( s ) = E k = 1 E [ e s Y ( k ) Y ( k 1 ) + T k < B < Y ( k ) ] P ( Y ( k 1 ) + T k < B < Y ( k ) ) + k = 0 E [ e s B Y ( k ) < B < Y ( k ) + T k + 1 ] P ( Y ( k ) < B < Y ( k ) + T k + 1 ) .
The first line of Equation (38) leads to the first two lines in Equation (36), and the second line of Equation (38) leads to the third line in Equation (36). This completes the proof. □
Now, a customer’s mean total service time  E [ V ]  is given by
E [ V ] = d V ˜ ( s ) d s s = 0 .
Next, let H denote the time a customer remains in orbit after her/his service has been completed.
Theorem 4.
The LST of H is given by
H ˜ ( s ) = b = 0 t = 0 b x = b t e s ( t + x b ) f B ( b ) f T ( t ) f X ( x ) d x d t d b + k = 2 b = 0 y = 0 b t = 0 b y x = b y t e s ( y + t + x b ) f B ( b ) f Y ( k 1 ) ( y ) f T ( t ) f X ( x ) d x d t d y d b + 1 b = 0 t = 0 b x = b t f B ( b ) f T ( t ) f X ( x ) d x d t d b k = 2 b = 0 y = 0 b t = 0 b y x = b y t f B ( b ) f Y ( k 1 ) ( y ) f T ( t ) f X ( x ) d x d t d y d b .
Proof. 
Two possible scenarios exist: (i) the customer goes to orbit  k  times, and her/his service is completed while s/he is in orbit. Under this scenario, the time a customer remains in orbit after her/his service has been completed is equal to  Y ( k ) B , that is, the sum of k independent patience times plus k independent orbit times minus the generic service time B. (ii) For other cases, the customer does not remain in orbit after service completion.
Considering these two scenarios, H is equal to
H = Y ( k ) B i f Y ( k 1 ) + T k < B < Y ( k ) , k = 1 , 2 , 3 , , 0 O t h e r w i s e .
Applying Equation (41), the LST of H is given by
H ˜ ( s ) = E [ e s ( Y ( k ) B ) Y ( k 1 ) + T k < B < Y ( k ) ] P ( Y ( k 1 ) + T k < B < Y ( k ) ) + 1 ( 1 P ( Y ( k 1 ) + T k < B < Y ( k ) ) ) .
Equation (42) leads to Equation (40), which proves Theorem 4. □
Thus, the mean remaining orbit time after service completion is given by
E [ H ] = d H ˜ ( s ) d s s = 0 .
Let O denote the number of orbit excursions made by an arbitrary customer before leaving the system.
Theorem 5.
The mean number of orbits until departure,  E [ O ] , is calculated by
E [ O ] = k = 1 k P ( O = k ) = k = 1 k P ( Y ( k 1 ) + T k < B < Y ( k ) ) + P ( Y ( k ) < B < Y ( k ) + T k + 1 ) ,
which is explicitly given by
E [ O ] = 1 b = 0 t = 0 b x = b t f B ( b ) f T ( t ) f X ( x ) d x d t d b + k = 2 k b = 0 y = 0 b t = 0 b y x = b y t f B ( b ) f Y ( k 1 ) ( y ) f T ( t ) f X ( x ) d x d t d y d b + k = 1 k b = 0 y = 0 b t = b y f B ( b ) f Y ( k ) ( y ) f T ( t ) d t d y d b .
Proof. 
The above expression for  E [ O ]  follows directly from Equation (37).

6. Impact of Different Service Time Distributions

In this section, we numerically investigate the impact of different service time distributions on the system’s performance measures. Specifically, we focus on five measures: (1) mean number of customers in the system (Figure 2 and Figure 3); (2) mean sojourn time excluding orbit time (Figure 4 and Figure 5); (3) mean total customer sojourn time (including orbit; Figure 6 and Figure 7); (4) mean remaining orbit time after service completion (Figure 8 and Figure 9); and (5) mean number of orbits by a customer (Figure 10, Figure 11 and Figure 12). Additional Figures S1–S5 are presented in a Supplementary Materials File.
We consider the family of (a) gamma distribution functions, spanning the range between the exponential distribution having coefficient of variation  C V = 1  and the deterministic distribution with  C V = 0 , and (b) the uniform distribution.
Specifically, we consider the following:
(i).
The gamma distribution with scale  γ  and shape  γ μ . That is,  B Γ ( γ , γ μ ) , with  E [ B ] = γ γ μ = 1 μ E [ B 2 ] = 1 + γ γ μ 2 V [ B ] = 1 γ μ 2 , LST  B ˜ ( s ) = γ μ γ μ + s γ , and  C V 2 = 1 γ .
(ii).
The exponential distribution B E x p ( μ ) , which is a special extreme case of the gamma distribution with  γ = 1 .
(iii).
The deterministic distribution obtained from the gamma distribution by letting  γ .
(iv).
The uniform distribution B U 0 , 2 μ , with  E [ B ] = 1 μ E [ B 2 ] = 4 3 μ 2 V [ B ] = 1 3 μ 2 , LST  B ˜ ( s ) = μ 2 s 1 e 2 s μ , and  C V 2 = 1 3 .
Note again that all these distributions have an equal mean  E [ B ] = 1 μ  but a different variance, enabling us to investigate the effect of the randomness of the service time on the system’s performance.

6.1. Mean Number of Customers, E[L]

Let  E [ L d i s ]  denote the mean number of customers in the system with service time distribution dis. We set  λ = 8 μ = 10 α = 18 , and  β = 20 . Figure S1 (in the Supplementary Materials File) depicts  E [ L d i s ]  as a function of  γ = { 1 , 2 , , 200 }  for  d i s { G a m m a ( γ ) , D e t e r , U n i f } . The solid blue, dashed red, and dash-dotted green curves refer to gamma, deterministic, and uniform distributions, respectively. It is observed that  E [ L d i s ]  decreases as a function of  γ , demonstrating that the mean number of customers decreases when the variance decreases ( γ  increases). As expected, when  γ E [ L G a m m a ( γ ) ]  converges to  E [ L D e t e r ] . We also note that  E [ L G a m m a ( γ = 3 ) ] = E [ L U n i f ] .
To further investigate the impact of the different distributions on  E [ L ] , we let
ξ = E [ L E x p ] E [ L D e t e r ] ,   ω = E [ L E x p ] E [ L U n i f ] ,   ψ = E [ L U n i f ] E [ L D e t e r ]
be the ratios of the mean number of customers under the different distributions. Note that  E [ L E x p ] = E [ L G a m m a ( γ = 1 ) ] .
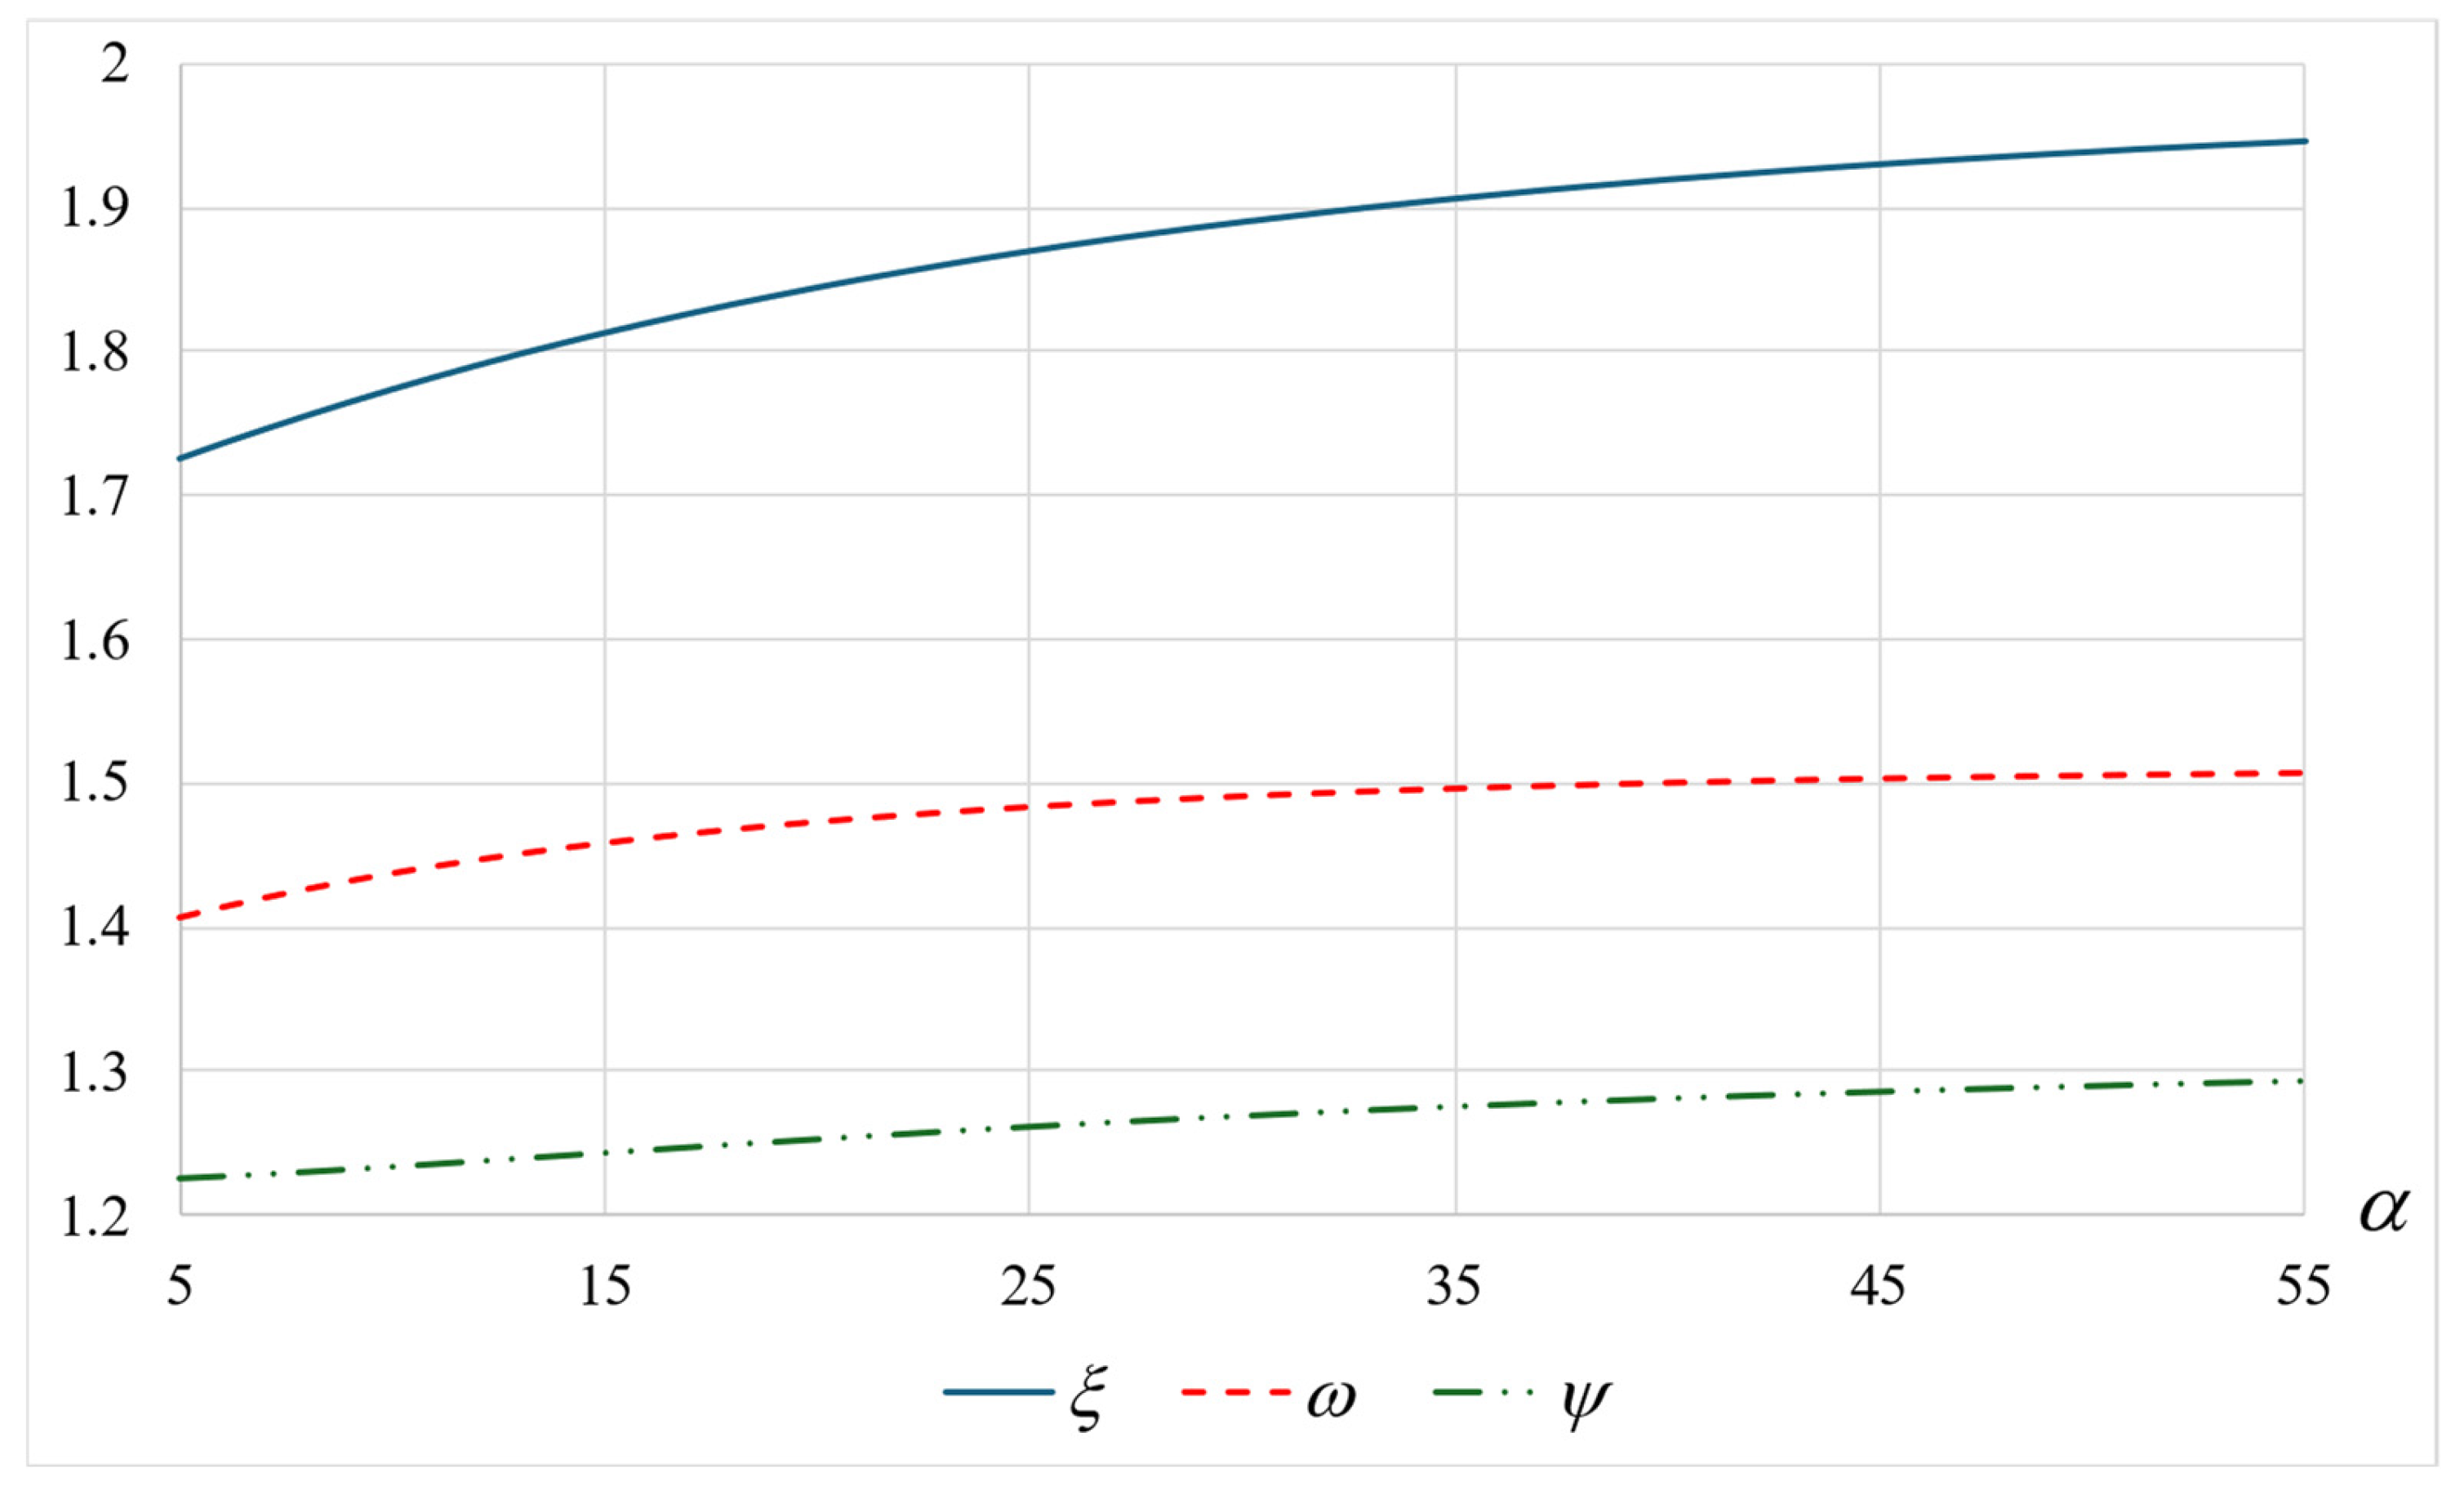
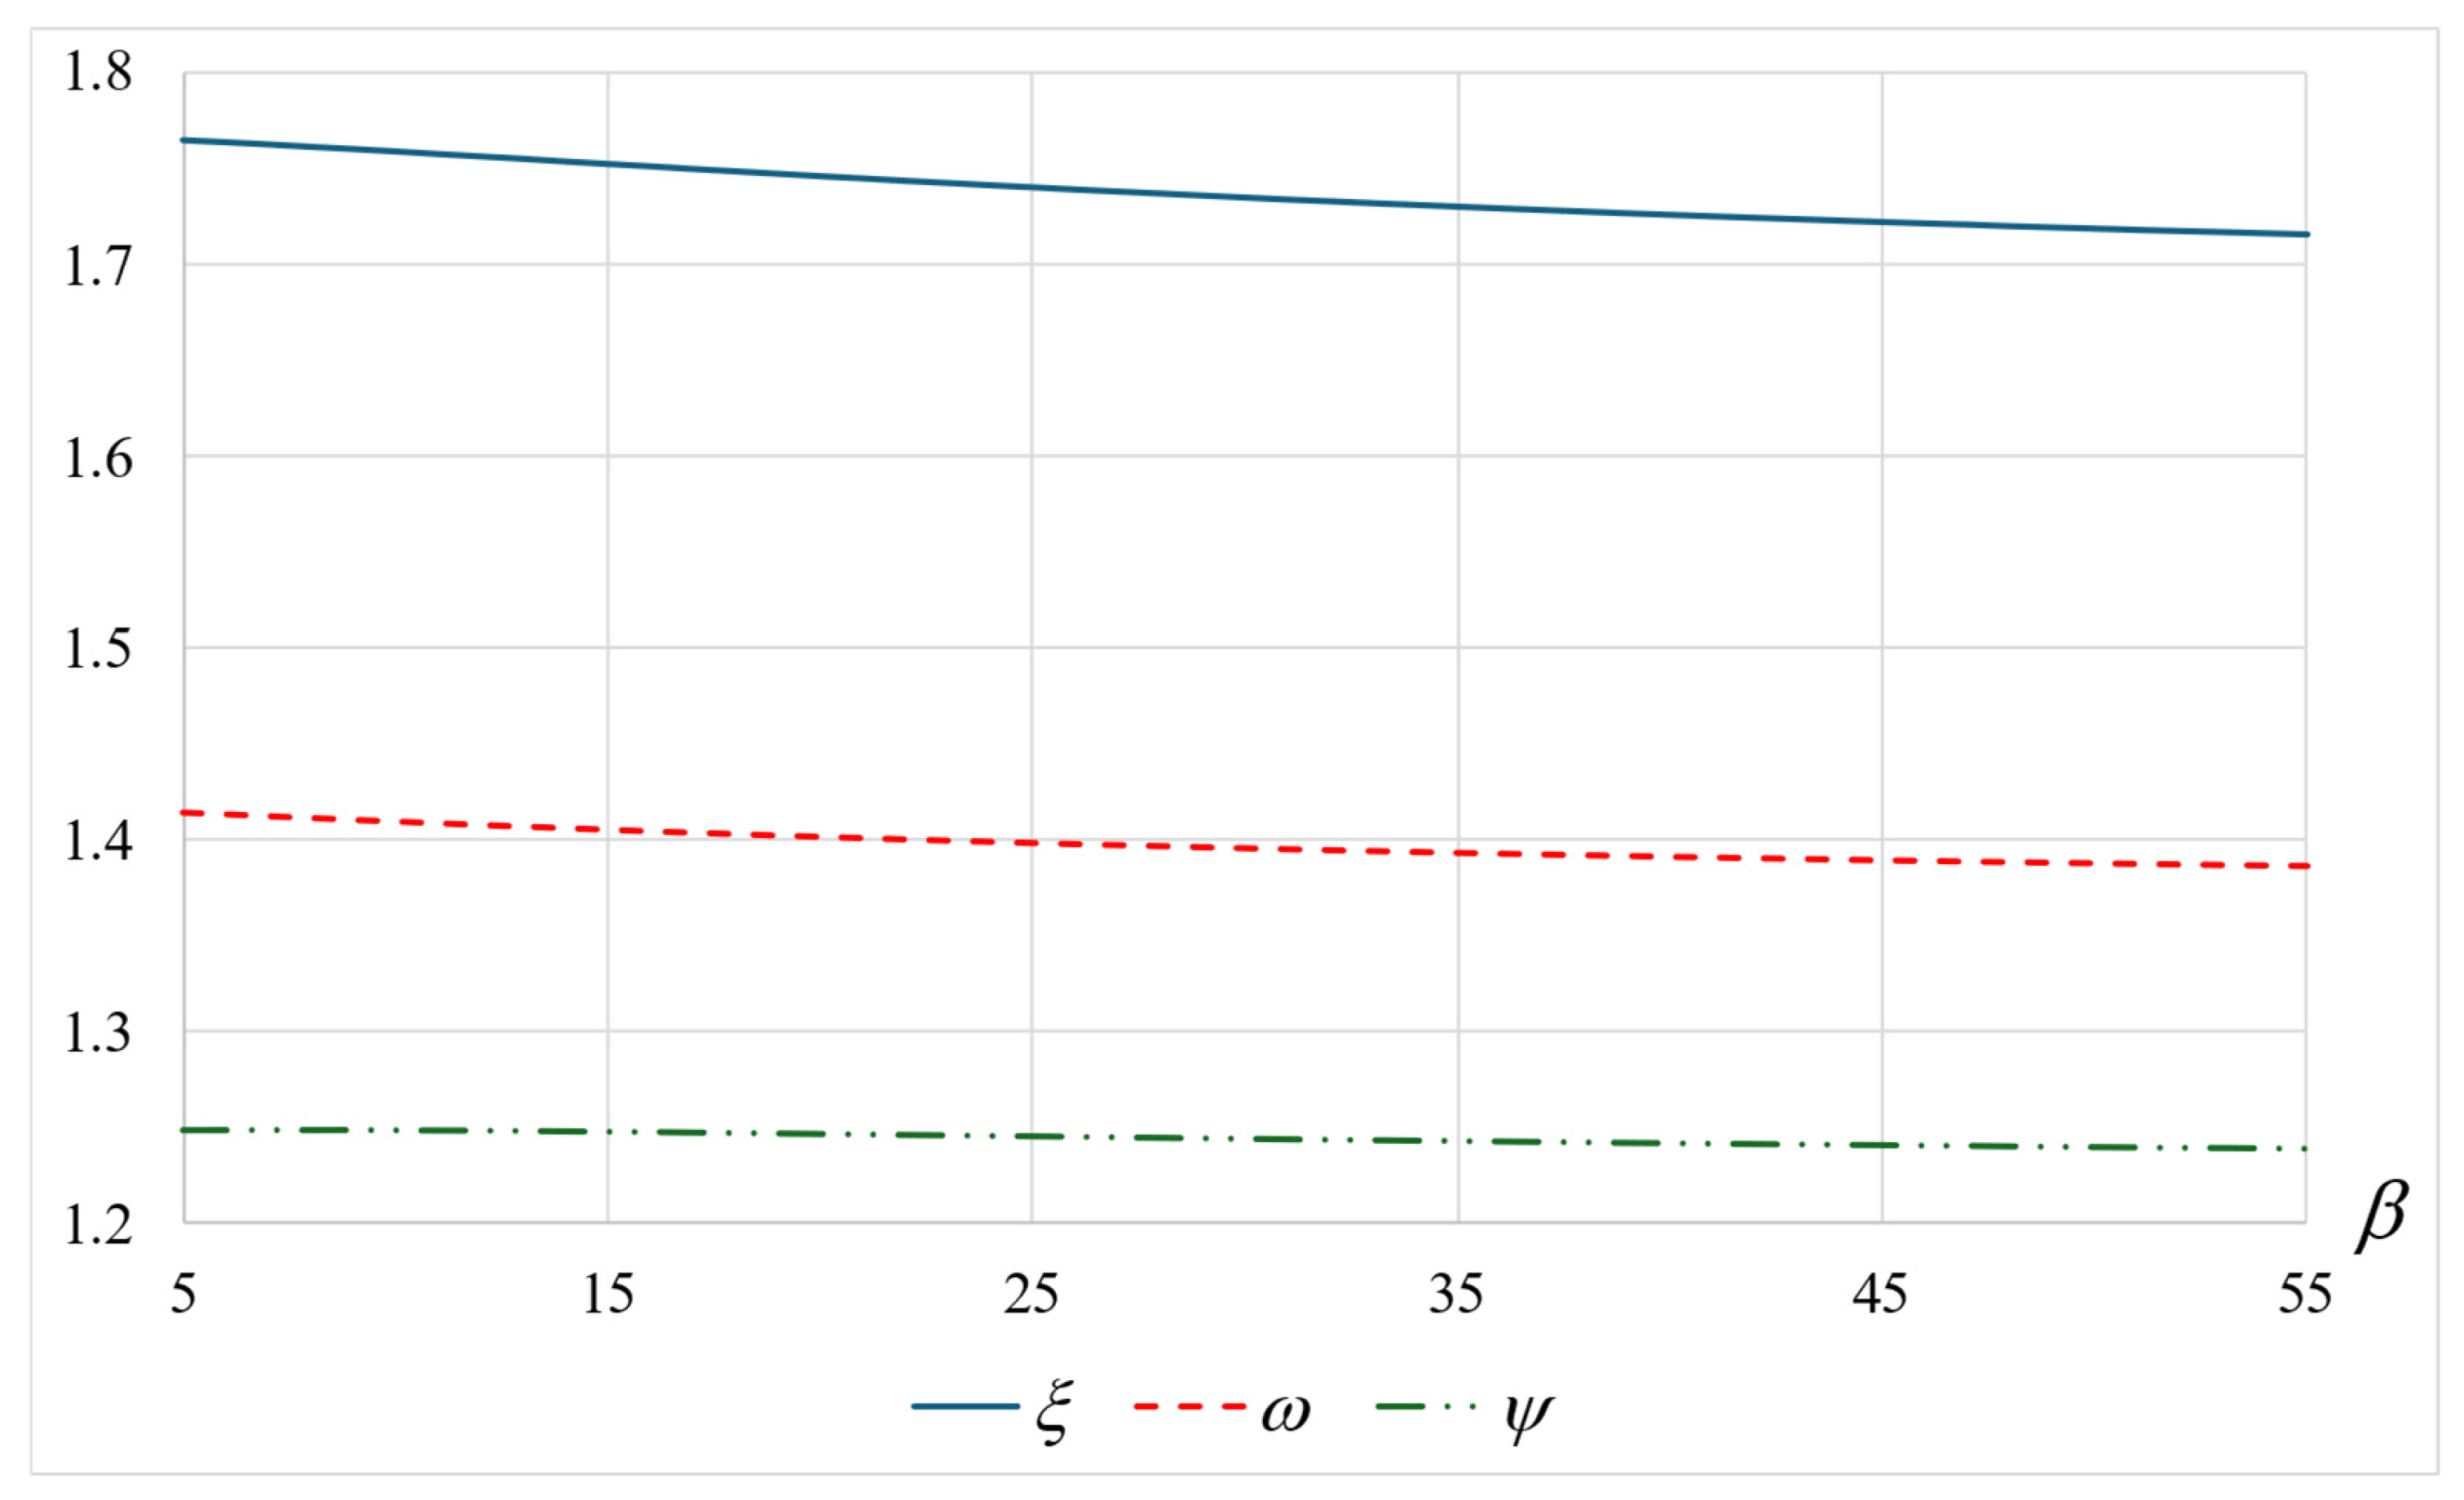
Figure 2 and Figure 3 depict the ratios  ξ ω , and  ψ  as a function of  α  and  β  by the solid blue, dashed red, and dash-dotted green curves, respectively. It follows that  ξ ω , and  ψ  are increasing in  α  (decreasing mean patience time), and decreasing in  β  (increasing mean orbit time). Combining these two observations, we conclude that, for a given  μ , as customers spend more time in orbit, a higher improvement in  E [ L ]  is achieved by decreasing the service time variance.
Similarly, Figure S2 investigates the effect of changing the parameter  μ ( μ > λ = 8 ) on the ratios  ξ ω , and  ψ , and illustrates that the impact of the variance on  E [ L d i s ]  intensifies as  μ  decreases (i.e., a higher mean service time). Figure S2 further shows that, for a relatively short mean service time ( μ > 40 ), the ratios  ξ ω , and  ψ  approach 1, that is, the same  E [ L d i s ]  for all distributions. Specifically, for high  μ , the service time distribution has a negligible effect on  E [ L d i s ] ; thus, the mean number of customers is mainly affected by the patience and orbit times.

6.2. Customer’s Mean Sojourn Time Excluding Orbit, E[D]

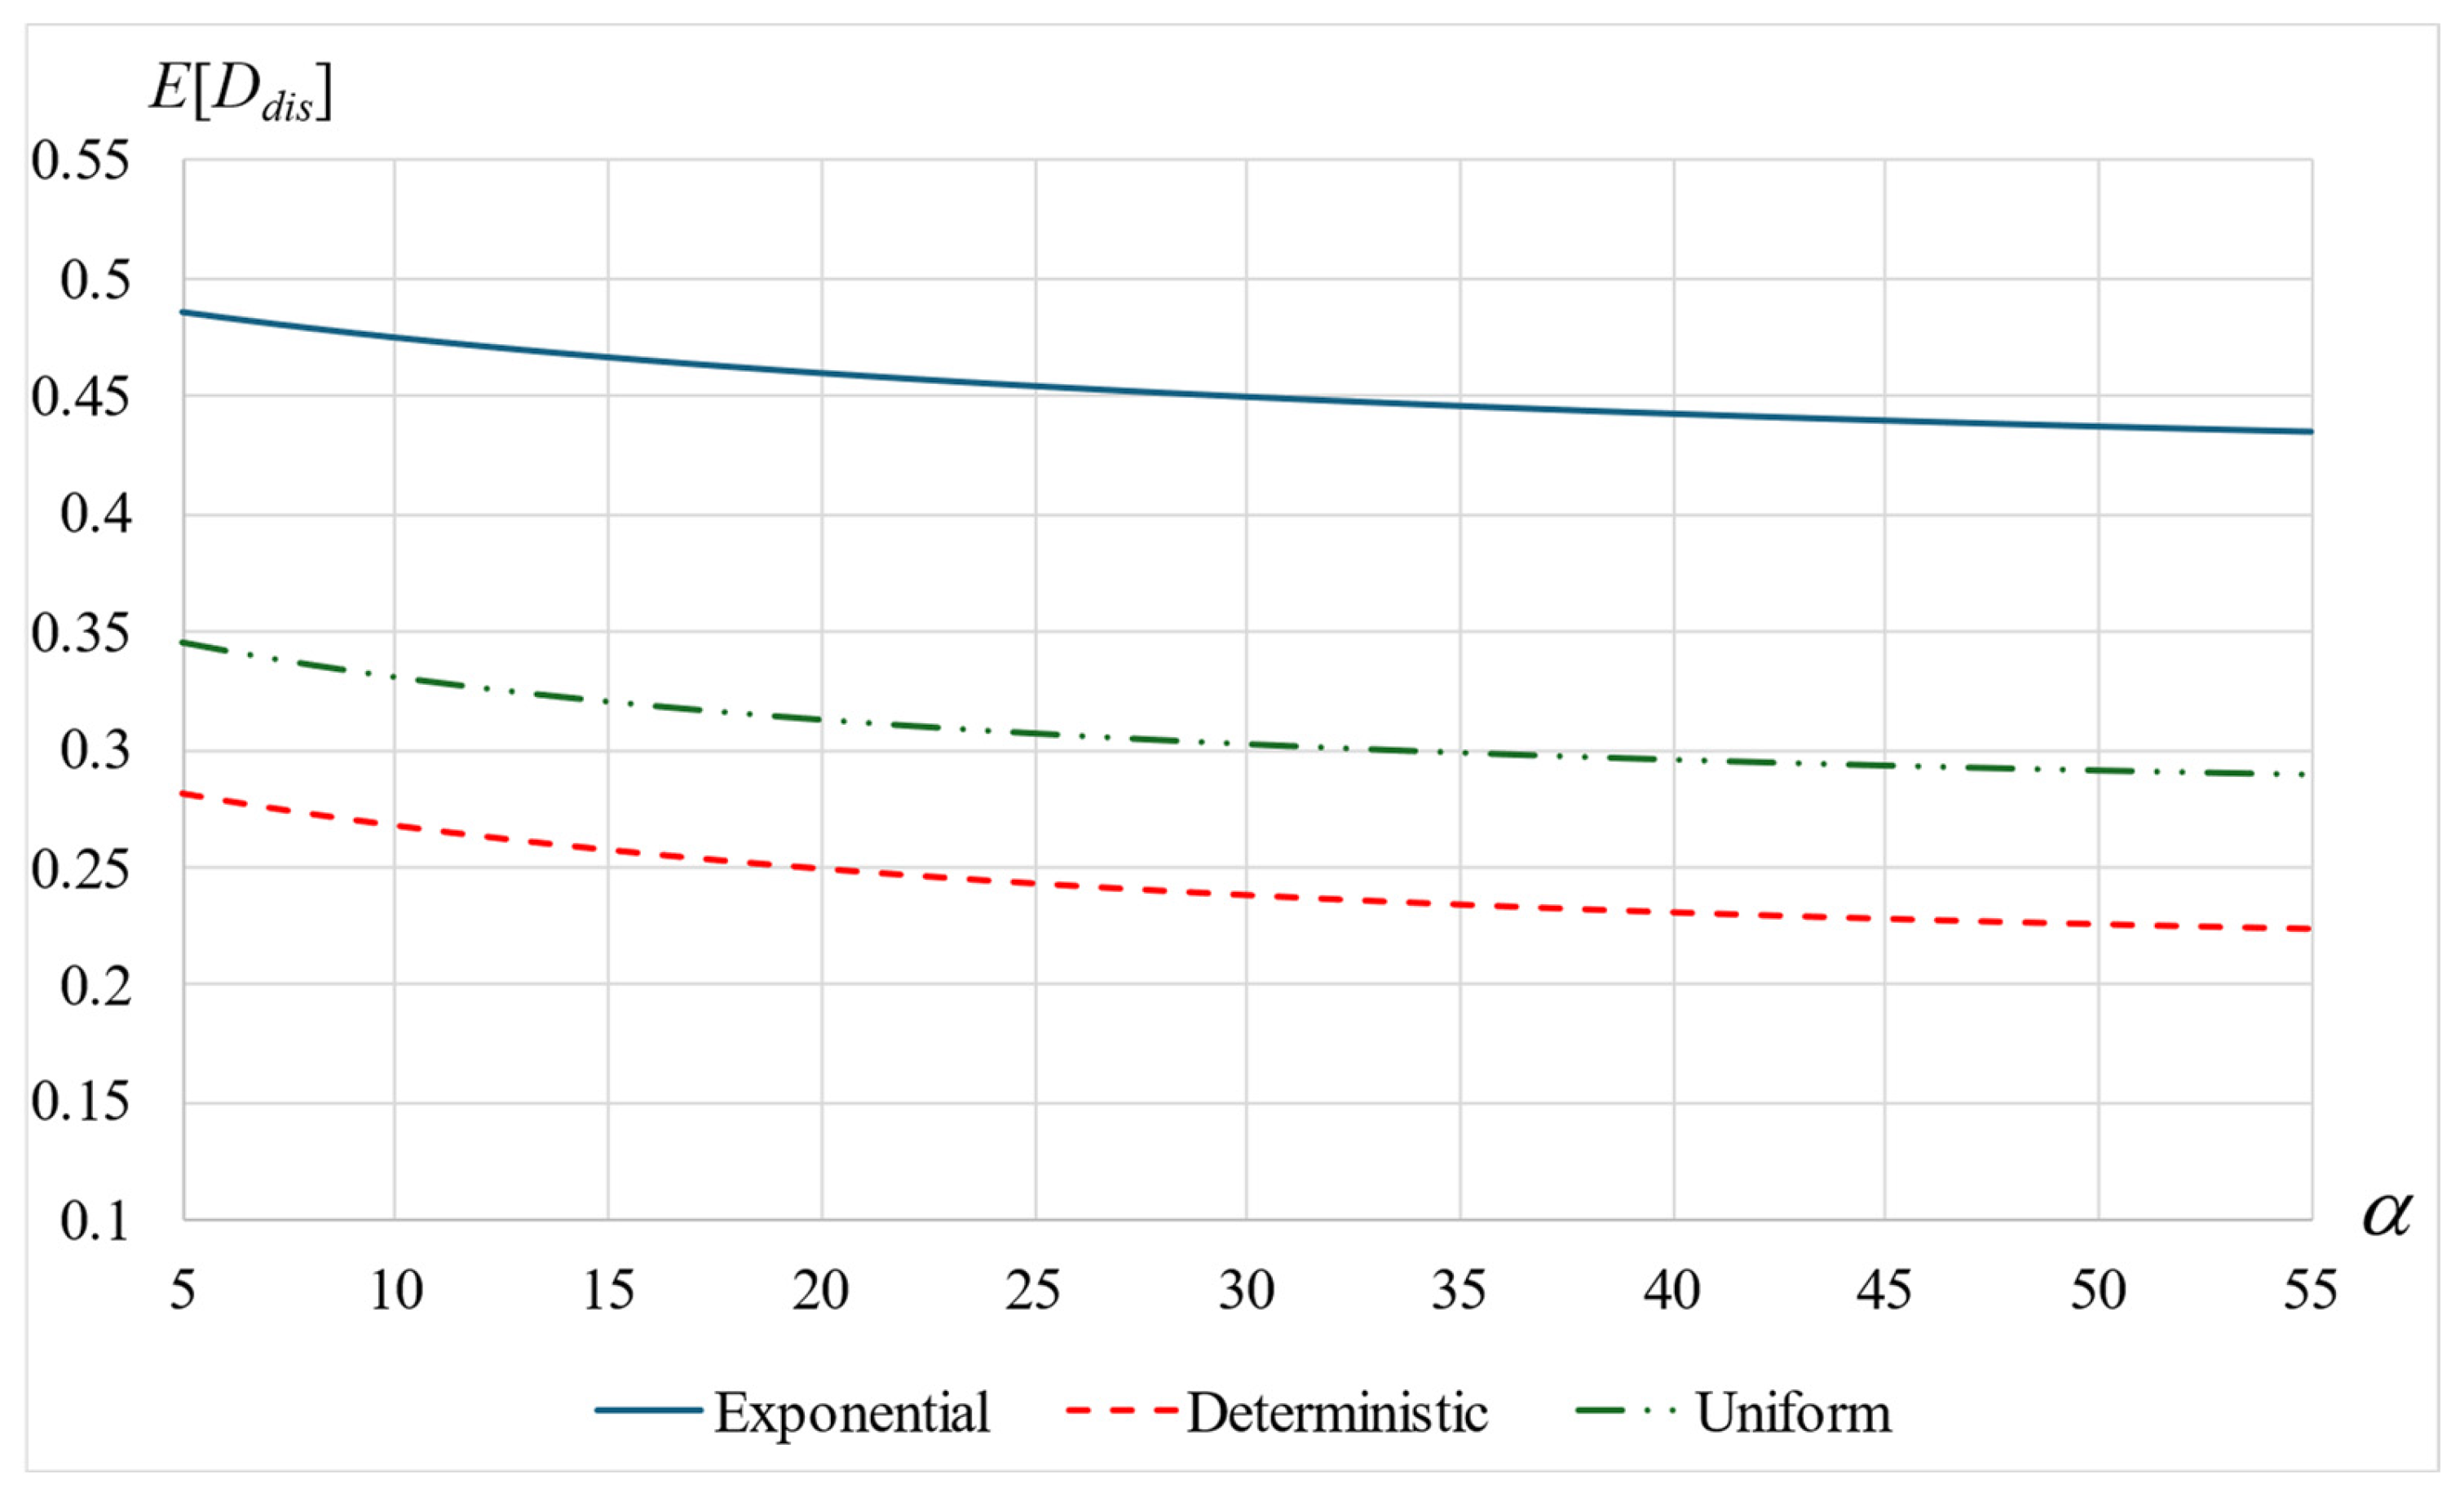
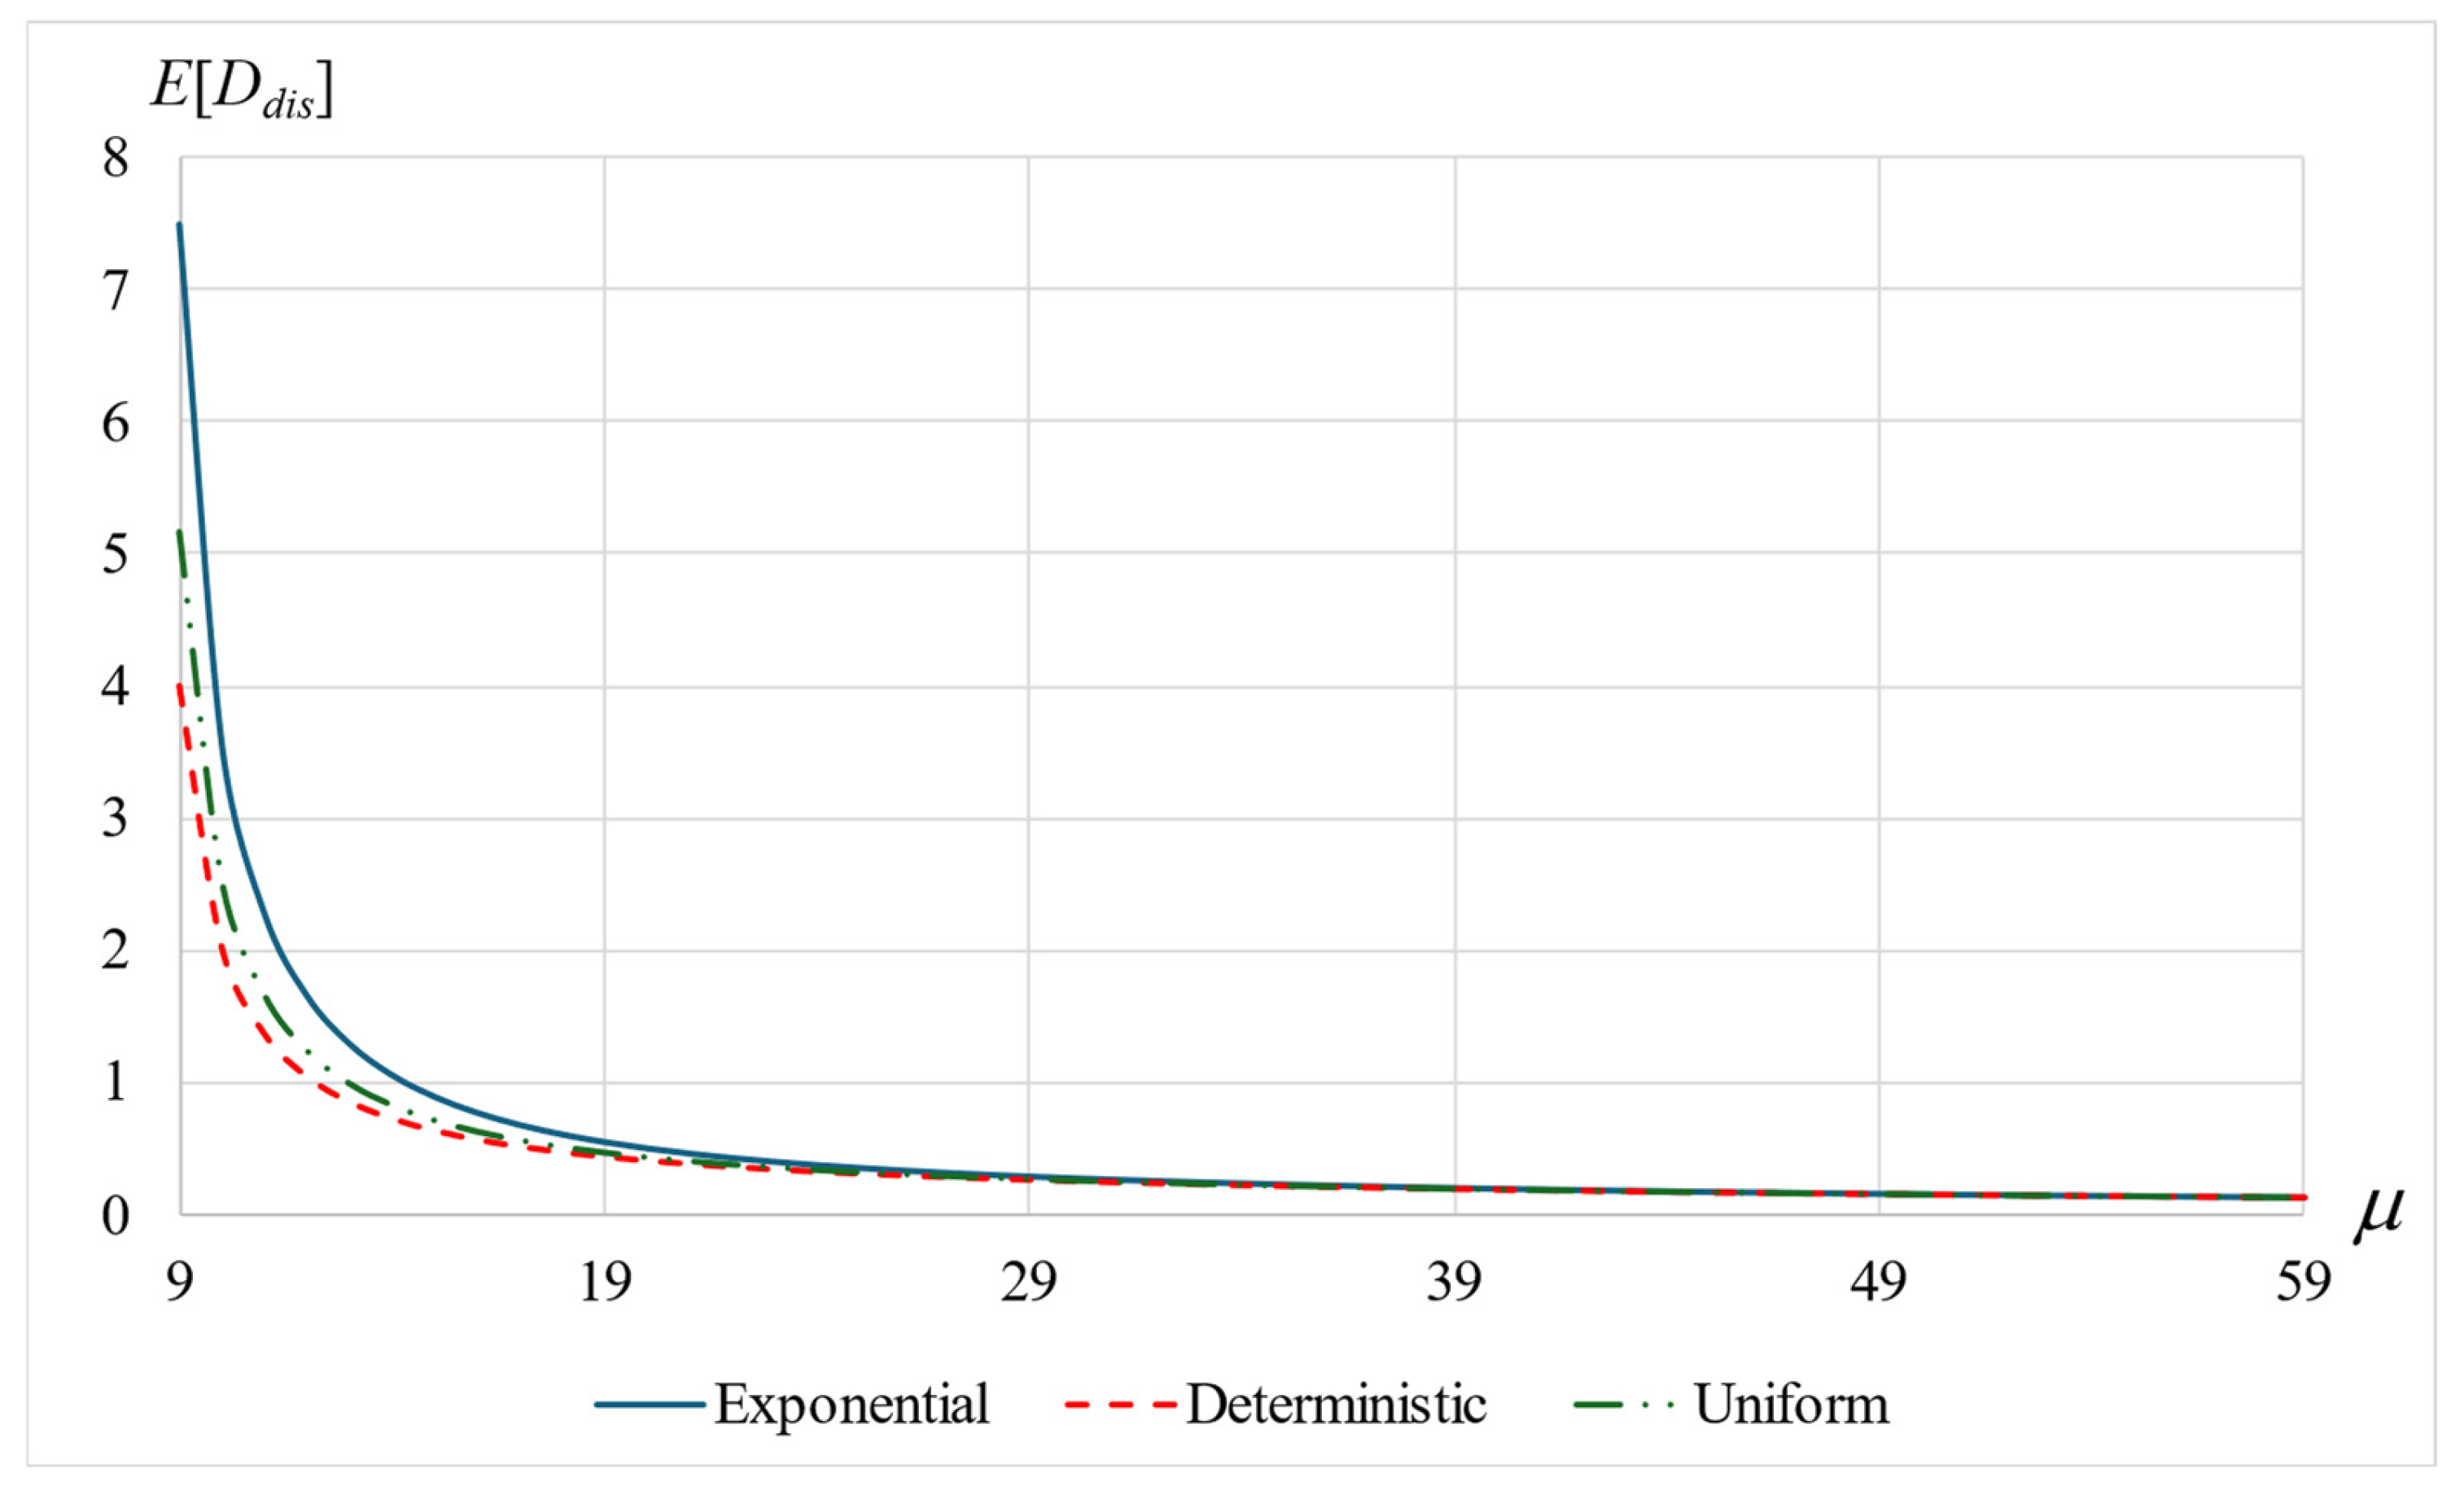
For each distribution, let  E [ D d i s ]  be the mean sojourn time of a customer in the system, ignoring the orbit time. According to Little’s law,  E [ D d i s ] = E [ L d i s ] / λ . Figure 4 and Figure 5 depict  E [ D d i s ]  as a function of  α  and  μ , for  d i s { E x p , D e t e r , U n i f }  by the solid blue, dashed red, and dash-dotted curves, respectively. Similarly, Figure S3 presents  E [ D d i s ]  as a function of  β . The figures emphasize that  E [ D d i s ]  is decreasing in  α  and in  μ , while it is increasing in  β . Thus, a lower mean patience time (a higher  α ) reduces  E [ D d i s ]  (Figure 4), and a lower mean orbit time (a higher  β ) increases  E [ D d i s ]  (Figure S3). The latter result is explained as follows: each customer, during her/his service processing, practically partitions the latter time into two parts: time inside the system and time in orbit. As much as  β  is higher (i.e., each orbit time is shorter), the customer spends more time inside the system during her/his service processing. As expected,  E [ D d i s ]  is decreasing in  μ , approaching zero when  μ  (see Figure 5). Figure 4, Figure 5 and Figure S3 further demonstrate that  E [ D E x p ] > E [ D U n i f ] > E [ D D e t ] , emphasizing the increasing impact of the service time variance on the net sojourn time while the service continues. Evidently, the higher the variability, the longer is the mean sojourn time. Note that a higher service time variability also yields a higher mean number of customers; see Figure S1.

6.3. Mean Total Sojourn Time, E[V]

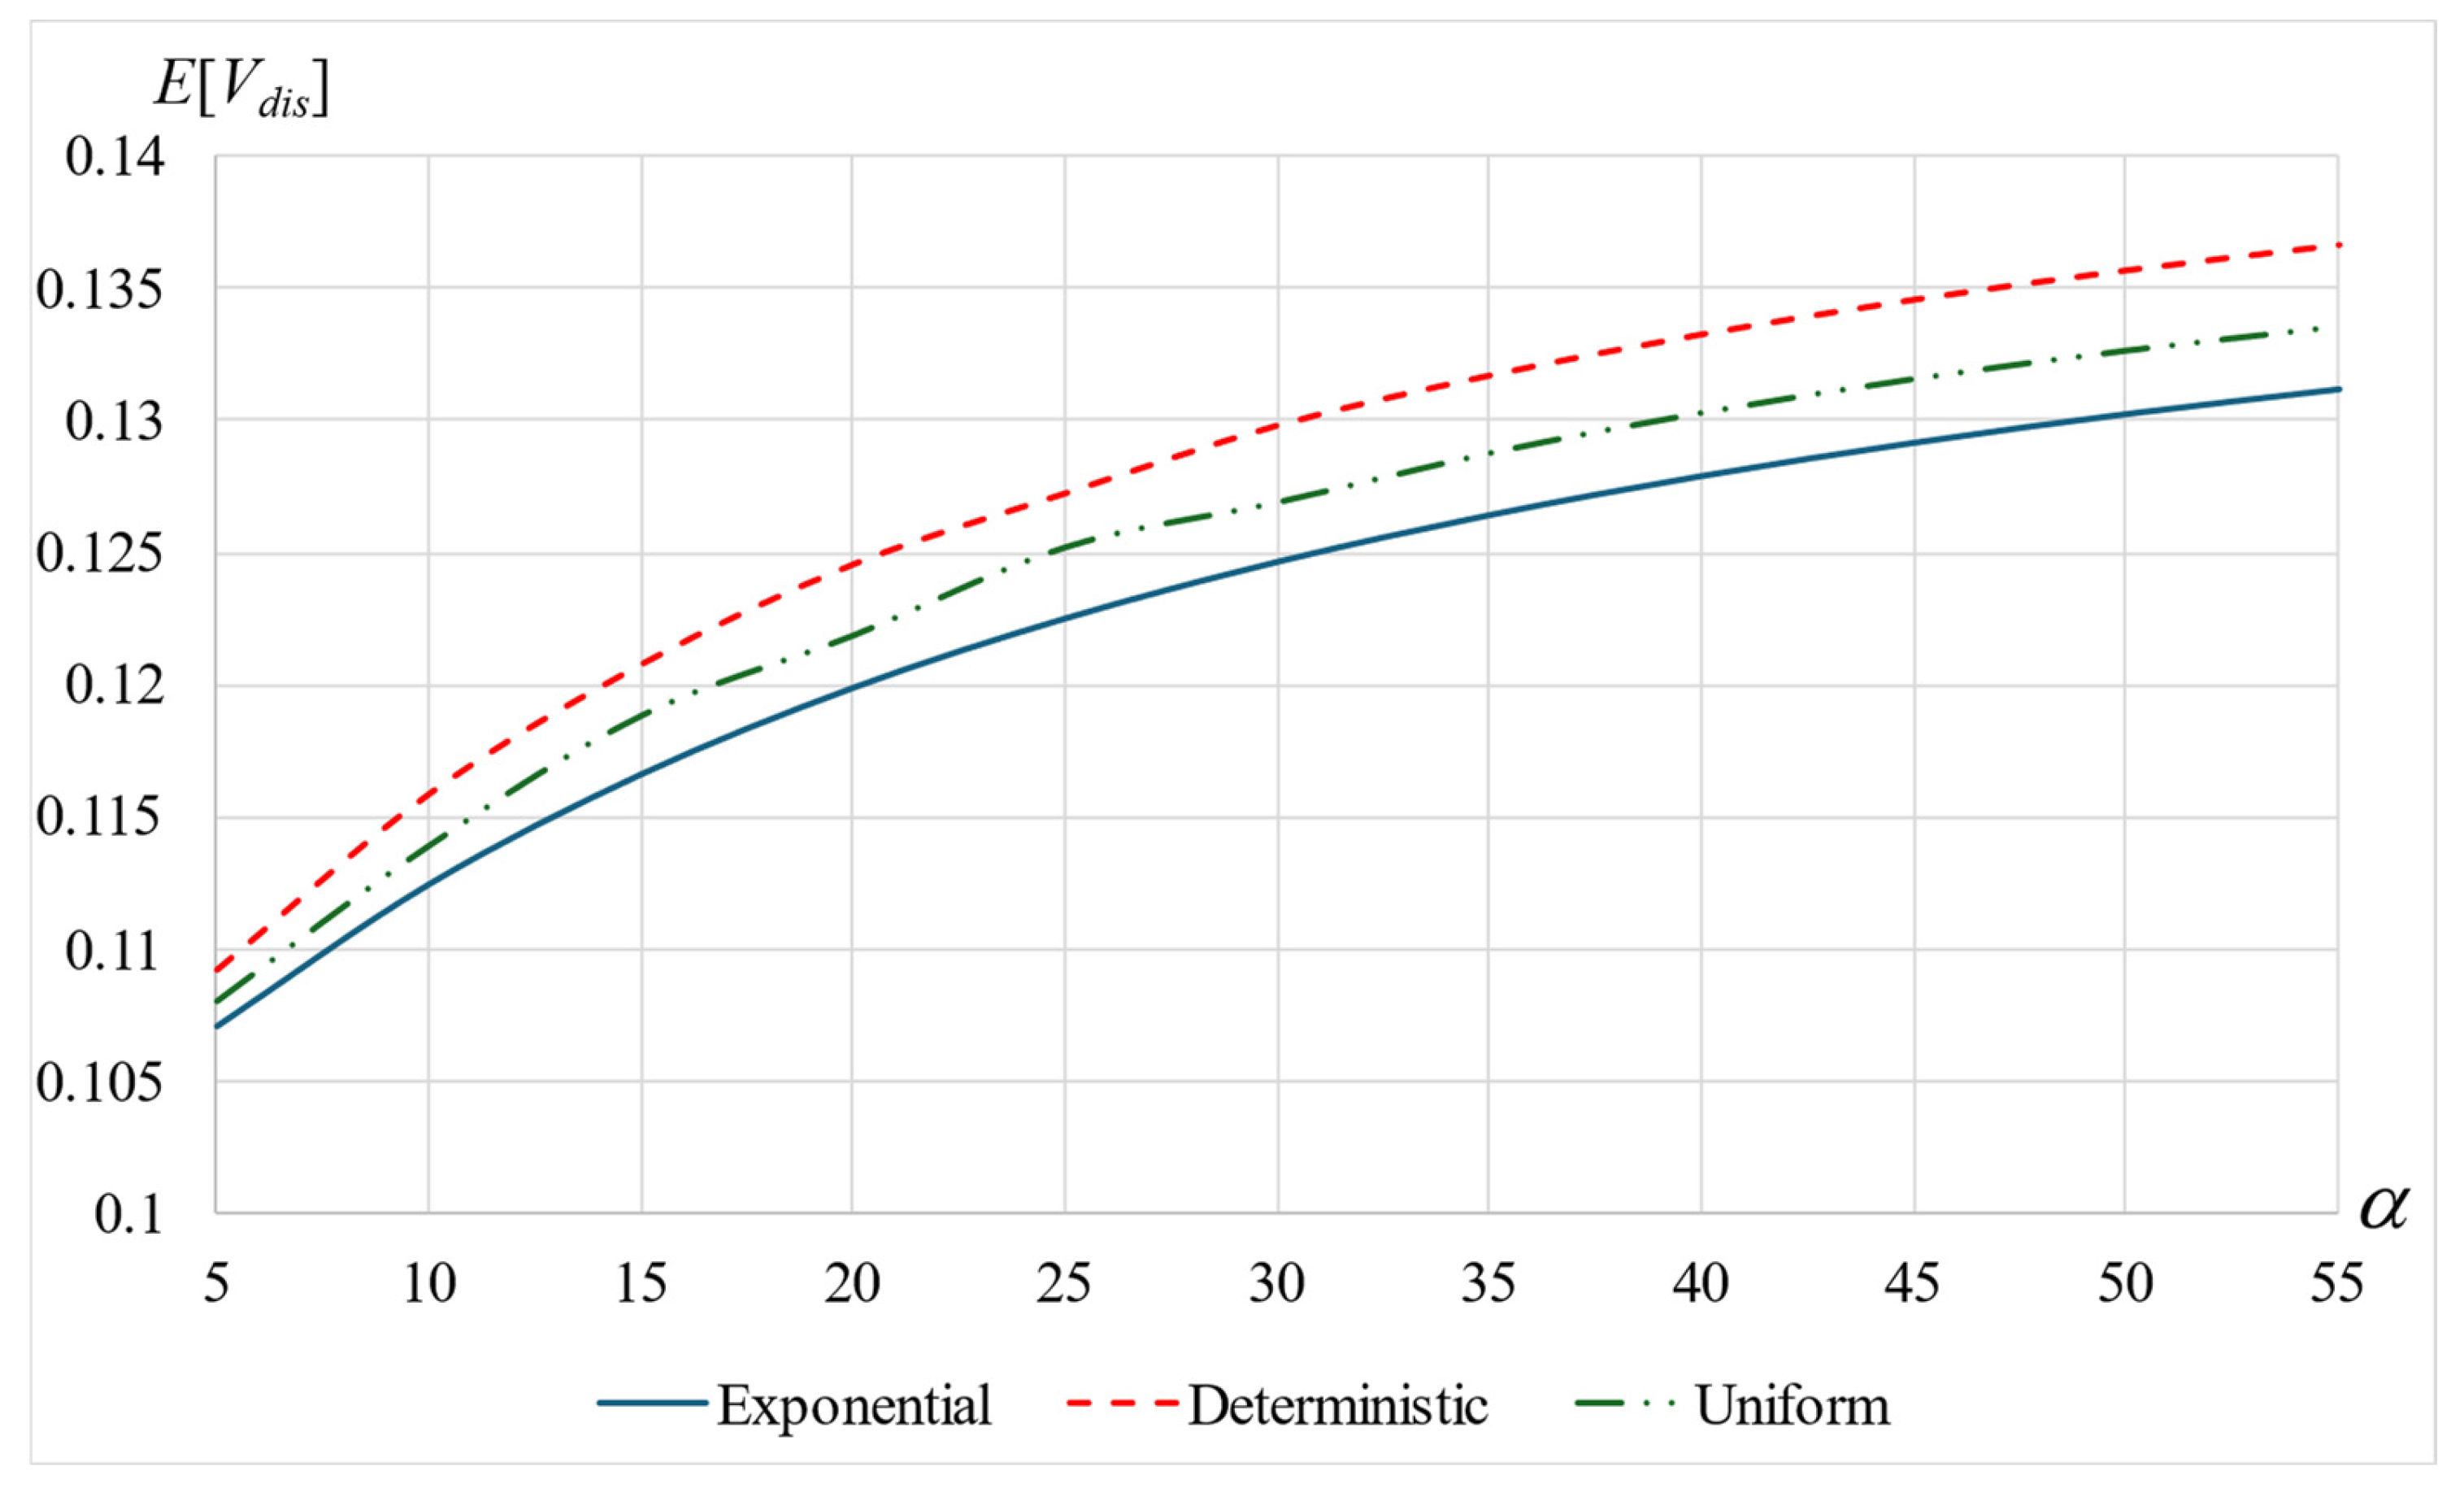
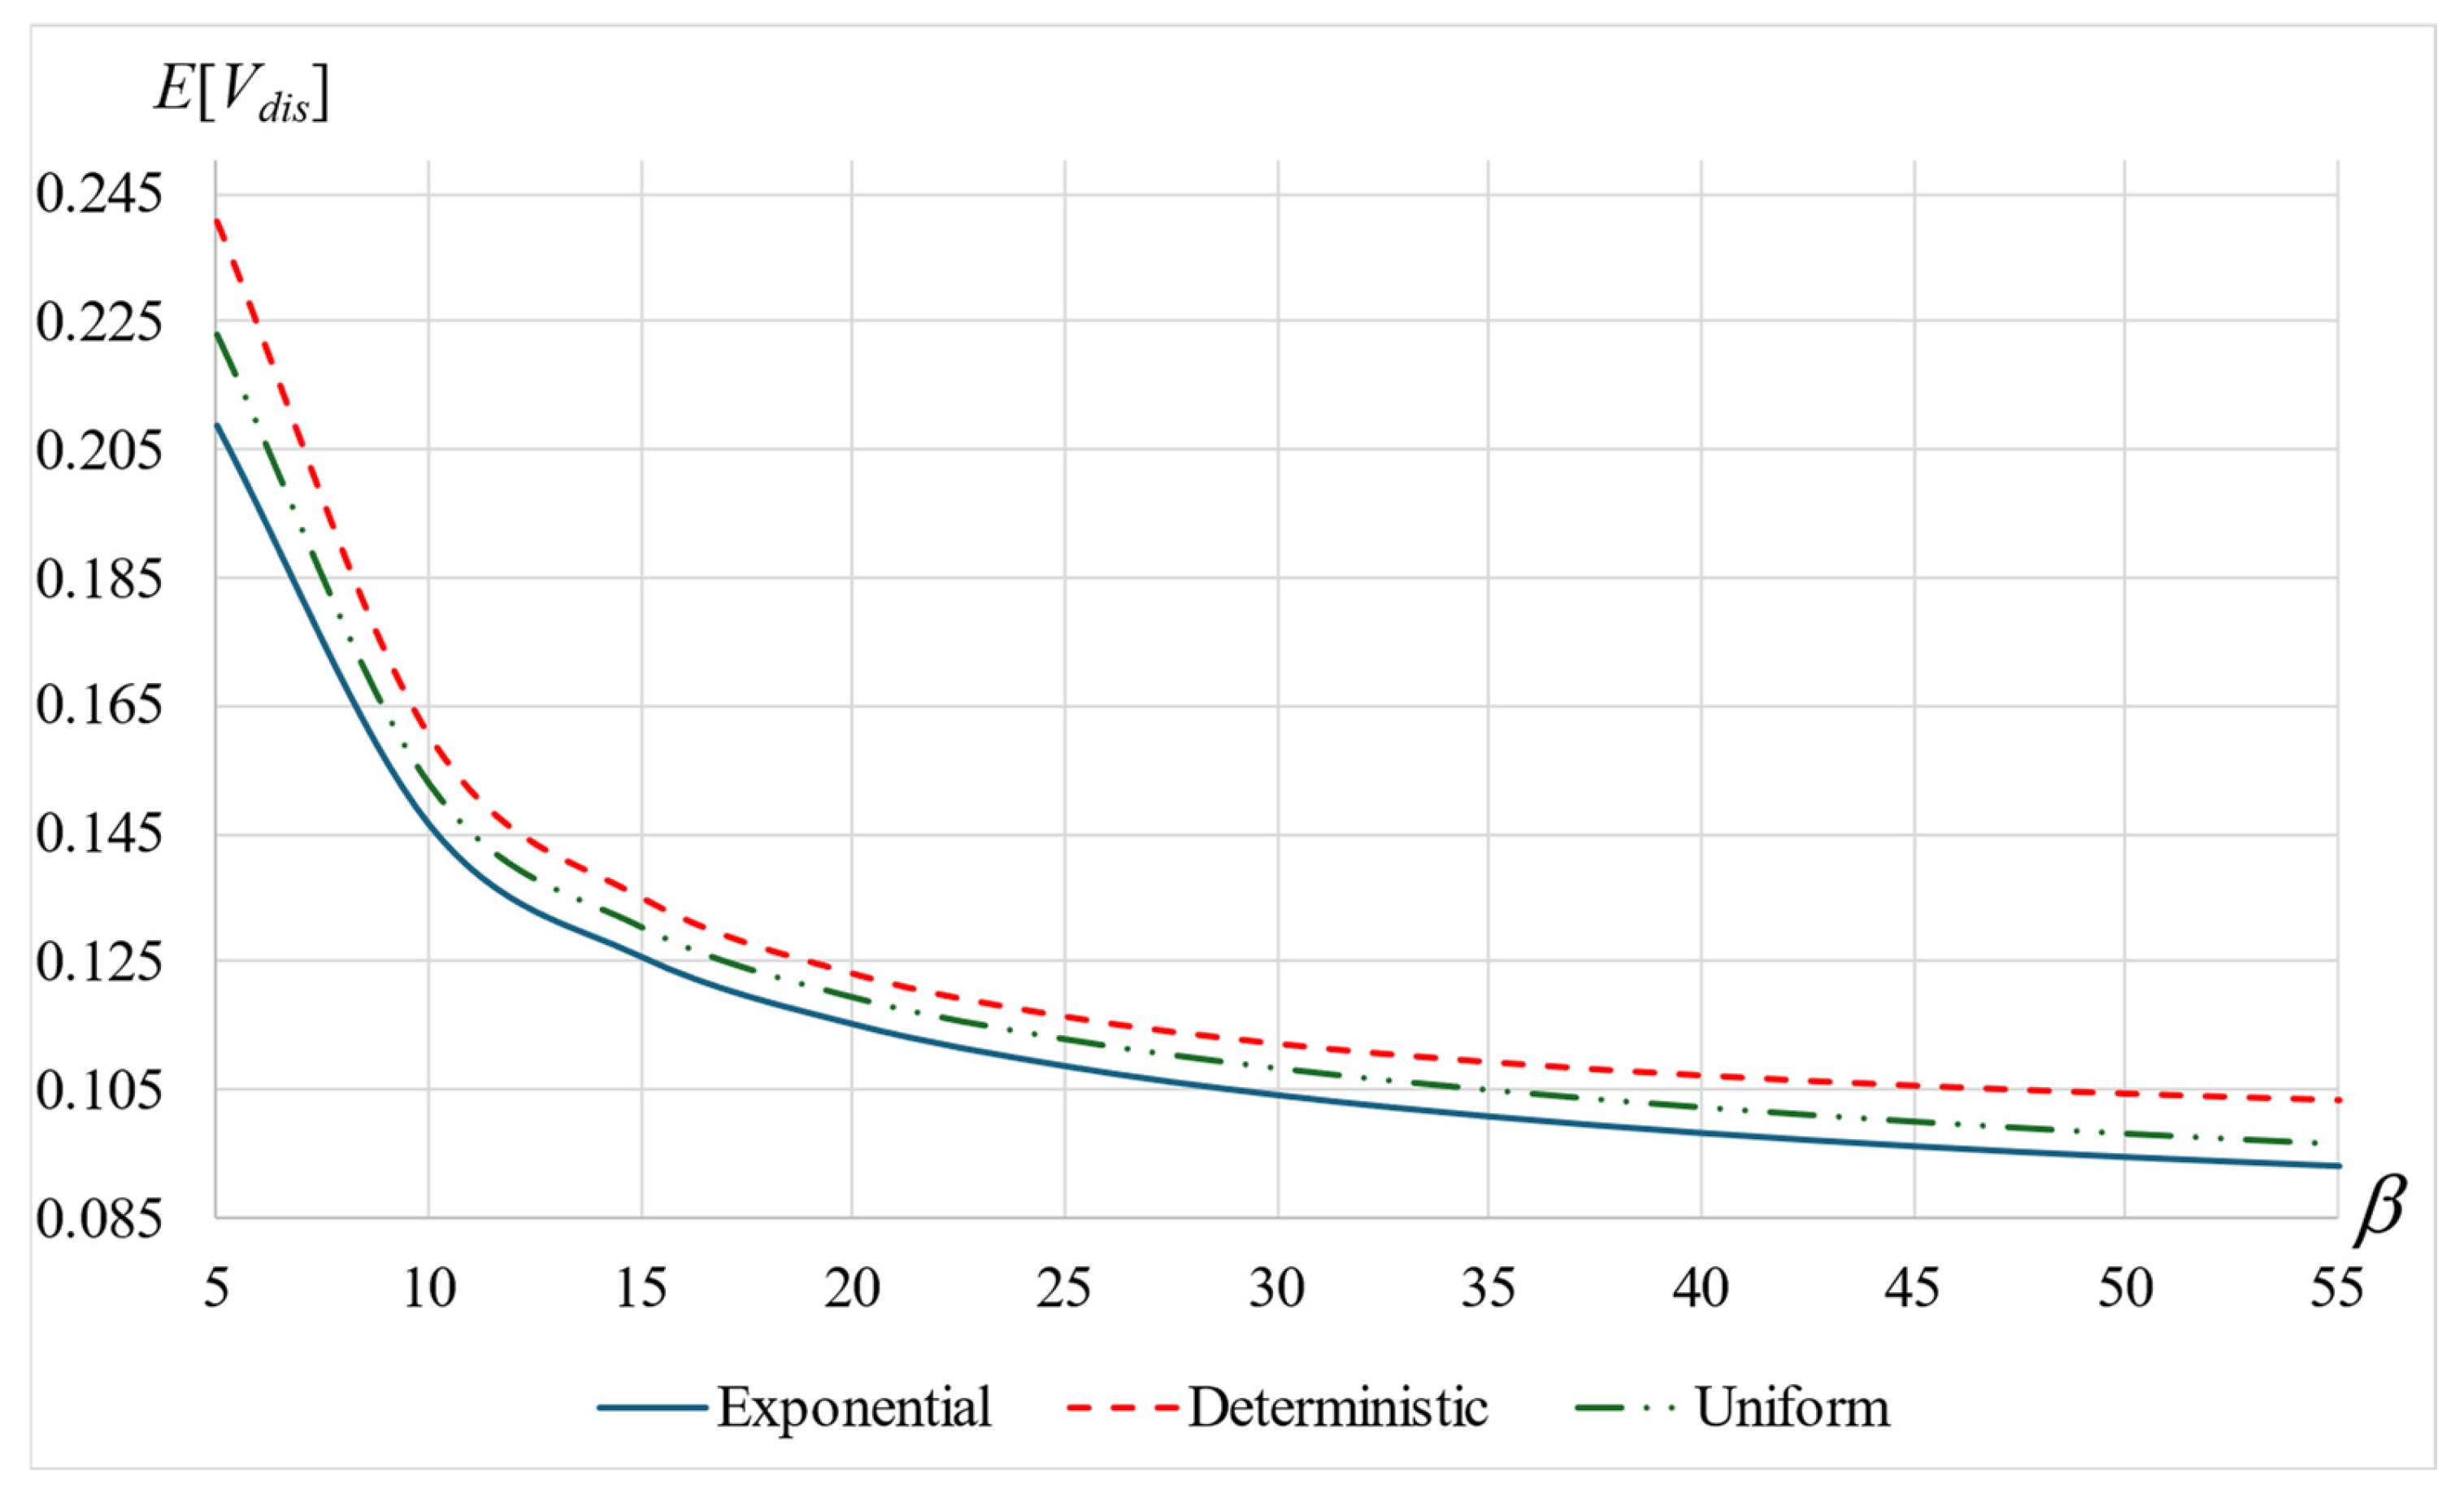
For each distribution, let  E [ V d i s ]  denote the mean total sojourn time of a customer in the system (including orbit time). Figure 6, Figure 7, and Figure S4 depict  E [ V d i s ]  as a function of  α , β , and  μ , respectively. The solid blue, dashed red, and dash-dotted curves refer to the exponential, deterministic, and uniform distributions, respectively. Figure 6 reveals an interesting result:  E [ V d i s ]  is increasing in  α . Thus, if the customers’ mean patience time decreases (i.e.,  α  increases such that customers go to orbit more often), they eventually spend more time in the system (in service and in orbit).
We further observe that  E [ V d i s ]  is decreasing both in  β  and in  μ . Interestingly, all the figures show that  E [ V D e t ] > E [ V U n i f ] > E [ V E x p ] , in contrast to the behavior of  E [ D d i s ]  (see Figure 4, Figure 5, and Figure S3). This follows, since a smaller patience time increases the probability that the service will be completed while the customer remains in orbit.

6.4. Mean Remaining Orbit Time After Service Completion, E[H]

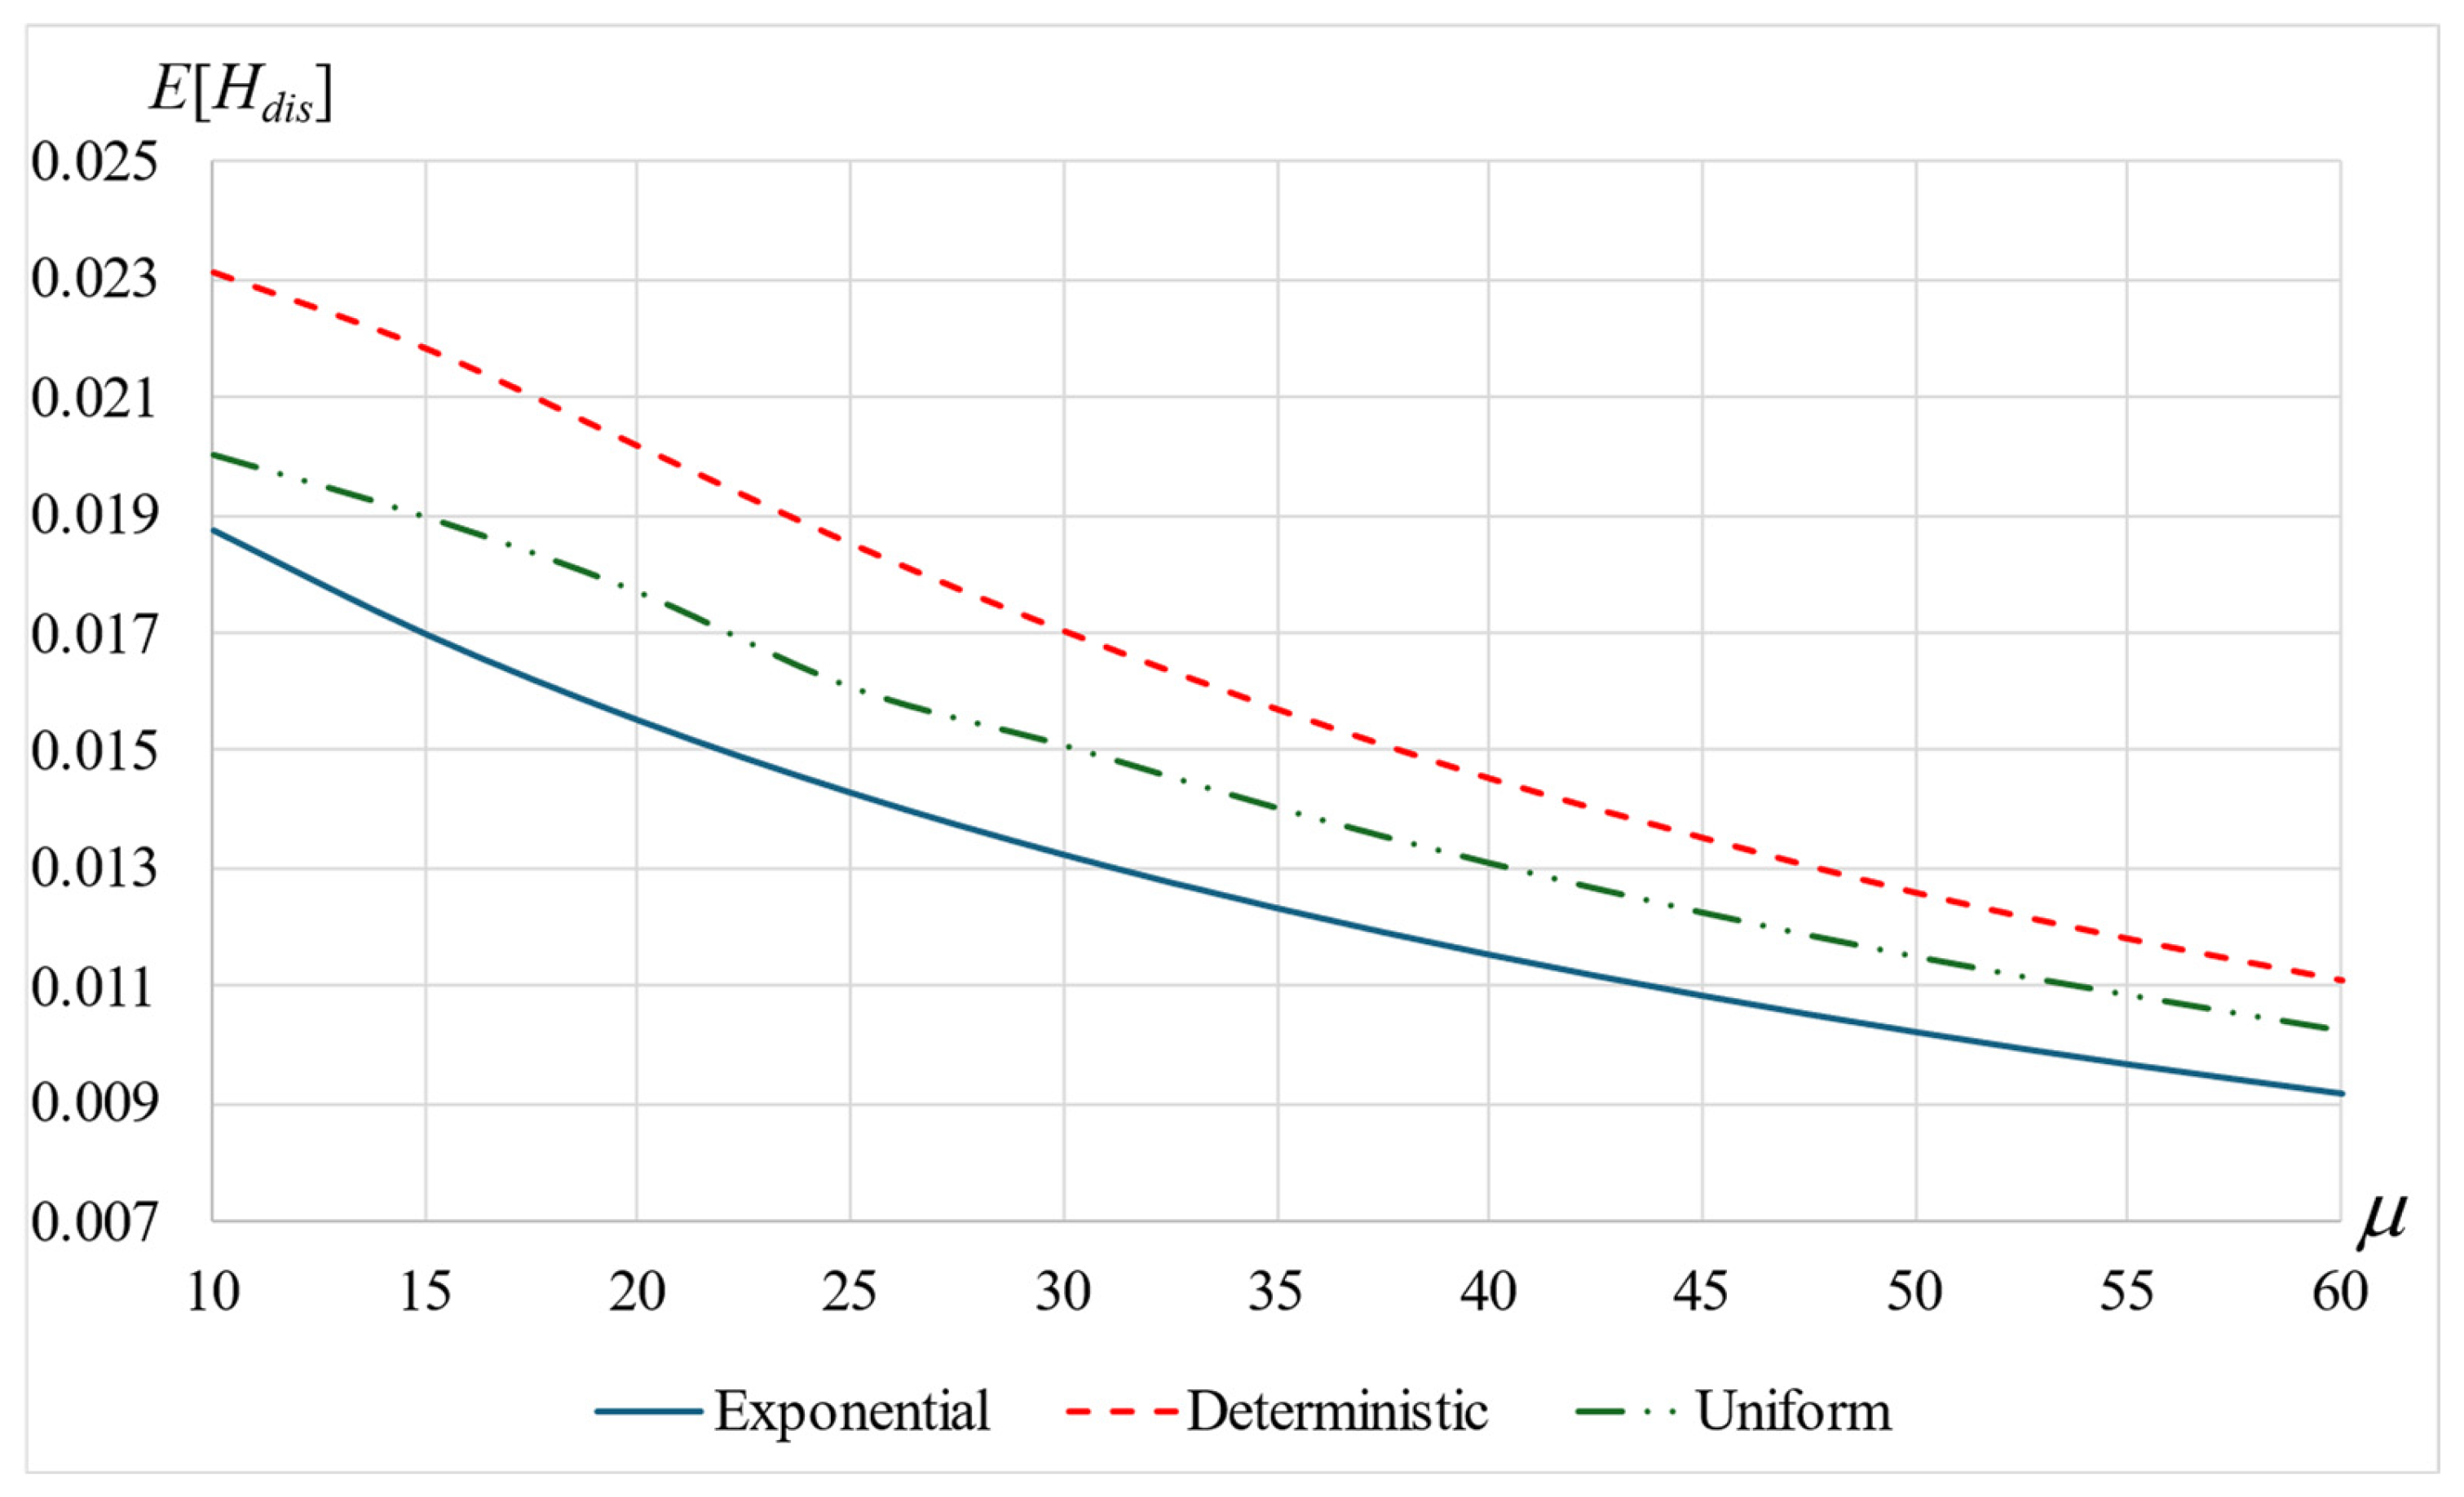
Let  E [ H d i s ]  denote the mean orbit time after service completion. Figure 8, Figure 9, and Figure S5 depict  E [ H d i s ]  for  d i s { E x p , D e t e r , U n i f }  by the solid blue, dashed red, and dash-dotted curves, respectively. It is observed that  E [ H d i s ]  is increasing in  α ; as the patience time decreases, the remaining orbit time increases. As expected,  E [ H d i s ]  is decreasing in  β  and in  μ . Furthermore, consistent with the conclusions regarding  E [ V d i s ]  and in contrast to the results regarding  E [ D d i s ] , we have  E [ H D e t ] > E [ H U n i f ] > E [ H E x p ] .

6.5. Mean Number of Orbits, E[O]

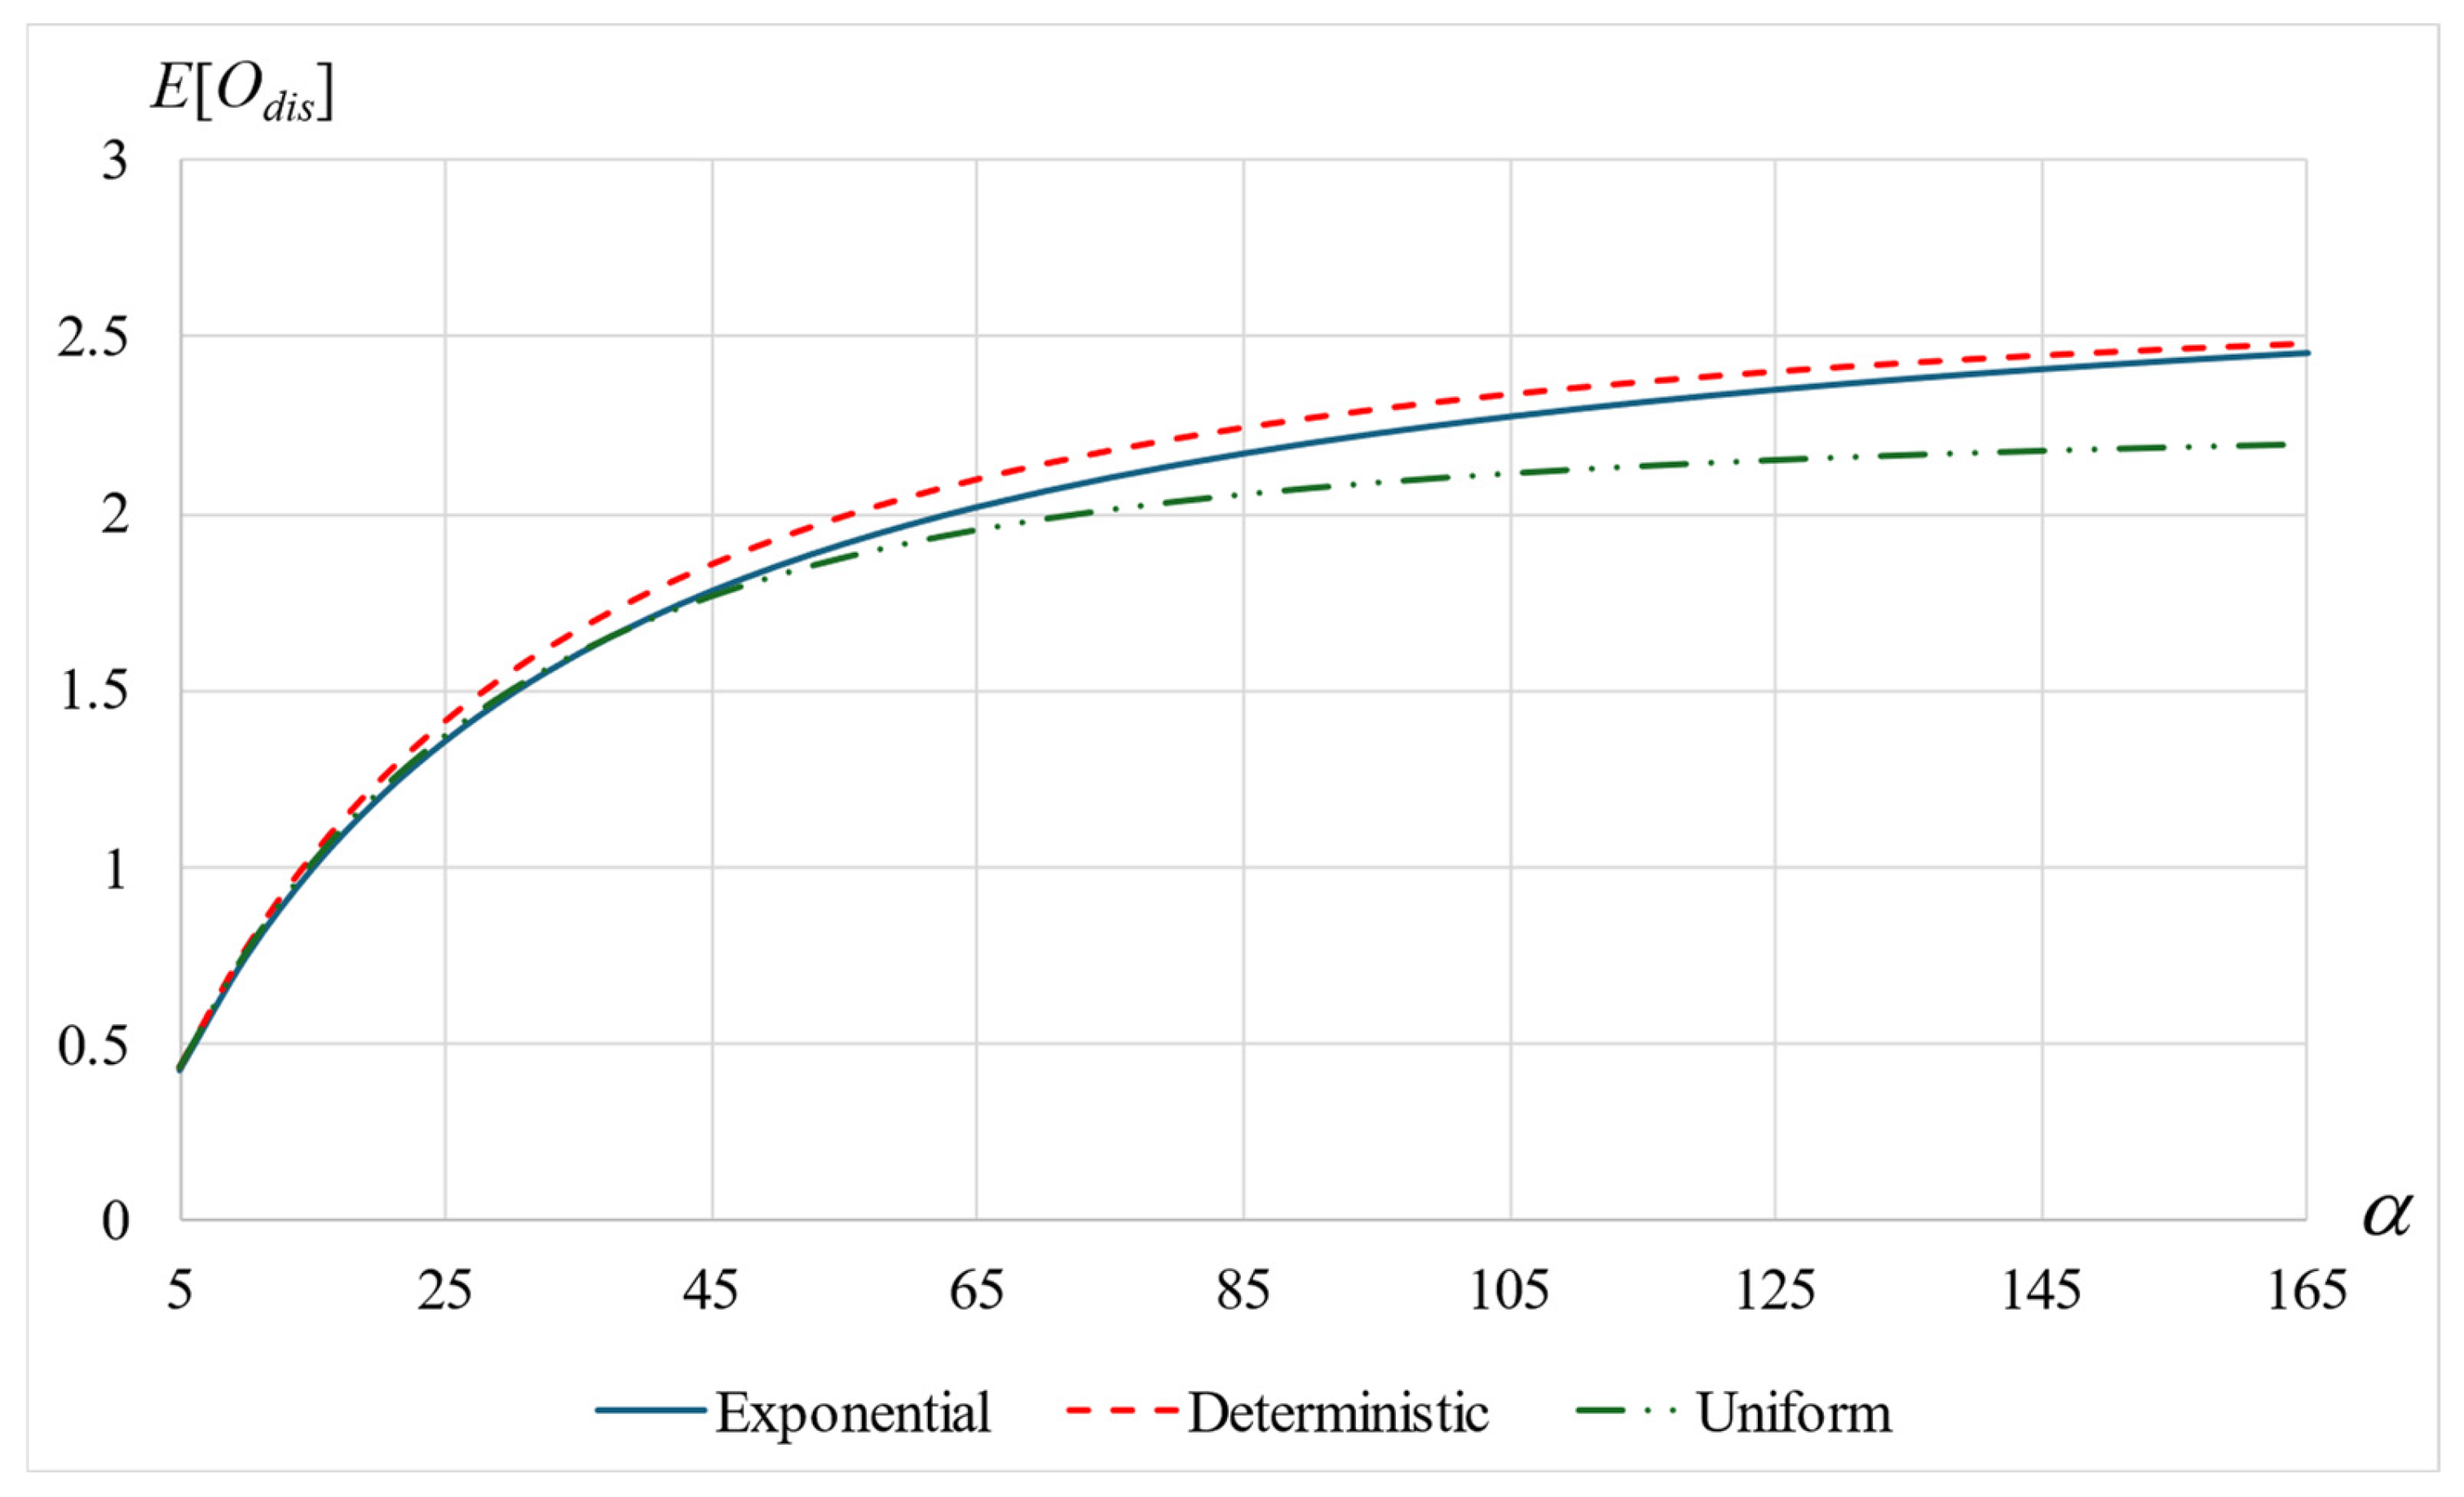
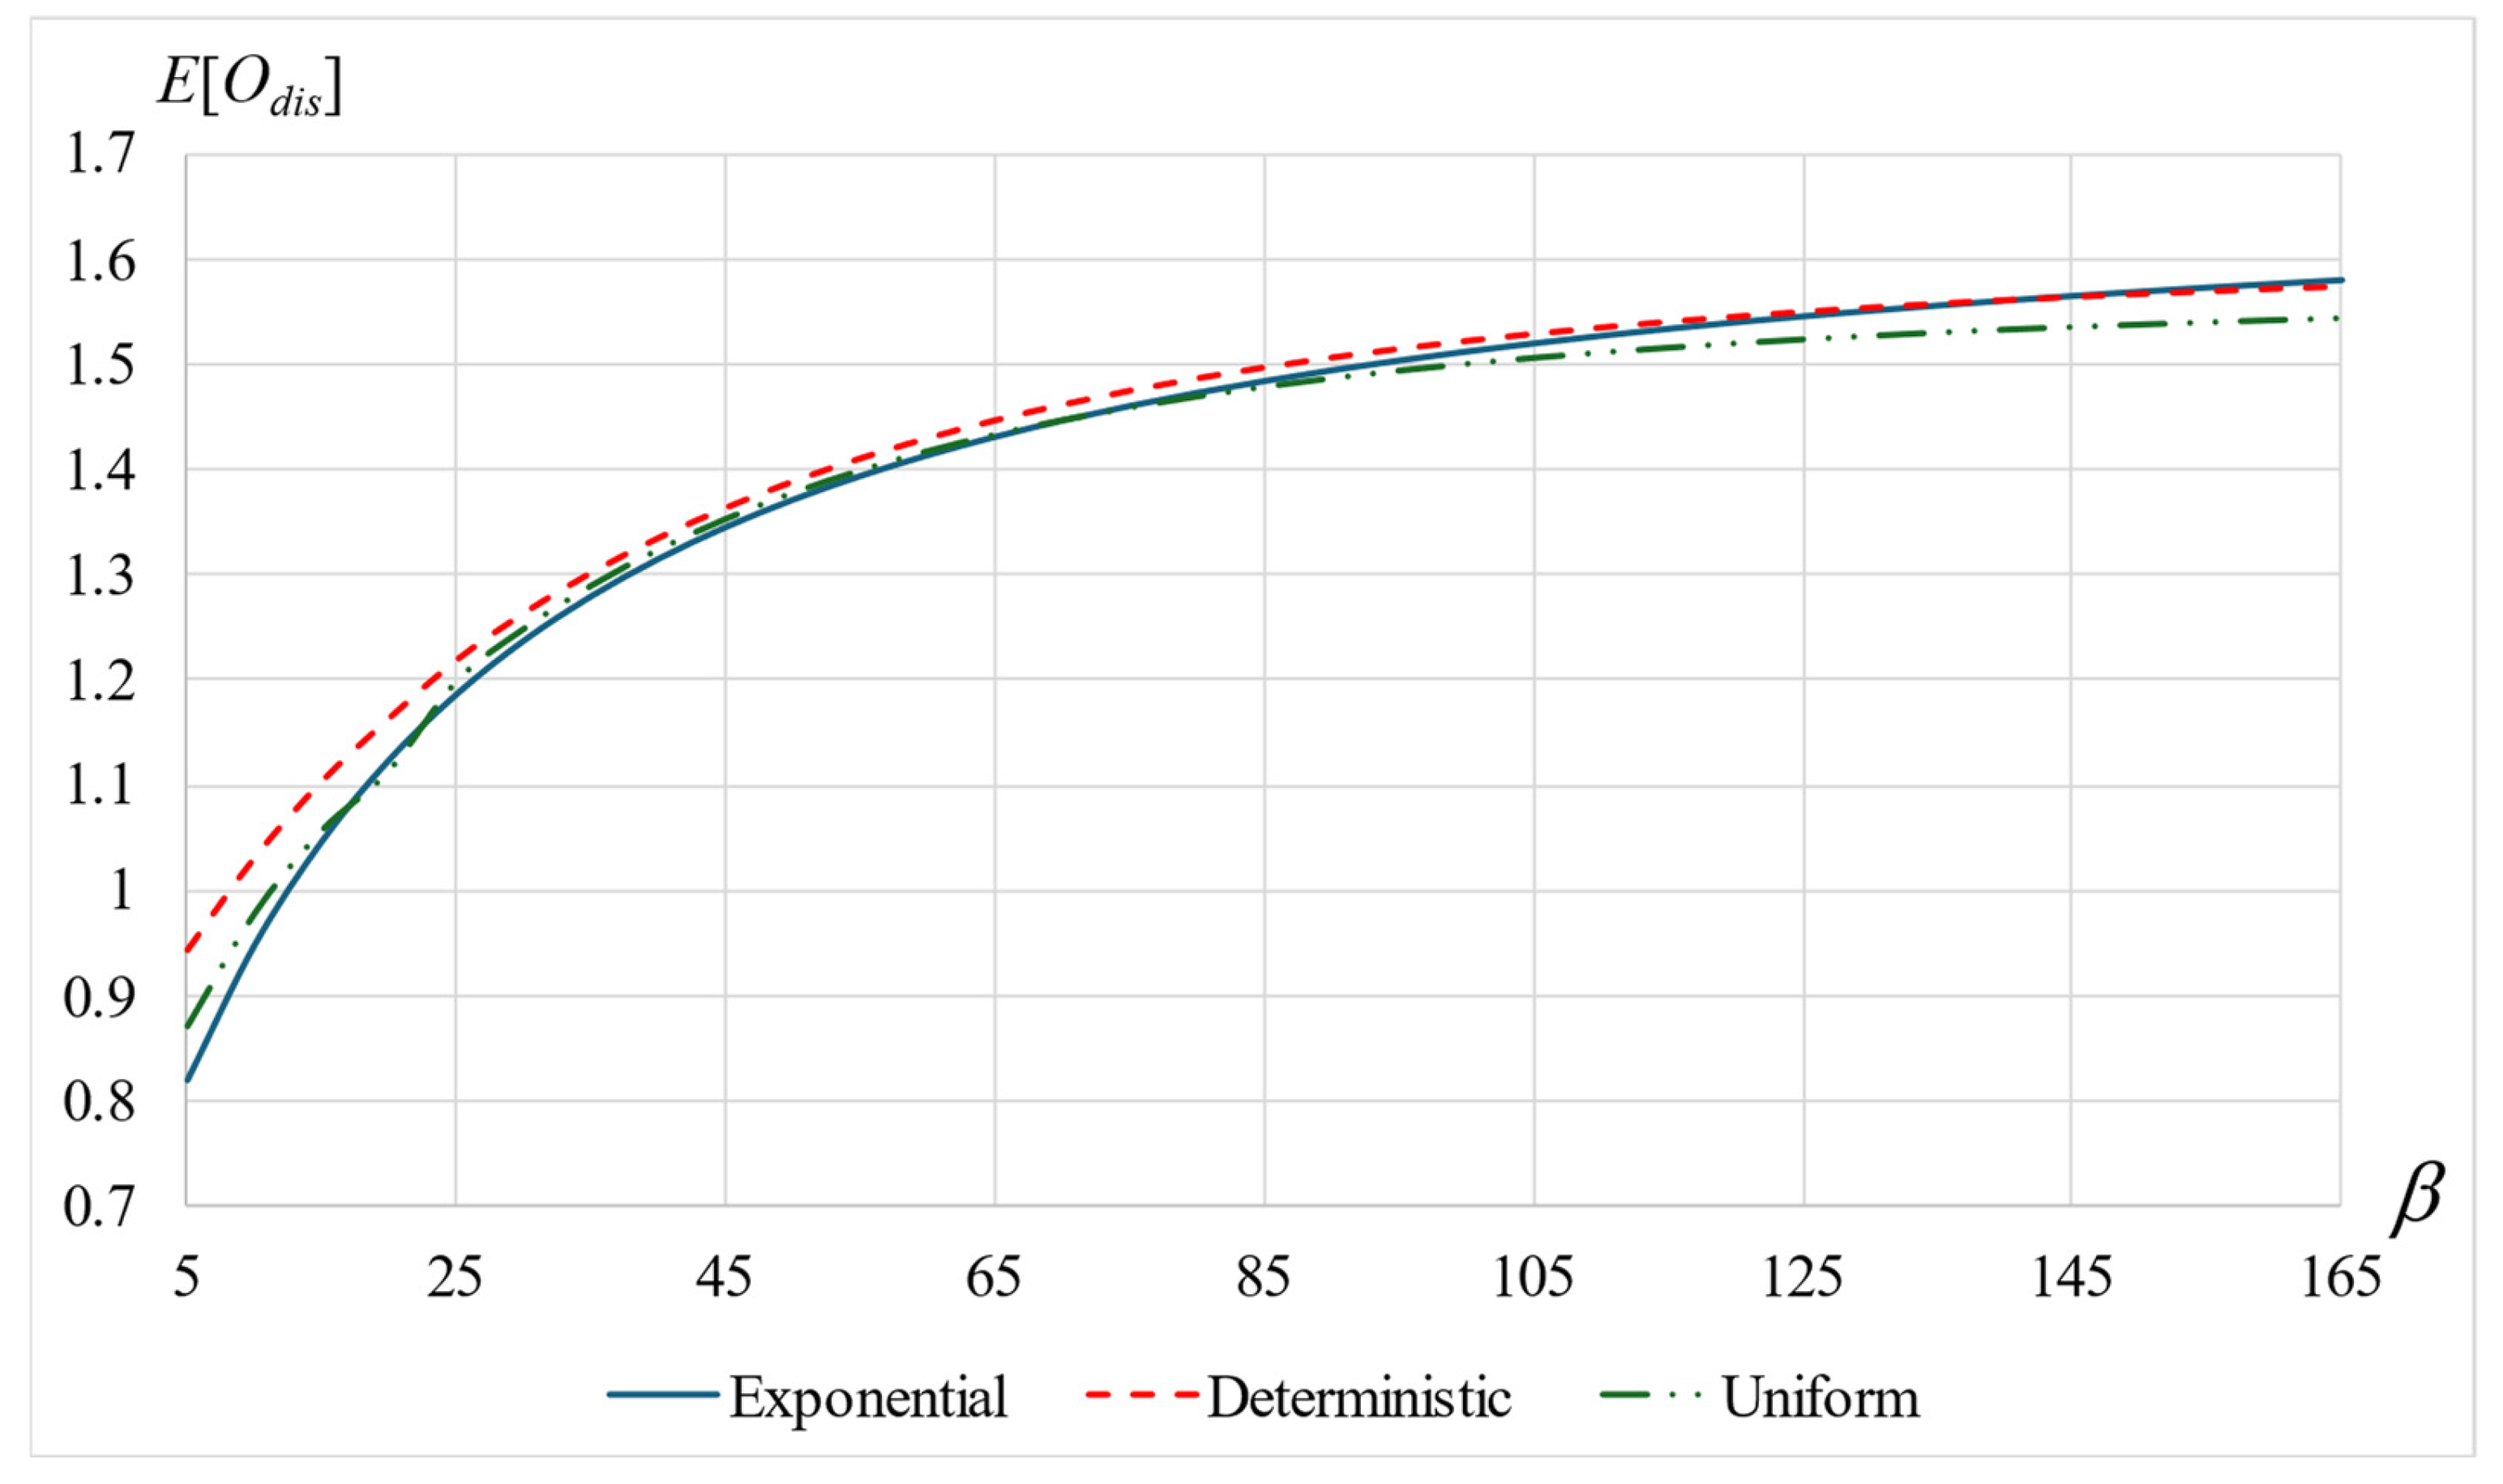
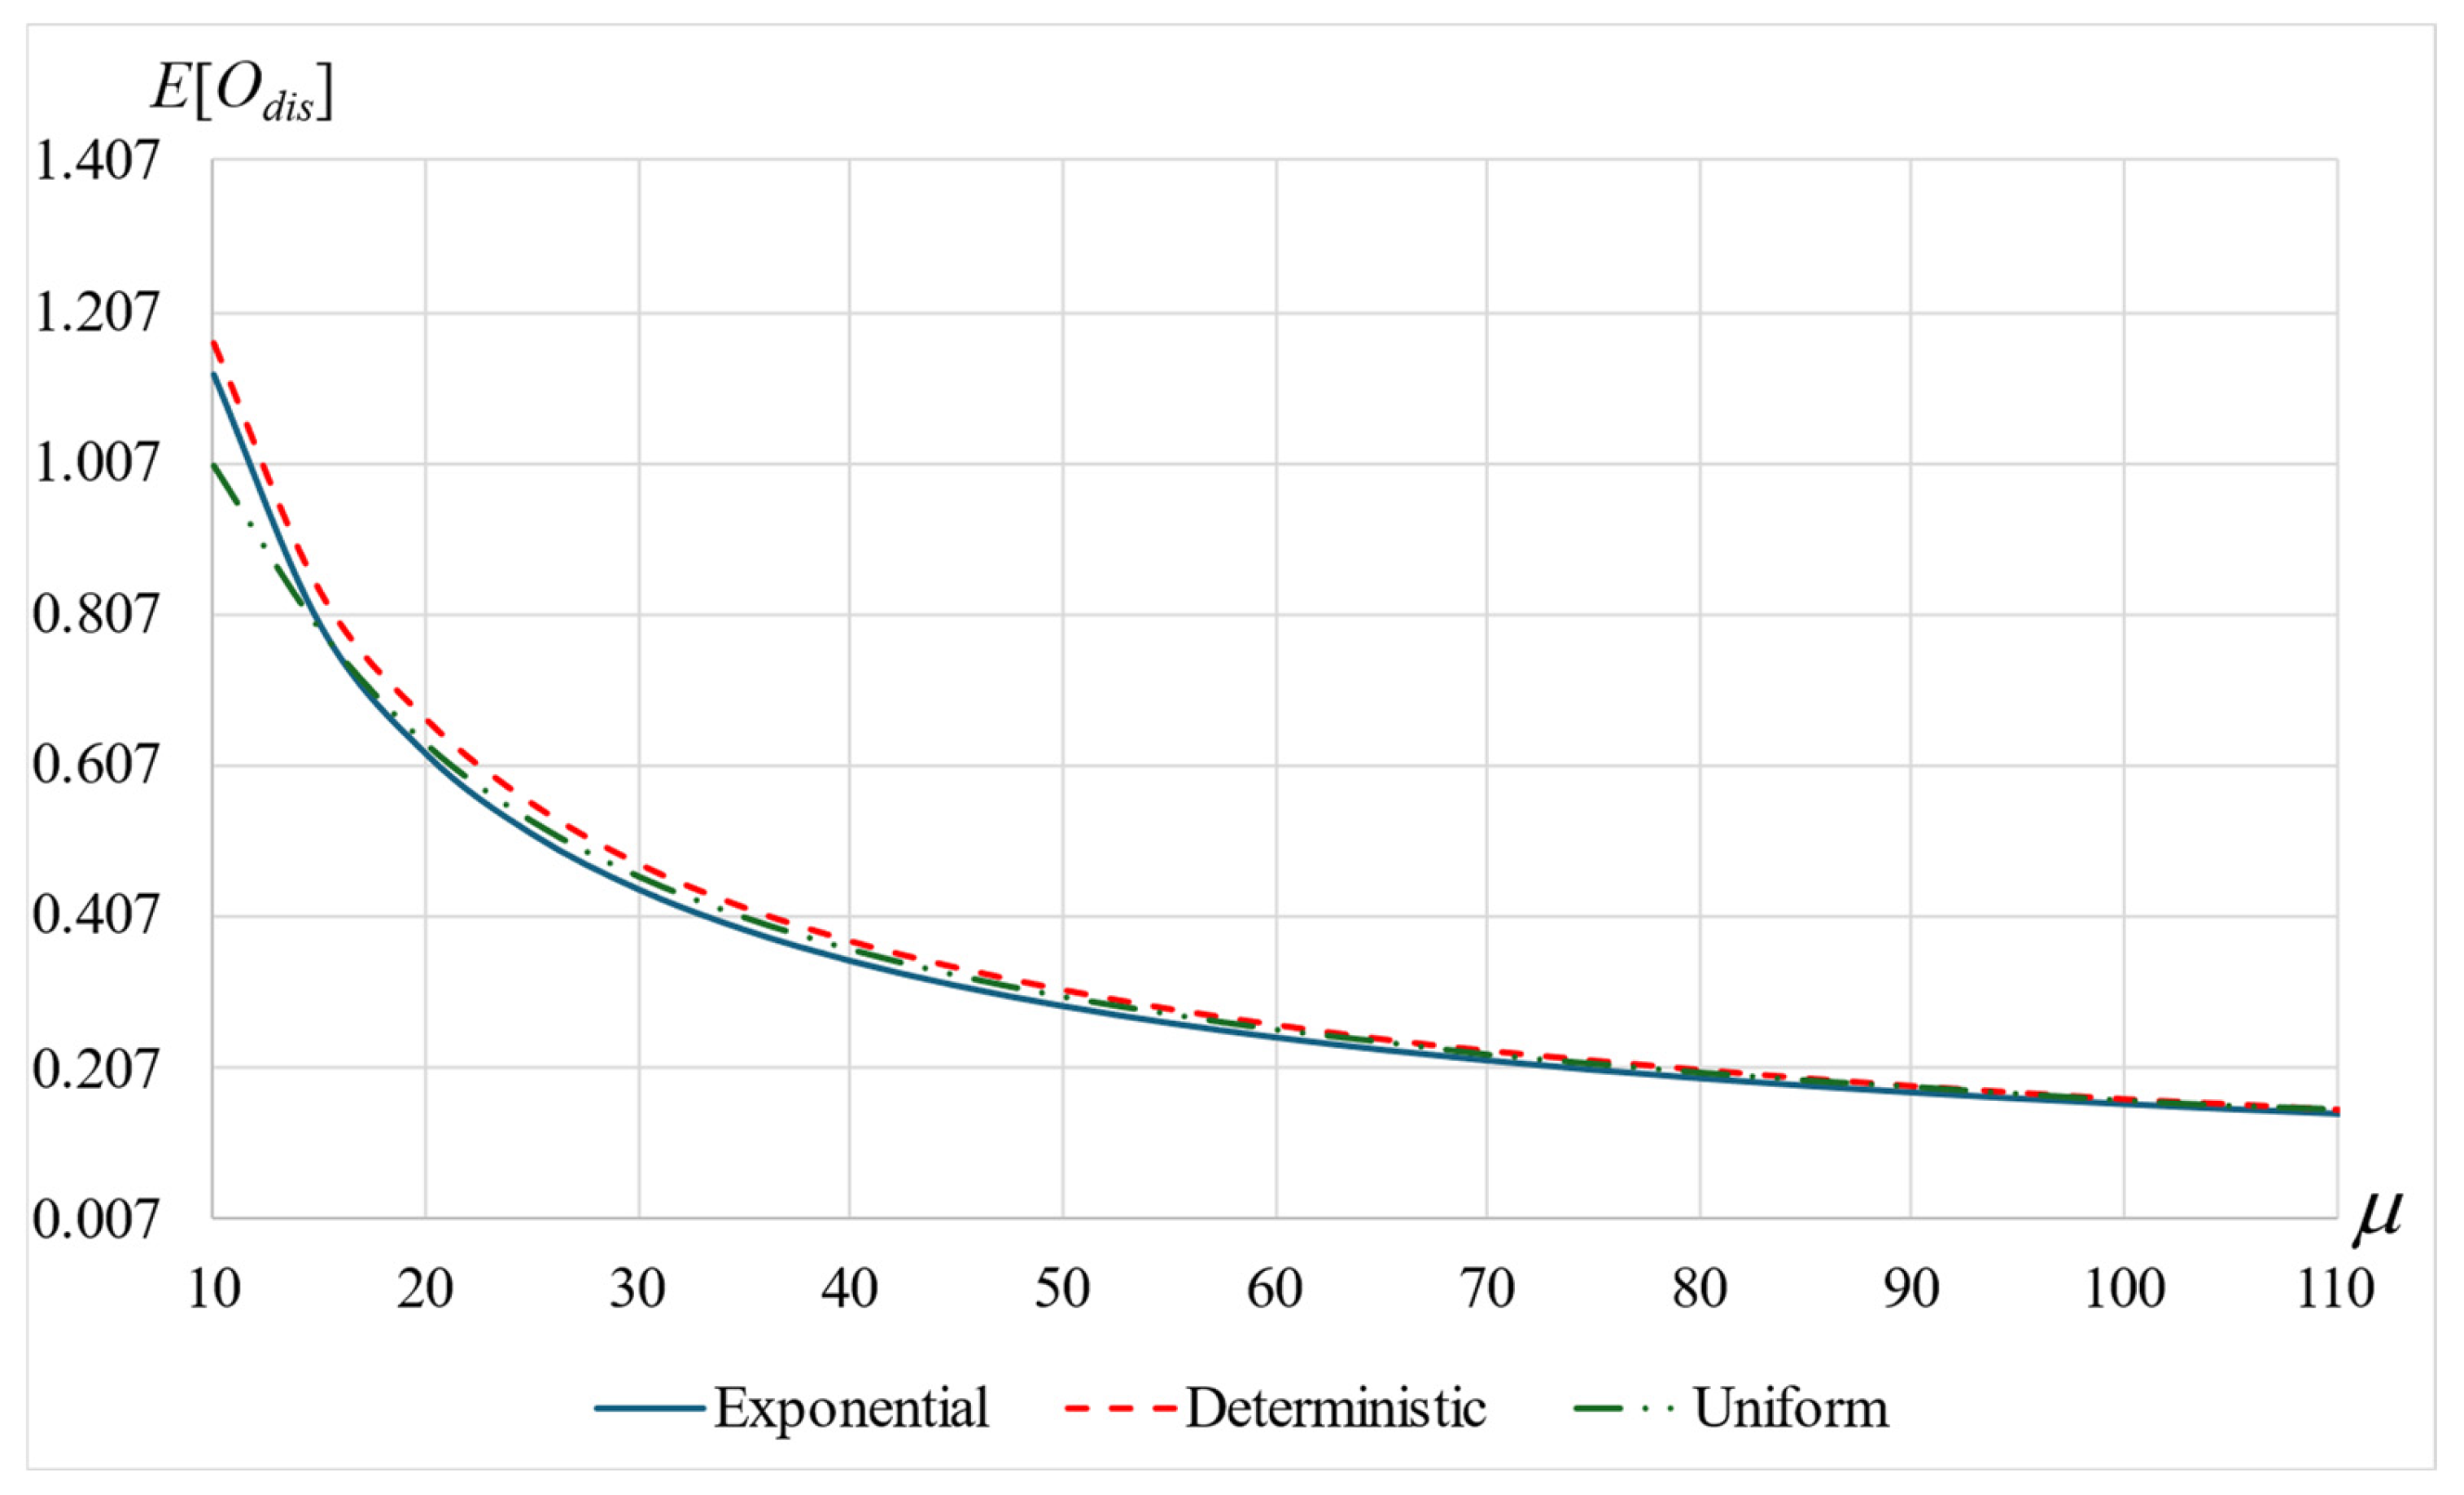
Let  E [ O d i s ]  denote the mean number of the customer’s orbits until departure. Figure 10, Figure 11 and Figure 12 depict  E [ O d i s ]  for  d i s { E x p , D e t e r , U n i f }  by the solid blue, dashed red, and dash-dotted curves, respectively. Figure 10 shows that  E [ O d i s ]  increases with  α  (shorter mean patience time), but the increase is bounded from above. Figure 11 demonstrates that  E [ O d i s ]  increases with  β  (shorter mean orbit time). This result is explained as follows: a shorter time for each orbit excursion increases the probability of going to orbit again. Figure 12 illustrates that  E [ O d i s ]  decreases with  μ , since a shorter service time leads to fewer opportunities to go to orbit during the service time. It is also observed that, for low values of  β  (in particular  β 10 ),  E [ O U n i f ] > E [ O E x p ] . However, for higher values of  β , the order changes and  E [ O E x p ] > E [ O U n i f ]  (see Figure 11). Additionally, according to Figure 12, for low values of  μ  (particularly,  μ 15 ),  E [ O E x p ] > E [ O U n i f ] , but for higher values of  μ  (shorter mean service time), the opposite is true:  E [ O U n i f ] > E [ O E x p ] . Thus, the service time variance affects the mean number of orbits in opposite directions. Yet, when the variance becomes very small, its effect diminishes and all  E [ O d i s ]  values become equal.
Note that the probability that a customer goes to orbit at least once equals  P ( T < B ) . For example, when  B E x p ( 10 )  and  α = 18 P ( T < B ) = α α + μ = 0.64 .

6.6. Main Conclusions

  • The mean number of customers in the system decreases when the variance of the service time decreases.
  • For gamma distributed service times, the mean number of customers decreases with  γ , converging to that for the deterministic distribution.
  • As customers spend more time in orbit, decreasing the service time variance yields a higher reduction in the mean number of customers in the system.
  • As  α  increases, that is, as customers are less patient and go more often to orbit, the mean total sojourn time increases where the orbit time occupies a higher proportion of the total time.
  • Conversely, as  β  increases, that is, as the mean orbit time decreases, the mean total sojourn time decreases. Here, the service time constitutes a higher component.
  • Evidently, the faster the rate of service, the shorter the sojourn times (with or without orbit).
  • Ignoring the orbit time, a higher service variability (e.g., an exponential service) increases the sojourn time in the system. However, when considering the total sojourn time, it is interesting to observe that the added randomness of the orbit time balances the randomness of the service time. Consequently, a system with a higher service variance (e.g., an exponential service) is more efficient.
  • Shorter patient times, shorter orbit times, and longer service times increase the mean number of orbits until departure.
  • The service time variance may affect the mean number of orbits in opposite directions. Yet, when the variance becomes very small, its effect diminishes and all  E [ O d i s ]  values become equal.

7. Summary and Further Research

This paper analyzes an M/G/1 system in the context of customers’ repeated “orbit while in service” policies. Under this frequently encountered policy, each customer whose service has begun waits for a random “patience time” T and then, if the service is still in progress, goes to orbit for a random “orbit time” X. If, on return from orbit, the customer’s service remains in progress, s/he draws another patience time T and waits in the system to determine whether the service has been completed within that time. If so, the customer leaves the system immediately. Otherwise, another orbit time X is drawn, and so on, until the service is completed—either while the customer is waiting in the system or when s/he is in orbit. The server continues rendering service for this customer even while s/he is in orbit. By encouraging customers to implement this policy, their “waiting for service” time may be used more efficiently.
Various system performance measures are derived using the SVT and LSTs. We first obtain the PGFs of L, the number of customers in the system (not including those in orbit), which allows us to calculate  E [ L ] . We then consider V, the total sojourn time of a customer in the system, starting from the moment s/he starts service until departure, and derive the corresponding LST. We further define H as the time a customer remains in orbit after her/his service has been completed and derive its LST. We then consider  E [ D ] = E [ L ] / λ , the customer’s mean sojourn time in the system, not including orbit. Finally, we obtain  E [ O ] , a customer’s mean number of orbits before departure. We consider a range of service time distributions and conduct a comparison analysis for the above performance measures. Specifically, we consider the family of gamma probability distribution functions, spanning the range between the exponential and deterministic distributions, as well as the uniform distribution. This investigation reveals that a customer’s mean total sojourn time (inside the system and in orbit) achieves the highest values when the service time is deterministic and the lowest values when the service time is exponentially distributed. However, the lowest value of the customer’s mean sojourn time inside the system (excluding orbit) is achieved when the service time is deterministic and the highest when the service time is exponentially distributed.
For future research, we propose considering and analyzing “orbit while in service” scenarios with general patience time and general orbit times rather than exponentially distributed times. Another direction for future investigation is to consider varying distributions for orbit times with decreasing means. Similarly, one could consider successive patience times with decreasing or increasing means (in reality, some customers become increasingly less patient while others are willing to remain longer in the system, assuming that the service time distribution is of an increasing failure rate). Finally, it could be interesting to study the “orbit while in service” model with priorities.

Supplementary Materials

The following supporting information can be downloaded at: https://www.mdpi.com/article/10.3390/math12233722/s1, Figure S1: E[Ldis] for gamma (γ = {1, 2, ..., 200}), deterministic, and uniform distributions. Figure S2: ξ, ω, and ψ as a function of μ. Figure S3: E[Ddis] as a function of β. Figure S4: E[Vdis] as a function of μ. Figure S5: E[Hdis] as a function of β.

Author Contributions

Conceptualization, G.H., Y.B. and U.Y.; methodology, G.H., Y.B. and U.Y.; software, G.H.; validation, G.H., Y.B. and U.Y.; formal analysis, G.H., Y.B. and U.Y.; investigation, G.H., Y.B. and U.Y.; writing—original draft preparation, G.H., Y.B. and U.Y.; writing—review and editing, G.H., Y.B. and U.Y.; visualization, G.H., Y.B. and U.Y. All authors have read and agreed to the published version of the manuscript.

Funding

Uri Yechiali’s work was supported by the Israel Science Foundation, grant number 1968/23.

Data Availability Statement

The original contributions presented in this study are included in the article/Supplementary Materials. Further inquiries can be directed to the corresponding author.

Conflicts of Interest

The authors declare no conflicts of interest.

References

  1. Templeton, J.G.C.; Falin, G.I. Retrial Queues; Taylor & Francis: Abingdon, UK, 2023; ISBN 1351418661. [Google Scholar]
  2. Artalejo, J.R.; Gómez-Corral, A. Retrial Queueing Systems: A Computational Approach; Springer: Berlin/Heidelberg, Germany, 2008; ISBN 3540787240. [Google Scholar]
  3. Gómez-Corral, A.; Phung-Duc, T. Retrial Queues and Related Models. Ann. Oper. Res. 2016, 247, 1–2. [Google Scholar] [CrossRef]
  4. Hanukov, G.; Anily, S.; Yechiali, U. Ticket Queues with Regular and Strategic Customers. Queueing Syst. 2020, 95, 145–171. [Google Scholar] [CrossRef]
  5. Hanukov, G.; Yechiali, U. Orbit While in Service. Oper. Res. 2024, 24, 18. [Google Scholar] [CrossRef]
  6. Hanukov, G. A Queueing-Inventory System with a Repeated-Orbit Policy during the Service. Ann. Oper. Res. 2023, 1–33. [Google Scholar] [CrossRef]
  7. Kosten, L. Stochastic Theory of Service Systems. Oper. Res. Q. 1974, 25, 645. Available online: https://cir.nii.ac.jp/crid/1130000796048542720 (accessed on 1 October 2024).
  8. Knessl, C.; Matkowsky, B.J.; Schuss, Z.; Tier, C. An Integral Equation Approach to the M/G/2 Queue. Oper. Res. 1990, 38, 506–518. [Google Scholar] [CrossRef]
  9. Henderson, W. Alternative Approaches to the Analysis of the M/G/1 and G/M/1 Queues. J. Oper. Res. Soc. Jpn. 1972, 15, 92–101. [Google Scholar]
  10. Klimko, E.M.; Neuts, M.F. The Single Server Queue in Discrete Time-numerical Analysis II. Nav. Res. Logist. Q. 1973, 20, 305–319. [Google Scholar] [CrossRef]
  11. DO, L.E. The Discrete-Time Single-Server Queue with Time-Inhomogeneous Compound Poisson Input and General Service Time Distribution. J. Appl. Prob. 1978, 15, 601. [Google Scholar]
  12. Barron, Y. A Replenishment Inventory Model with a Stock-Dependent Demand and Age–Stock-Dependent Cost Functions in a Random Environment. Asia-Pac. J. Oper. Res. 2022, 39, 2150035. [Google Scholar] [CrossRef]
  13. Cohen, J.W. The Single Server Queue; Elsevier: Amsterdam, The Netherlands, 1982. [Google Scholar]
  14. Kerner, Y. The Conditional Distribution of the Residual Service Time in the M n/G/1 Queue. Stoch. Model. 2008, 24, 364–375. [Google Scholar] [CrossRef]
  15. Kulkarni, V.G.; Choi, B.D. Retrial Queues with Server Subject to Breakdowns and Repairs. Queueing Syst. 1990, 7, 191–208. [Google Scholar] [CrossRef]
  16. Kerner, Y.; Shmuel-Bittner, O. Strategic Behavior and Optimization in a Hybrid M/M/1 Queue with Retrials. Queueing Syst. 2020, 96, 285–302. [Google Scholar] [CrossRef]
  17. Fiems, D. Retrial Queues with Constant Retrial Times. Queueing Syst. 2023, 103, 347–365. [Google Scholar] [CrossRef]
  18. Dimitriou, I. A Single Server Retrial Queue with Event-Dependent Arrival Rates. Ann. Oper. Res. 2023, 331, 1053–1088. [Google Scholar] [CrossRef]
  19. Jeganathan, K.; Harikrishnan, T.; Lakshmanan, K.; Melikov, A.; Sztrik, J. Modeling of Junior Servers Approaching a Senior Server in the Retrial Queuing-Inventory System. Mathematics 2023, 11, 4581. [Google Scholar] [CrossRef]
  20. Hu, K.; Allon, G.; Bassamboo, A. Understanding Customer Retrials in Call Centers: Preferences for Service Quality and Service Speed. Manuf. Serv. Oper. Manag. 2022, 24, 1002–1020. [Google Scholar] [CrossRef]
  21. Zhang, Y.; Wang, J. Managing Retrial Queueing Systems with Boundedly Rational Customers. J. Oper. Res. Soc. 2023, 74, 748–761. [Google Scholar] [CrossRef]
  22. Xu, J.; Liu, L.; Wu, K. Analysis of a Retrial Queueing System with Priority Service and Modified Multiple Vacations. Commun. Stat.-Theory Methods 2022, 52, 6207–6231. [Google Scholar] [CrossRef]
  23. Lee, S.W.; Kim, B.; Kim, J. Analysis of the Waiting Time Distribution in M/G/1 Retrial Queues with Two Way Communication. Ann. Oper. Res. 2022, 310, 505–518. [Google Scholar] [CrossRef]
  24. Avrachenkov, K.; Yechiali, U. Retrial Networks with Finite Buffers and Their Application to Internet Data Traffic. Probab. Eng. Inf. Sci. 2008, 22, 519–536. [Google Scholar] [CrossRef]
  25. Yechiali, U. Queues with System Disasters and Impatient Customers When System Is Down. Queueing Syst. 2007, 56, 195–202. [Google Scholar] [CrossRef]
  26. Liu, H.-L.; Li, Q.-L. Matched Queues with Flexible and Impatient Customers. Methodol. Comput. Appl. Probab. 2023, 25, 4. [Google Scholar] [CrossRef]
  27. Aalto, S. Whittle Index Approach to Multiserver Scheduling with Impatient Customers and DHR Service Times. Queueing Syst. 2024, 107, 1–30. [Google Scholar] [CrossRef]
  28. Manitz, M.; Piehl, M.-P. A Fast Staffing Algorithm for Multistage Call Centers with Impatient Customers and Time-Dependent Overflow. Cent. Eur. J. Oper. Res. 2024, 32, 763–791. [Google Scholar] [CrossRef]
  29. Lv, S.; Li, F.; Li, J. The M/M/c Retrial Queueing System with Impatient Customers and Server Working Breakdown. IAENG Int. J. Appl. Math. 2024, 54, 1499. [Google Scholar]
  30. Altman, E.; Yechiali, U. Analysis of Customers’ Impatience in Queues with Server Vacations. Queueing Syst. 2006, 52, 261–279. [Google Scholar] [CrossRef]
  31. Altman, E.; Yechiali, U. Infinite-Server Queues with System’s Additional Tasks and Impatient Customers. Probab. Eng. Inf. Sci. 2008, 22, 477–493. [Google Scholar] [CrossRef]
  32. Inoue, Y.; Ravner, L.; Mandjes, M. Estimating Customer Impatience in a Service System with Unobserved Balking. Stoch. Syst. 2023, 13, 181–210. [Google Scholar] [CrossRef]
  33. Bassamboo, A.; Randhawa, R.; Wu, C. Optimally Scheduling Heterogeneous Impatient Customers. Manuf. Serv. Oper. Manag. 2023, 25, 1066–1080. [Google Scholar] [CrossRef]
  34. Sharma, S.; Kumar, R.; Soodan, B.S.; Singh, P. Queuing Models with Customers’ Impatience: A Survey. Int. J. Math. Oper. Res. 2023, 26, 523–547. [Google Scholar] [CrossRef]
  35. Levy, Y.; Yechiali, U. Utilization of Idle Time in an M/G/1 Queueing System. Manag. Sci. 1975, 22, 202–211. [Google Scholar] [CrossRef]
  36. Levy, Y.; Yechiali, U. An M/M/s Queue with Servers’ Vacations. INFOR Inf. Syst. Oper. Res. 1976, 14, 153–163. [Google Scholar] [CrossRef]
  37. Takagi, H. Queueing Analysis: A Foundation of Performance Evaluation. In Vacation and Priority Systems; Elsevier: Amsterdam, The Netherlands, 1991; Volume 1. [Google Scholar]
  38. Tian, N.; Zhang, Z.G. Vacation Queueing Models: Theory and Applications; Springer Science & Business Media: Berlin/Heidelberg, Germany, 2006; Volume 93, ISBN 0387337237. [Google Scholar]
  39. Barron, Y. A Threshold Policy in a Markov-Modulated Production System with Server Vacation: The Case of Continuous and Batch Supplies. Adv. Appl. Probab. 2018, 50, 1246–1274. [Google Scholar] [CrossRef]
  40. Niranjan, S.P.; Devi Latha, S.; Mahdal, M.; Karthik, K. Multiple Control Policy in Unreliable Two-Phase Bulk Queueing System with Active Bernoulli Feedback and Vacation. Mathematics 2023, 12, 75. [Google Scholar] [CrossRef]
  41. Liu, T.-H.; Chiou, K.-C.; Chen, C.-M.; Chang, F.-M. Multiserver Retrial Queue with Two-Way Communication and Synchronous Working Vacation. Mathematics 2024, 12, 1163. [Google Scholar] [CrossRef]
  42. Khan, I.E.; Paramasivam, R. Reduction in Waiting Time in an M/M/1/N Encouraged Arrival Queue with Feedback, Balking and Maintaining of Reneged Customers. Symmetry 2022, 14, 1743. [Google Scholar] [CrossRef]
  43. Melikov, A.; Aliyeva, S.; Sztrik, J. Analysis of Instantaneous Feedback Queue with Heterogeneous Servers. Mathematics 2020, 8, 2186. [Google Scholar] [CrossRef]
  44. Melikov, A.; Chakravarthy, S.R.; Aliyeva, S. A Retrial Queueing Model with Feedback. Queueing Models Serv. Manag. 2023, 6, 63–95. [Google Scholar]
  45. Mytalas, G.C.; Zazanis, M.A. Performance Analysis for Bernoulli Feedback Queues Subject to Disasters: A System with Batch Poisson Arrivals under a Multiple Vacation Policy. Qual. Technol. Quant. Manag. 2023, 20, 113–146. [Google Scholar] [CrossRef]
  46. Ross, S.M. Stochastic Processes; Wiley: New York, NY, USA, 1996; Volume 2. [Google Scholar]
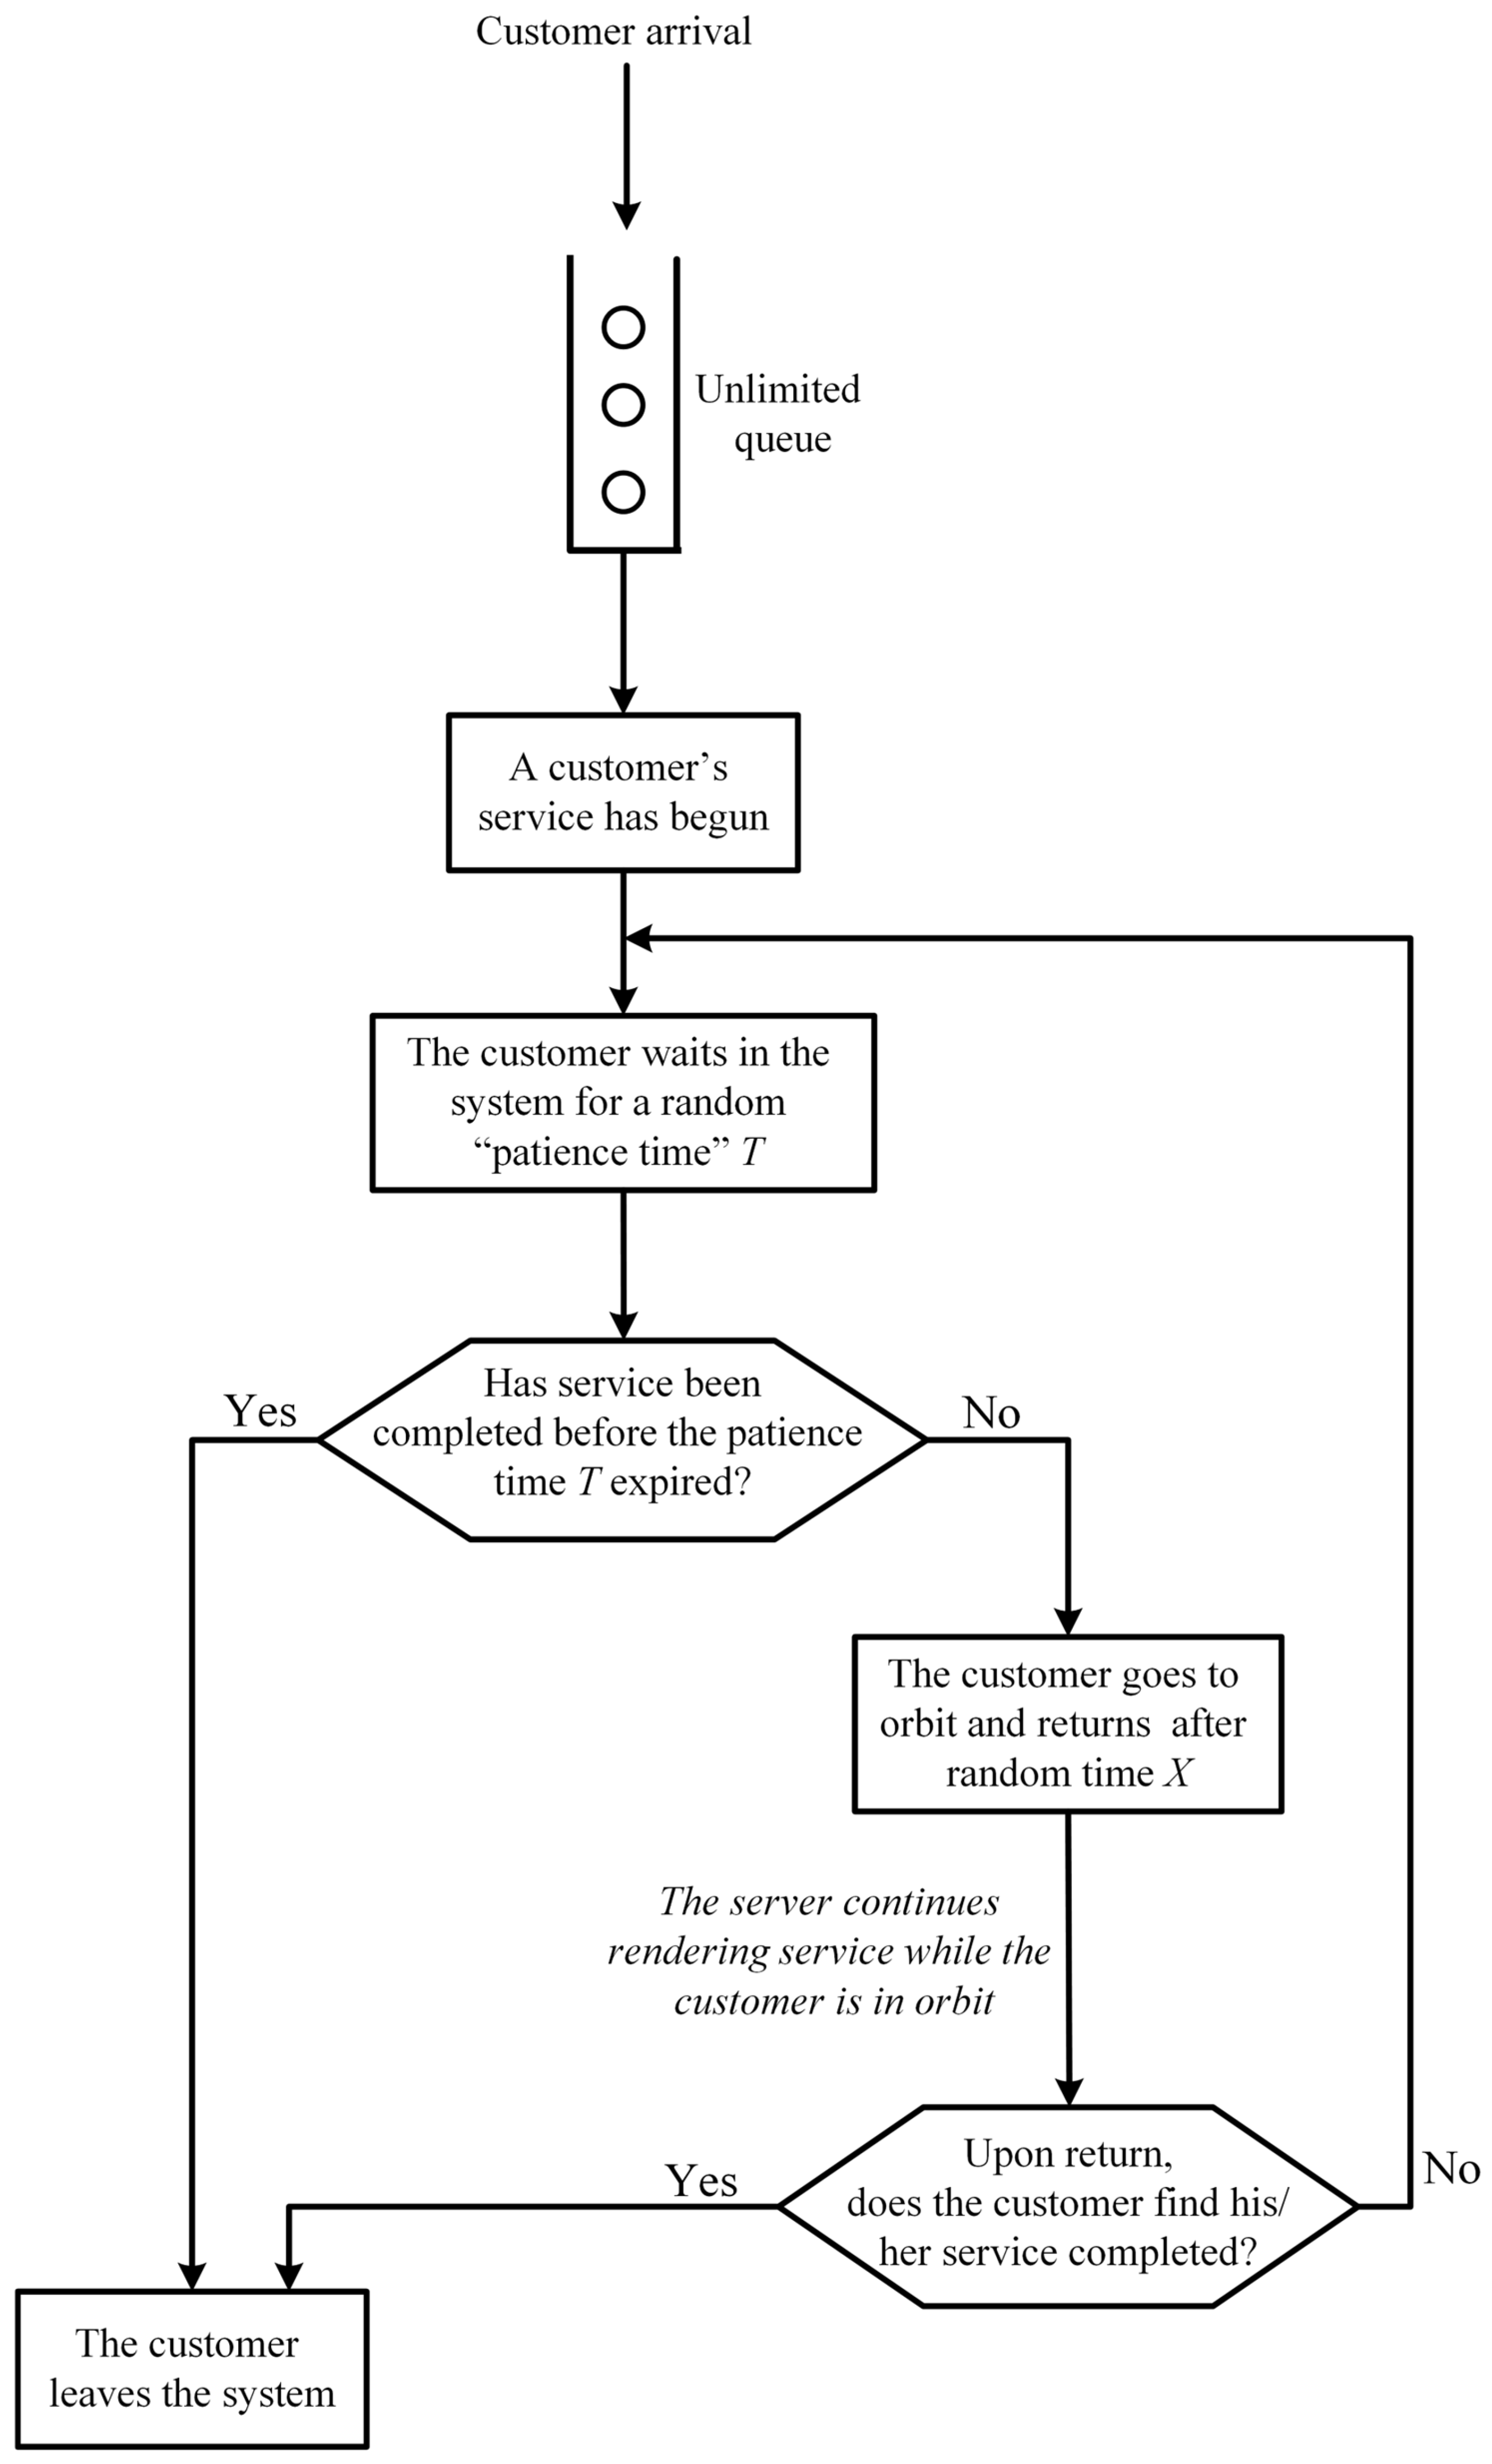
Figure 1. The flow scheme of the system.
Mathematics 12 03722 g001
Figure 2. ξ ω , and  ψ  as a function of  α .
Mathematics 12 03722 g002
Figure 3. ξ ω , and  ψ  as a function of  β .
Mathematics 12 03722 g003
Figure 4. E [ D d i s ]  as a function of  α .
Mathematics 12 03722 g004
Figure 5. E [ D d i s ]  as a function of  μ .
Mathematics 12 03722 g005
Figure 6. E [ V d i s ]  as a function of  α .
Mathematics 12 03722 g006
Figure 7. E [ V d i s ]  as a function of  β .
Mathematics 12 03722 g007
Figure 8. E [ H d i s ]  as a function of  α .
Mathematics 12 03722 g008
Figure 9. E [ H d i s ]  as a function of  μ .
Mathematics 12 03722 g009
Figure 10. E [ O d i s ]  as a function of  α .
Mathematics 12 03722 g010
Figure 11. E [ O d i s ]  as a function of  β .
Mathematics 12 03722 g011
Figure 12. E [ O d i s ]  as a function of  μ .
Mathematics 12 03722 g012
Disclaimer/Publisher’s Note: The statements, opinions and data contained in all publications are solely those of the individual author(s) and contributor(s) and not of MDPI and/or the editor(s). MDPI and/or the editor(s) disclaim responsibility for any injury to people or property resulting from any ideas, methods, instructions or products referred to in the content.