Abstract
The application of blockchain has become a trend in the development of supply chain finance. Aiming to bridge the gap in the existing literature, this paper investigates a supply chain finance system based on blockchain technology which contains a manufacturer, a retailer and a financial institution and incorporates blockchain costs into the model. Firstly, this paper establishes a supply chain finance model based on blockchain technology and it presents a comparison with the process employed under the traditional model. Secondly, this paper establishes the revenue mathematical model of supply chain finance based on blockchain technology. Thirdly, the optimal decisions of each participant under centralized and decentralized decision-making are proved and obtained, respectively, and the influencing factors of the optimal decisions are analyzed. Finally, the conclusions are verified via simulations. This study finds that, when blockchain is used, the benefits of each participant in the chain are increased. In addition, centralized decision-making, which is more optimal in the traditional model, is also enhanced under blockchain. This paper demonstrates the superiority of blockchain-enabled supply chain finance in terms of model and revenue. This provides some suggestions for companies in the supply chain with regard to solving the problem of financing difficulties.
MSC:
91-10
1. Introduction
Small and medium enterprises (SMEs) comprise the largest and most dynamic group of enterprises and have become the mainstay of China’s economic and social development. SMEs’ development is shackled by difficulties related to financing and high financing costs. To overcome these challenges, the focus of supply chain research and development has shifted to supply chain finance (SCF). Nevertheless, there are still some problems that exist in the development of supply chain finance. SCF is the core enterprise providing financial services to SMEs in the supply chain with their own credit backing. In contrast, traditional supply chain finance cannot pass credit to the whole chain but only to first-tier suppliers and first-tier distributors who have direct transactions with the core enterprise. There are many levels of SMEs in the supply chain. Most of them do not enjoy the credit backing of the core enterprises. At the same time, the information in the chain is not transparent and smooth. Enterprise management systems are not consistent in the chain. As a result, it is difficult to transfer information, leading to the formation of information silos. In addition, the risk of default brought about by the opacity of information also makes financial institutions more cautious, which exacerbates the difficulties related to financing for SMEs.
In the continuous development of supply chain finance and the integration of new technologies, blockchain technology has been well used in supply chain finance. With its distributed ledger technology, blockchain technology circulates data within the chain and reduces the degree of information asymmetry in the supply chain. The tamper-evident nature of the distributed ledger ensures the authenticity of the data. In the way that the credit of the core enterprise is allowed to be passed on, the multilevel SMEs in the chain can receive credit from the core enterprise and obtain financing. At the same time, blockchain enables the enterprises within the chain to assist each other and monitor each other. Blockchain is helpful in reducing the risk of private collusion in traditional supply chains, thus overcoming the financing difficulties and financing costs caused by mistrust and promoting the development of supply chains.
When scholars study the optimal decision-making problem of supply chain finance based on blockchain technology, most of them focus on the change in revenue brought by the transformation of the process after the adoption of blockchain technology in supply chain finance. However, the cost of blockchain was not considered during the modeling process. In addition, some scholars have not ignored the cost of blockchain, but most of them set the cost of blockchain as a simple fixed parameter.
Therefore, in this paper, when studying the application of blockchain technology, we not only focus on the model changes caused by the process changes, but also focus on the setup of blockchain costs. When blockchain technology is adopted, various costs follow, such as the blockchain building cost, maintenance cost, information storage cost, etc. In this paper, these costs are spread to each item. Therefore, the cost is set as one unit of blockchain cost for each unit of commodity produced. This is beneficial for enterprises on the supply chain to have a clearer measurement of blockchain costs and the benefits of adopting blockchain technology. Thus, adopting blockchain technology can promote the development of enterprises on the supply chain.
In summary, the application of blockchain in supply chain finance has many benefits, but it is still understudied in terms of quantitative research on supply chain finance decision-making based on blockchain technology. In this paper, the following issues are studied:
- This paper establishes a supply chain financial financing model based on blockchain technology. Compared to traditional models, the participants in the supply chain can reduce burdensome costs such as deposits and make the flow of funds faster.
- This paper establishes a mathematical model of the benefits of the three participants in the supply chain finance model based on blockchain technology. It proves that after applying blockchain technology, the optimal decision of each participant exists and the benefits to each participant increase.
- This paper investigates the factors influencing the optimal decisions of the three participants in supply chain finance based on blockchain technology.
The remaining part of this article is arranged as follows: Section 2 reviews the relevant literature, explores the shortcomings of the relevant literature and details the work of this article. Section 3 elaborates on the basic assumptions. Section 4 delves into the changes in supply chain finance processes after adopting blockchain technology. Section 5 and Section 6 use CVaR to establish profit models for supply chain finance participants under the traditional mode and blockchain-enabled supply chain finance. In addition, the Stackleberg game model was used to obtain the optimal decisions of each participant and the influencing factors of the decisions. Section 7 uses numerical simulation to verify the above model results. Finally, Section 8 discusses our research findings, elaborates on the limitations of this article and presents future research directions.
2. Literature Review
2.1. Supply Chain Finance and Risk Measurement Methodology
Supply chain finance is an important solution to the supply chain financing problem, and its emergence reduces the cost of financing in the supply chain and makes the flow of funds more efficient [1]. Supply chain finance has gone through different stages in its development over the years [2]. Scholars’ research on supply chain finance is also getting deeper and deeper. In addition, risk is an important topic in supply chain finance. Qiao et al. [3] found that supply chain risk management has a significant impact on the performance of supply chain finance via the study of data obtained from 286 SMEs. Li, Y. et al. [4] used a hybrid extreme gradient boosting multilayer perceptron (XGBoost-MLP) model to assess the credit risk of digital SCF. The most widely used risk measures are mean-variance (MV), value at risk (VaR) and conditional value at risk (CVaR). However, mean-variance applies to symmetric distributions and not to asymmetric distributions [5]. In addition, market demand is usually not symmetrically distributed. Therefore, it is not an appropriate method. VaR also cannot be used because it is not a coherent risk measure and does not show information about the risk below the quantile [6,7]. In addition, the following advantages of CVaR show its superiority. Firstly, CVaR is able to handle asymmetric distributions. Secondly, CVaR is a coherent risk measure. Thirdly, CVaR is able to show excess losses. Fourth, CVaR has good computational properties [8]. Fifth, CVaR is easier to quantify than the other two methods [9]. Therefore, this paper adopts CVaR as a risk measure. Other scholars have also applied CVaR to supply chain finance, as shown in Table 1. Esmaeili-Najafabadi, E. et al. [10] use CVaR as a risk assessment tool for participants and to analyze the behavior of decision-makers. With the ability to assess risk, the participants in the supply chain need to make an optimal decision. Han et al. [11] used CVaR to determine the optimal decision regarding the number of orders and the level of sales effort and a contract was designed to coordinate the benefits to retailers and manufacturers. There are also scholars who have made decisions via the method of games. Jena, S. K. [12] used the Stackelberg game model to determine the optimal decision for the manufacturer. Some scholars have also studied a system consisting of a manufacturer, a retailer and a financial institution. CVaR and the Stackelberg game model have been used to build a decision model and derive its optimal decision with the effects of risk preference and decision preference on the optimal decision being studied [13,14]. Although supply chain finance is a good way to solve the financing problems of SMEs in the supply chain, supply chain finance itself also has some problems. Transparency and the sharing of information in the supply chain are the pain point problems that exist in supply chain finance [15,16]. These problems hinder the development of supply chain finance.

Table 1.
Paper about CVaR applied to Supply chain finance.
2.2. Supply Chain Finance Based on Blockchain Technology
As an emerging technology, blockchain is widely used in various fields. Scholars are also using this technology to solve the pain point problems in supply chain finance [23,24]. Arief Rijanto [25] used a multi-case analysis based on a technology acceptance model to demonstrate that blockchain can solve the trust problems and verify the transaction data in supply chain finance. Xiao, P. et al. [26] proposed an entropy approach to constructing a model and tested it with logistic regression. The study found that blockchain technology can reduce credit risk. Sun et al. [27] investigated the introduction of blockchain technology by replicating dynamic equations. It was found that the probability of financial institutions accepting factoring increased after the introduction of blockchain technology. Several scholars have studied the decision-making problem of supply chain finance after the introduction of blockchain. Tsan-Ming Choi [28] considered an expected profit model in the case of a single supplier and a retailer with a revenue-sharing contract; he then used Nash bargaining to obtain the optimal order quantity. In his study, he looked at a secondary supply chain and set a fixed blockchain cost. However, his study did not involve financial institutions. Some scholars have also studied a system that includes a secondary supply chain and financial institutions. Luo, Y. et al. [29] compared the game behavior of traditional supply chain finance and supply chain finance participants in the blockchain and the difference between the mixed decision Nash equilibrium with regard to increasing the blockchain incentives and penalties. It was found that financiers and providers were more likely to cooperate when the blockchain rewards and penalties were increased. Su, L. et al. [30] constructed a three-party game model using evolutionary game theory to analyze the impact of blockchain technology on the evolutionary stabilization strategies employed by financial institutions, core firms, and small and medium-sized enterprises (SMEs). There are even scholars who have studied a three-level supply chain [31,32]. However, none of these scholars have considered blockchain costs in their studies, and only have taken the approach of introducing rewards and penalties to reflect the benefits of blockchain technology. Some other scholars have studied the factors that affect decision-making when blockchain technology is introduced, such as the maturity and complexity of blockchain technology, and whether these factors affect whether the decision-maker adopts blockchain technology or not [33,34]. Some other scholars have also investigated the integration of blockchain technology and supply chain finance. The details are shown in the following Table 2:
Table 2.
Papers about supply chain finance based on Blockchain technology.
We summarize the research on supply chain finance and the application of blockchain technology to supply chain management in the above literature. Scholars have perfected the research on supply chain finance and found some problems in the traditional approaches to supply chain finance, such as the low quality of data obtained from SMEs, which makes it difficult to meet the financing requirements of banks. Serious information asymmetry in the supply chain and difficulties transferring credit from core enterprises also exist. In addition, scholars have found that blockchain can effectively solve these problems in supply chain finance. However, such studies pay more attention to qualitative aspects, while the quantitative aspects are ignored.
This paper attempts to address the deficiencies that are present in the existing literature and argues that supply chain finance using blockchain technology is superior to traditional models. First of all, scholars’ studies have mostly explored the role of blockchain technology when it is applied to supply chain finance from the technical level and application level, and the research undertaken from the quantitative perspective is relatively weak. However, quantitative research can more clearly and significantly show the role of blockchain technology when it is applied to supply chain finance. Secondly, among the scholars who have studied blockchain and supply chain finance quantitatively, most of their research involves two-party games, and there are very few studies on games from a three-party perspective. Retailers, core enterprises and financial institutions constitute a simple but comprehensive supply chain finance system. Studying this domain from the perspective of three-party games would show the game process implicated in blockchain finance more comprehensively and realistically. Finally, most scholars do not address the blockchain cost issue when conducting quantitative research. The application of a new technology will inevitably bring costs.
We take the manufacturer as the leading party and apply the CVaR theory to portray the expected profit function of the retailer, financial institution and manufacturer and add blockchain cost to the model. Then, we use the Stackelberg game model to optimize the optimal order quantity of the retailer, the optimal interest rate of the financial institution and the optimal wholesale price of the supplier under decentralized decision-making and centralized decision-making. This study shows that the supply chain order quantity under centralized decision-making is larger than that of retailers under decentralized decision-making. Moreover, blockchain-enabled supply chain finance can increase profits compared to the traditional model. It is worthwhile to note that centralized decision-making is better than decentralized decision-making.
3. Basic Assumptions
At the beginning of the selling season, retailer R orders units of product from manufacturer M at the wholesale price , with a production cost of . The market demand is a random variable with values in (0, +∞), and its cumulative probability distribution function and probability density function are and , respectively. Let , and assume that the distribution function satisfies the IGFR property. The retailer sells the goods to the consumer at price and disposes of the surplus product at a residual value . Let .
Assuming that the retailer has capital at the beginning, the retailer’s capital needs are ; when , the retailer has a financing requirement, or no financing is needed. Here, we assume . The interest rate at which the financial institution F lends and the interest rate under risk-free conditions are and . Assuming that the financial institution is in a highly competitive capital market, the financial institution can earn the risk-free rate at most. The manufacturer’s risk guarantee ratio is denoted as . The financial institution’s risk guarantee ratio is .
If the supply chain passes the eligibility check, the loan will be approved; otherwise, it will not be approved. The cost of qualification is denoted as . In traditional supply chain finance, to support the operation of supply chain finance in the supply chain, the retailer and the manufacturer need to pay a service fee to the financial institution for and , respectively.
The hypothesis in this paper assumes that the manufacturer is the leader, the financial institution is the secondary leader and the retailer is the follower in the supply chain financing system where the manufacturer determines the wholesale price , the financial institution determines the interest rate and the retailer determines the order quantity . Let a denote the attitude to risk of participant . The smaller is, the higher the risk aversion of participant . When , participant is risk neutral (Table 3).
Table 3.
Variables and explanations.
According to the definition of CVaR [9], let be the benefit function of participant for market demand . Then, the CVaR utility function of participant is given as follows:
where denotes the expected value of and is a fixed parameter.
4. Comparative Analysis of the Financing Model Process before and after the Introduction of Blockchain
In this section, we investigate the operation process of supply chain finance under the traditional mode (hereinafter referred to as the “T mode”) and blockchain-enabled supply chain finance (hereinafter referred to as the “B mode”), and further explain the characteristics and advantages of B mode financing by comparing the advantages and disadvantages between them.
Figure 1 shows that in the T mode model, the retailer submits an order to the supplier in response to market demand and signs a purchase and sale agreement with the supplier. Since the retailer only holds its own capital and cannot afford the payment of for goods, supply chain finance is applied from the financial institution and the service fee is paid to the financial institution to maintain the operation of the supply chain. The financial institution receives the application and evaluates the eligibility of the retailer and incurs the evaluation fee for the evaluation process. After the review, supply chain finance is provided to the retailer. The supplier enters into a guarantee agreement with the financial institution and pays a service fee to the financial institution for supply chain financing to maintain supply chain operations. The retailer pays the supplier to pick up the goods, repays the financial institution after receiving the sales profit after the sale, and finally receives the sales revenue . Due to the uncertainty of market demand, the retailer’s sales revenue may not be sufficient to cover the loan . Therefore, the actual repayment is . This yields a critical demand for the retailer’s insolvency ; when , the retailer is unable to repay the loan. In this case, the supplier is required to act as a guarantor and pay a portion of the retailer’s outstanding loan to the financial institution. When , the market demand is less than the retailer’s order quantity and the supplier then acquires the remaining goods at a residual value .
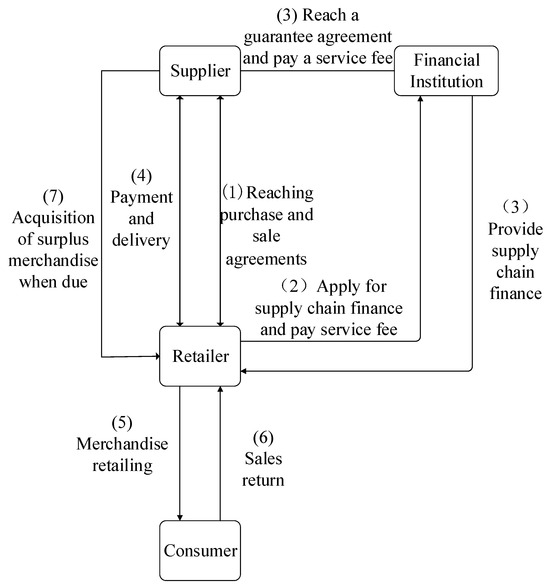
Figure 1.
Supply chain finance operation model under the T model.
Figure 2 shows the case of the B model. The retailer submits an order to the supplier in response to the market demand, signs a purchase and sale agreement and uploads the chain. The retailer only holds its own funds and cannot afford the payment of for goods. Blockchain supply chain finance is provided by financial institutions. The financial institution receives the financing application. Then, it makes inquiries on the blockchain and reviews the financial situation of the retailer. After confirming that the retailer is eligible for financing, the financial institution provides supply chain finance and signs a contract with the retailer to form a smart contract on the chain and lend money. A guarantee agreement with the supplier is also made to form a smart contract on the chain. The retailer sells products to the market, and every product sold is recorded on the chain. After the sales are paid back, the retailer automatically repays the financial institution through the smart contract. Since each transaction on the blockchain incurs a cost fee, the retailer’s sales revenue becomes and the actual repayment becomes . Therefore, a critical demand for retailer bankruptcy can be obtained. When , the retailer cannot repay the loan. When the retailer is unable to repay the loan, the supplier needs to play the role of a guarantor, and the smart contract automatically pays a portion of the outstanding loan to the financial institution. When , the market demand is less than the retailer’s order quantity, so the supplier then acquires the remaining goods at a residual value .
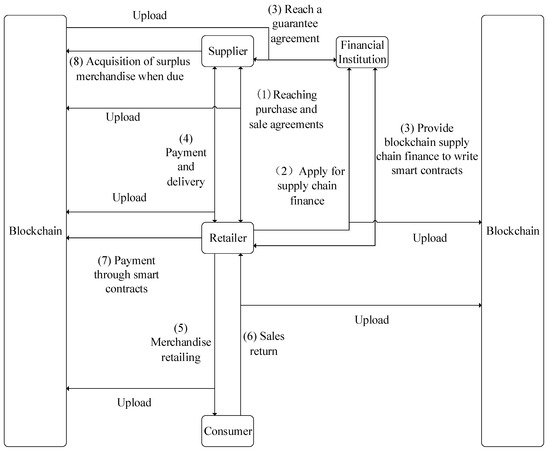
Figure 2.
Supply chain finance operation model under B model.
It is easy to observe the differences and advantages of blockchain-enabled supply chain finance over the traditional mode of supply chain finance. (1) Under blockchain empowerment, the goods, logistics information and contracts generated in the supply chain are recorded on the chain. This method provides great convenience for the subsequent tracking and verification. (2) Under blockchain empowerment, the transactions in the supply chain are realized through blockchain without complicated manual operations, especially the application of smart contracts to achieve the automatic delivery of accounts and shipping permits. (3) With the empowerment of blockchain, the information of enterprises in the supply chain finance is able to enter into the chain, and financial institutions need not pay a review fee but only check the financing enterprises on the chain to confirm whether they are qualified for financing. At the same time, the financing enterprises on the chain do not need to pay a service fee to banks. This causes the financing enterprises on the chain to have higher capital utilization, smoother capital flow and a more flexible ordering strategy.
There have been many successful cases of supply chain finance under the empowerment of blockchain. The WeBank supply chain financial service platform uses self-developed blockchain technology as the underlying open-source platform technology, thus providing a distributed supply chain financial system design with equal and mutual trust and achieving asset flow and an analysis of the trade background of the supply chain financial service platform, which involves multiple institutions and roles participating in collaborative operations. To date, the WeBank supply chain financial service platform has processed 100,000 pieces of trade background information, with an asset processing scale of CNY 20 billion and a cumulative loan of over CNY 10 billion. Via supply chain financial services, it has penetrated into tens of thousands of enterprises, and now cover 30 provinces and 200 cities across the country. Bubi Yinuo Finance is a distributed supply chain finance network based on blockchain and other technologies. By utilizing the immutable and multiparty shared distributed ledger characteristics of blockchain, it innovatively combines blockchain technology with supply chain finance, thus transforming the credit sales behavior of traditional enterprises in the trade process into a separable, transferable, hold to maturity and financeable blockchain accounting voucher using blockchain technology. By relying on the payment credit of upstream core enterprises in the industrial chain, releasing/transmitting the credit of core enterprises, breaking information asymmetry, optimizing fund allocation and providing feasibility and convenience with regard to financing for suppliers in other links, Yinuo Finance provides more investment scenarios for financial institutions and improves the efficiency of fund flow in a fragmented economy. In the following, we will study the advantages of the two models via both theoretical modeling and numerical simulation with the help of CVaR theory.
5. Decision Model of Supply Chain Finance under the T Model
According to the definition of the CVaR utility function, let ; then, the CVaR utility function of each participant in supply chain finance can be written as follows:
In Equation (1), the first part is the proceeds of the remaining own funds after the commission is removed. The second part is the gain from the sale of all commodities. The third part is the possible loss. In Equation (2), the first part is the loan income. The second part is the possible loss after removing the guarantee. The third part is the review expense after the handling fee is charged. In Equation (3), the first part is the gain from wholesaling the goods to the retailer. The second part is the guarantee of the possible loss of value. The third part is the handling fee paid to the financial institution. The proof process is provided in Appendix A.
5.1. Optimal Decision-Making under Decentralized Decision-Making Based on CVaR
Theorem 1.
The decision of a retailer regarding the optimal order quantity in supply chain finance in the decentralized decision case under the T model satisfies the following condition:
where .
Corollary 1.
is decreasing in , and and increasing in and .
As shown in Theorem 1, there exists an optimal order quantity for the retailer. Corollary 1 shows that, with other fixed parameters, the retailer’s order quantity will increase when the wholesale price, interest rate and initial capital are each reduced in the T model. As the wholesale price decreases, the retailer is able to purchase more goods with the same amount of capital, and the order quantity increases. Similarly, as the interest rate decreases, the retailer can increase financing to order more goods, and the order quantity increases. When the retailer’s initial capital decreases, its probability of repaying the entire loan decreases, and the risk borne by the financial institution and the supplier increases, both of which increase the interest rate and wholesale price accordingly to reduce the risk. However, since the other variables are fixed and the supplier and the financial institution bear part of the risk instead of the retailer, the retailer is biased towards ordering more goods. As the retailer’s risk attitude increase, the retailer increasingly prefers risk and will be biased towards ordering more goods. In contrast, when the service fee of the financial institution increases, the retailer has less initial capital left. However, since the other parameters corresponding to a decrease in the retailer’s initial capital are fixed, the retailer is biased towards ordering more goods and the order quantity increases.
Theorem 2.
The optimal interest rate for a financial institution in supply chain finance in the decentralized decision scenario under the T model satisfies the following conditions:
where .
Since financial institutions are in a highly competitive capital market in which they can earn a risk-free rate at most, their optimal interest rate should be a return function that is equal to the risk-free profit on their loans.
Corollary 2.
is decreasing in and .
Corollary 2 suggests that when other parameters are fixed, the higher the risk attitude of the financial institution is, the lower the interest rate will be in order to allow retailers to lend more. As such, the expected profits increase. Similarly, the lower the percentage of guarantees needed by the financial institution, the more the financial institution will tend to lower the interest rate and increase lending, thus leading to an increase in the expected profits.
Due to the complexity of the model, only locally optimal solutions are given with regard to the decision of the optimal wholesale price.
Theorem 3.
Under the T model, the decision made by a manufacturer with regard to the optimal wholesale price in a decentralized decision-making supply chain satisfies the following conditions:
where , , , .
5.2. Optimal Decision-Making under Centralized Decision-Making Based on CVaR
The overall utility function of supply chain finance in the centralized decision scenario is written as follows:
In Equation (7), the first part is the revenue from goods sold by the supply chain. The second, third and fourth parts are the possible losses of each participant in the supply chain. The fourth part is the review fee.
Theorem 4.
The optimal order quantity, interest rate and wholesale price of supply chain finance in the centralized decision situation under the T model satisfy the following conditions:
Corollary 3.
increases in , and ; when , increases in .
As shown in Theorem 4, there exists an optimal order quantity for the supply chain when a centralized decision is taken. From Corollary 3, it follows that the order quantity of the whole supply chain increases when the retailer, financial institution and supplier each prefer risk in the centralized decision situation. When the supplier prefers risk over the financial institution, the supplier is more willing to provide a guarantee for the retailer. Hence, as the guarantee factor increases, the financial institution trusts the retailer more and the order quantity of the whole supply chain is elevated.
6. Decision Model of Supply Chain Finance under B Model
The CVaR utility function of each participant in supply chain finance under the B model can be expressed as follows:
Unlike under the traditional model, when blockchain technology is adopted, financial institutions no longer need to perform review via the core business and financial institutions can directly review the historical transaction data of retailers and core businesses through the blockchain. Therefore, its review cost is canceled, in addition to the handling fees that retailers and core businesses need to pay. However, the application of blockchain technology itself also generates costs. In this paper, we set the cost required to record each item produced on the chain to be . Therefore, Equations (9)–(11) increase the blockchain cost shared by the three parties. In addition, as described in Section 4, the critical ordering quantity in model B also differs. Moreover, some proofs of the theorem and inference in this section are similar to those of the previous section and will not be repeated in Appendix A.
6.1. Optimal Decision-Making under Decentralized Decision-Making Based on CVaR
Theorem 5.
The decision made by a retailer with regard to the optimal order quantity in supply chain finance in the decentralized decision case under the B model satisfies the following condition:
Corollary 4.
decreases in , , and , and increases in .
From Equation (12), we find that the optimal order quantity for retailers is related to blockchain costs and the application of blockchain technology does not affect the impact of other influencing factors on the optimal order quantity. When the cost of blockchain increases, retailers need to invest more money in blockchain technology. Clearly, this will make retailers invest less in the order quantity.
Theorem 6.
The optimal interest rate for a financial institution in supply chain finance in the decentralized decision scenario under the B model satisfies the following conditions:
where .
Corollary 5.
decreases in and and increases in .
Similar to Theorem 2, financial institutions can earn risk-free profits at most. Therefore, the return function of financial institutions under the adoption of blockchain technology is equal to the risk-free profit on their loans. That is, the interest rate of the financial institution increases as the cost of the blockchain increases. This is similar to the situation with retailers. When the cost of blockchain increases, financial institutions will need to invest more capital and will therefore raise rates to compensate for this investment.
Theorem 7.
Under the traditional supply chain finance model, the decision made by a manufacturer with regard to the optimal wholesale price in a decentralized decision-making supply chain satisfies the following conditions:
where , , , .
6.2. Optimal Decision-Making under Centralized Decision-Making Based on CVaR
The overall utility function of supply chain finance in the B model for the centralized decision scenario is as follows:
In contrast to Equation (7), when blockchain technology is adopted in supply chain finance, the review fee is substituted for the blockchain cost. However, other parameters in Equation (15) are also subject to some changes with the application of blockchain technology, such as critical order quantity.
Theorem 8.
The optimal order quantity for supply chain finance in the centralized decision situation under B model satisfies the following:
Corollary 6.
increases in , and ; when , increases in .
Manufacturers are more willing to provide SMEs with a guarantee when they are more risk-averse than financial institutions. This makes financial institutions less risky. Financial institutions are willing to lend more money to SMEs, thus leading to orders of greater volume being made.
7. Numerical Analysis
In this section, the proposed theory is verified via an arithmetic analysis, and the differences between supply chain finance under the traditional model and blockchain are further studied and compared. Assuming that the market demand obeys a normal distribution with a mean of 5000 and a standard deviation of 1500, after applying blockchain, the risk attitude of retailers, financial institutions and suppliers becomes larger; they become less risk-averse due to the weakening of information asymmetry. This article sets the relevant parameters and variables based on the previous literature as follows [14]:.
In the decentralized decision-making scenario, as shown in Figure 3, there is an optimal order quantity that maximizes the retailer’s profit in the T mode and B mode, this is consistent with Theorems 1 and 5. Retailers have an optimal order quantity in both the T and B modes. It is worthwhile to note that the optimal order quantity and profit in the B mode are greater than the optimal order quantity and profit in the T mode. By adopting blockchain technology, the information asymmetry decreases and the risk attitude of each participant increases; therefore, the optimal order quantity increases and the revenue increases. As shown in Figure 4, the optimal order quantity increases with the increase in the retailer’s attitude to risk in both the B and T modes, which is consistent with Corollaries 1 and 5. When the risk attitude of retailers increases, they are more willing to take risks and purchase more goods; therefore, their order quantity will increase as the risk attitude of retailers increases. This is in line with reality. As shown in Figure 5, Figure 6 and Figure 7, the order quantity decreases with the increase in the initial capital, interest rate and wholesale price in both the T and B models, which is consistent with Corollaries 1 and 4. The higher the interest rate, the more the retailer needs to pay back the loan; in addition, the retailer will choose to reduce the order quantity to reduce the loan. In contrast, the decrease in initial capital and the rise in order quantity means that the retailer needs to take out more loans to buy goods because the other parameters are fixed and the initial capital is reduced. While the other parameters are fixed, the financial institutions and suppliers take part in the risk instead of the retailer, and their order quantity will rise accordingly. The increase in wholesale price means that the retailer needs to borrow more to order the same amount of goods; thus, the retailer will order less and thus borrow less. As shown in Figure 8, the application of blockchain technology eliminates the service fee. However, since blockchain itself has a cost and each transaction generated will incur a cost, the higher its cost is, the heavier the burden on the retailer. In addition, when the cost rises, the retailer’s order quantity will decrease to reduce the cost. From these figures, we can determine that, when blockchain technology is used, the retailer’s corresponding optimal order quantity and profit are slightly higher than that in the traditional model. The use of blockchain technology allows retailers to reduce the information asymmetry present in other parts of the supply chain and eliminates margins, thus allowing retailers to order more goods. The support of blockchain technology also allows retailers to gain a better grasp of market demand; thus, they can order more goods to sell and gain more profit. In addition, because the service fees to be paid by retailers and suppliers under traditional supply chain finance and the service fees required for financial institutions to review supply chain members are replaced by the cost of blockchain, leading to a reduction in various review and credit costs in the supply chain, the efficiency of capital flow in the supply chain is improved and the benign development of the supply chain is promoted.
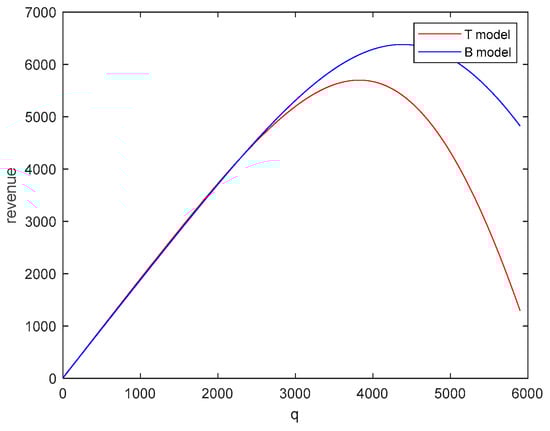
Figure 3.
Order quantity revenue function chart under T model and B model.
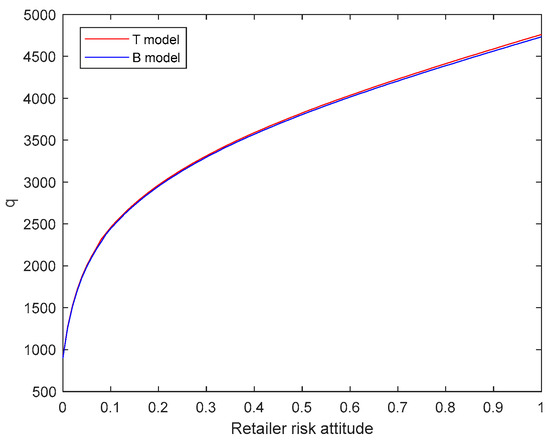
Figure 4.
Retailer risk attitude order quantity function chart under T model and B model.
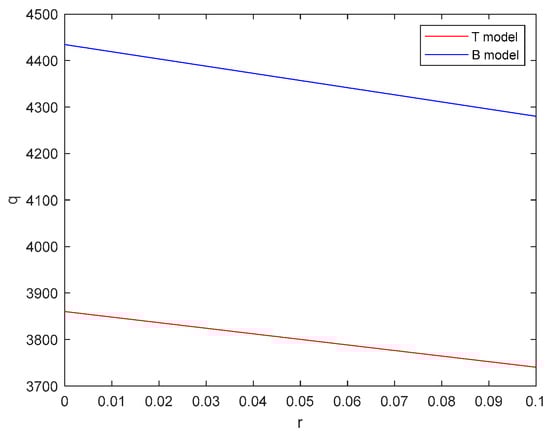
Figure 5.
Interest rate order quantity function chart under T model and B model.
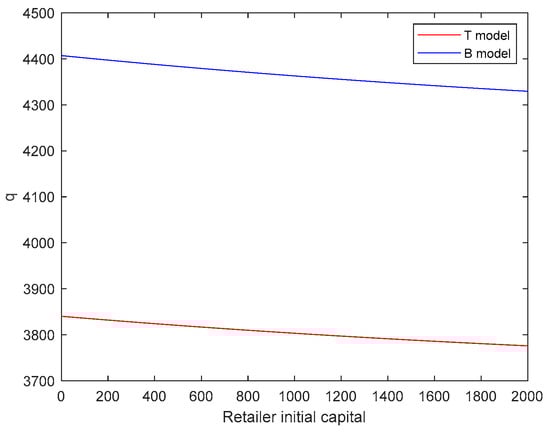
Figure 6.
Retailer initial capital order quantity function chart under T model and B model.
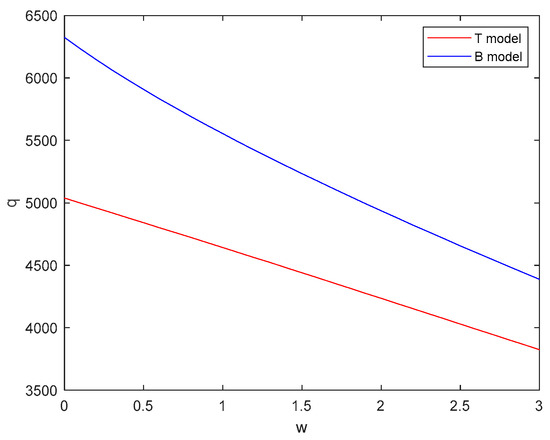
Figure 7.
Wholesale price order quantity function chart under T model and B model.
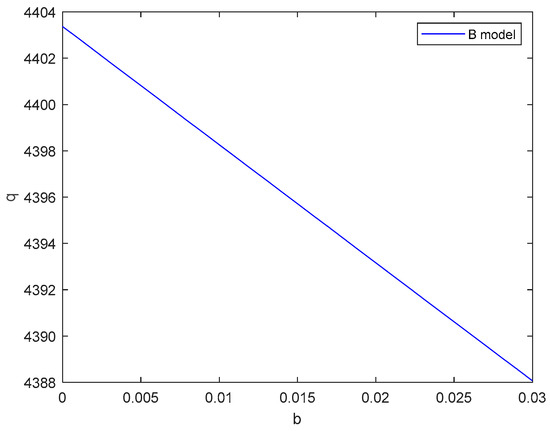
Figure 8.
Blockchain cost order quantity function chart under B model.
As shown in Figure 9, in the decentralized decision scenario, an increase in the risk attitude of financial institutions will make them more risk-biased and cause them to lower the financing rate to attract SME financing. As shown in Figure 10, in both the T and B models, the interest rate of the financial institution decreases when the guarantee factor of the supplier increases. The more the supplier guarantee factor increases, the less risk the financial institution has to take when the retailer is unable to repay the loan; then, the financial institution reduces the interest rate to encourage the retailer to increase financing. As shown in Figure 11, in the B model, as the cost incurred by adopting blockchain rises, financial institutions increase their interest rates to cope with the rising cost, in line with Corollaries 2 and 5. Similar to the case of retailers, when blockchain technology is adopted, financial institutions are able to access the history of transactions in the supply chain. Real historical data can reduce the risk of this loan; thus, the financial institution is more willing to lend and will increase the amount of the loan, thus gaining more benefits.
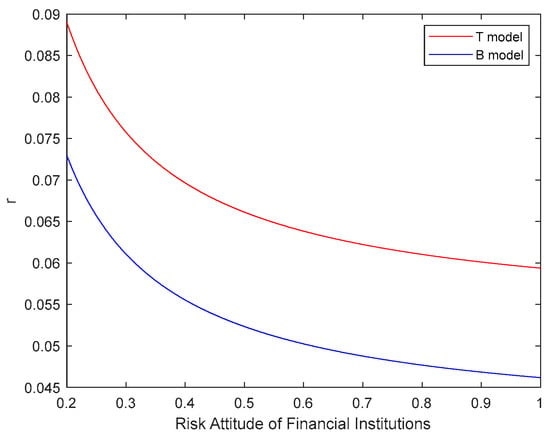
Figure 9.
Risk Attitude of Financial Institutions Interest Rate function Chart under T model and B model.
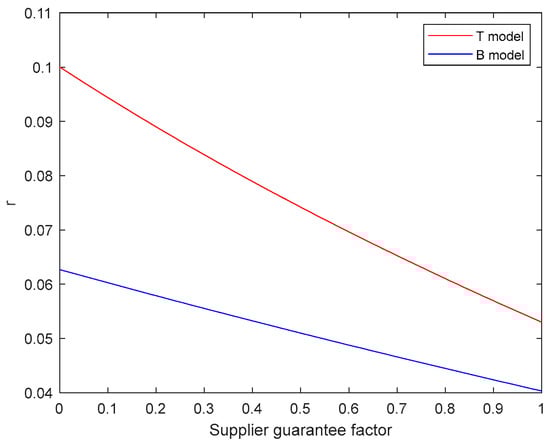
Figure 10.
Supplier guarantee factor interest rate function chart under T model and B model.
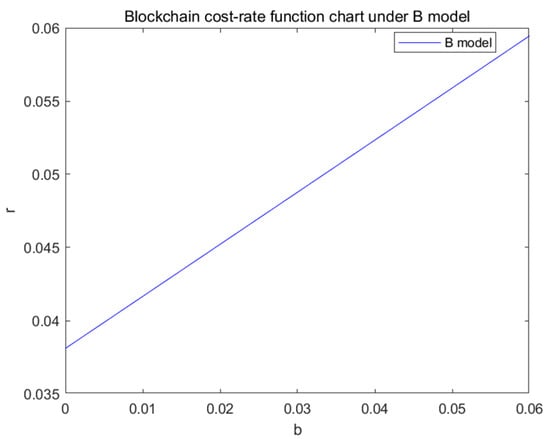
Figure 11.
Blockchain cost-rate function chart under B model.
As shown in Figure 12 compared to Figure 3, in the case of centralized decision-making, the optimal order quantity is higher under centralized decision-making compared to decentralized decision-making. When blockchain is applied, the optimal order quantity under centralized decision-making in the supply chain is greater than the optimal order quantity under decentralized decision-making. As a result, the benefit of the supply chain as a whole under blockchain empowerment is greater than the benefit of the supply chain as a whole under decentralized decision-making. In the traditional model, centralized decision-making offsets the service fee and review fees; in decentralized decision-making, the three parties in the supply chain make the decision together. Therefore, the optimal order quantity is higher in centralized decision-making than in decentralized decision-making. However, even with centralized decision-making, there is still the problem of information asymmetry among the three parties. After adopting blockchain technology, the problem of information asymmetry is solved, the order quantity is higher and, naturally, the revenue will be increased. At the same time, due to the application of blockchain technology, supply chain subjects are more risk-oriented. As shown in Figure 13, Figure 14 and Figure 15, when the risk attitude of all three increases, they all promote an increase in the overall volume of orders in the supply chain, which increases the overall profit of the supply chain. Under decentralized decision-making, each party in the supply chain pursues the maximization of its own profit, and the order quantity of followers is largely influenced by the leader; meanwhile, under centralized decision-making, the supply chain pursues the maximization of the overall benefit, and the order quantity is jointly decided by multiple parties, which can better achieve a “win–win” outcome. As shown in Figure 16, under the centralized decision, the guarantee factor of suppliers increases, and the overall order quantity of the supply chain increases. Under the centralized decision, the order quantity is jointly decided by multiple parties, and the larger the guarantee factor of suppliers, the more credit is guaranteed for retailers and the more financing financial institutions are willing to provide in cooperation. However, since the decision is centralized, the impact of the guarantee factor is smaller. This is because when the supply chain takes centralized decision-making, the supply chain pursues the maximization of the overall benefit, and the losses are calculated as the losses of the supply chain. As shown in Figure 17, when the blockchain costs more, it takes up more money. Then, the overall order quantity of the supply chain at the time of decision-making drops to compensate for the cost of blockchain. Therefore, while there are many benefits that come with blockchain technology, if the cost is too high, then the benefits that it can bring will make the supply chain cease to use it.
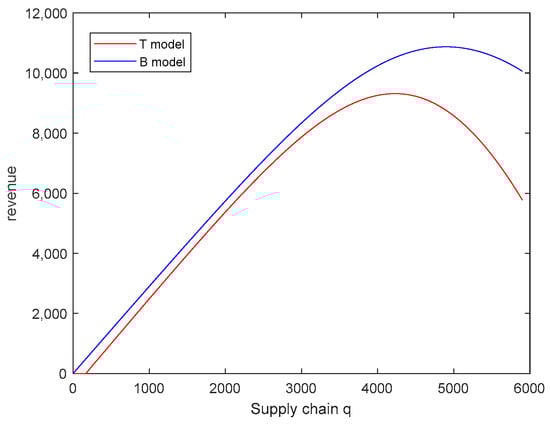
Figure 12.
Supply chain order quantity revenue function chart under T model and B model.
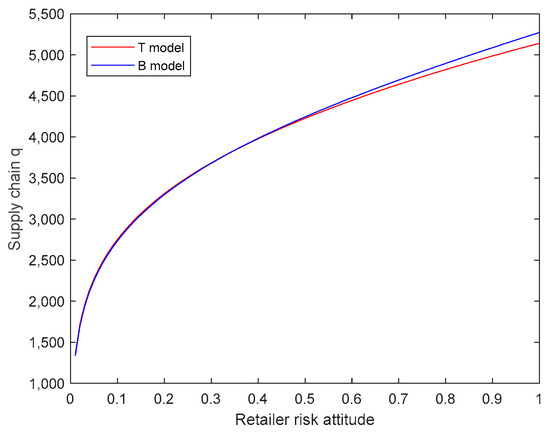
Figure 13.
Retailer risk attitude order quantity function chart under centralized decision-making under T model and B model.
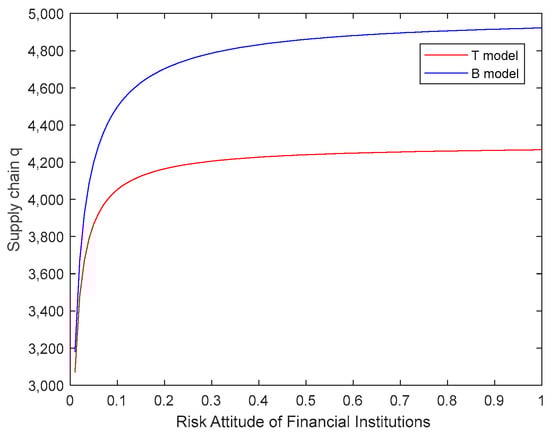
Figure 14.
Risk Attitude of Financial Institutions’ order quantity function chart under centralized decision-making under T model and B model.
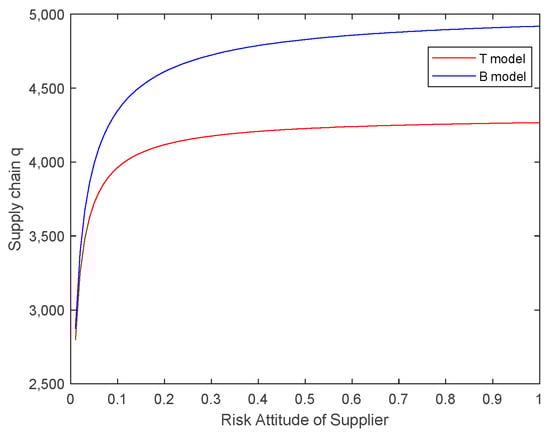
Figure 15.
Risk Attitude of Supplier order quantity function chart under centralized decision-making under T model and B model.
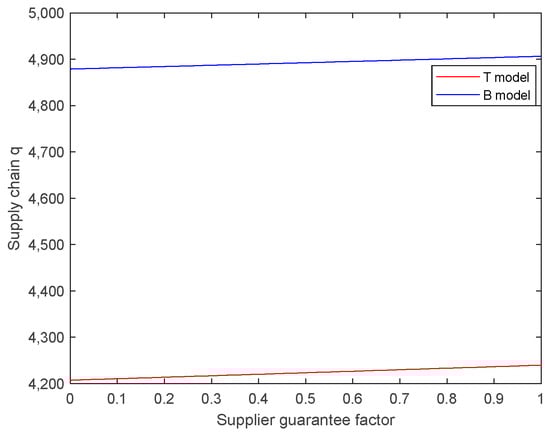
Figure 16.
Supplier guarantee factor order quantity function chart under centralized decision-making under T model and B model.
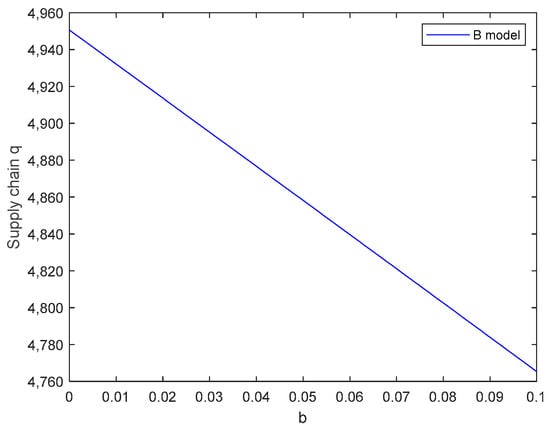
Figure 17.
Blockchain cost order quantity function chart under centralized decision-making under T model and B model.
8. Conclusions
In this paper, the optimal decision-making problem of each participant in supply chain finance after adding blockchain technology is investigated with a secondary supply chain consisting of a retailer, a financial institution and a supplier, taking the blockchain cost into account. The risk measure of CVaR is used to characterize the decision-making of the three participants in the supply chain. The optimal decisions of the three parties in the traditional mode and the blockchain mode are obtained by the Stackelberg game model, respectively, and validated in the simulation analysis. Theoretically, it provides some suggestions and references that enable the enterprises in the supply chain to solve the problem of difficult financing.
This study finds that, when blockchain is used, the benefits conferred to each participant in the chain are increased. In addition, centralized decision-making, which is more optimal in the traditional model, also shows its better side under blockchain. When centralized decision-making is adopted, the participants in the supply chain experience a reduction in their external consumption of funds and become internally mobile instead. In addition, the use of blockchain technology can help to increase internal trust and deepen cooperation. It increases the upper limit of decision-making and helps the supply chain to grow rapidly. Furthermore, under decentralized decision-making, each participant pursues its own profit. However, in the traditional model, there is a high level of information asymmetry, which leads to many extra costs for vetting and assurance during the collaboration. When blockchain is adopted, the degree of information asymmetry between the parties decreases and it eliminates service fees and review fees, thus increasing the efficiency of capital flow in the supply chain. At the same time, the appetite for risk of each participant increases, meaning that they are more willing to take risks and thus earn more profits. This can facilitate the expansion and development of the supply chain.
This paper models and analyzes the optimal decision-making of each participant in supply chain finance after adopting blockchain technology. At the same time, this paper focuses on the setting of the blockchain cost in the construction of the model to make the model more comprehensive and reasonable. It can be seen through the conclusion of the paper that the application of blockchain technology can not only reduce the expenditure of redundant costs (such as margin, review fees, etc.) and improve the efficiency of the flow of funds in the supply chain, but also improve the benefits to all parties and promote the development of the supply chain. Therefore, when enterprises in supply chain finance encounter problems such as complicated fees which cause excessive capital occupation and inefficiency, blockchain technology can be used to solve such problems. If the cost of blockchain technology can be reduced, then blockchain technology will be more widely used in supply chain finance.
Although this paper makes some significant contributions, it has limitations. In this paper, in the modeling analysis, the cost of blockchain is simplified by setting it as a parameter. However, the cost of blockchain should have a more complex form, and it should vary with the scale of use of blockchain technology, diffusion and other parameters. In addition, this paper has not considered the likelihood of SMEs being able to make repayments. In practice, SMEs are subject to moral hazard, even to the extent of colluding with the core business to cheat the bank’s loan. These are to be studied in subsequent research.
In summary, this paper models and provides insights regarding the application of blockchain technology in supply chain finance. This provides some suggestions for companies in the supply chain with regard to solving the problem of financing difficulties.
Author Contributions
Conceptualization, S.M.; methodology, S.M. and J.C.; software, J.C. and X.G.; validation, S.M., J.C. and G.W.; formal analysis, J.C.; investigation, Y.T. and J.C.; resources, S.M. and G.W.; data curation, J.C. and Y.T.; writing—original draft preparation, J.C.; writing—review and editing, S.M. and H.J.; visualization, G.W.; supervision, G.W.; project administration, S.M.; funding acquisition, S.M. All authors have read and agreed to the published version of the manuscript.
Funding
This research has been funded by the National Social Science Foundation of China grant number [No. 20BGL009].
Data Availability Statement
The data that support the findings of this study are available from the corresponding author upon reasonable request.
Acknowledgments
The comments and suggestions of an anonymous referee were very helpful in improving the paper and all individuals included in this section have consented to the acknowledgement.
Conflicts of Interest
The authors declare no conflicts of interest.
Appendix A
Proof of Theorem 1.
Let .
Find the first-order partial derivative of the order quantity :
Find the second-order partial derivative of the order quantity :
Since the distribution function satisfies the IGFR property, we can obtain the following:
then we have:
That is, the first-order derivative is a monotonically decreasing function, the original function is a convex function and the retailer’s profit function has a unique maximum value. Therefore, the retailer’s order quantity has an optimal value.
Letting yields the following:
□
Proof of Corollary 1.
The derivation of Equation (1) with respect to the wholesale price w yields the following:
Since the distribution function satisfies the IGFR property, and are both increasing functions; thus, we obtain .
Then, there are the following:
That is, the order quantity decreases as the wholesale price increases.
The derivation of Equation (1) with respect to the interest rate yields the following:
Similarly, we have the following:
That is, the order quantity decreases as the interest rate increases.
The derivation of Equation (1) with respect to the initial capital , the service fee and the risk aversion yields the following:
That is, the order quantity decreases as the initial capital increases and increases as the service fee and the risk aversion increase, respectively. □
Proof of Corollary 2.
The derivation of the profit function of the financial institution with respect to the risk attitude of the financial institution yields the following:
It is clear that the right-hand side of the Equation (2) increases in a similar monotonical manner with respect to :
As a result, . Then we have . □
Proof of Theorem 4.
The utility function under centralized decision-making finds the first order partial derivatives, as follows:
The second-order partial derivative is obtained by further deriving it as follows:
That is, the first-order derivative is a monotonically decreasing function. The original function is a convex function. Therefore, the profit function of the supply chain under the centralized decision exists as a unique maximum, which can be obtained with the optimal order quantity under the centralized decision as follows:
□
Proof of Corollary 3.
Derive Equation (4) with respect to , and as follows:
Since the distribution function satisfies the IGFR property, we obtain the following:
This leads to ; then, increases in , and .
The derivative of Equation (4) is written as follows:
When , we have , so is increasing in . □
Proof of Corollary 4.
The derivation of Equation (1) with respect to the wholesale price w yields the following:
Since the distribution function satisfies the IGFR property, we obtain the following:
That is, the first-order derivative is a monotonically decreasing function. The original function is a convex function. Therefore, the profit function of the supply chain under the centralized decision exists as a unique maximum, which can be obtained with the optimal order quantity under the centralized decision as follows:
□
Proof of Corollary 5.
Derive the partial derivative of the profit function of the financial institution with respect to the blockchain cost as follows:
From Equation (2), the right-hand side of the equation decreases in a monotonical manner with respect to the same:
From the above, that the following is obtained: . Hence, we have . □
References
- Xu, X.; Chen, X.; Jia, F.; Brown, S.; Gong, Y.; Xu, Y. Supply chain finance: A systematic literature review and bibliometric analysis. Int. J. Prod. Econ. 2018, 204, 160–173. [Google Scholar] [CrossRef]
- Song, H.; Chen, S.J. Development of Supply Chain Finance and Internet Supply Chain Finance: A Theoretical Framework. J. Renmin Univ. China 2016, 30, 95–104. [Google Scholar]
- Qiao, R.; Zhao, L. Highlight risk management in supply chain finance: Effects of supply chain risk management capabilities on financing performance of small-medium enterprises. Supply Chain Manag. 2023, 28, 843–858. [Google Scholar] [CrossRef]
- Li, Y.; Stasinakis, C.; Yeo, W.M. A Hybrid XGBoost-MLP Model for Credit Risk Assessment on Digital Supply Chain Finance. Forecasting 2022, 4, 184–207. [Google Scholar] [CrossRef]
- Rockafellar, R.T.; Uryasev, S. Conditional value-at-risk for general loss distributions. J. Bank. Financ. 2022, 26, 1443. [Google Scholar] [CrossRef]
- Fabozzi, F.J.; Huang, D.; Zhou, G. Robust portfolios: Contributions from operations research and finance. Ann. Oper. Res. 2010, 176, 191–220. [Google Scholar] [CrossRef]
- Artzner, P.; Delbaen, F.; Eber, J.-M.; Heath, D. Coherent Measures of Risk. Math. Financ. 1999, 9, 203. [Google Scholar] [CrossRef]
- Adame, V.; Fernando, F.; Simon, S. Portfolios in the ibex 35 beforeand after the global financial crisis. Appl. Econ. 2016, 48, 3826–3847. [Google Scholar] [CrossRef]
- Chen, Y.; Xu, M.; Zhang, Z. A risk-averse newsvendor model under the CVaR criterion. Oper. Res. 2009, 57, 1040–1044. [Google Scholar] [CrossRef]
- Esmaeili-Najafabadi, E.; Azad, N.; Saber Fallah Nezhad, M. Risk-averse supplier selection and order allocation in the centralized supply chains under disruption risks. Expert Syst. Appl. 2021, 175, 114691. [Google Scholar] [CrossRef]
- Han, S.; Xu, X. NEV supply chain coordination and sustainability considering sales effort and risk aversion under the CVaR criterion. PLoS ONE 2018, 13, e0199005. [Google Scholar] [CrossRef]
- Jena, S.K.; Padhi, S.S.; Cheng, T.C.E. Optimal selection of supply chain financing programmes for a financially distressed manufacturer. Eur. J. Oper. Res. 2023, 306, 457–477. [Google Scholar] [CrossRef]
- Liu, L.; Li, Y.J.; Xue, K.L. Conflict of financing choice and variable parameter risk sharing mechanism. Syst. Eng.-Theory Pract. 2021, 41, 649–666. [Google Scholar]
- Li, Y.; Liu, L.; Feng, L.; Wang, W.; Xu, F. Optimal Financing Models Offered by Manufacturers with Risk Aversion and Market Competition Considerations. Decis. Sci. 2020, 51, 1411–1454. [Google Scholar] [CrossRef]
- Gelsomino, L.M.; Sardesai, S.; Pirttilä, M.; Henke, M. Addressing the relation between transparency and supply chain finance schemes. Int. J. Prod. Res. 2023, 61, 5806–5821. [Google Scholar] [CrossRef]
- Marak, Z.R.; Pillai, D. Supply Chain Finance Factors: An Interpretive Structural Modeling Approach. Cent. Eur. Manag. J. 2021, 29, 88–111. [Google Scholar] [CrossRef]
- Choi, S.; Ruszczyński, A. A risk-averse newsvendor with law invariant coherent measures of risk. Oper. Res. Lett. 2008, 36, 77–82. [Google Scholar] [CrossRef]
- Cheng, L.; Wan, Z.; Wang, G. Bilevel newsvendor models considering retailer with CVaR objective. Comput. Ind. Eng. 2009, 57, 310–318. [Google Scholar] [CrossRef]
- Choi, S.; Ruszczyński, A.; Zhao, Y. A Multiproduct Risk-Averse Newsvendor with Law-Invariant Coherent Measures of Risk. Oper. Res. 2011, 59, 346–364. [Google Scholar] [CrossRef]
- Xinsheng, X.; Zhiqing, M.; Rui, S.; Min, J.; Ping, J. Optimal decisions for the loss-averse newsvendor problem under CVaR. Int. J. Prod. Econ. 2015, 164, 146–159. [Google Scholar] [CrossRef]
- Chen, J.; Zhang, T.; Zhou, Y. Dynamics of a risk-averse newsvendor model with continuous-time delay in supply chain financing. Math. Comput. Simul. 2020, 169, 133–148. [Google Scholar] [CrossRef]
- Tian, B.; Lu, Y.; Yu, L.; Chang, X. Optimal financing strategies for a risk-averse supplier under the CVaR criterion in a capital-constrained supply chain. J. Oper. Res. Soc. 2023, 1–19. [Google Scholar] [CrossRef]
- Wu, Y.; Wang, Z.; Zhou, X.; Yao, J. The optimisation research of Blockchain application in the financial institution-dominated supply chain finance system. Int. J. Prod. Res. 2022, 61, 3735–3755. [Google Scholar] [CrossRef]
- Bhatia, M.S.; Chaudhuri, A.; Kayikci, Y.; Treiblmaier, H. Implementation of blockchain-enabled supply chain finance solutions in the agricultural commodity supply chain: A transaction cost economics perspective. Prod. Plan. Control 2023, 1–15. [Google Scholar] [CrossRef]
- Rijanto, A. Blockchain Technology Adoption in Supply Chain Finance. J. Theor. Appl. Electron. Commer. Res. 2021, 16, 3078–3098. [Google Scholar] [CrossRef]
- Xiao, P.; Salleh, M.I.B.; Cheng, J. Research on Factors Affecting SMEs’ Credit Risk Based on Blockchain-Driven Supply Chain Finance. Information 2022, 13, 455. [Google Scholar] [CrossRef]
- Sun, R.; He, D.; Su, H. Evolutionary Game Analysis of Blockchain Technology Preventing Supply Chain Financial Risks. J. Theor. Appl. Electron. Commer. Res. 2021, 16, 2824–2842. [Google Scholar] [CrossRef]
- Choi, T.-M. Supply chain financing using blockchain: Impacts on supply chains selling fashionable products. Ann. Oper. Res. 2020, 331, 393–415. [Google Scholar] [CrossRef]
- Su, L.; Cao, Y.; Li, H.; Tan, J. Blockchain-Driven Optimal Strategies for Supply Chain Finance Based on a Tripartite Game Model. J. Theor. Appl. Electron. Commer. Res. 2022, 17, 1320–1335. [Google Scholar] [CrossRef]
- Luo, Y.; Tang, Y. Comparative Research on the Game Behavior of the Participants in the Traditional Supply Chain Finance and the Supply Chain Finance on the Blockchain. Discret. Dyn. Nat. Soc. 2022, 2022, 6706437. [Google Scholar] [CrossRef]
- Liu, L.; Li, Y.J.; Jiang, T. Supply chain financing strategy based on blockchain credit transfer function. Syst. Eng.-Theory Pract. 2021, 41, 1179–1196. [Google Scholar]
- Liu, L.; Li, Y.; Jiang, T. Optimal strategies for financing a three-level supply chain through blockchain platform finance. Int. J. Prod. Res. 2023, 61, 3564–3581. [Google Scholar] [CrossRef]
- Deng, L.; Li, Y.; Wang, S.; Luo, J. The impact of blockchain on optimal incentive contracts for online supply chain finance. Environ. Sci. Pollut. Res. Int. 2023, 30, 12466–12494. [Google Scholar] [CrossRef] [PubMed]
- Asante Boakye, E.; Zhao, H.; Coffie, C.P.K.; Asare-Kyire, L. Seizing technological advancement; determinants of blockchain supply chain finance adoption in Ghanaian SMEs. Technol. Anal. Strateg. Manag. 2023, 1–17. [Google Scholar] [CrossRef]
- Xu, L.; Yang, Y.; Chu, X. Research on the Influence Mechanism of Block Chain on the Credit of Transportation Capacity Supply Chain Finance. Math. Probl. Eng. 2021, 2021, 1812096. [Google Scholar] [CrossRef]
- Gao, Z. Application of Internet of Things and Block-chain Technology in Improving Supply Chain Financial Risk Management System. IETE J. Res. 2023, 69, 6878–6887. [Google Scholar] [CrossRef]
- Ge, X.; Ma, S.; Wang, G.; Teng, Y.; Qian, Q.; Jiang, H. Research on decision analysis with CVaR for supply chain finance based on partial credit guarantee and blockchain technology. Manag. Decis. Econ. 2023; early view. [Google Scholar] [CrossRef]
- Jiang, R.; Kang, Y.; Liu, Y.; Liang, Z.; Duan, Y.; Sun, Y.; Liu, J. A trust transitivity model of small and medium-sized manufacturing enterprises under blockchain-based supply chain finance. Int. J. Prod. Econ. 2022, 247, 108469. [Google Scholar] [CrossRef]
Disclaimer/Publisher’s Note: The statements, opinions and data contained in all publications are solely those of the individual author(s) and contributor(s) and not of MDPI and/or the editor(s). MDPI and/or the editor(s) disclaim responsibility for any injury to people or property resulting from any ideas, methods, instructions or products referred to in the content. |
© 2024 by the authors. Licensee MDPI, Basel, Switzerland. This article is an open access article distributed under the terms and conditions of the Creative Commons Attribution (CC BY) license (https://creativecommons.org/licenses/by/4.0/).