1. Introduction
In contrast to forming processes [
1,
2,
3], where the purpose is to deform plastically the metal without fracture, metal cutting processes lead to the total rupture of the workpiece [
4,
5]. Different experimental and numerical analyses were carried out in order to determine optimal manufacturing parameters. The optimization of these manufacturing processes, like additive manufacturing [
6,
7], machining and blanking [
8,
9,
10], and other processes [
11,
12], has a significant impact on the quality of products. These studies focus on the influence of input manufacturing parameters principally on the geometric aspects and on the maximum force that causes total failure of workpieces. Metal cutting is an essential operation such as blanking and machining that precedes many metal working processes. The precision of the workpiece geometry sample is usually important for the final product results.
The blanking process is considered as one of the most-used methods in manufacturing [
13]. The present work investigates the effect of cutting parameters on the sheet blanking process using numerical and experimental studies. The blanking process is based on the applied pressure of the punch and the die on the sheet metal. Currently, the right blanking parameters for a new product are determined empirically by carrying out many experimental tests. Despite the growth of blanking technology in terms of cutting methods and tools design, there is still a lack of optimal models of blanking processes. A complex stress distribution is reached on a blanking operation.
On the numerical scale, steel sheet finite element analysis was conducted to explore ductile failure mechanisms in the fine-blanking process [
14]. This involved using a modified GTN model [
15] that integrates Lemaitre’s damage mechanics approach [
16] with the Gurson void damage model [
17]. A metallographic analysis was carried out to understand the evolution of damage. This involved analyzing the fracture propagation, with numerical findings aligning well with the experimental results from the fine-blanking process. The study emphasizes the significance of investigating process parameters like clearance, die, and punch diameters. In the same context, various finite element approaches have emerged to simulate the blanking process [
18,
19], differing primarily in their methods for modeling material failure. Both mechanical and thermomechanical numerical models have been developed. The thermal term in plasticity and damage models is recommended based on experimental and numerical tests for simulating bar blanking. However, the efficacy of the mechanical model in computing blanking operations remains a point of consideration.
In another context, experimental investigations were conducted, aiming to analyze the effects of clearance, friction, and cutting parameters on the resulting geometrical quality of the product, as well as the formation and growth of burrs along the sheet edge [
20,
21]. Some researchers are directing their attention toward studying how various blanking parameters specifically affect the wear and tear of the punch used in the process [
22,
23]. Actually, the extent of tool wear is contingent upon factors such as the specific clearance value employed, the material constituting the punch, and the hardness of the blank pieces being processed [
24,
25]. Further investigations [
26,
27] indicate that the size of the burr depends on several factors, including the tool edge’s wear condition, the clearance employed in blanking, and the inherent properties of the materials used in the process. These studies have substantiated that wear facilitates the presence of burrs, and the clearance setting significantly influences both the fracture angle within the sheet metal’s shear zone and the resultant burr height. Therefore, it becomes imperative to determine experimentally the size of the burrs on the sheet pieces. Evaluating the quality of the products is intricately tied to estimating the acceptable level of burr on these parts.
Furthermore, Johnson–Cook plasticity and damage models [
28,
29] are extensively employed as numerical tools to simulate material behavior and failure during blanking processes. These models primarily aim to assess a material’s ability to withstand deformation until reaching failure points. However, most of the literature overlooks the strain rate dependency during blanking processes. However, as the blanking speed increases, there is a noticeable deviation between the numerical predictions and the experimental results [
30]. This could be attributed to thermal softening and variations in material parameters, which were determined through conducting various tensile tests with varying strain rates.
This study aims to evaluate the predictive capabilities of Johnson–Cook plasticity and cumulative-damage fracture models, which express the strain to fracture as a function of strain rate, in capturing the behavior of sheet material during the blanking process. Numerical simulations are conducted based on a rate-dependent elasto-plastic constitutive model combined with a fracture criterion to predict the maximum blanking force and blanking burr dimensions. The Johnson–Cook parameters are determined from experimental tensile tests conducted at different strain rates. The accuracy of the developed model is validated through experimental studies. A comparison between the numerical and experimental results of sheet blanking tests confirms that incorporating modified Johnson–Cook models accounting for the strain rate term is essential for accurately predicting the behavior and damage of S235 sheet steel during blanking operations.
2. Experiments and Methods
The adopted material for this experimental study is S235 steel. The chemical composition of the studied material is presented in
Table 1.
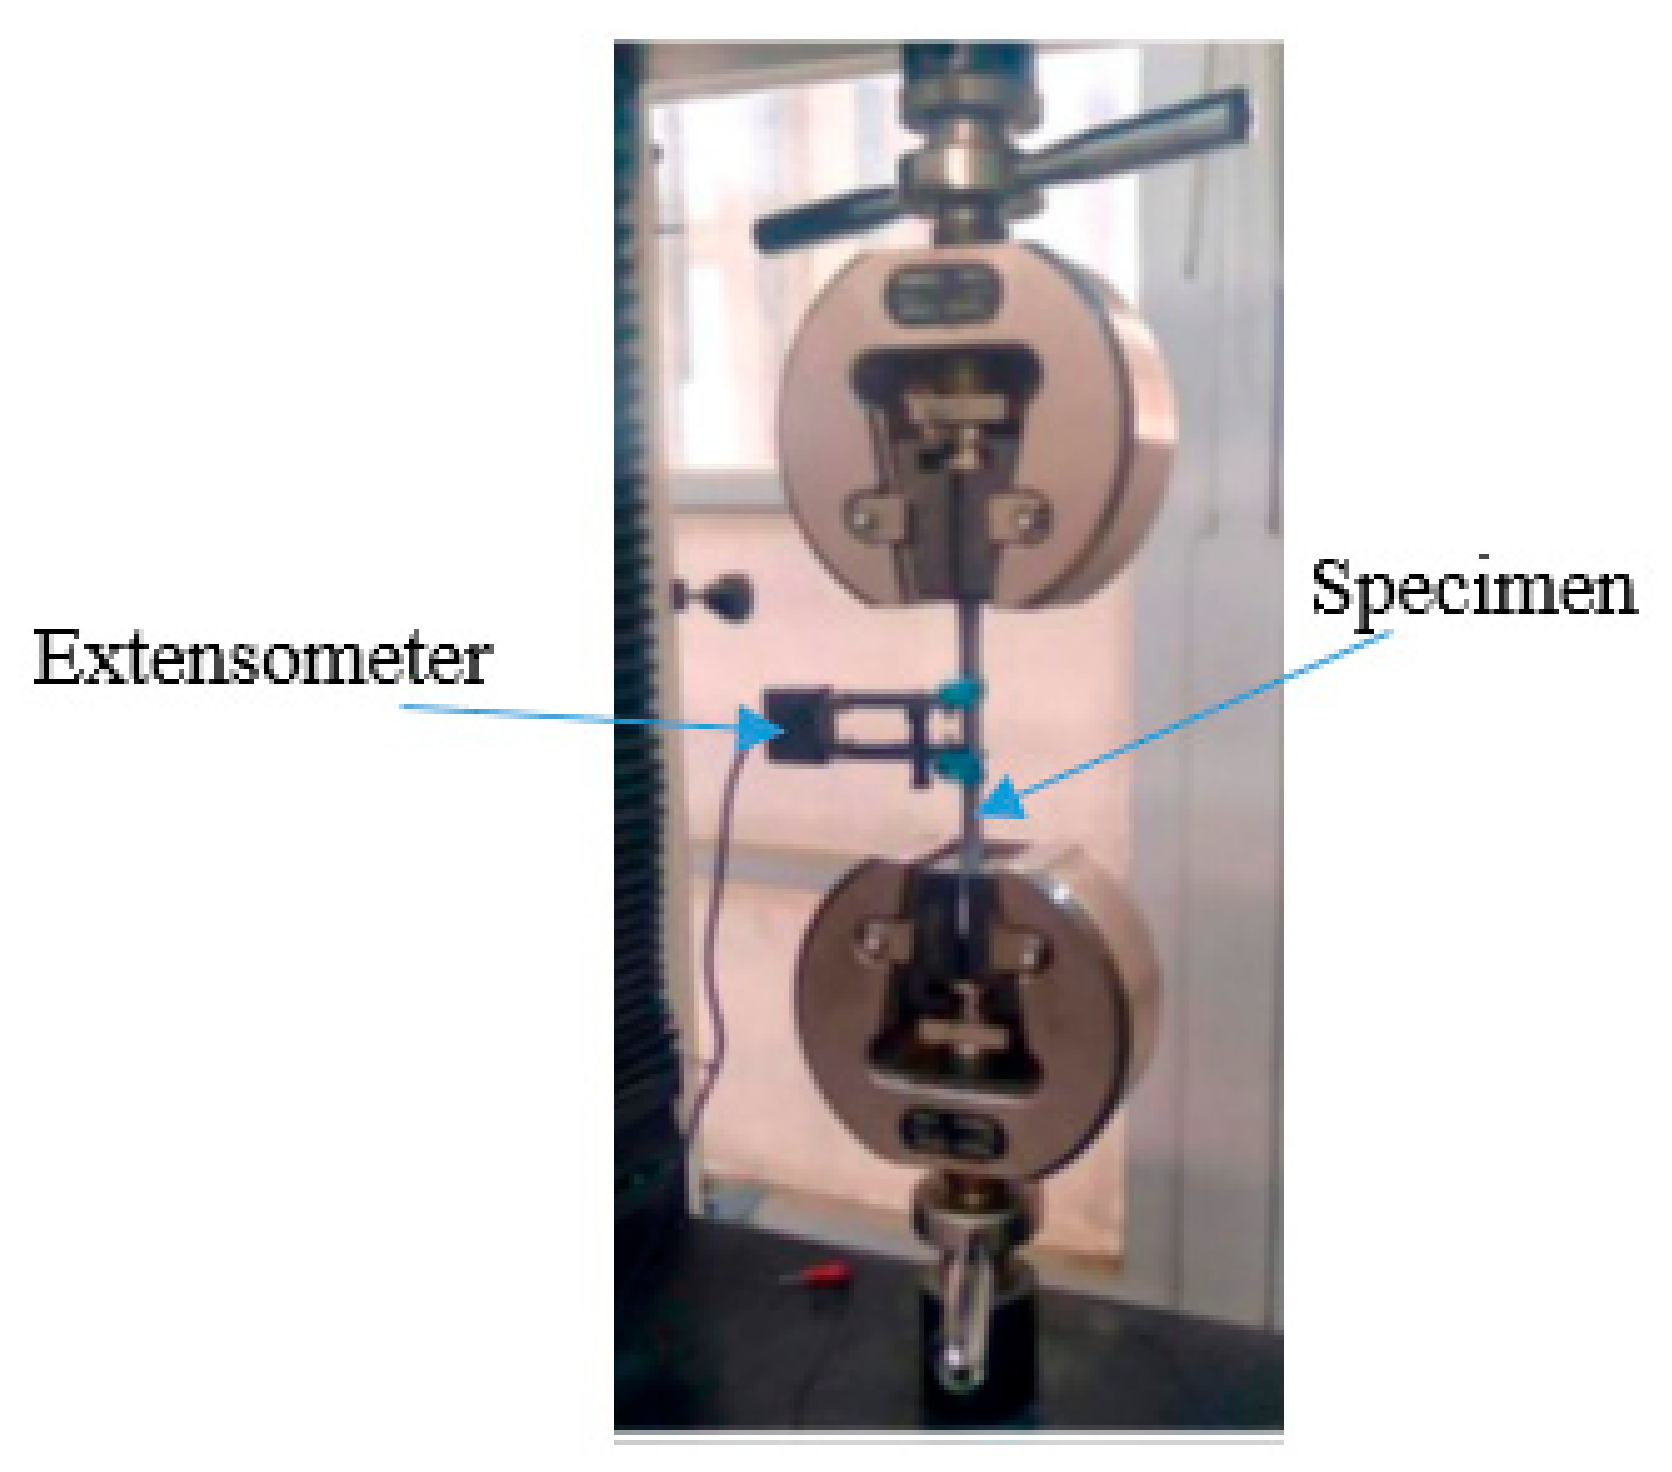
Initially, stress–strain curves are experimentally acquired to determine the mechanical characteristics and response of the sheet metal under tensile loading. The samples are subjected to a uniaxial tensile test until reaching failure at ambient temperature, as illustrated in
Figure 1. An extensometer is used in tensile testing to provide direct strain measurements on the specimen.
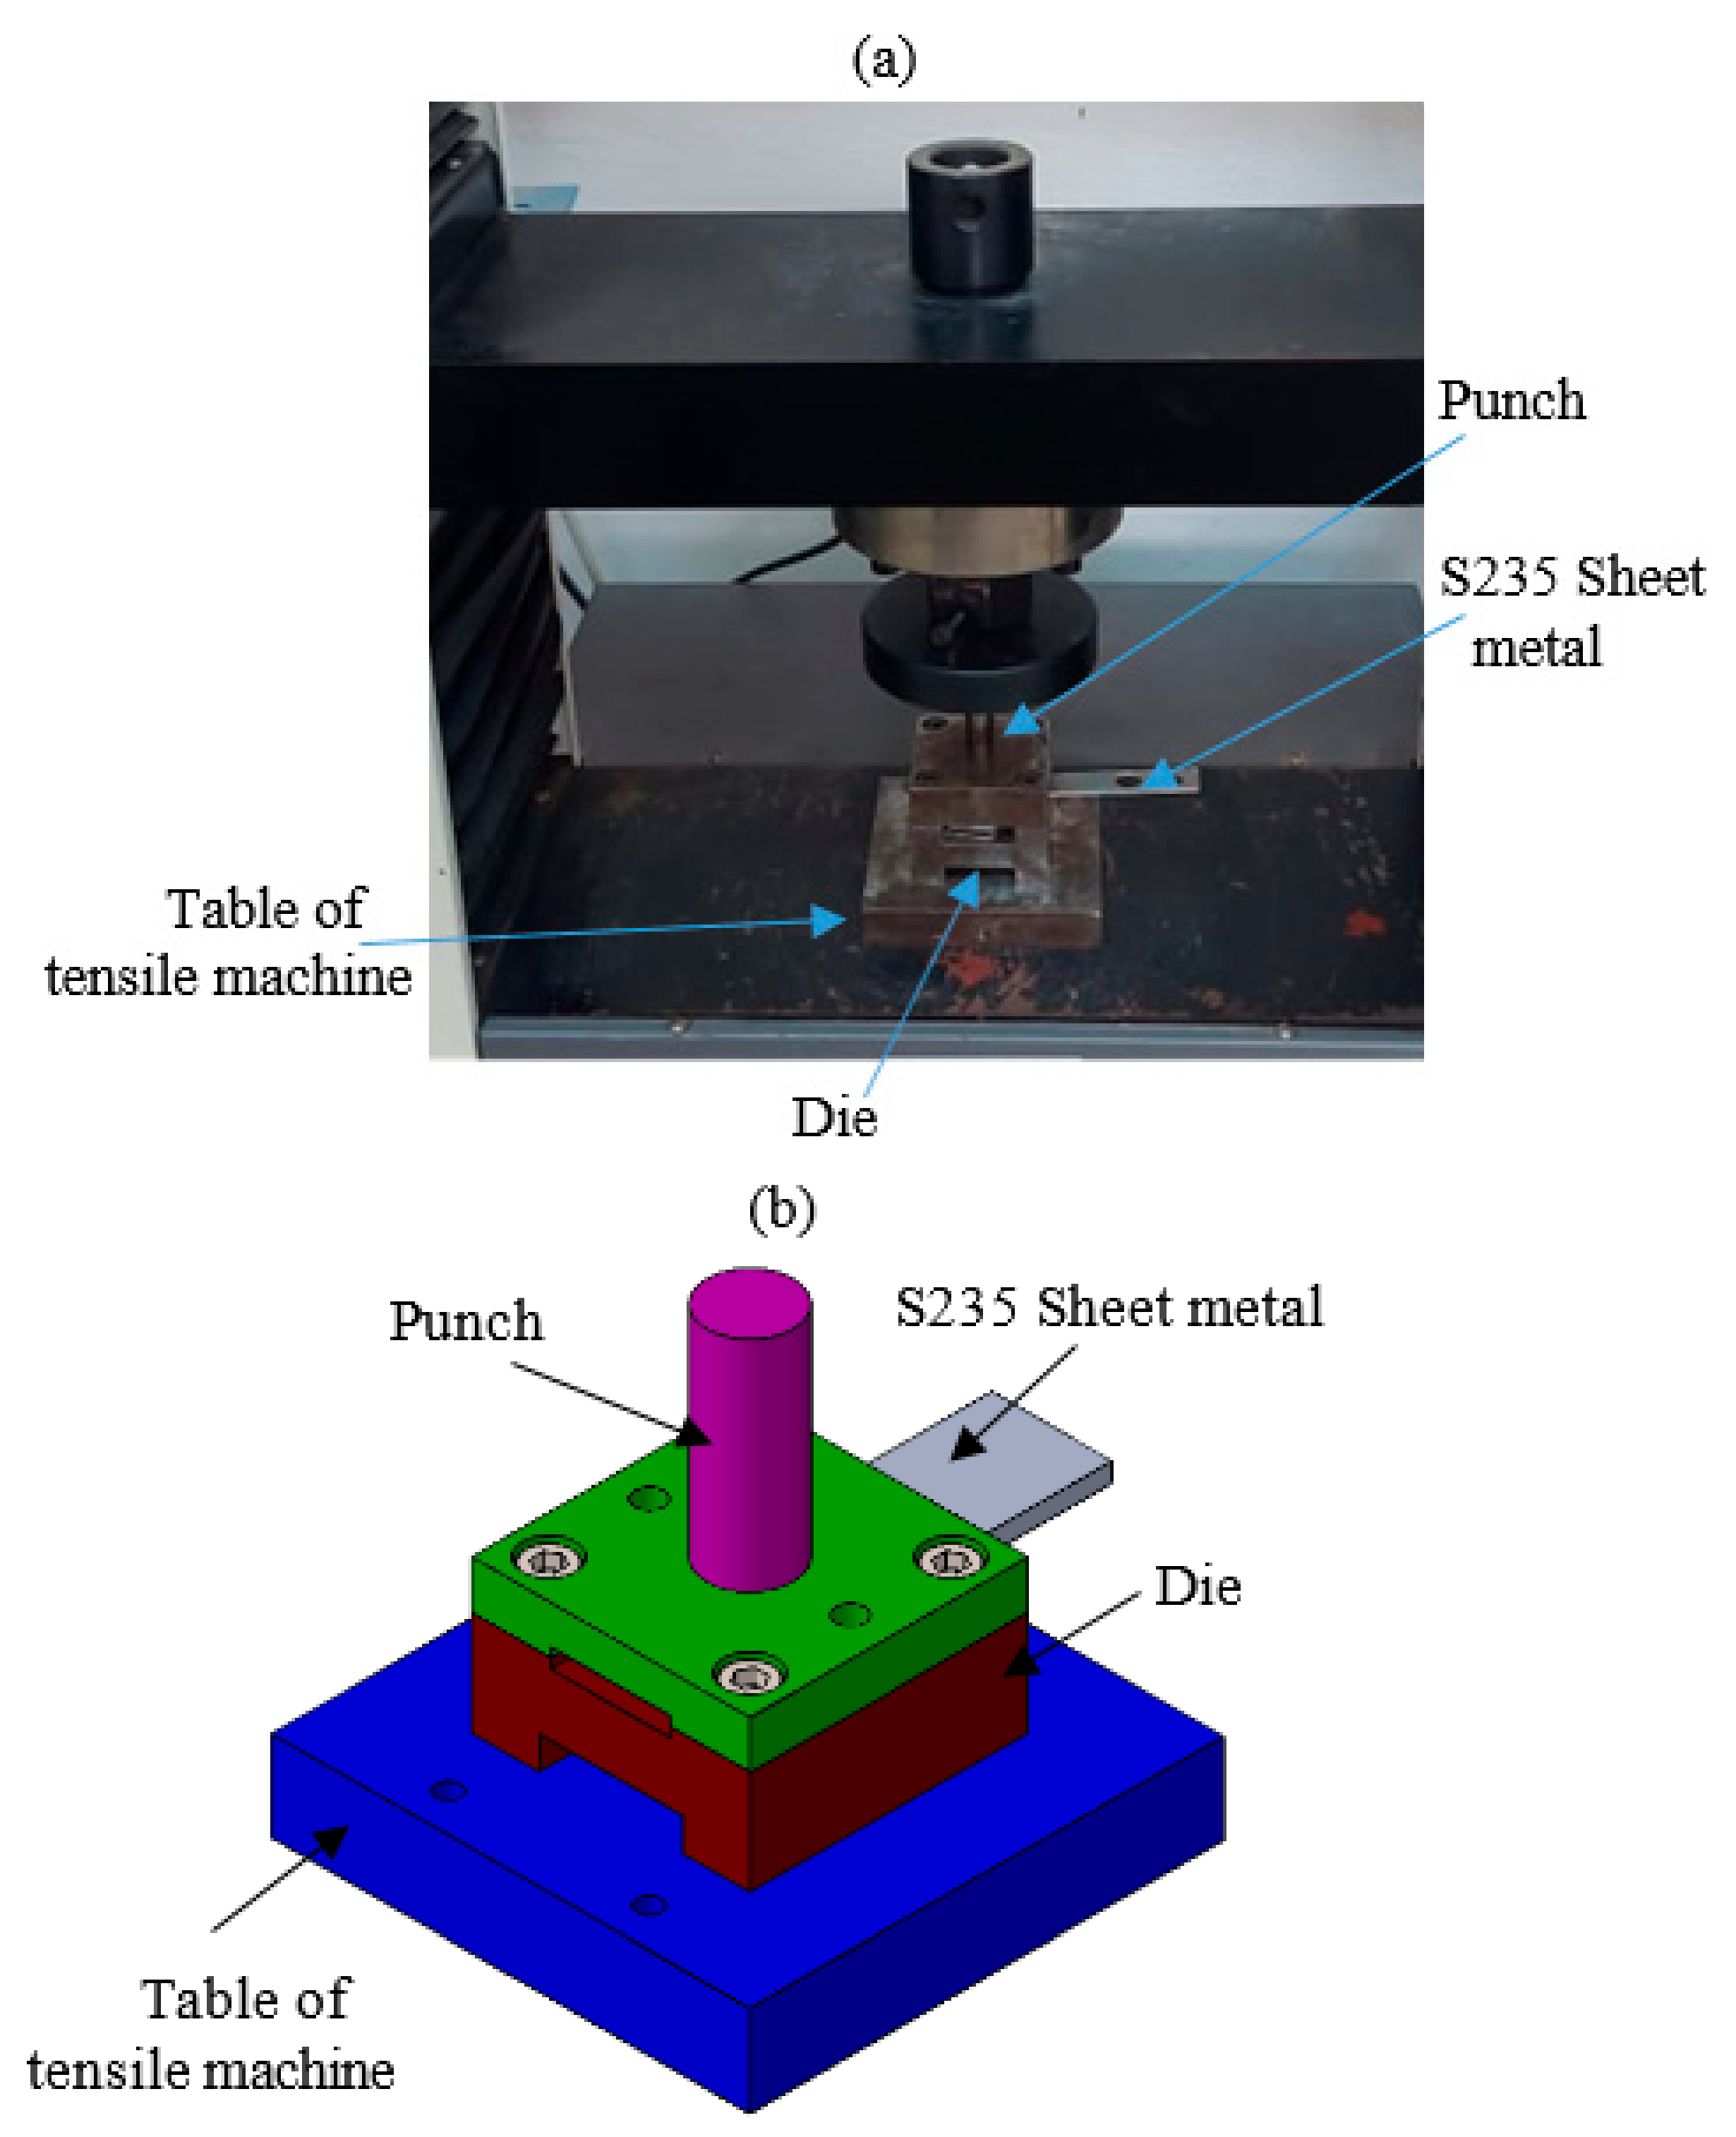
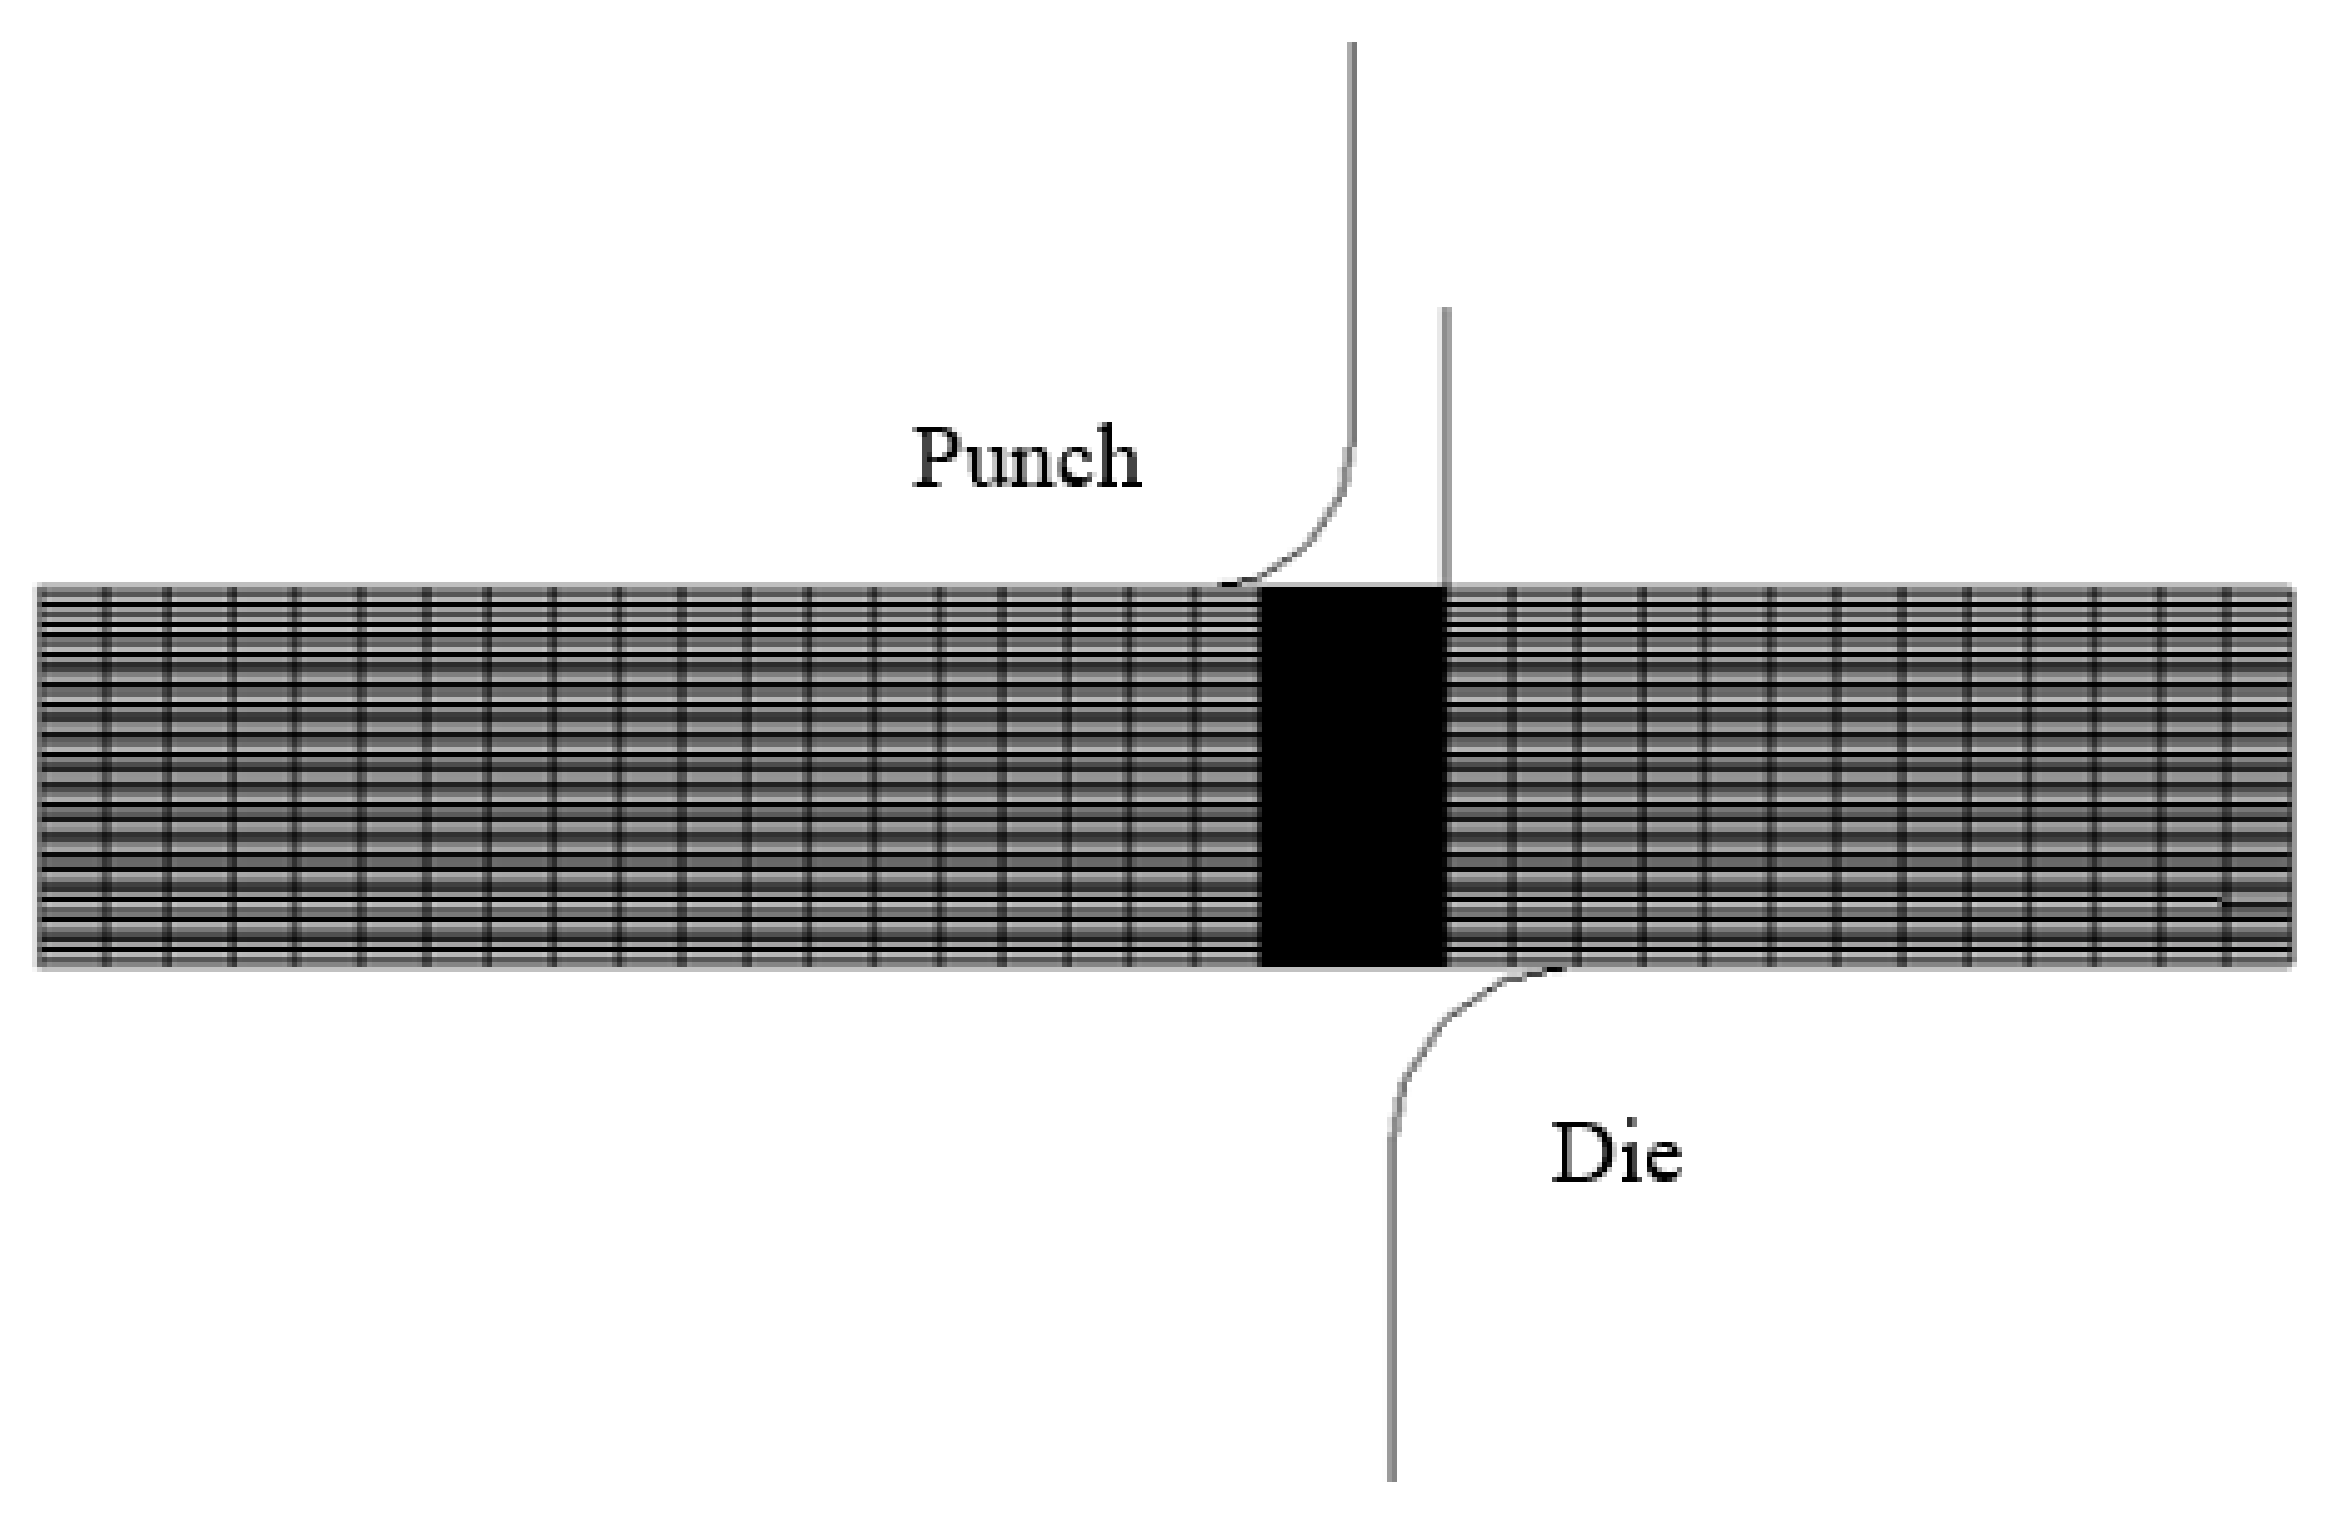
After that, blanking tests are elaborated in the same tensile machine with a specific tool.
Figure 2a,b show the tool and the sheet strip used in our experimental tests and the 3D design of the used blanking tool, respectively. In the experimental blanking test, the sheet metal is put on the die. The punch moves down and presses the sheet until fracture.
It was found in previous experimental studies of the blanking process that the maximum blanking force (
Fmax) and the blanking burr (
Hbv) are affected mainly by the sheet thickness (
t), clearance (
c), and punch diameter (
d) [
23,
31,
32].
The values of the blanking parameters are presented in
Table 2.
Two tools and four dies were considered, corresponding to two different diameters and two clearances, which correspond to the most-used clearances in industry, J = 10% and J = 20%.
The clearance is expressed as follows:
where
Ddie is the die diameter.
3. Plasticity and Damage Models of Blanking Operation
3.1. Constitutive Model of Plasticity: Rate-Dependent Model
The rational stress–strain relationship, also known as the true stress–strain equation, is derived to facilitate a finite element simulation of blanking operations. This equation is obtained from the engineering stress–strain curve, also known as the conventional stress–strain curve, which tracks stress changes with strain until the specimen bifurcates.
The true stress
σv and true strain
εv are defined by the following equation:
where
σ and
ε are, respectively, the engineering stress and the engineering strain terms,
F is the applied force,
S is the instantaneous cross-sectional area of the tensile specimen, and
L0 and
L are the original and the current length of the gauge section, respectively. A good understanding of mechanical properties is essential for efficient numerical modeling of the sheet cutting and sheet forming processes. Various empirical formulations have been outlined to compute the elastoplastic deformation characteristics of sheet metal during these operations [
18]. Moreover, when strength is influenced by the strain rate parameter, the plasticity law becomes rate-dependent. It is essential to consider the strain rate sensitivity in both the plasticity and damage laws associated with sheet blanking processes. Conversely, the effects of thermal softening can be ignored. To address this, the modified Johnson–Cook law (Equation (3)) [
28] was devised and commonly employed to characterize the ductile material response under strain hardening and strain rate hardening.
The modified Johnson–Cook law describes the strain hardening effect in materials, where it depends on four key parameters denoted as A, B, n, and C. These parameters correspond to the yield stress, the strain hardening coefficients, and a material property influencing the strain rate sensitivity, respectively.
Firstly, the materials constants
A,
B, and
n are identified based on this relationship:
This plasticity law (Equation (3)) establishes the correlation between strain and stress. By applying the logarithm function to this equation [
2], we derive a linear relationship (Equation (4)), which serves as the foundation for calibrating the flow stress model through experimental tensile testing.
Subsequently, this calibration allows us to predict accurately the strain hardening parameters.
Secondly, the material constant
C may be determined. In fact, the relationship (Equation (2)) can be represented as Equation (6) [
2].
Then, the term in the function should be illustrated as a linear curve.
Once the strain hardening parameters are identified and the data points are fitted accordingly, a linear fitting is performed utilizing a first-order regression model. We can then determine the strain rate dependence coefficient, C.
3.2. Constitutive Model of Ductile Damage: Rate-Dependent Model
The decrease in strength property is intricately related to the relationship between the damaged stress, denoted
σD, and the damage parameter, represented as
D. This relationship is mathematically expressed in Equation (7).
In addition, advanced numerical models consider the impact of stress triaxiality, represented by
η, on the evolution of strain damage (Equation (8)) [
4,
11].
This triaxiality factor serves as a dimensionless ratio that compares the hydrostatic stress to the Von Mises equivalent stress. The damage model used in blanking processes is the modified Johnson–Cook law (Equation (9)) [
29], in which the damage strain
is as follows:
This description pertains to the fracture strain, accounting for strain rate effects while excluding the thermal term. The different material parameters (
D1 to
D4) are established through experimental characterization tests. The cumulative damage parameter, denoted
D, is computed according to the formula presented in Equation (10).
is the equivalent plastic strain increment.
When simplifying the damage model to exclude the influences of strain rate and temperature, the fracture strain can be reformulated in terms of stress triaxiality as follows.
The determination of these constants
D1,
D2, and
D3 was established from quasi-static characterization tests on different notched specimens [
11]. Subsequently, the strain rate-dependent damage parameter
D4 is determined by considering the dynamic load until strain to fracture occurs. The dataset of strain rate values is examined and their variations in failure strain is interpreted.
4. Friction Models of Blanking Process
In the blanking process, it is essential to account for friction forces, as they significantly affect the prediction of blanking parameters. Friction occurs between the sheet metal and the tool. The contact force
Ffr (Equation (12)) is divided into two components, which are normal and tangential ones.
The external virtual work, which is the sum of the internal virtual work and the inertial work, is expressed by Equation (13). The stress vector is denoted
τ.
This principle is shown in Equation (14).
The internal virtual work
and the inertial virtual work
are given by relationship (15).
Then, the mechanical problem consists in solving the following relationship (16):
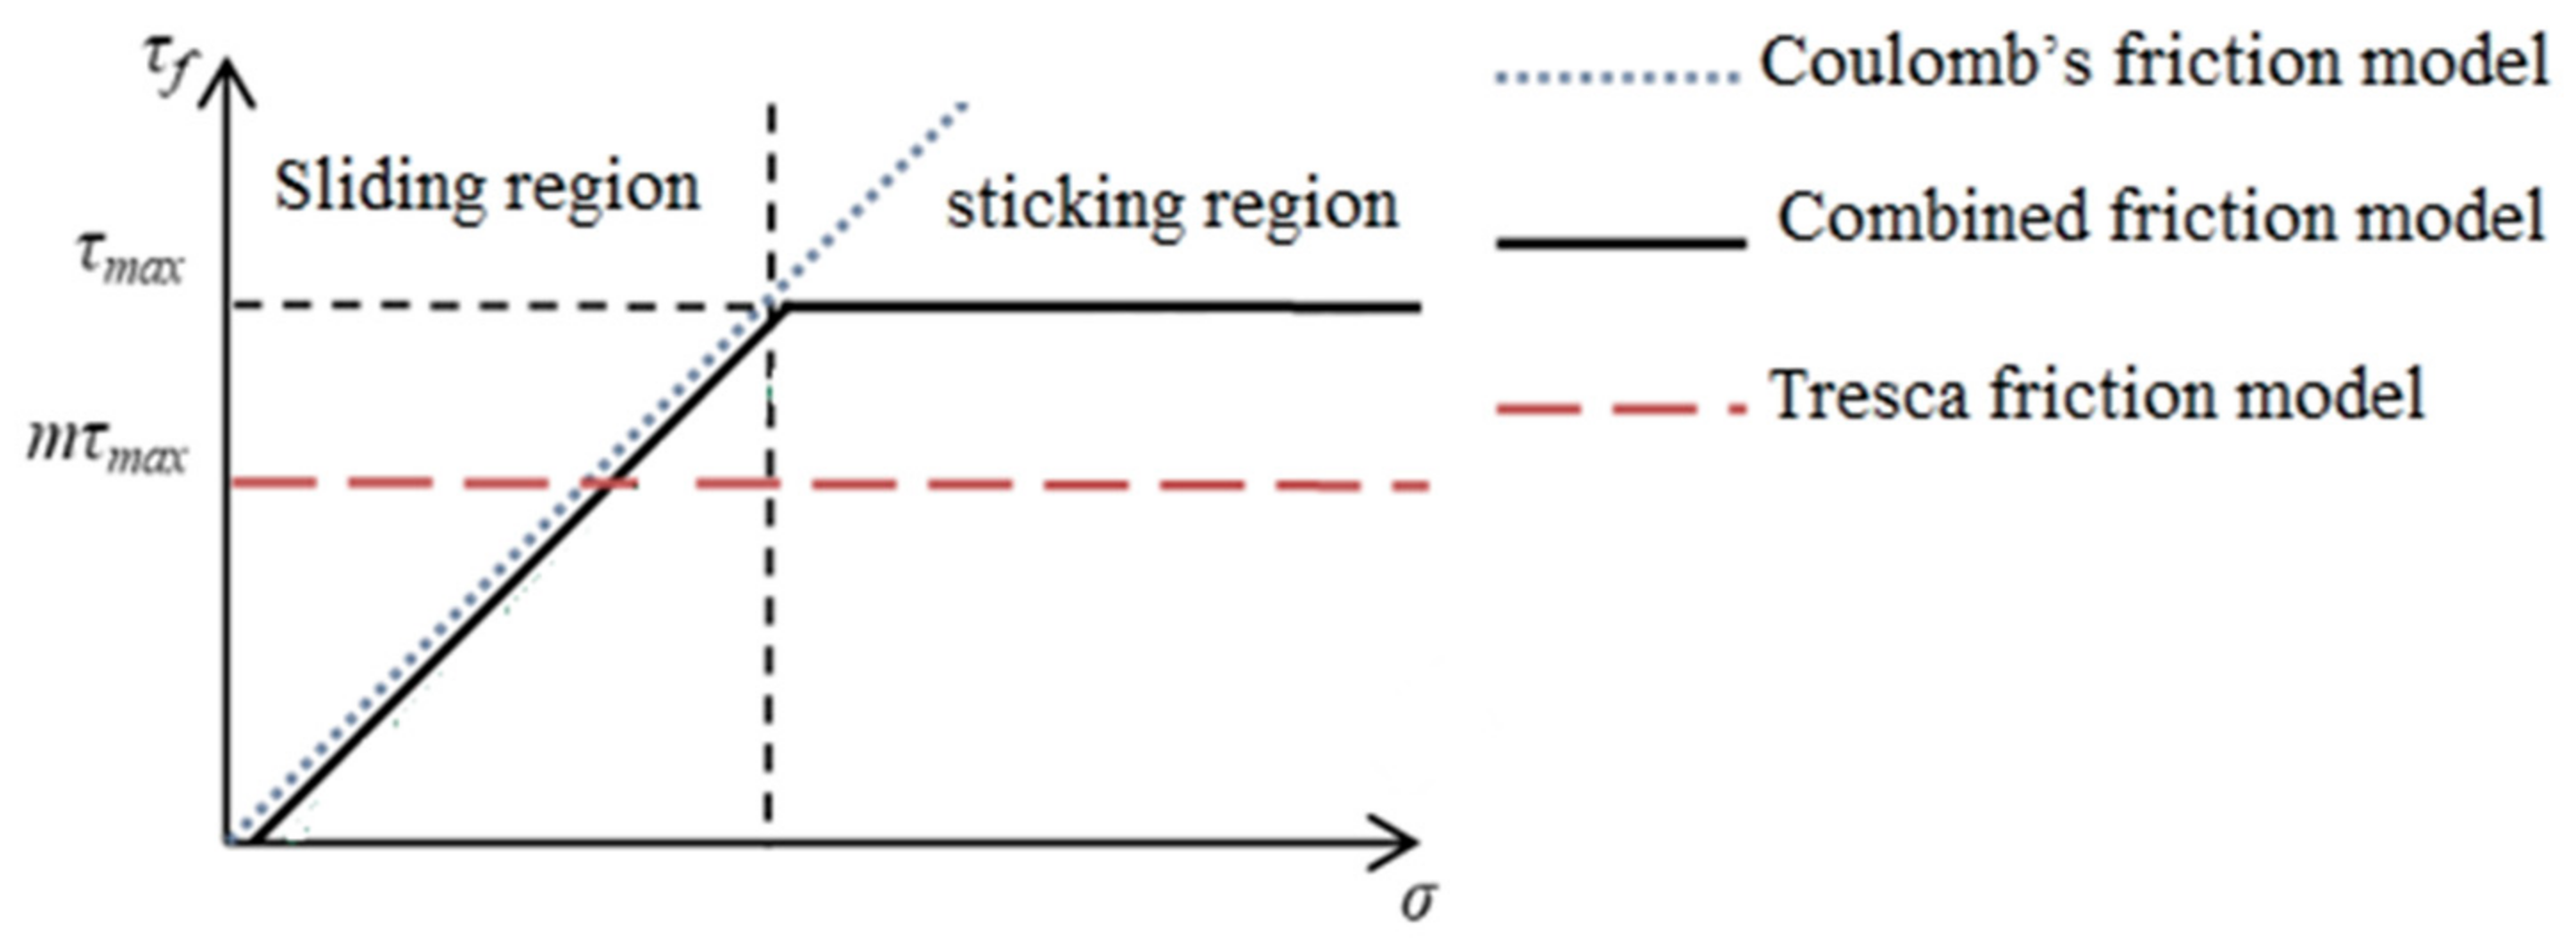
Once the mathematical equations for a mechanical problem are formulated using external virtual work, it is crucial to select an appropriate friction model. This selection is significant, as different friction models have varying levels of accuracy and applicability in predicting the behavior of mechanical systems. The combined friction model (Equation (17)) is used in blanking process modelling because of its suitability to high stress.
We denote
τf the frictional shear stress, σ the normal contact stress,
μc the Coulomb coefficient, and τ
max the shear flow stress.
Figure 3 illustrates the friction models.
For Coulomb’s rule, τ
f increases linearly as a function of σ.
However, for the Tresca friction model,
τf is proportional to τ
max.
5. Experimental Results of Sheet Blanking Tests
In order to ensure the reproducibility of the blanking test results, these experiments were repeated three times.
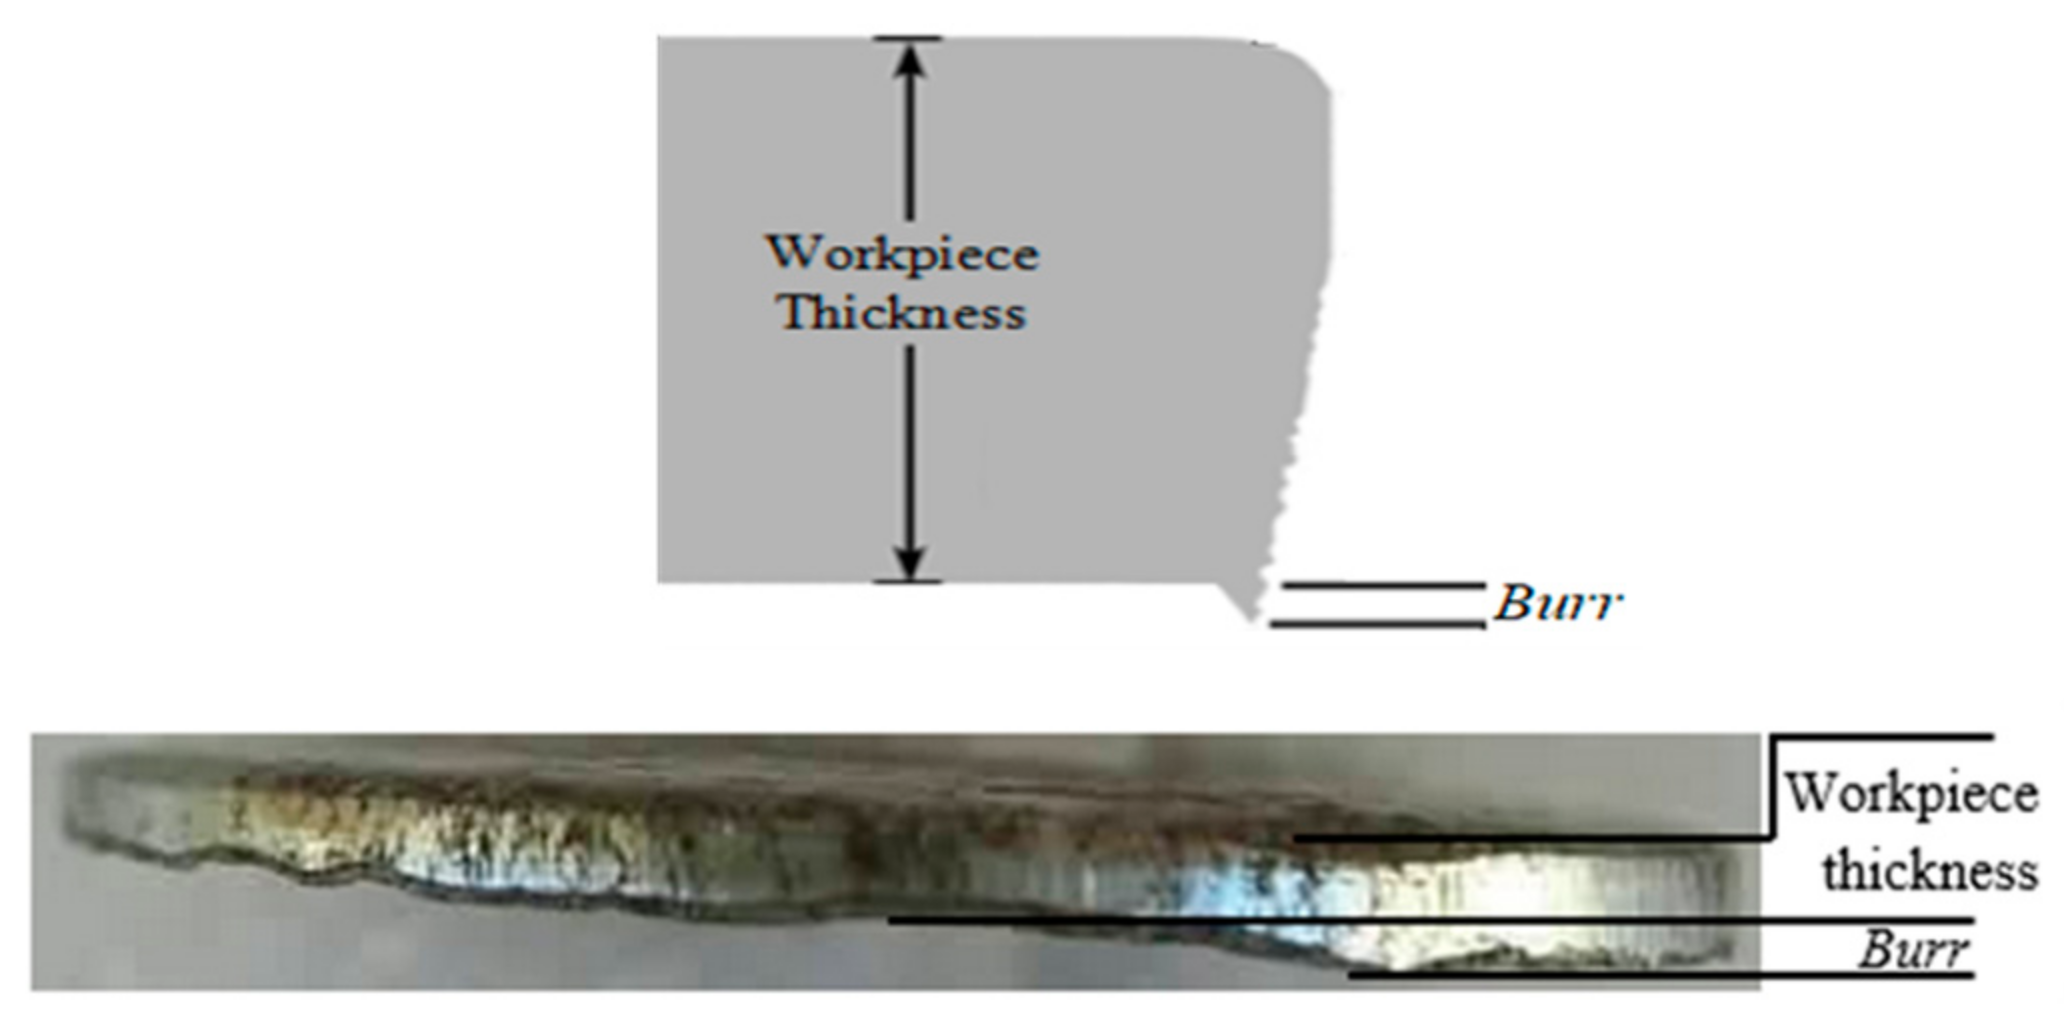
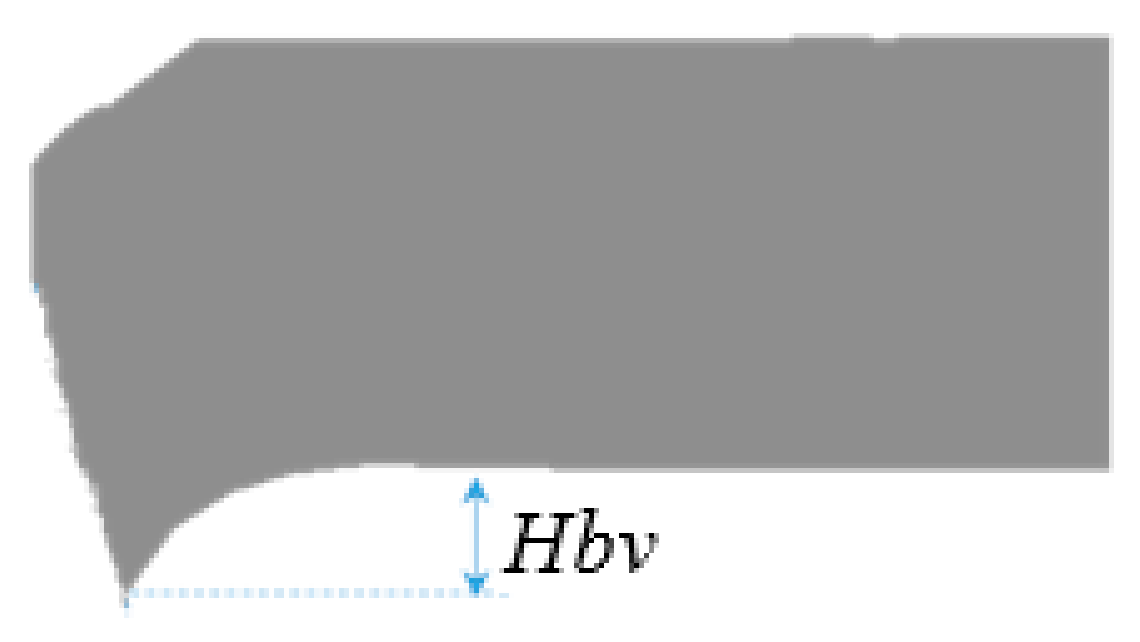
Blanking burrs (
Figure 4) can be prevented by understanding the influence of the blanking parameters on the design and manufacturing phases during the blanking operation. For that, we study the influence of the sheet thickness, the punch diameter, the blanking speed, and the clearance on the blanking force and the blanked sample profile.
Table 3 lists the obtained experimental results.
In this section, an experimental analysis of burr Hbv and maximum blanking force Fmax will be presented.
5.1. Experimental Analysis of Hbv
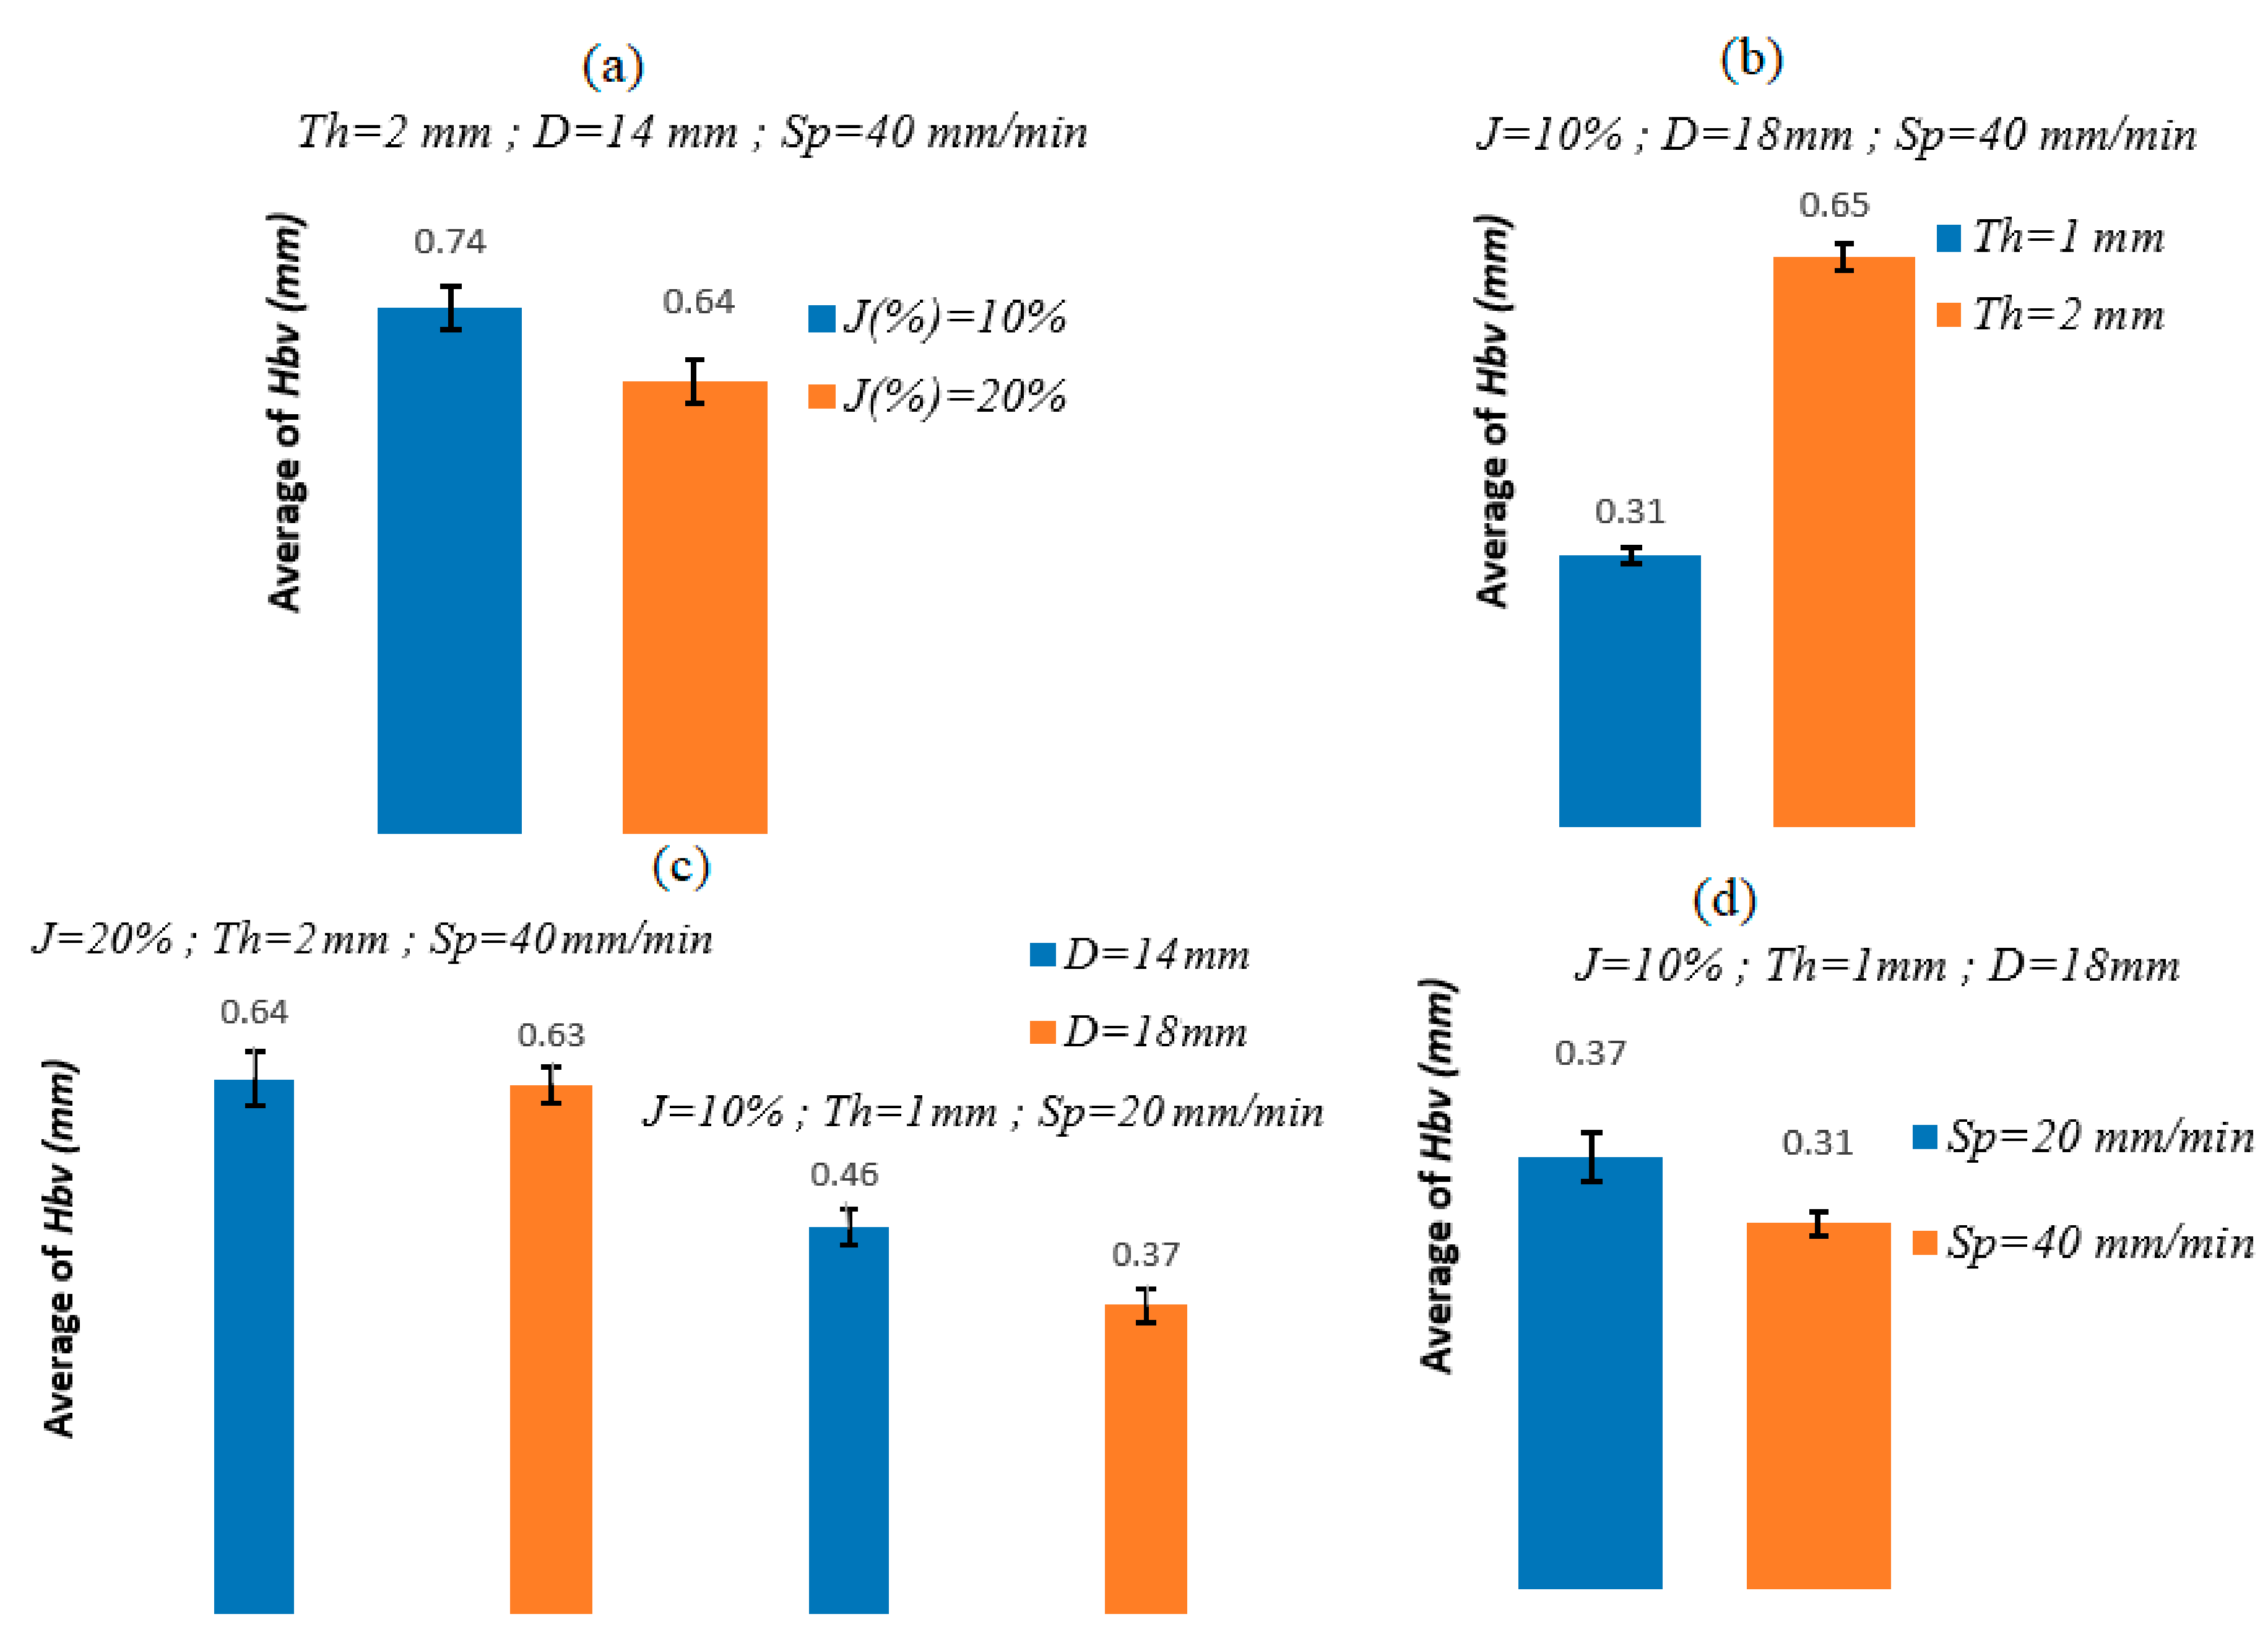
Blanking burr is a phenomenon that allows the control of quality and cost in the blanking process. It is crucial to control aspects of the blanking operation leading to burr appearance. For that, we measure the burr Hbv as a function of the four selected input factors.
From this graph, it can be concluded that the punch speed and the clearance between die and punch affect moderately the average of
Hbv. However, an increase in sheet thickness considerably increases
Hbv. The punch diameter has a weak influence on
Hbv, especially for the case of
Th = 2 mm,
J = 20%, and
Sp = 40 mm/min. For
Th = 1 mm,
J = 10%, and
Sp = 20 mm/min, it applies to the data presented in
Figure 5 and
Figure 6. The effect of punch diameter is clearer, but it remains moderate compared to the effect of sheet thickness on
Hbv.
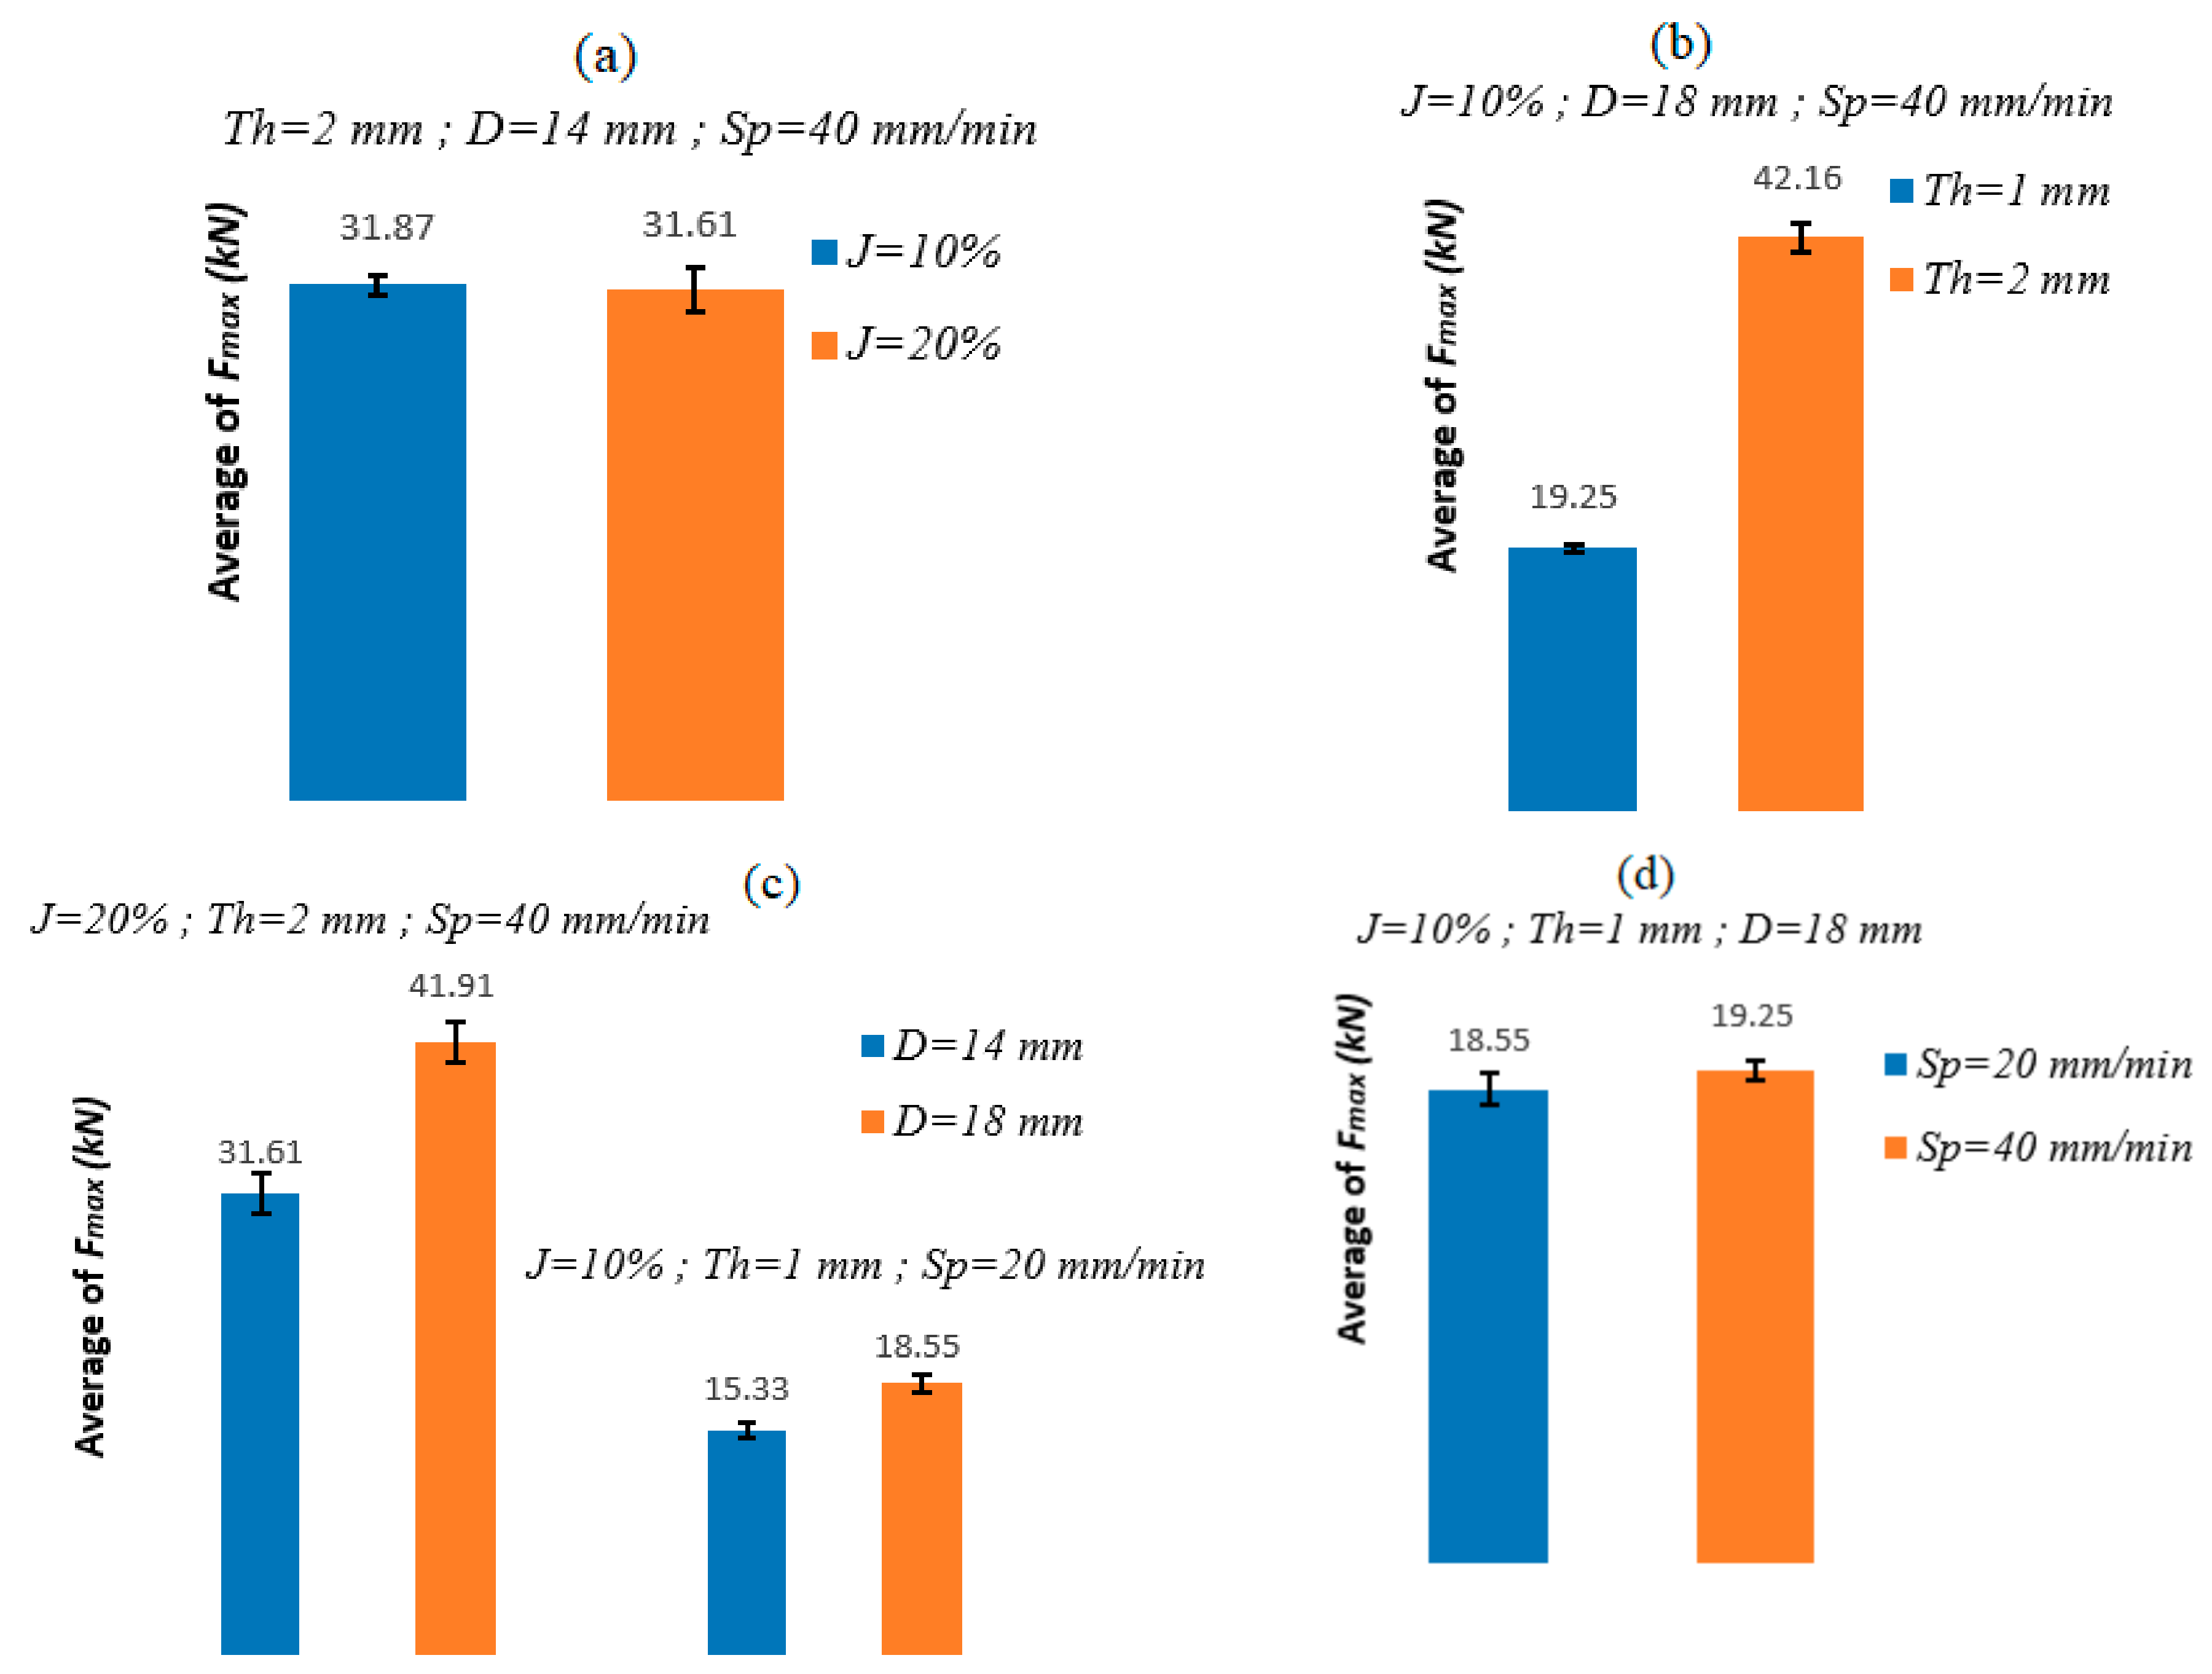
5.2. Experimental Analysis of Fmax
Knowledge of force evolution in blanking operations is required to predict the fracture mechanisms of sheet metal in a suitable way and to design blanking tools. The maximum blanking force (Fmax) depends on different blanking parameters such as punch speed, sheet thickness, clearance between punch and die, etc.
From the graph of
Figure 6, the increase in thickness and the punch diameter considerably increase
Fmax. The effect of the punch speed and the clearance can be considered negligible.
6. Numerical Study of Sheet Blanking Operation
6.1. Identification of Plasticity and Damage Laws
Tensile tests are experimental procedures utilized to predict mechanical properties and damage parameters. These tests are conducted to ascertain the elastic properties and constants associated with modified Johnson–Cook laws, which elucidate material behavior and damage under high strain rates. In this regard,
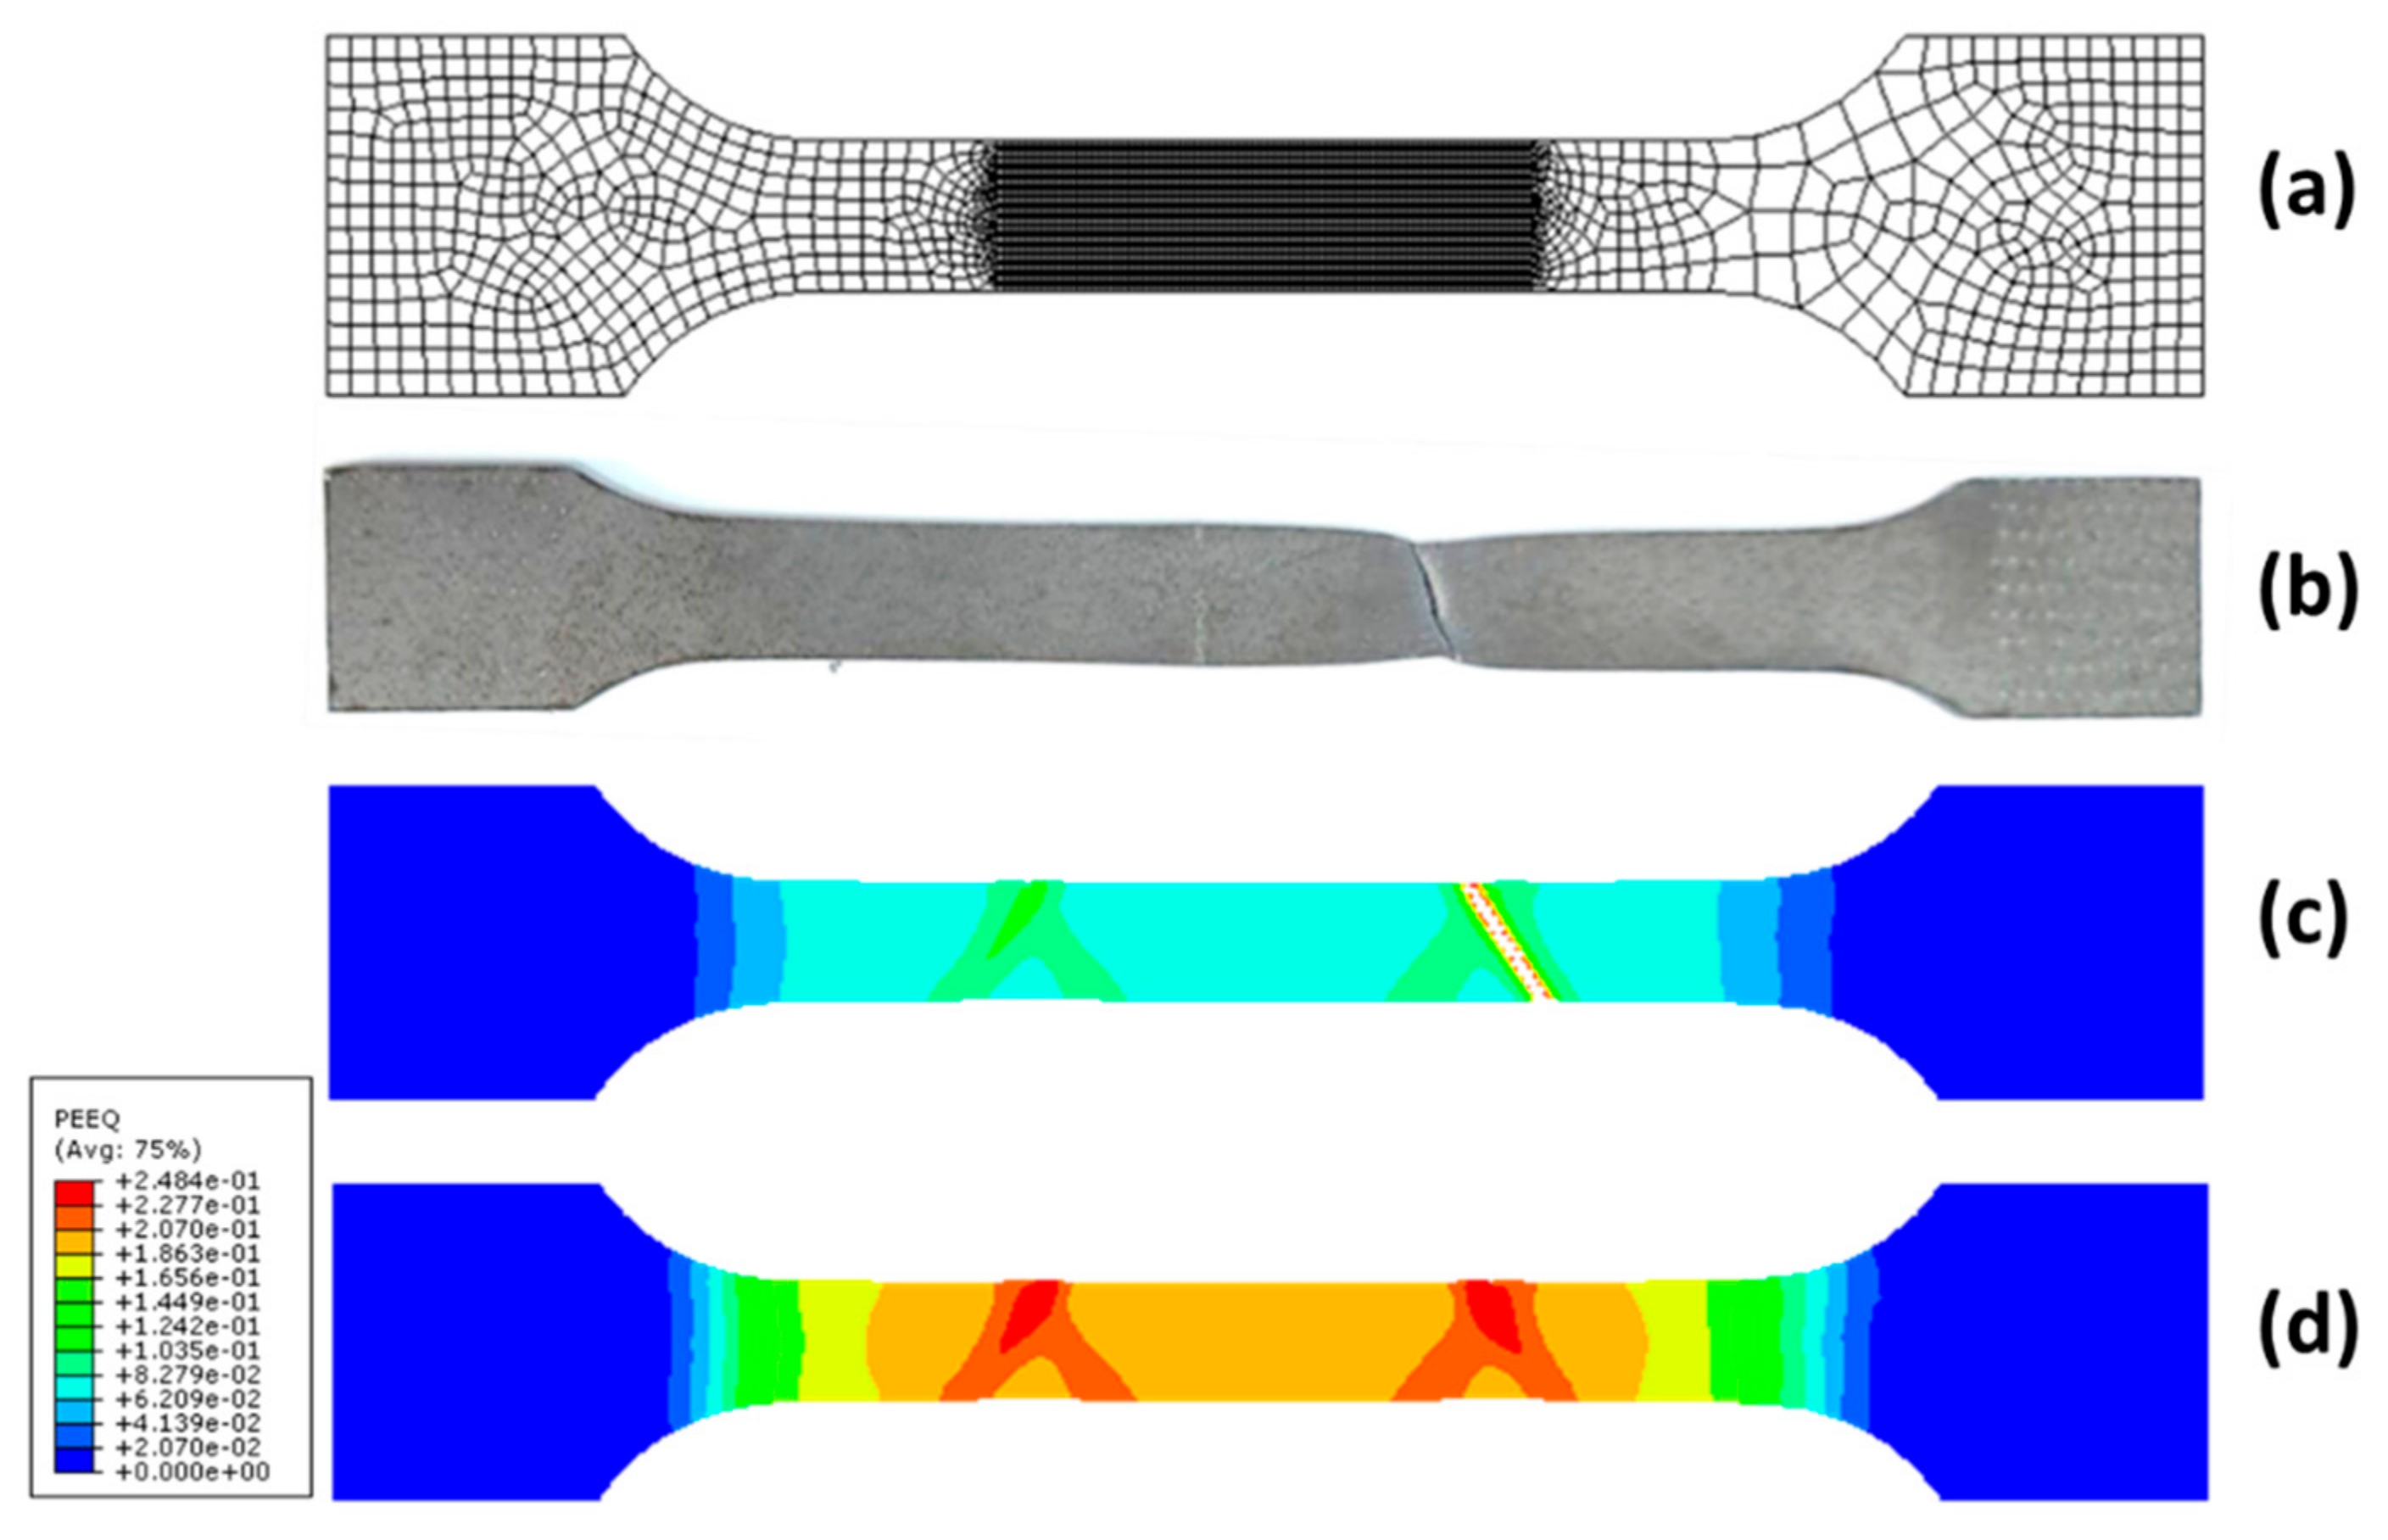
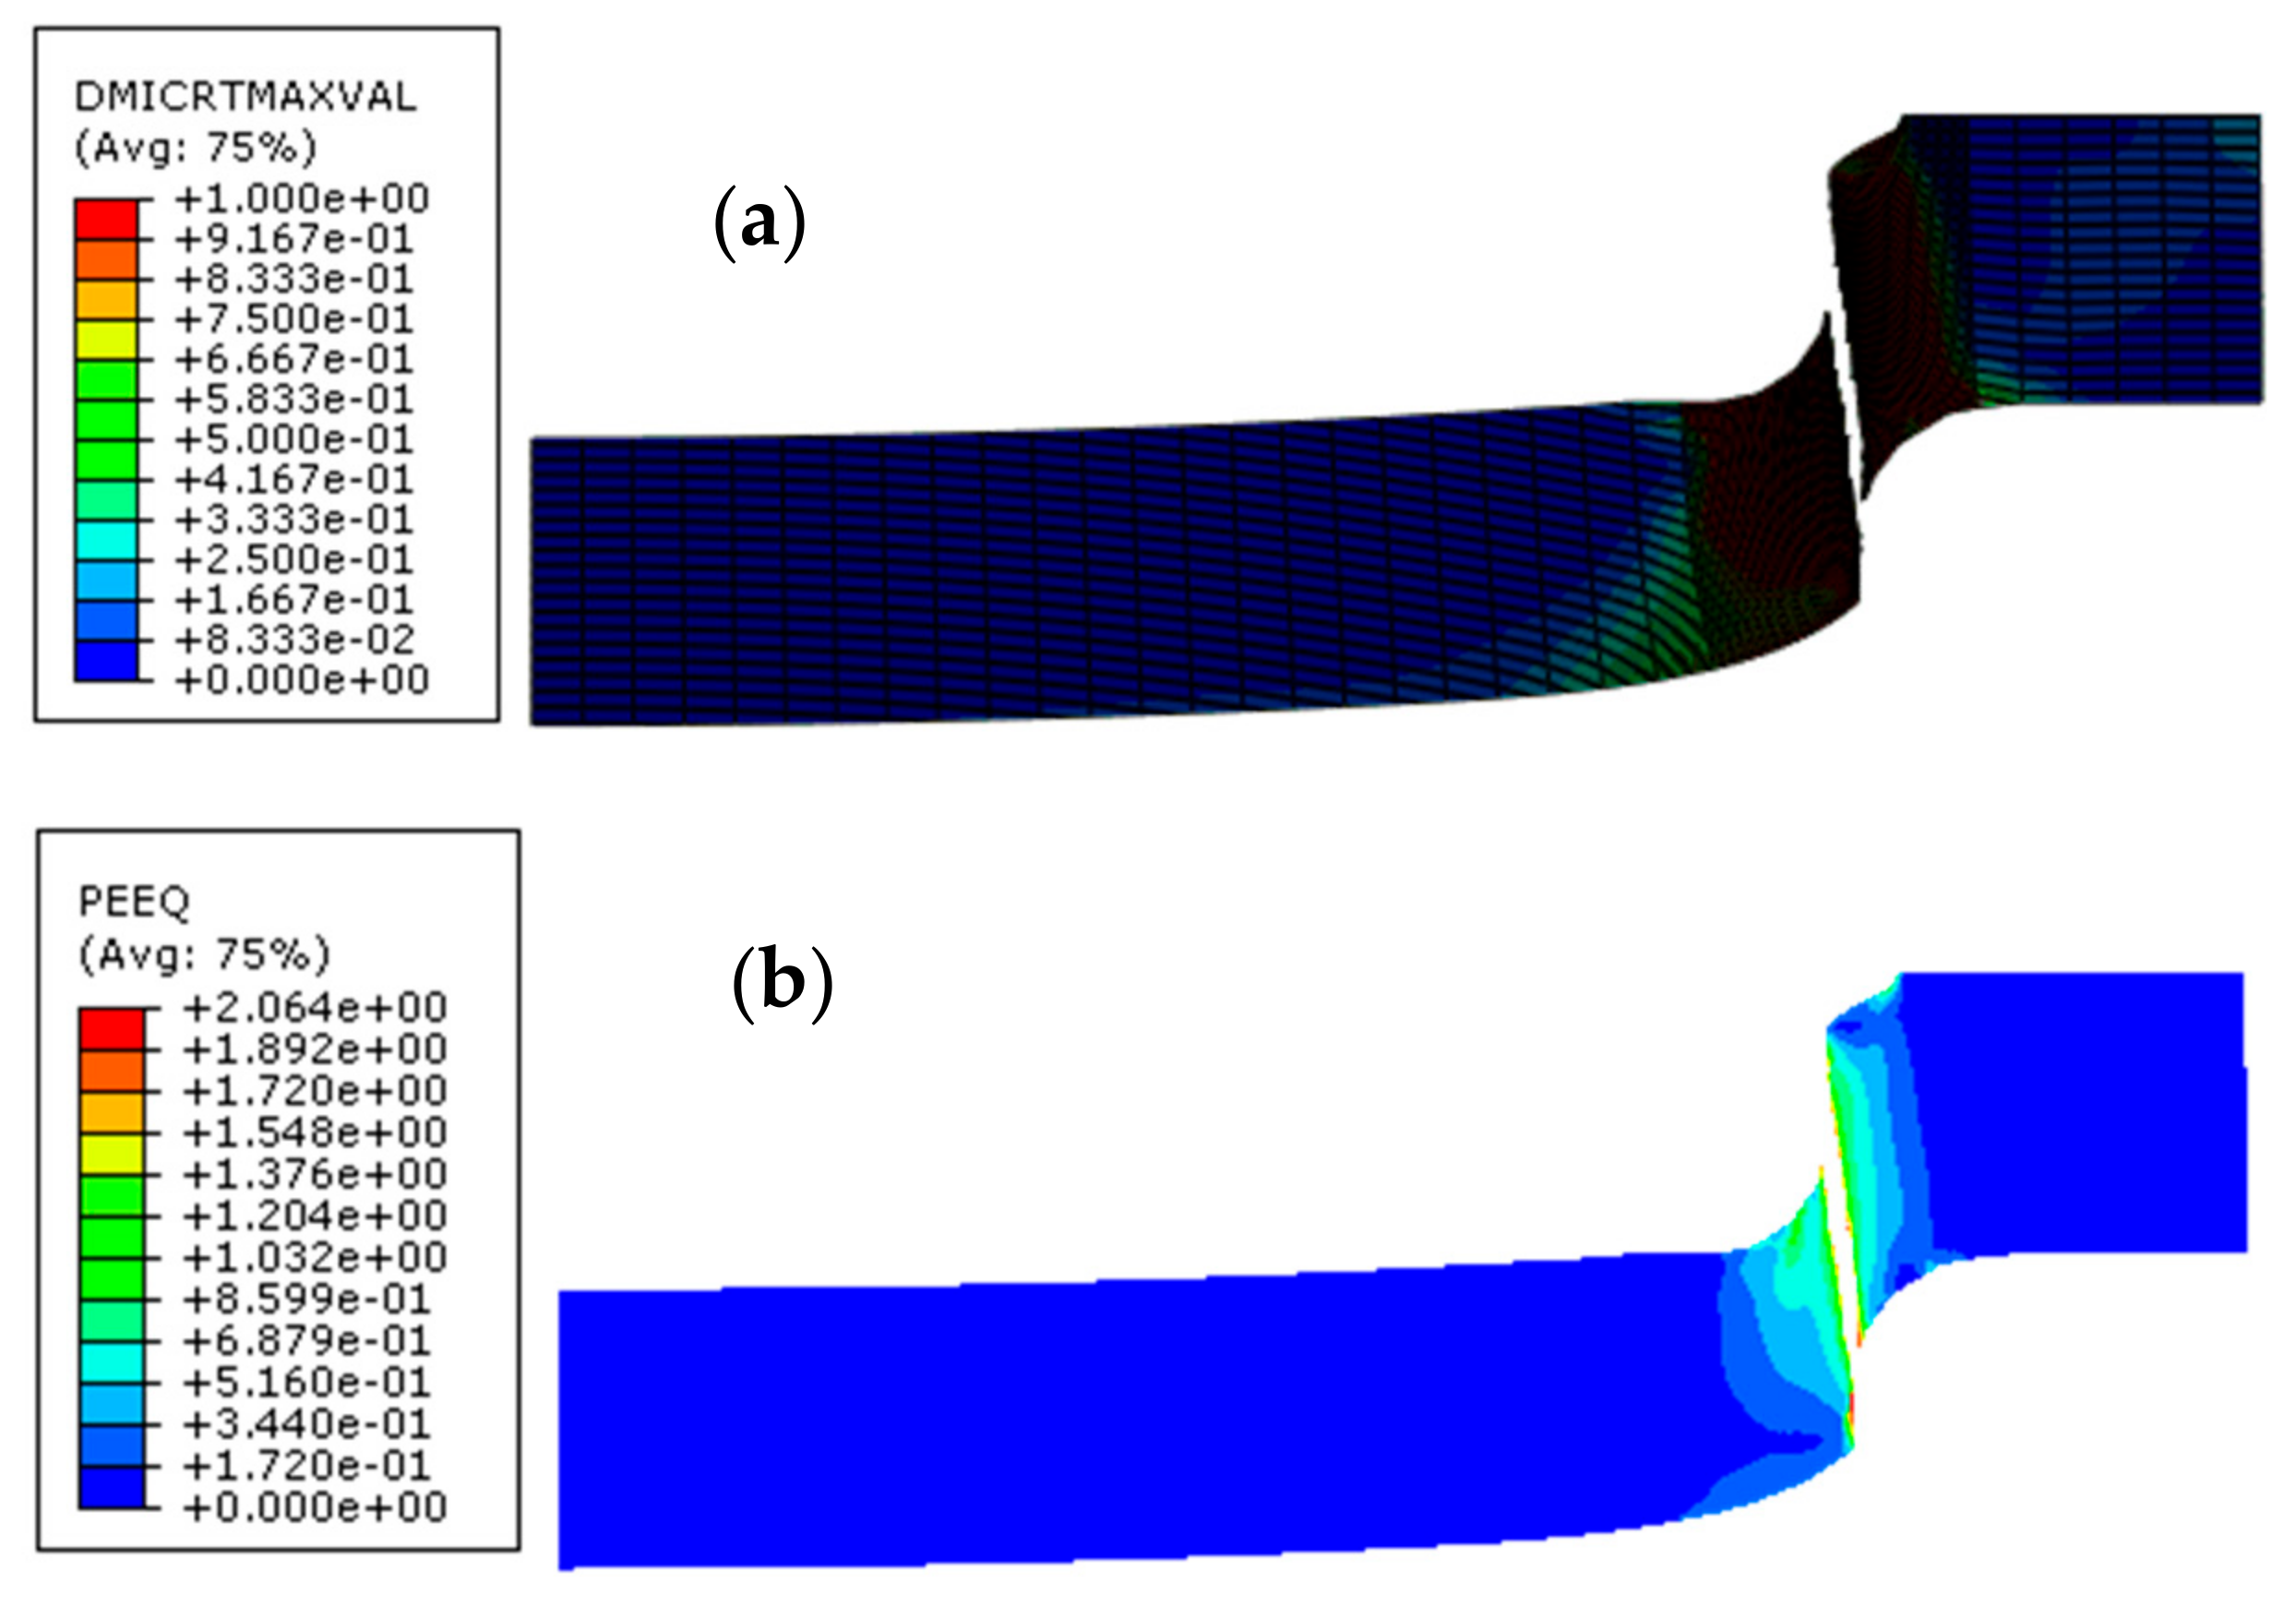
Figure 7a illustrates the mesh utilized in the numerical simulations of the tensile test. C3D8R elements are employed with a refined meshing zone of 0.5 × 0.5 × 0.5 mm³.
Figure 7b,c depict the paths along which cracks propagate within the material after experimental and numerical tensile tests conducted at a loading speed of 500 mm/min.
Figure 7d illustrates the equivalent plastic strain contour just before failure.
The choice of two different loading speeds is significant because it allows researchers to discern how the material’s response varies with different rates of deformation. This is crucial for accurately modeling the material’s behavior in the blanking test.
The development of a numerical model for the tensile test simulates the behavior of the material under different conditions, providing a good choice of parameters for the plasticity and damage laws.
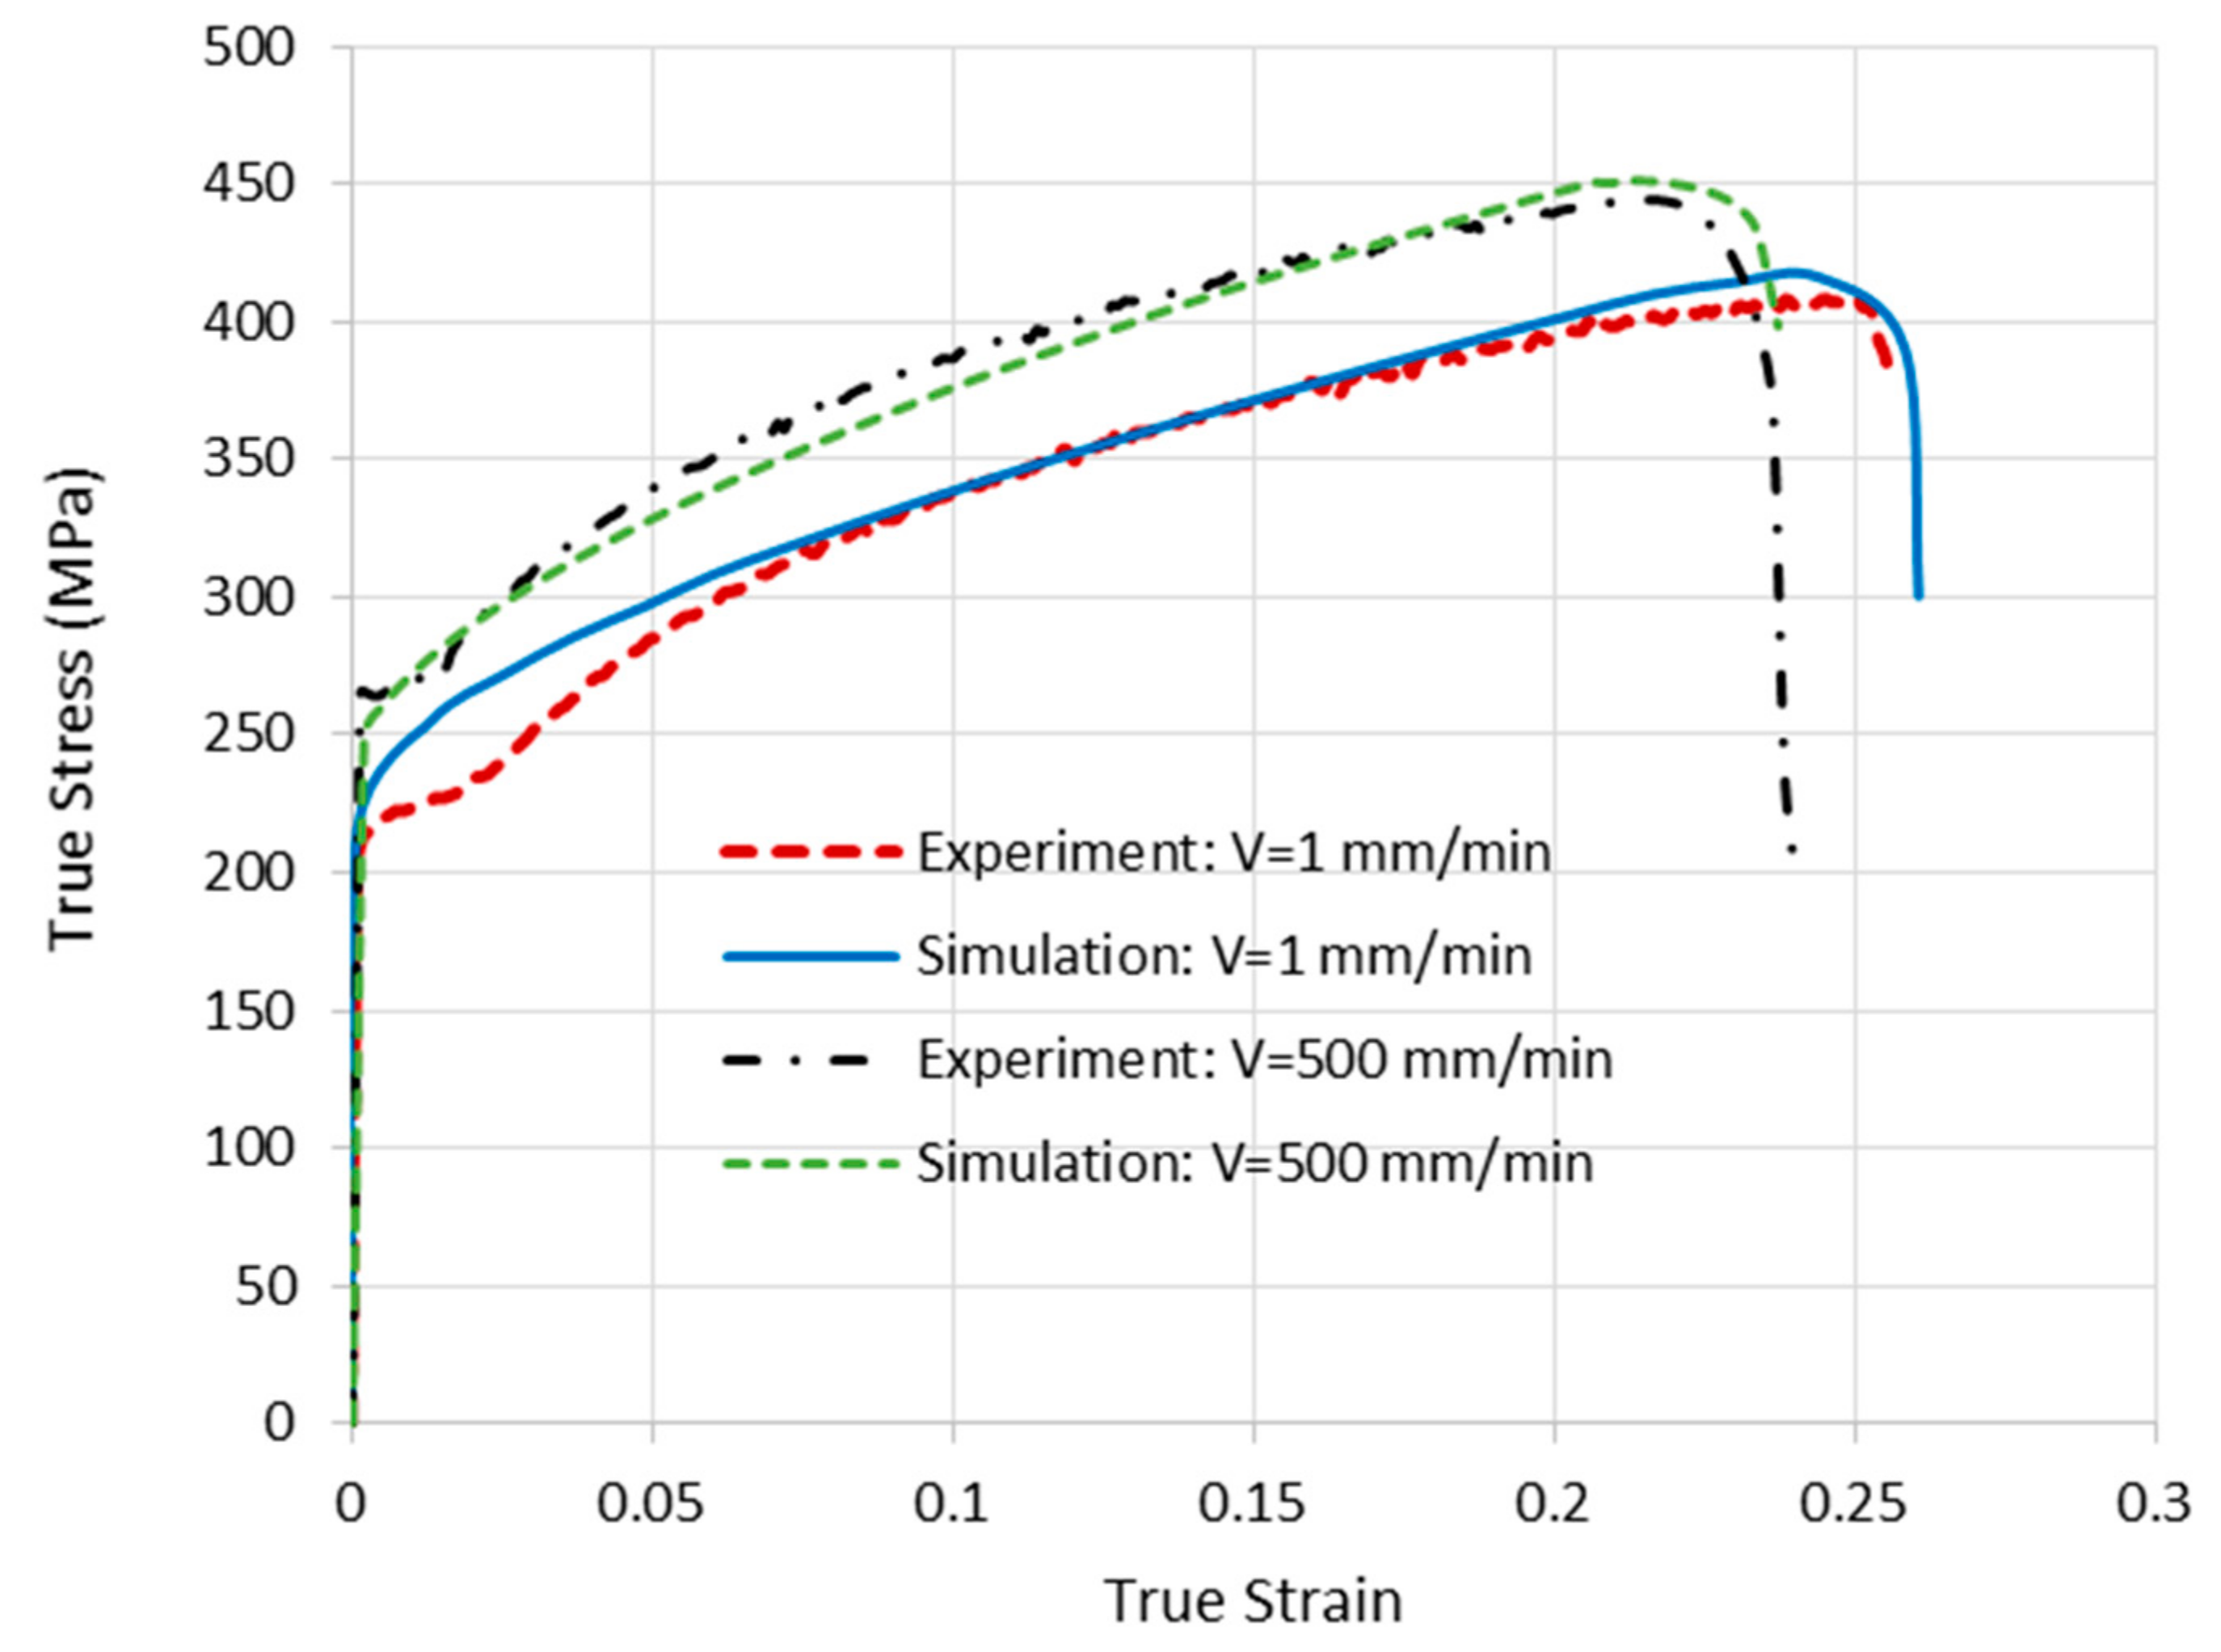
Figure 8 illustrates the evolution of the true stress curve as a function of true strain. The two loading speeds in the tensile tests are 1 mm/min and 500 mm/min.
A good correspondence between the results indicates that the outcomes obtained from the experimental tests align well with the predictions from the numerical simulations. This suggests that the numerical model accurately predicts the behavior of the sheet metal under different loading conditions. Then the constants of modified the Johnson–Cook model are determined, as shown in
Table 4 and
Table 5.
These parameters will be used to simulate the sheet blanking tests.
6.2. Numerical Model of Blanking Operation
A finite element, ABAQUS/Explicit model, is used to compute the blanking process of S235 sheet steel. The meshing utilizes the four-node bilinear axisymmetric quadrilateral element (CAX4R). In our computational model, the die and the punch are assumed to be rigid solids. As shown in
Figure 9, a finer mesh is defined in the failure zone.
Within this section, the modified Johnson–Cook laws (Equations (3) and (9)) are applied to characterize the yielding behavior and damage of the sheet metal. The combined friction model (Equation (17)) is used in this model. The Coulomb friction coefficient is μc = 0.3.
7. Accuracy of the Rate-Dependent Model of Blanking Operations
The numerical model incorporating the rate strain term is utilized to predict the mechanical behavior of S235 sheet steel during blanking operations.
Figure 10 presents the computed results.
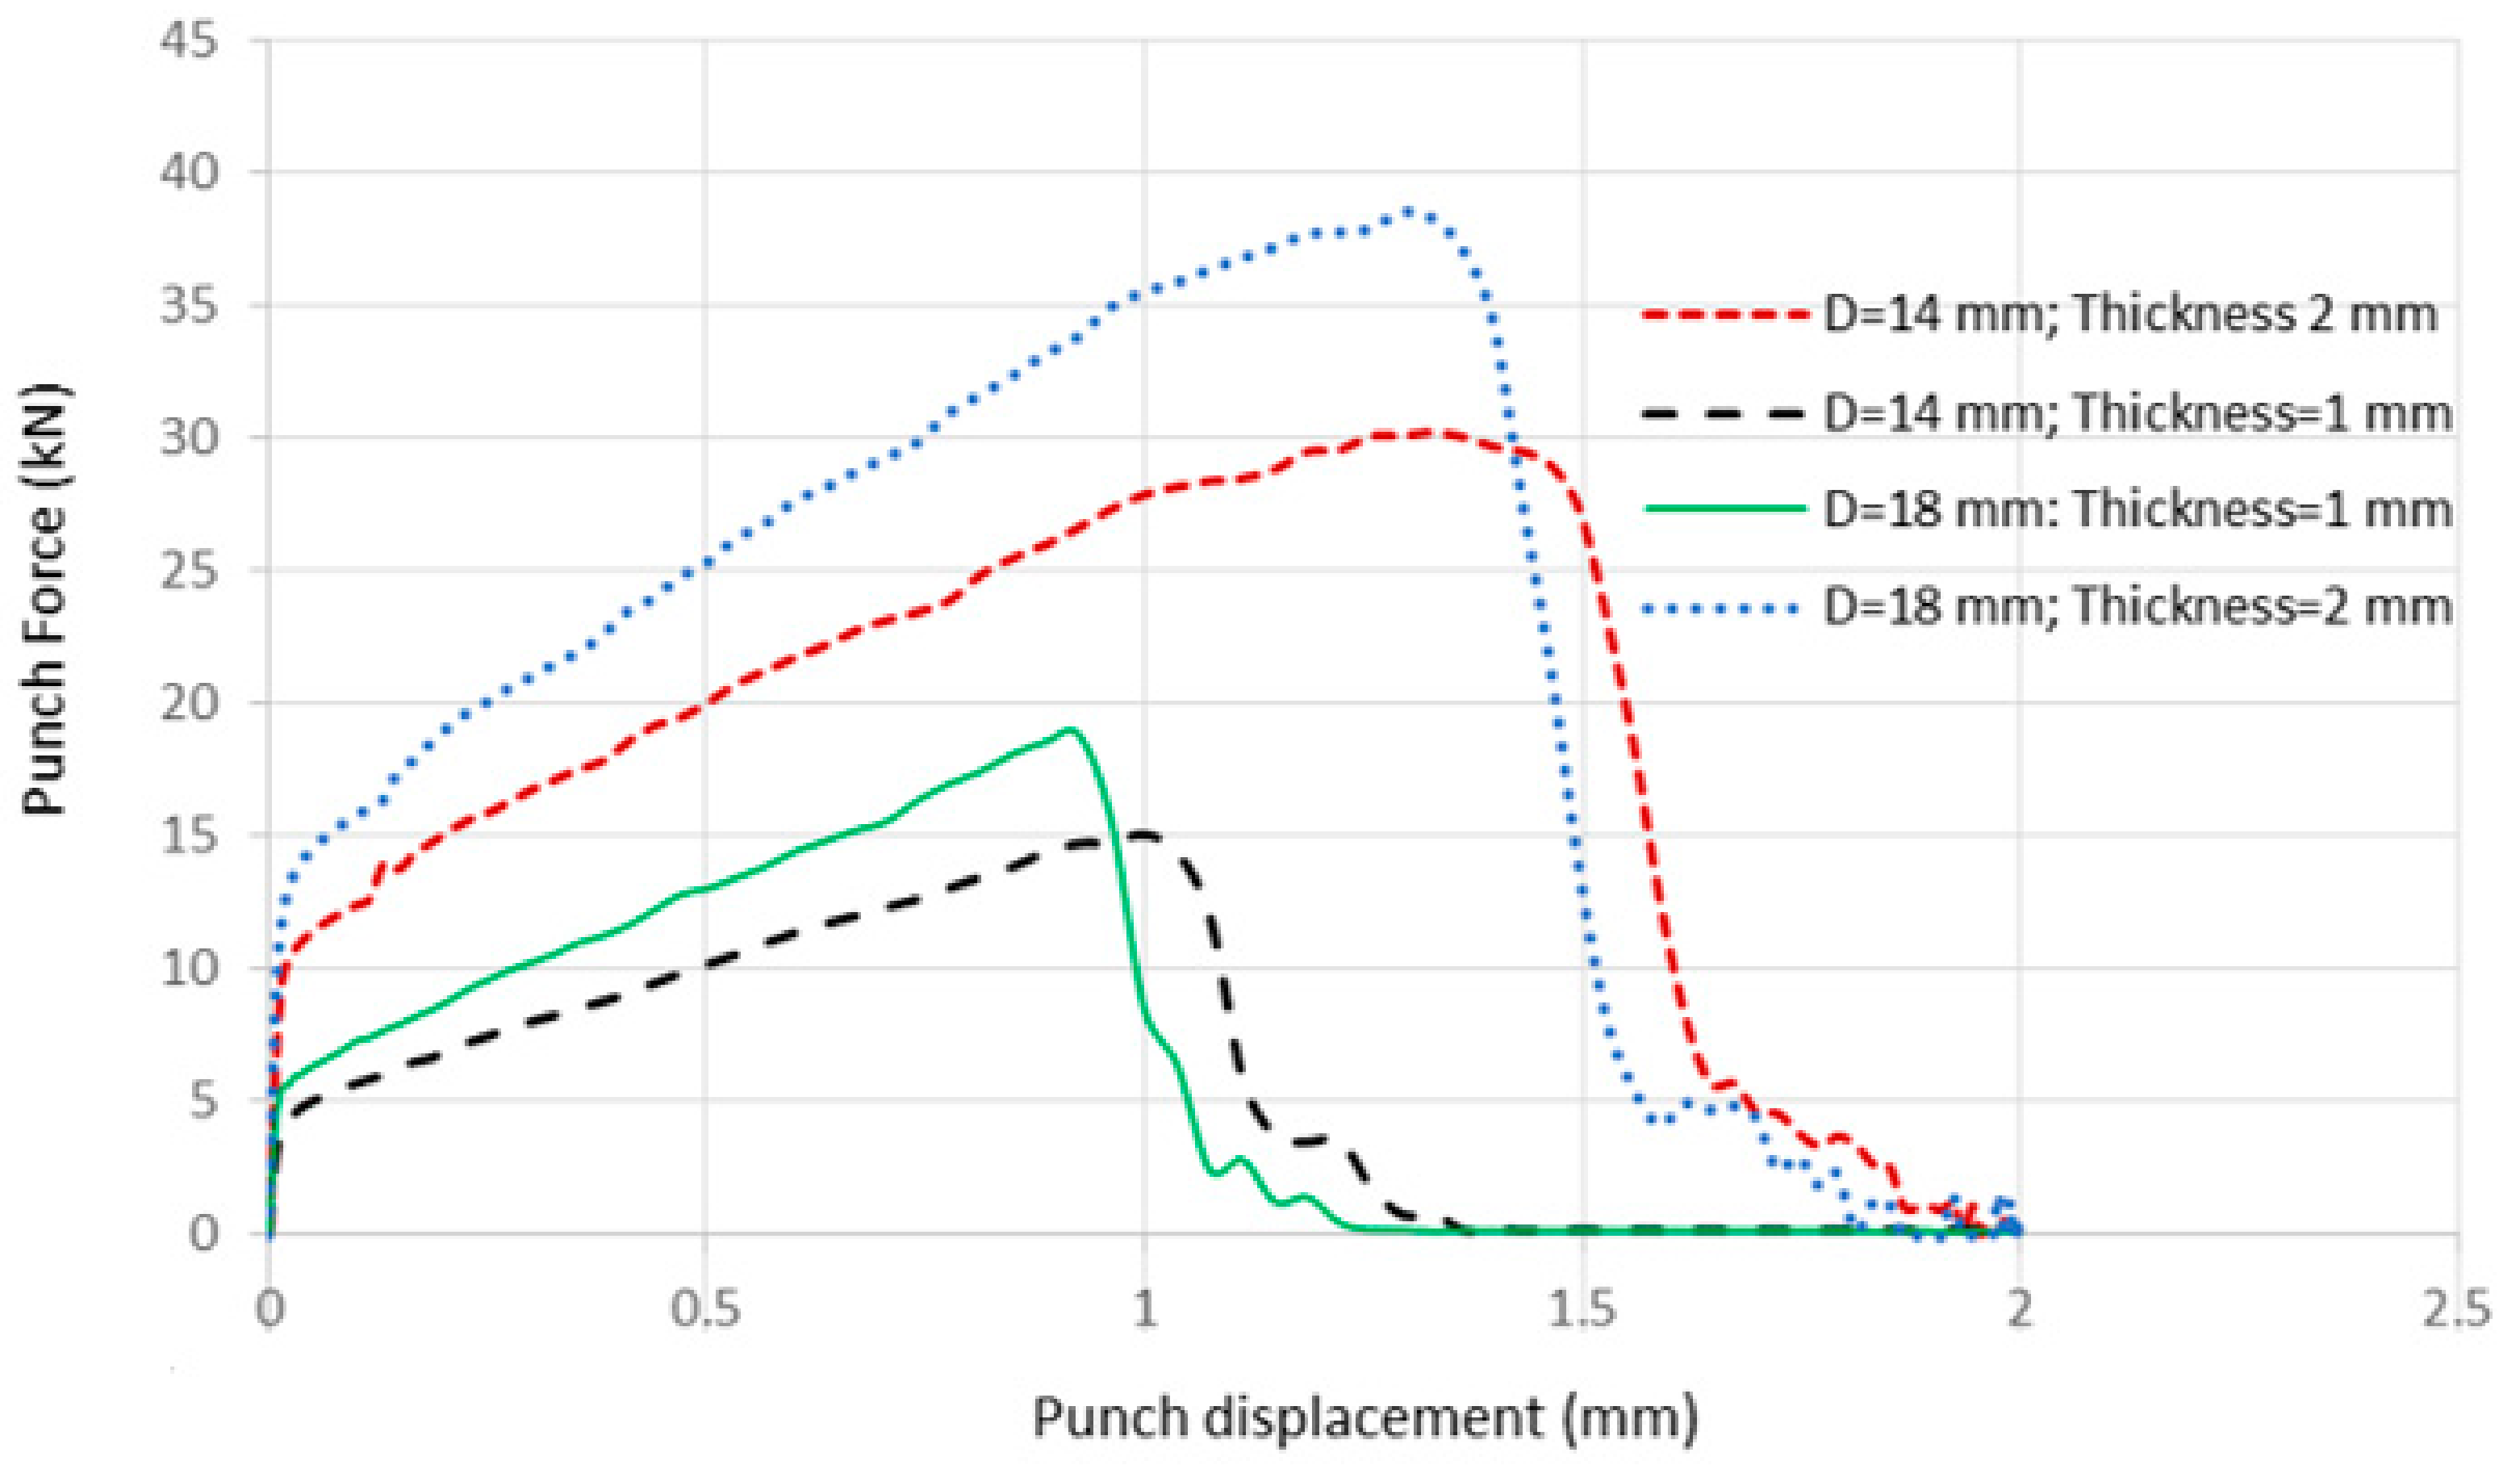
In order to analyze the influence of blanking parameters, which are the punch diameter, the clearance, and the sheet thickness, the force–displacement curves are illustrated in the following figures. Specifically,
Figure 11 depicts the effect of the sheet thickness, and
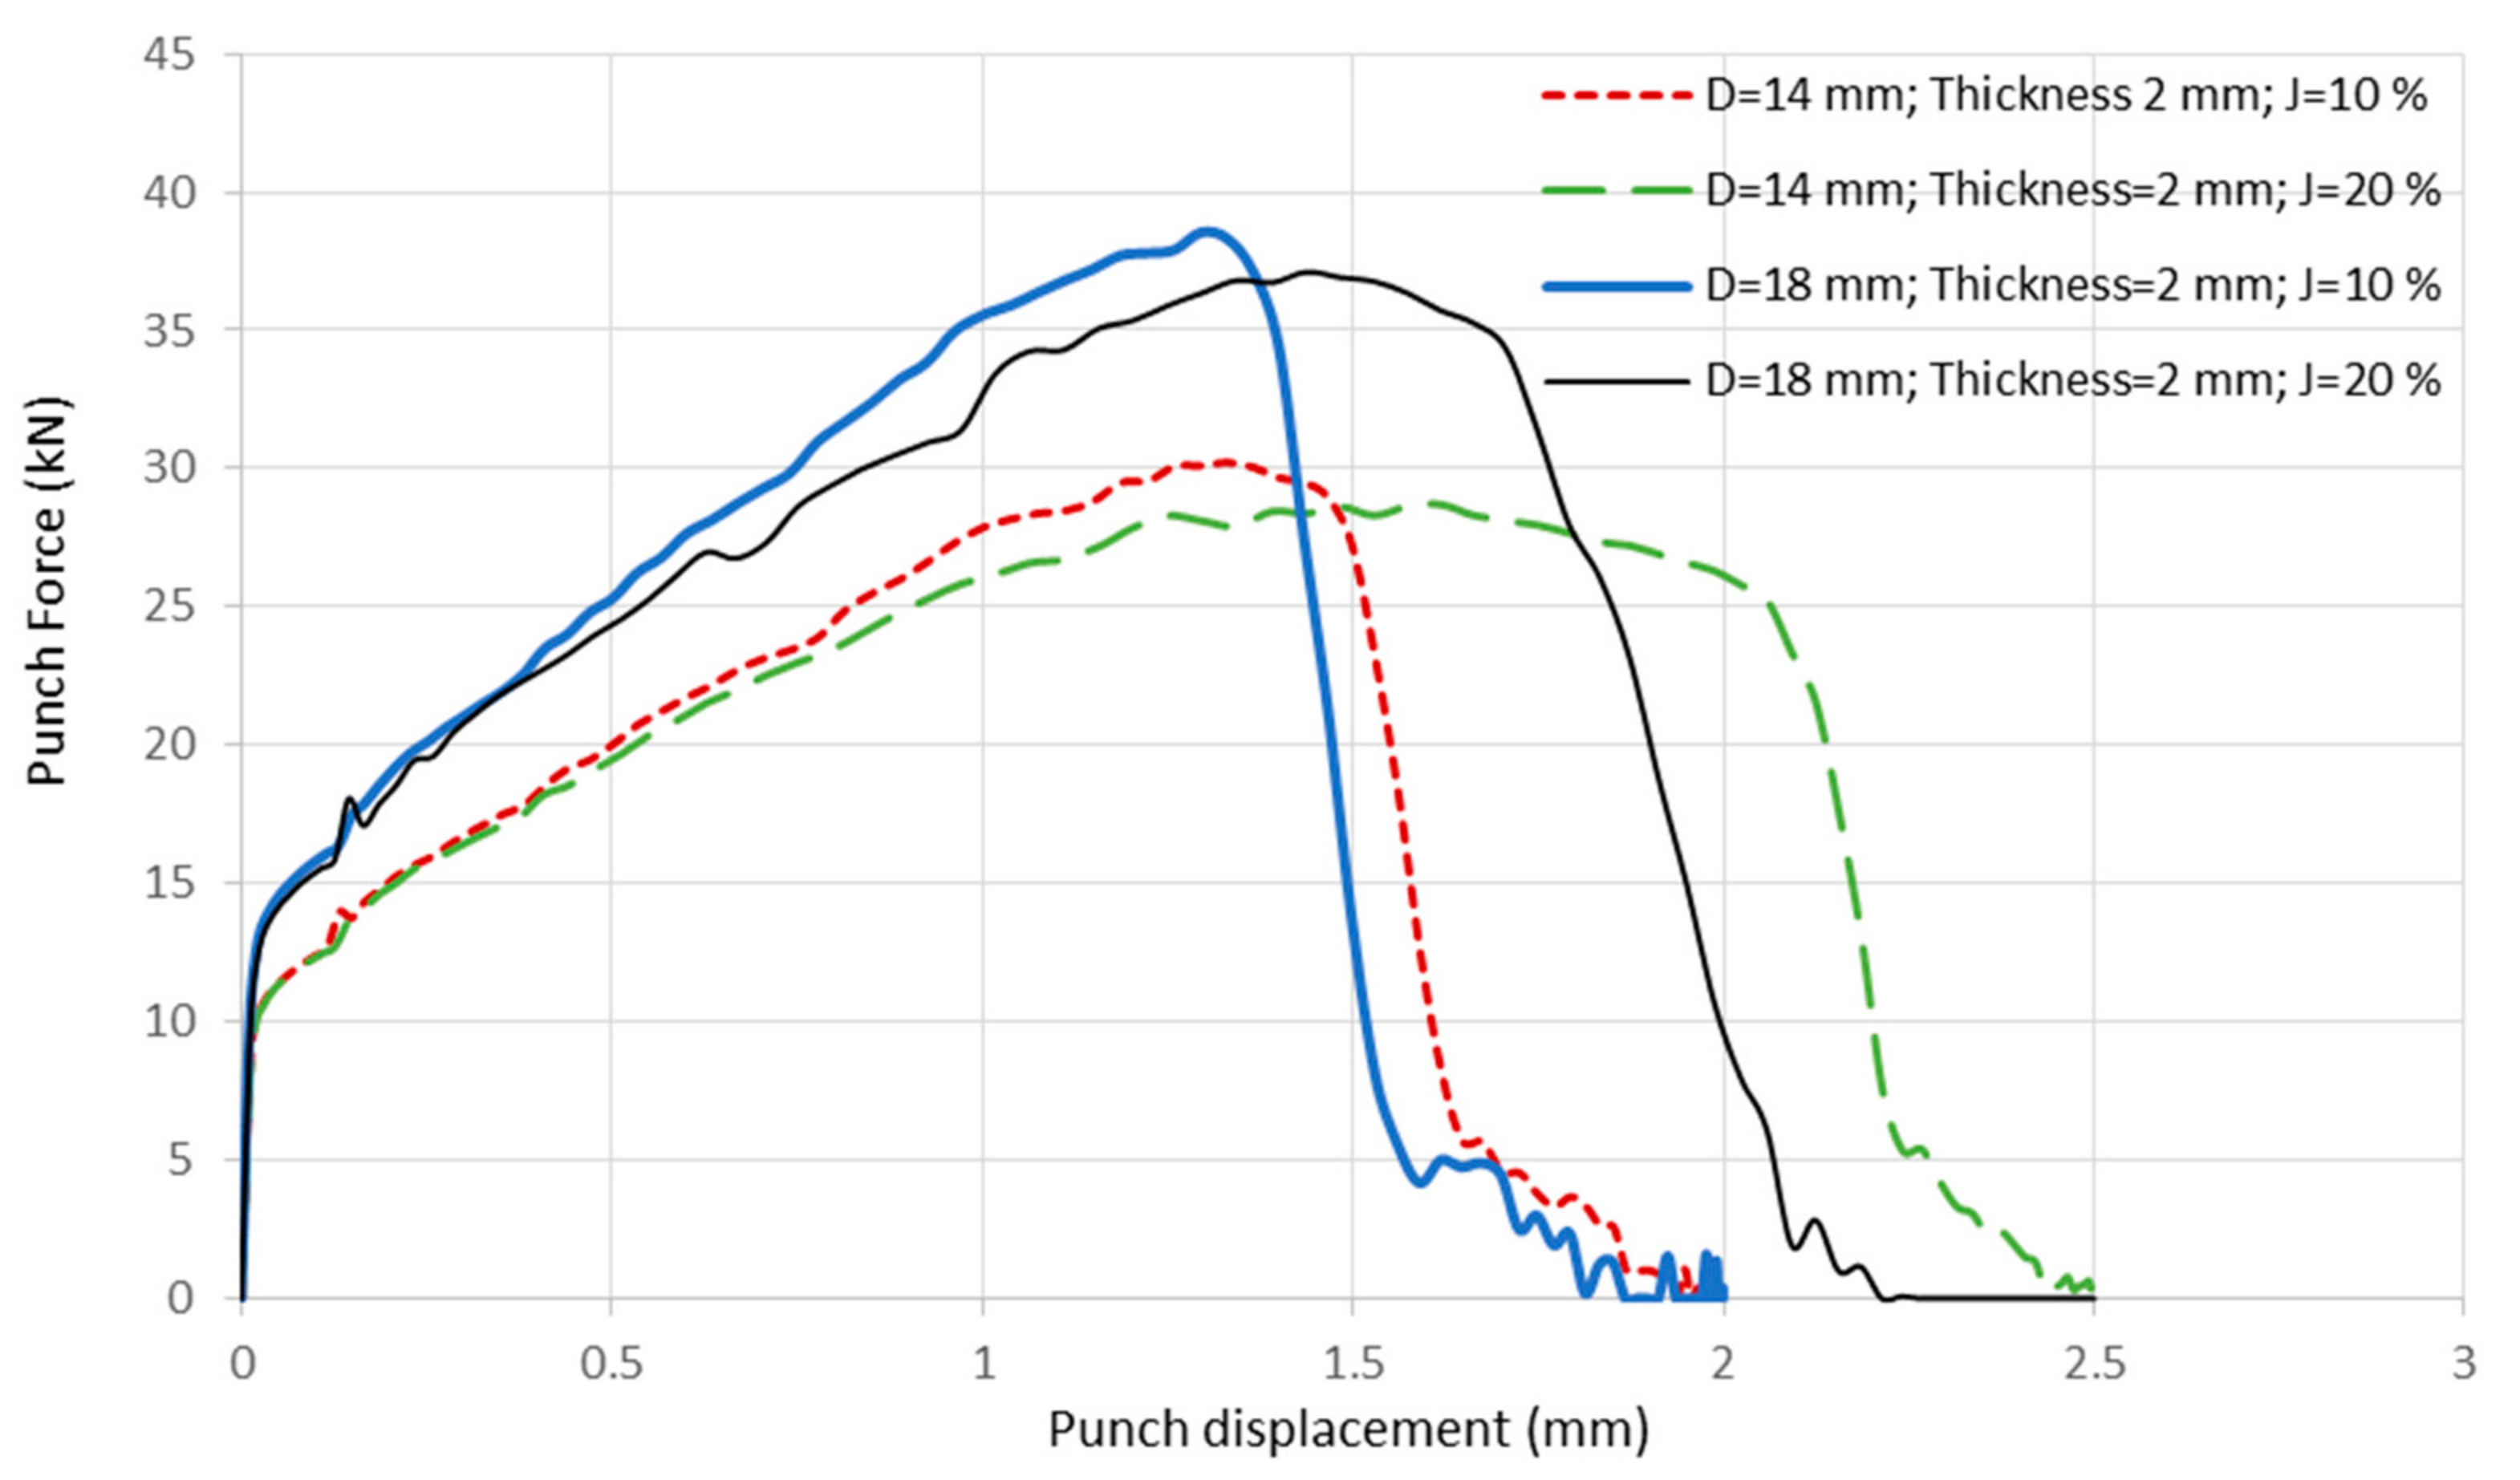
Figure 12 illustrates the effect of the punch diameter and clearance on the evolution of blanking force and on
Fmax.
The punch force versus punch displacement curves exhibit four distinct phases. Initially, there is the reversible deformation phase, characterized by a linear curve progression. Following this is the irreversible deformation phase with hardening, where the curve continues until reaching the maximum blanking force (Fmax). Beyond this point, the curve enters the plastic deformation with section reduction phase. Lastly, the curve demonstrates the initiation and propagation of macro cracks in the final zone.
The maximum force, Fmax, is directly proportional to the sheet thickness. Increasing the sheet thickness leads to a proportional increase in Fmax and results in increased punch displacement, ultimately causing the part to rupture. However, the effect of punch diameter is less significant compared to sheet thickness. Increasing the punch diameter results in a slight increase in Fmax and a slightly quicker rupture. In the same context, the clearance has a negligible effect on Fmax. This means that variations in clearance do not significantly affect the maximum force required for blanking.
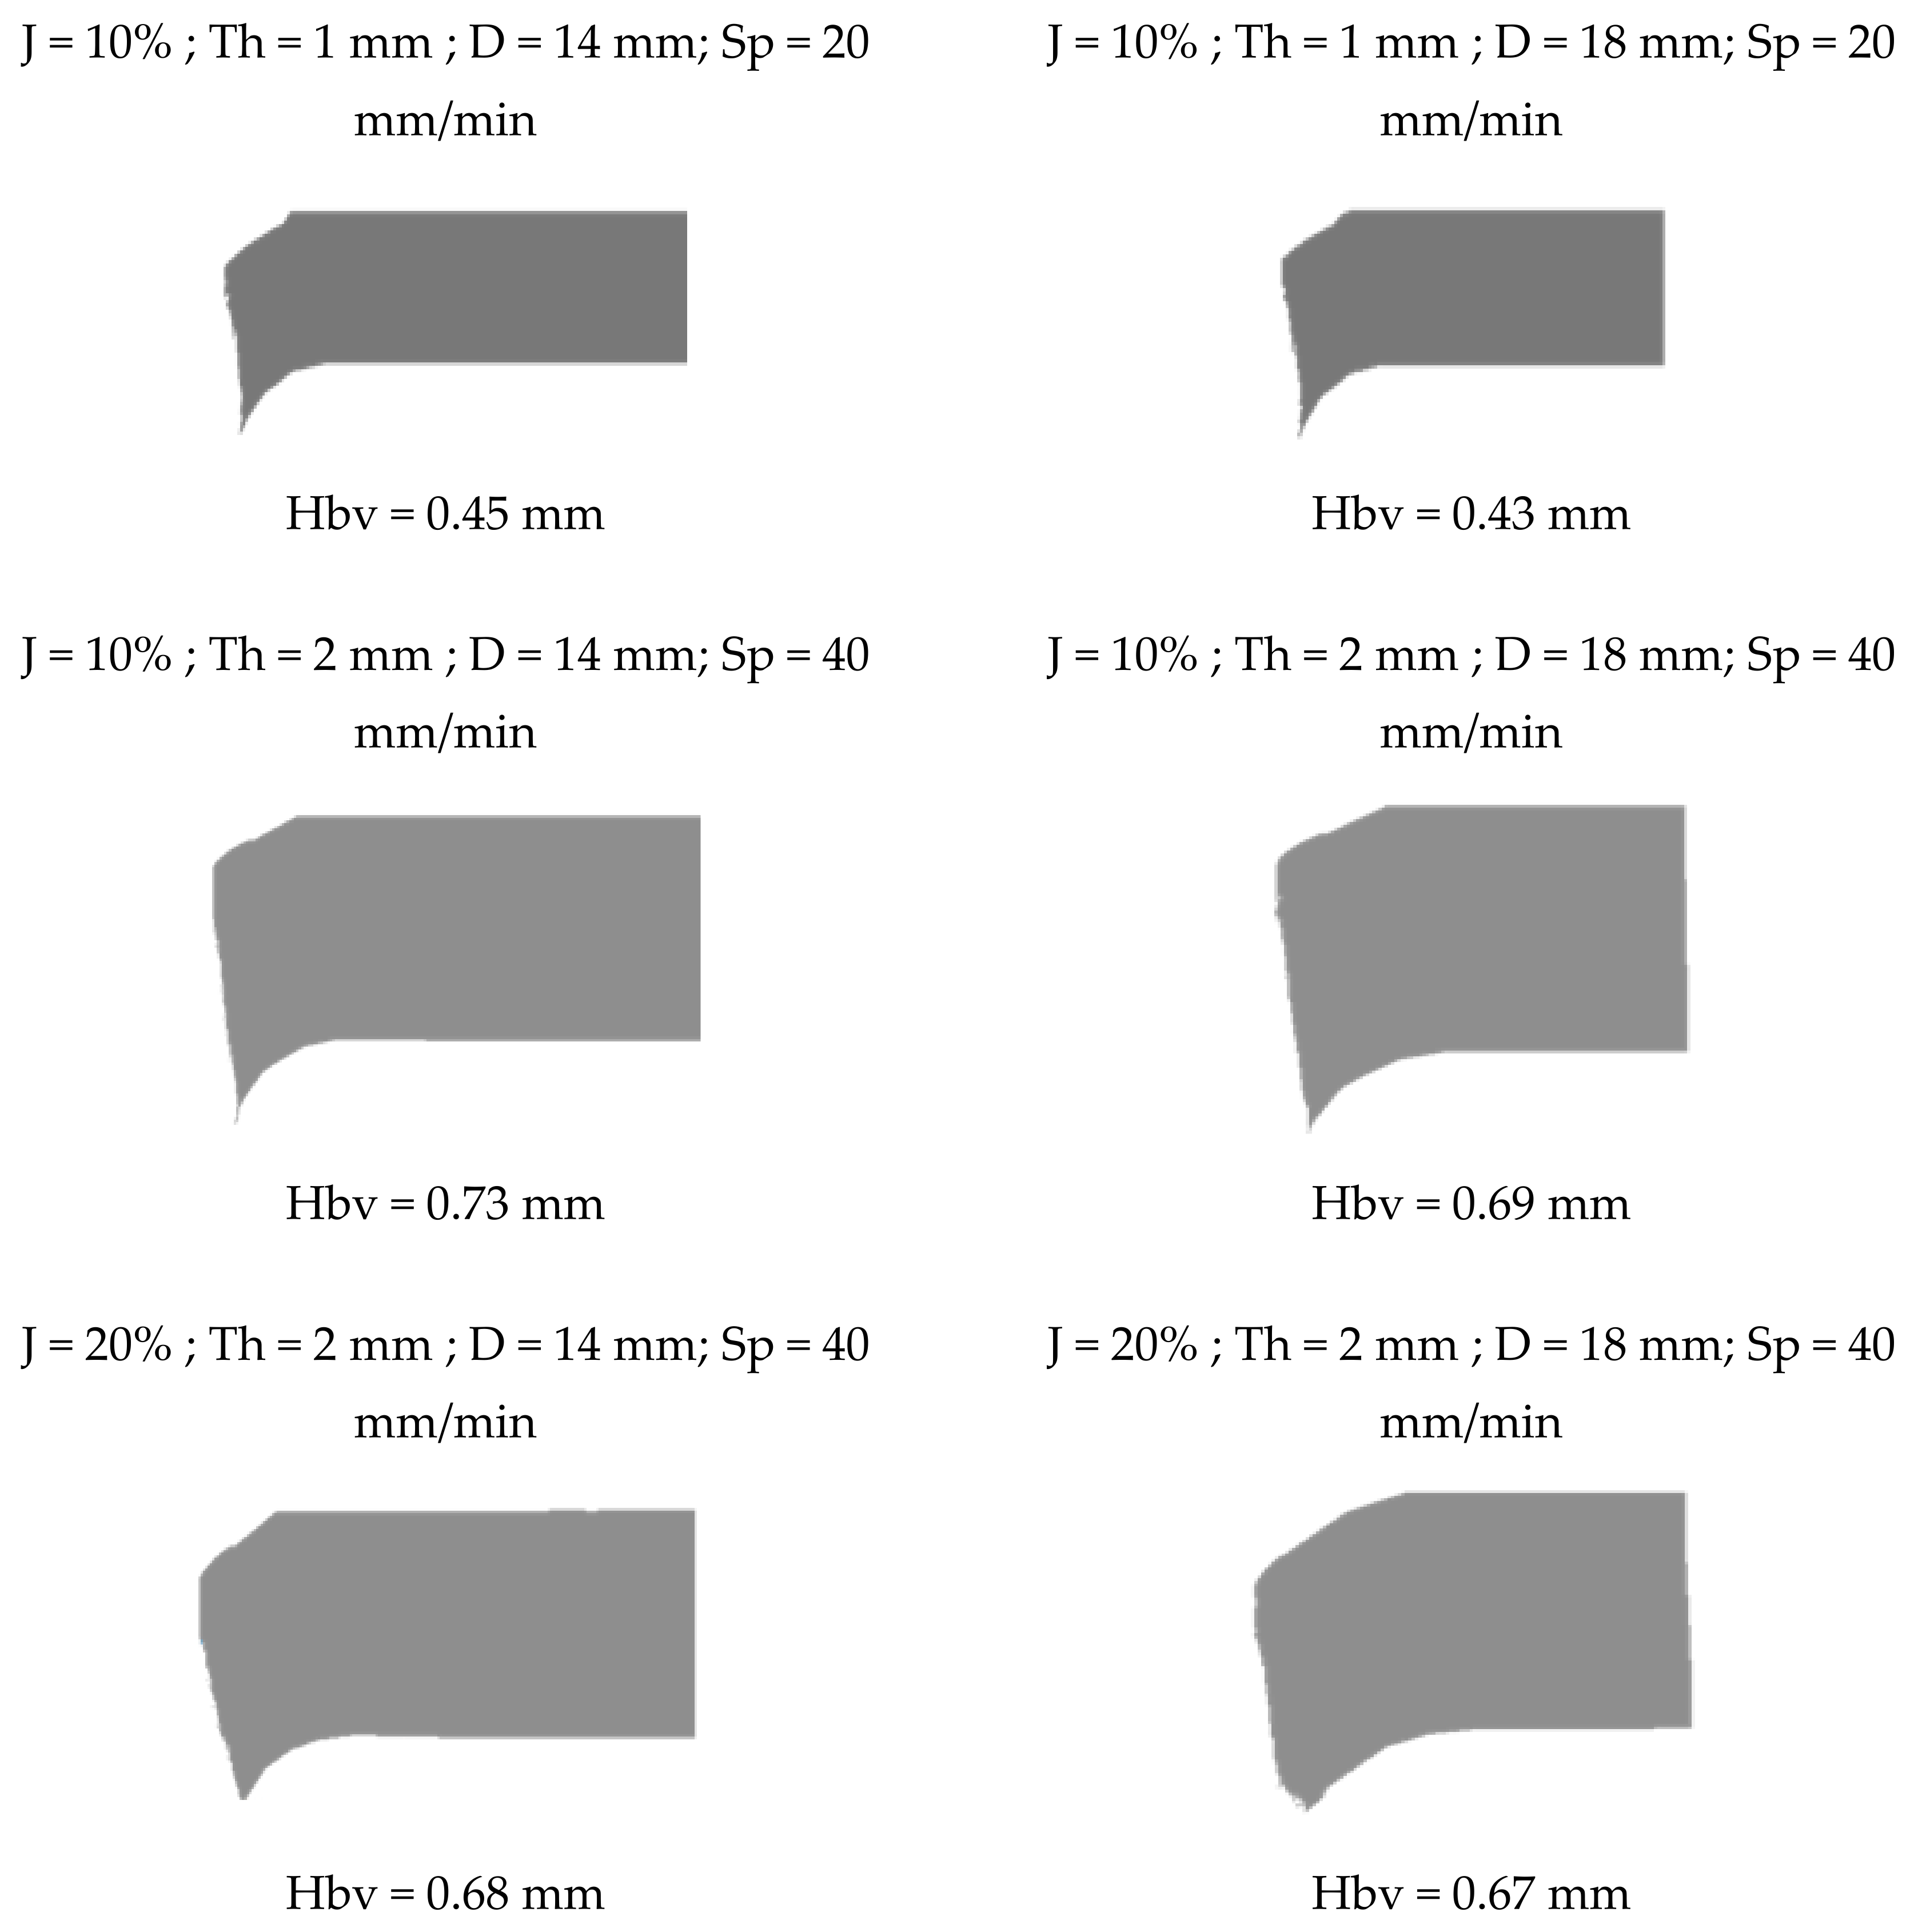
In addition, the second parameter we will analyze is the burr, which is denoted Hbv. This parameter has a notable influence on the exact geometry of the blanked parts. Burr formation can significantly affect the quality and precision of the finished parts, particularly in terms of edge roughness and dimensional accuracy. The computed
Hbv (
Figure 13) is determined.
Figure 14 shows the obtained
Hbv for different blanking parameters. These results will be compared with experimental results in order to prove the accuracy of numerical model.
With a high clearance (J) and a high punch diameter (D), the quality of the blanked surface is slightly ameliorated. In addition, the increase in the sheet thickness (Th) gives a worse quality.
Table 6 and
Table 7 show the comparison between experimental and numerical results in terms of
Hbv and
Fmax, respectively.
A low Error (%) between the Hbv measured and predicted indicates that the numerical model’s predictions closely align with the experimental results, signifying high accuracy and reliability in estimating the Hbv values for the blanking test.
A good agreement between the predicted and the experimental results of both blanking parameters proves the accuracy of the developed model in computing the sheet-blanking operation.
8. Conclusions
The main aim of this research is to investigate the effect of the experimental parameters on the workpiece burr (Hbv) and the maximum blanking force (Fmax). Firstly, a mathematical model for the mechanical aspects of the sheet blanking process was constructed. This model incorporates the modified Johnson–Cook hardening and damage models to characterize the mechanical response of S235 sheet steel. Importantly, it considers the strain rate field generated throughout the blanking process. Secondly, we determined the input factors, which are the punch speed, the punch diameter, the clearance between die and punch, and the sheet thickness that affect the two output measures. Thirdly, the numerical model was developed in order to support numerical and experimental findings. Modified Johnson–Cook models were used in this work. The plasticity law integrates strain hardening and strain rate effects in a multiplicative manner to provide a comprehensive representation of material responses to varying stress conditions. Furthermore, numerical parametric studies were conducted to predict how blanking parameters, in terms of the punch diameter, the clearance, and the sheet thickness, affect the geometrical defects of bar workpieces. These studies examine how the burr evolves and the quality of the sheared surface varies across different blanking parameters values. It was shown that these models exhibited good predictions for the two studied parameters (Hbv and Fmax).
Author Contributions
L.B.S.: Conceptualization, Methodology, Writing—Original draft preparation. T.K.: Software, visualization, Data curation, investigation. H.H.: Visualization, Writing—Review and Editing, Investigation. M.W.: Supervision, Conceptualization, Methodology, Writing—Review and Editing. All authors have read and agreed to the published version of the manuscript.
Funding
This research received no external funding.
Data Availability Statement
Data are contained within the article.
Conflicts of Interest
The authors declare no conflicts of interest.
References
- Gohil, A.; Modi, B. Review of the effect of process parameters on performance measures in the incremental sheet forming process. Proc. Inst. Mech. Eng. Part B J. Eng. Manuf. 2020, 235, 303–332. [Google Scholar] [CrossRef]
- Murugesan, M.; Jung, D.W. Johnson Cook material and failure model parameters estimation of AISI-1045 medium carbon steel for metal forming applications. Materials 2019, 12, 609. [Google Scholar] [CrossRef] [PubMed]
- Ben Fraj, B.; Kamoun, T.; Hentati, H.; Trabelsi, M.; Ghazouani, N.; Ahmed, M. Optimization of forming force and Erichsen index using Taguchi design of experiments: Mathematical models and experimental validation. Proc. Inst. Mech. Eng. Part B J. Eng. Manuf. 2023. [Google Scholar] [CrossRef]
- Moakhar, S.; Hentati, H.; Barkallah, M.; Louati, J.; Haddar, M.; Bonk, C.; Behrens, B.A. Modeling of the ductile damage-Application for bar shearing. Mater. Wiss. Werkstofftech. 2018, 50, 1353–1363. [Google Scholar] [CrossRef]
- Liu, K.; Jin, S.; Rui, Y.; Huang, J.; Zhou, Z. Effect of Lithology on Mechanical and Damage Behaviors of Concrete in Concrete-Rock Combined Specimen. Mathematics 2022, 10, 727. [Google Scholar] [CrossRef]
- Cazaubon, V.; Abi Akle, A.; Fischer, X. A Parametric Study of Additive Manufacturing Process: TA6V Laser Wire Metal Deposition. In Advances on Mechanics, Design Engineering and Manufacturing III; Springer: Cham, Switzerland, 2021; pp. 15–20. [Google Scholar] [CrossRef]
- Hsu, T.J.; Lai, W.H. Manufacturing parts optimization in the three—Dimensional printing process by the Taguchi method. J. Chin. Inst. Eng. 2010, 33, 121–130. [Google Scholar] [CrossRef]
- Islam, M.N. Effect of additional factors on dimensional accuracy and surface finish of turned parts. Mach. Sci. Technol. 2013, 17, 145–162. [Google Scholar] [CrossRef]
- Asiltürk, I.; Neşeli, S. Multi response optimisation of CNC turning parameters via Taguchi method-based response surface analysis. Measurement 2012, 45, 785–794. [Google Scholar] [CrossRef]
- Hambli, R. Design of Experiment Based Analysis for Sheet Metal Blanking Processes Optimisation. Int. J. Adv. Manuf. Technol. 2002, 19, 403–410. [Google Scholar] [CrossRef]
- Moakhar, S.; Hentati, H.; Barkallah, M.; Louati, J.; Haddar, M. Parametric study of aluminum bar shearing using Johnson-Cook material modeling. Proc. Inst. Mech. Eng. Part B J. Eng. Manuf. 2021, 235, 1399–1411. [Google Scholar] [CrossRef]
- Meslameni, W.; Ben Salem, C. Modeling of the springback in folding using the experimental design method. J. Appl. Res. Ind. Eng. 2021, 8, 290–308. [Google Scholar]
- Lange, K. Handbook of Metal Forming; McGraw–Hill: New York, NY, USA, 1985; ISBN 0-07-036285-8. [Google Scholar]
- Zhao, P.J.; Chen, Z.H.; Dong, C.F. Experimental and numerical analysis of micromechanical damage for DP600 steel in fine-blanking process. J. Mater. Process. Technol. 2016, 236, 16–25. [Google Scholar] [CrossRef]
- Zhou, J.; Gao, X.; Sobotka, J.C.; Webler, B.A.; Cockeram, B.V. On the extension of the Gurson-type porous plasticity models for prediction of ductile fracture under shear-dominated conditions. Int. J. Solids Struct. 2014, 51, 3273–3291. [Google Scholar] [CrossRef]
- Lemaitre, J. A continuous damage mechanics model for ductile fracture. J. Eng. Mater. Technol. 1985, 107, 83–89. [Google Scholar] [CrossRef]
- Gurson, A.L. Continuum Theory of Ductile Rupture by Void Nucleation and Growth: Part I-Yield Criteria and Flow Rules for Porous Ductile Media. ASME J. Eng. Mater. Technol. 1977, 99, 2–15. [Google Scholar] [CrossRef]
- Winter, S.; Nestler, M.; Galiev, E.; Hartmann, F.; Psyk, V.; Kräusel, V.; Dix, M. Adiabatic Blanking: Influence of Clearance, Impact Energy, and Velocity on the Blanked Surface. J. Manuf. Mater. Process. 2021, 5, 35. [Google Scholar] [CrossRef]
- Moakhar, S.; Hentati, H.; Barkallah, M.; Louati, J.; Bonk, C.; Behrens, B.A.; Haddar, M. Evaluation of AW-6082 Aluminium Bar Shearing Simulation. In Advances in Materials, Mechanics and Manufacturing; Springer: Berlin/Heidelberg, Germany, 2020. [Google Scholar] [CrossRef]
- Akyürek, F.; Yaman, K.; Tekiner, Z. An experimental work on tool wear affected by die clearance and punch hardness. Arab. J. Sci. Eng. 2017, 42, 4683–4692. [Google Scholar] [CrossRef]
- Lawanwong, K.; Pumchan, W. Wear mechanism and ability for recovery of tool steel on blanking die process. Key Eng. Mater. 2017, 725, 572–577. [Google Scholar] [CrossRef]
- Mucha, J.; Tutak, J. Analysis of the Influence of Blanking Clearance on the Wear of the Punch, the Change of the Burr Size and the Geometry of the Hook Blanket in the Hardened Steel Sheet. Materials 2019, 12, 1261. [Google Scholar] [CrossRef] [PubMed]
- Maiti, S.; Ambekar, A.; Singh, U.; Date, P.; Narasimhan, K. Assessment of influence of some process parameters on sheet metal blanking. J. Mater. Process. Technol. 2000, 102, 249–256. [Google Scholar] [CrossRef]
- Guo, W.; Tam, H.Y. Effects of extended punching on wear of the WC/Co micropunch and the punched microholes. Int. J. Adv. Manuf. Technol. 2012, 9, 955–960. [Google Scholar] [CrossRef]
- Slavic, J.; Bolka, Š.; Bratuš, V.; Boltežar, M. A novel laboratory blanking apparatus for the experimental identification of blanking parameters. J. Mater. Process. Technol. 2014, 2, 507–513. [Google Scholar] [CrossRef]
- Hatanaka, N.; Yamaguchi, K.; Takakura, N.; Iizuka, T. Simulation of sheared edge formation process in blanking of sheet metals. J. Mater. Process. Technol. 2003, 140, 628–634. [Google Scholar] [CrossRef]
- Gréban, F.; Monteil, G.; Roizard, X. Influence of the structure of blanked materials upon the blanking quality of copper alloys. J. Mater. Process. Technol. 2007, 186, 27–32. [Google Scholar] [CrossRef]
- Johnson, G.R.; Cook, W.H. A constitutive model and data for metals subjected to large strains, high strain rates and high temperatures. In Proceedings of the 7th International Symposium on Ballistics, The Hague, The Netherlands, 19–21 April 1983. [Google Scholar]
- Johnson, G.R.; Cook, W.H. Fracture characteristics of three metals subjected to various strains, strain rates, temperatures and pressures. Eng. Fract. Mech. 1985, 21, 31–48. [Google Scholar] [CrossRef]
- Goijaerts, A.M.; Govaert, L.E.; Baaijens, F.P.T. Experimental and numerical investigation on the influence of process speed on the blanking process. J. Manuf. Sci. Eng. 2002, 124, 416–419. [Google Scholar] [CrossRef]
- Chan, H.Y.; Abdullah, A.B. Geometrical Defect in Precision Blanking/Punching: A Comprehensive Review on Burr Formation. RJASET 2014, 8, 1139–1148. [Google Scholar] [CrossRef]
- Fan, W.F.; Feng, L. Study on Blanking Force of Fine-Blanking with Negative Clearance and Common Blanking for AISI-1045 through Simulation and Experiment Methods. Mater. Sci. Forum 2011, 704–705, 1175–1179. [Google Scholar] [CrossRef]
Figure 1.
Experimental set-up of tensile test.
Figure 1.
Experimental set-up of tensile test.
Figure 2.
Experimental blanking tool: (a) tools and strip during blanking test; (b) 3D design of blanking tool.
Figure 2.
Experimental blanking tool: (a) tools and strip during blanking test; (b) 3D design of blanking tool.
Figure 3.
Friction models in blanking process.
Figure 3.
Friction models in blanking process.
Figure 4.
Blanking burr during cutting operation.
Figure 4.
Blanking burr during cutting operation.
Figure 5.
Variation of Hbv as a function of blanking parameters.
Figure 5.
Variation of Hbv as a function of blanking parameters.
Figure 6.
Variation of Fmax as a function of blanking parameters.
Figure 6.
Variation of Fmax as a function of blanking parameters.
Figure 7.
Tensile test specimens: (a) mesh size; (b) experimental test (V = 500 mm/min); (c) numerical test (V = 500 mm/min); (d) equivalent plastic strain distribution.
Figure 7.
Tensile test specimens: (a) mesh size; (b) experimental test (V = 500 mm/min); (c) numerical test (V = 500 mm/min); (d) equivalent plastic strain distribution.
Figure 8.
Comparison between predicted and experimental results in tensile test: true stress–strain curve.
Figure 8.
Comparison between predicted and experimental results in tensile test: true stress–strain curve.
Figure 9.
Numerical model sheet blanking operation.
Figure 9.
Numerical model sheet blanking operation.
Figure 10.
Numerical results: (a) damage fields, (b) strain fields.
Figure 10.
Numerical results: (a) damage fields, (b) strain fields.
Figure 11.
Thickness effect: punch force vs. punch displacement for j = 10%.
Figure 11.
Thickness effect: punch force vs. punch displacement for j = 10%.
Figure 12.
Clearance and punch diameter effects: punch force vs. punch displacement.
Figure 12.
Clearance and punch diameter effects: punch force vs. punch displacement.
Figure 14.
Predicted Hbv with different blanking parameters.
Figure 14.
Predicted Hbv with different blanking parameters.
Table 1.
Specification of the S235 steel grade [
3].
Table 1.
Specification of the S235 steel grade [
3].
| %C | %Mn | %P | %S | %Si |
|---|
| 0.22 max | 1.6 max | 0.05 max | 0.05 max | 0.05 max |
Table 2.
Blanking parameters.
Table 2.
Blanking parameters.
| Blanking Parameters | Sheet Thickness
Th (mm) | Punch Diameter
D (mm) | Speed
Sp (mm/min) | Clearance
J (%) |
|---|
| Value | 1 | 2 | 14 | 18 | 20 | 40 | 10 | 20 |
Table 3.
Experimental results of blanking tests.
Table 3.
Experimental results of blanking tests.
| Sp (mm/min) | J (%) | Th (mm) | D (mm) | Average of Hbv (mm) | Standard Deviation of Hbv (mm) | Average of Fmax (kN) | Standard Deviation of Fmax (kN) |
|---|
| 20 | 10 | 1 | 14 | 0.46 | 0.05 | 15.33 | 1.19 |
| 40 | 10 | 2 | 14 | 0.74 | 0.06 | 31.87 | 1.3 |
| 40 | 20 | 2 | 14 | 0.64 | 0.06 | 31.61 | 2.75 |
| 20 | 10 | 1 | 18 | 0.37 | 0.04 | 18.55 | 1.31 |
| 40 | 10 | 2 | 18 | 0.65 | 0.03 | 42.16 | 2.06 |
| 40 | 20 | 2 | 18 | 0.63 | 0.04 | 41.91 | 2.77 |
| 40 | 10 | 1 | 18 | 0.31 | 0.02 | 19.25 | 0.75 |
Table 4.
Mechanical properties and plasticity parameters of modified Johnson–Cook model.
Table 4.
Mechanical properties and plasticity parameters of modified Johnson–Cook model.
| E (GPa) | ν | A (MPa) | B (MPa) | n | C | |
|---|
| 200 | 0.3 | 215 | 510 | 0.63 | 0.025 | 0.00056 |
Table 5.
Damage parameters of modified Johnson–Cook model.
Table 5.
Damage parameters of modified Johnson–Cook model.
| D1 | D2 | D3 | D4 |
|---|
| 0.03 | 0.13 | −0.95 | 0.036 |
Table 6.
Comparison between Hbv measured and Hbv predicted.
Table 6.
Comparison between Hbv measured and Hbv predicted.
| Hbv Measured (mm) | Hbv Predicted (mm) | Error (%) |
|---|
| 0.46 | 0.45 | 2.17% |
| 0.74 | 0.73 | 1.35% |
| 0.64 | 0.68 | 6.25% |
| 0.37 | 0.43 | 16.21% |
| 0.65 | 0.69 | 6.15% |
| 0.63 | 0.67 | 6.35% |
Table 7.
Comparison between Fmax measured and Fmax predicted.
Table 7.
Comparison between Fmax measured and Fmax predicted.
| Fmax Measured (kN) | Fmax Predicted (kN) | Error (%) |
|---|
| 15.33 | 15.10 | 1.50% |
| 31.87 | 30.50 | 4.30% |
| 31.61 | 28.50 | 9.84% |
| 18.55 | 18.65 | 0.54% |
| 42.16 | 38.90 | 7.73% |
| 41.91 | 37.35 | 10.88% |
| Disclaimer/Publisher’s Note: The statements, opinions and data contained in all publications are solely those of the individual author(s) and contributor(s) and not of MDPI and/or the editor(s). MDPI and/or the editor(s) disclaim responsibility for any injury to people or property resulting from any ideas, methods, instructions or products referred to in the content. |
© 2024 by the authors. Licensee MDPI, Basel, Switzerland. This article is an open access article distributed under the terms and conditions of the Creative Commons Attribution (CC BY) license (https://creativecommons.org/licenses/by/4.0/).


