1. Introduction
Bladder cancer is one of the most common malignant tumors of the urinary system [
1]. The early screening of bladder cancer is of great significance for the treatment of patients. Cystoscopy is currently the gold standard for screening bladder tumors. Under cystoscopy, urologists can detect bladder tumors and completely remove all visible tumors in the bladder through transurethral resection of bladder tumor (TURBT) [
2]. However, the detection of bladder tumors heavily relies on visual examination by doctors, which is cumbersome and subjective, and it is estimated that up to 20% of bladder tumors are overlooked in cystoscopy [
3]. Bladder tumor segmentation based on deep learning algorithms is an important technology in medical-assisted diagnosis, which can automatically and accurately locate tumors, help doctors improve detection accuracy, and save time and cost. However, as shown in
Figure 1, bladder tumors vary in shape and size, with uneven brightness; automatically and accurately segmenting bladder tumors is a challenging task.
With the rapid development of artificial intelligence technology, deep learning algorithms have been widely applied in medical image segmentation. The existing deep-learning-based medical image segmentation methods can be roughly divided into three types: CNN-based methods, Transformer-based methods, and CNN–Transformer hybrid methods.
Compared to traditional image segmentation methods, convolutional neural networks (CNNs) perform better. Shelhamer et al. [
4] proposed fully convolutional networks (FCNs), which achieved excellent performance in image semantic segmentation tasks. Ronneberger et al. modified FCNs and proposed UNet [
5], with a U-shaped architecture, which was the first medical image segmentation model based on an encoder–decoder structure. Subsequently, many UNet variant models (UNet++ [
6], ResUNet [
7], ResUNet++ [
8], and DoubleUNet [
9]) emerged to improve segmentation accuracy. However, as the feature scale of these models gradually decreases during the encoding stage, some detailed information is lost. Although attempts are made to supplement the lost detailed information during the decoding stage, the semantic gap between the encoder and decoder, as well as the issue of background noise, still exists. Recently, PraNet [
10], ACSNet [
11], HarDNet-MSEG [
12], CaraNet [
13], DCRNet [
14], FTMFNet [
15], and FRBNet [
16] have gradually emerged, further improving the accuracy of medical image segmentation. These methods all use CNNs as the backbone to extract features and combine some fine modules for feature enhancement, performing well in extracting local detail information. However, because the convolution operation is essentially a local operation, these CNN-based methods have a relatively weak ability to capture global information and may result in incomplete segmentation results. Especially for lesions with significant differences in size, shape, and texture, CNN-based methods make it difficult to extract the appearance features of lesions and are prone to overfitting.
The emergence of Vision Transformer [
17] overcame the limitations of CNNs in capturing remote dependencies. Unlike CNNs, Transformers use multi-head self-attention (MHSA) to capture remote dependencies in images, and then, generate global contextual information based on these remote dependencies. ViT [
17] is the first transformer-based image recognition model. ViT divides each image into fixed-sized patches and models the remote dependencies of each patch to generate global information. Subsequently, PVT [
18], Twins [
19], Swin Transformer [
20], and PVT v2 [
21] gradually emerged, and these Transformer-based backbone networks further improved the segmentation performance. However, these backbone networks can only perform well when trained on large datasets, and their segmentation performance is limited when trained on small medical datasets. Recently, Poly-PVT [
22], SSFormer [
23], HSNet [
24], MSRAformer [
25], PVT-CASCADE [
26], and CAFE-Net [
27] overcame this limitation by using transformer weights pre-trained on other non-medical big datasets, such as ImageNet [
28]. Due to their expertise in capturing global contextual information, these methods perform well in medical image segmentation tasks. However, these Transformer-based methods have limitations in restoring fine-grained detail information and local boundary information of features and have limited adaptability to multi-scale features of lesions.
To combine the advantages of CNNs and Transformer, some CNN–Transformer hybrid methods [
29,
30,
31,
32] directly combine CNN and Transformer backbone networks. However, these methods only structurally combine CNNs and Transformer, ignoring the interaction between the two semantics. The more obvious disadvantage is the large computational load and high computational complexity.
To automatically and accurately segment bladder tumors in cystoscopy images, this paper proposes a new multi-scale detail-enhanced reverse attention network MDER-Net based on Transformer, aiming to capture the multi-scale global and local detail features of bladder tumors. We choose PVT v2 [
21] as the encoder to capture global contextual information. Subsequently, the proposed multi-scale efficient channel attention module (MECA) is utilized to process the four different levels of features extracted by the encoder. Multi-scale feature information is extracted through convolutions of different kernel sizes, and trainable weight parameters and an ECA module [
33] are used to suppress information gaps caused by different receptive fields, fuse feature information, enhance valuable information, and obtain multi-scale features with channel weight information to adapt to changes in the size and morphology of bladder tumors. Next, using a DA module [
12], the second, third, and fourth layers of multi-scale advanced features are aggregated through step-by-step fusion to locate the approximate location of the bladder tumor and generate a rough initial segmentation map. Due to the rich texture, color, and edge detail information contained in low-level features, we use the SAM module [
22] to fuse the feature map, which can roughly locate the bladder tumor with the lowest-level features, complementing each other in position and detail information, and generating a global prediction map containing detail information. Next, the proposed new detail-enhanced reverse attention module (DERA) is utilized to supplement fine-grained detail information from low-level features to high-level features, and then, extract local feature details from each level of fused features, gradually supplementing them to the global prediction map from the previous stage. In addition, before extracting local detail features from the lowest-level features, we propose a new and efficient channel space attention module (ECSA) to suppress irrelevant information in the bottom-level features, capture bladder tumor details from both the channel and spatial dimensions, enhance local context, and further extract edge detail information by inputting it into an RA module [
34]. MDER-Net achieves accurate localization of bladder tumors by mixing six deep supervisions, ranging from locating the approximate location of tumors to supplementing detailed information to repairing tumor boundary information. On the bladder tumor dataset BtAMU, established in this article, our method outperforms other state-of-the-art (SOTA) segmentation methods in the mDice, mIoU, MAE, accuracy,
, and HD metrics, with mDice and mIoU reaching 0.9108 and 0.8543, respectively; meanwhile, our method’s visual segmentation results are also superior to other SOTA methods. On five publicly available polyp datasets (Kvasir-SEG [
35], CVC- ClinicDB [
36], CVC-ColonDB [
37], ETIS [
38], and CVC-300), our method consistently achieved SOTA segmentation performance in the mDice, mIoU, and HD metrics, especially on the CVC-300 dataset, where MDER-Net’s mDice and mIoU results improved by 3.03% and 3.08%, respectively, on those of MSRAformer [
25].
The main contributions of this article are as follows:
A new Transformer-based network architecture MDER-Net is proposed, which can capture multi-scale global features of bladder tumors and enhance local feature representation.
A new multi-scale efficient channel attention module (MECA) is proposed, which improves the network’s multi-scale adaptability to lesions, enabling it to adapt to various changes in the size and morphology of bladder tumors, and improving its generalization ability.
A new detail-enhanced reverse attention module (DERA) is proposed, which restores fine-grained detail information and local boundary information of features, and can help the network generate prediction masks containing clear tumor boundaries, solving the problem of the Transformer’s insufficient ability to recover local detail features.
A new efficient channel space attention module (ECSA) is proposed, which can reduce the impact of noise and irrelevant information in low-level features, more effectively preserve bladder tumor details in different dimensions of low-level features, and improve segmentation performance.
A new bladder tumor dataset, BtAMU, is established, which contributes to the development of state-of-the-art (SOTA) semantic segmentation algorithms on images captured by cystoscopys.
3. Proposed Method
In this section, we first describe the overall architecture of the proposed MDER-Net, then provide a detailed introduction to the Transformer encoder PVT v2 [
21] and the proposed new multi-scale efficient channel attention module (MECA), detail enhanced reverse attention module (DERA), and efficient channel spatial attention module (ECSA). Finally, we provide a loss function for training the network.
3.1. Overall Architecture
The overall architecture of our proposed MDER-Net is shown in
Figure 2, which includes six modules: multi-scale effective channel attention module (MECA), dense aggregation module (DA) [
12], similarity aggregation module (SAM) [
22], detail-enhanced reverse attention module (DERA), efficient channel space attention module (ECSA), and reverse attention module (RA) [
34].
Specifically, given an input image
, we extract four pyramid features
from the PVT v2 [
21] backbone, where
,
,
, and
is the channel dimension of the
ith layer. PVT v2, as an encoder, can capture global contextual information and establish remote dependency relationships. Then, we input four pyramid features
into the MECA module to obtain multi-scale features
with channel weight information; compared with
,
is more adaptable to changes in the size and morphology of bladder tumors. The DA module [
12] receives three multi-scale advanced features,
, and aggregates them to generate an initial global prediction map D6. D6 can only capture the relatively rough position of the bladder tumor without structural details. Next, we send the coarse segmentation result D6 and the multi-scale low-level feature
, containing rich texture, color, and edge detail information, to the SAM module [
22], generating a global feature map D5 containing detailed information. Next, we input
into three DERA modules in sequence;
is used to provide more low-level detail information to each high-level feature
. The DERA module uses the global feature map
from the previous layer to sequentially delete the current predicted bladder tumor area, capture fine-grained detail information and local boundary information, and then, integrate this information into
to obtain a predicted image
containing the details of the bladder tumor edge structure. Next, we input the low-level feature
into the ECSA module, and then, input the low-level features that suppress noise and irrelevant information and
into the RA module [
34]. We further refine the edge detail information and integrate it into
to obtain the final predicted image
. During the training process, we perform mixed supervision on the prediction map
generated in six stages. The overall network structure of MDER-Net is defined as follows:
3.2. Transformer Encoder PVT v2
Recent studies [
55] have shown that Visual Transformers have a stronger ability to capture remote dependency relationships than CNNs. Inspired by this, we use PVT v2 [
21] as an encoder to extract global information, obtaining four different levels of pyramid features from PVT v2. Among them,
is considered a low-level feature, which contains rich texture, color, and edge details, as well as more noise and irrelevant information;
are considered high-level features that contain more feature information that can locate bladder tumors.
3.3. Multi-Scale Effective Channel Attention Module
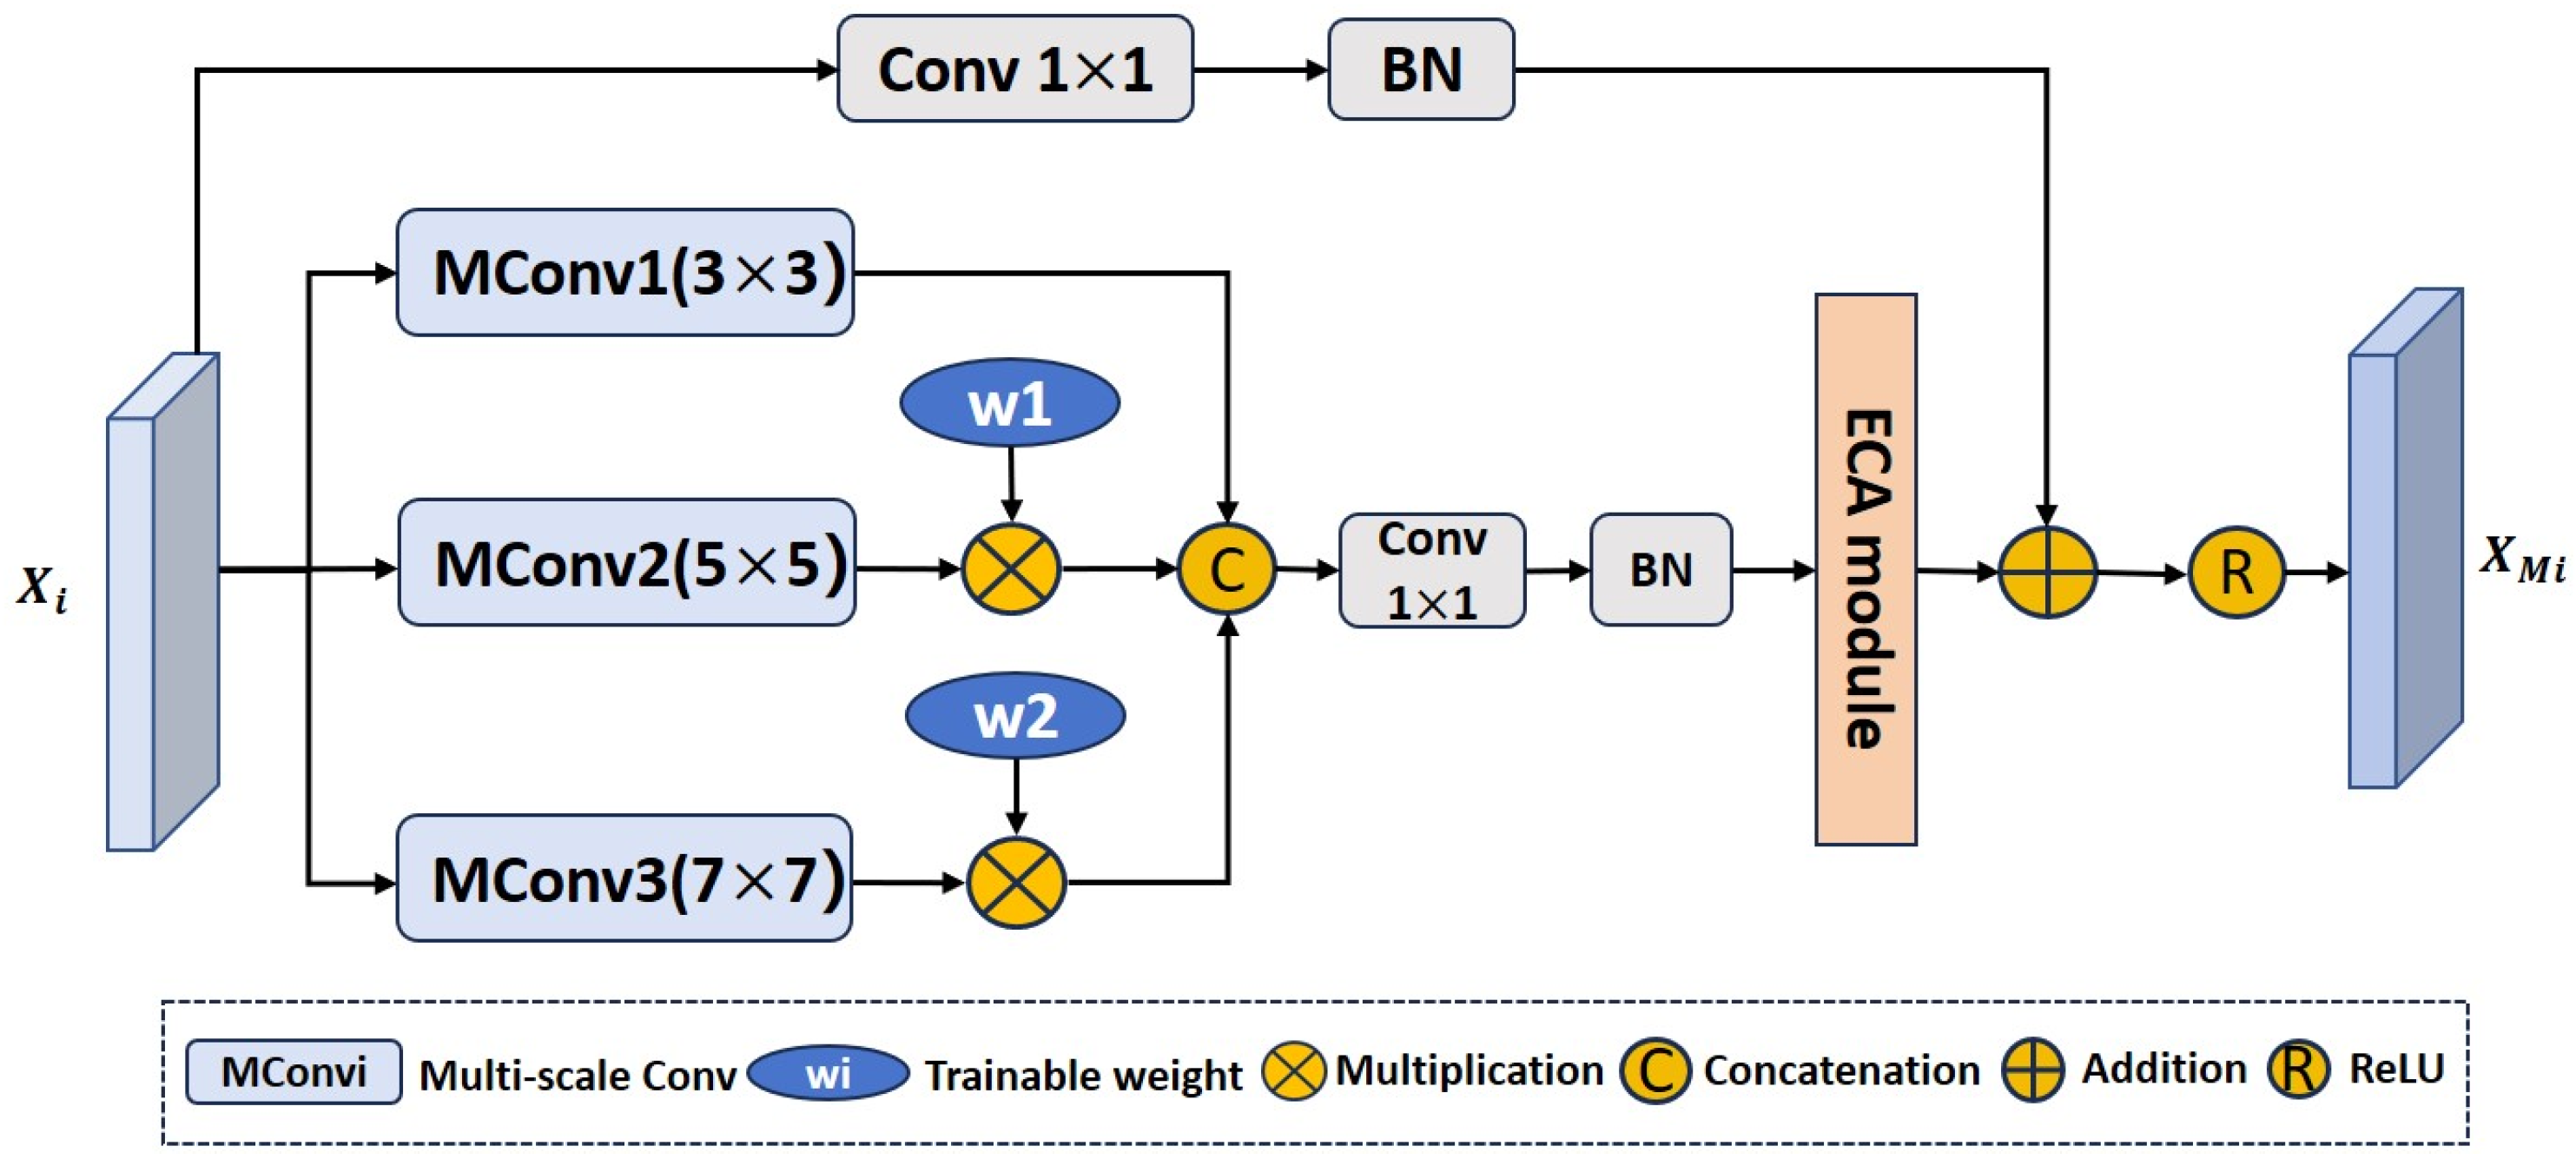
Due to the variable morphology and size of bladder tumors in cystoscopy images, existing Transformer-based methods have limited adaptability to multi-scale features of bladder tumors. To enhance the multi-scale adaptive ability of the network for bladder tumors and accurately locate bladder tumors of different shapes and sizes, we propose a multi-scale effective channel attention module (MECA), as shown in
Figure 3. Specifically, first, we extract multi-scale feature information from the multi-level feature
output by the encoder through convolutions with three different kernel sizes. Since convolutions of different kernel sizes determine the receptive field range on the cystoscopy image, compared to using convolutions of a single kernel, convolutions with three different kernel sizes can better capture global and local features. Next, when concatenating the feature information extracted by convolutions of different kernel sizes on the channel dimension, to suppress the information gap caused by receptive fields of different sizes we design two trainable weight coefficients
and
, which are, respectively, multiplied by the features extracted by the convolutions of the two larger kernels. The ECA (efficient channel attention) [
33] module is a local cross-channel interaction strategy that achieves dimensionality reduction through 1D convolution. It can strengthen valuable features and suppress irrelevant ones. Therefore, we use the ECA module to reassign weights to feature maps, so that the feature information that is conducive to segmenting bladder tumors receives attention from the network. At the same time, we use one
convolution and batch normalization operation on the input feature map
. The
convolution reduces the number of feature channels to 32 to reduce computational resources. Finally, it is residually connected with multi-scale feature information with channel weight information to enhance the original features. In this way, the output feature
of the MECA module can adapt to changes in the size and shape of bladder tumors. This process can be described using Equation (7):
In Equation (7), represent convolutional layers with kernel sizes of , , and , respectively. and represent two trainable weight parameters, represents a connection operation in the channel dimension, represents a convolutional layer with a kernel size of , represents batch normalization, and represents the ReLU activation function.
3.4. Detail-Enhanced Reverse Attention Module
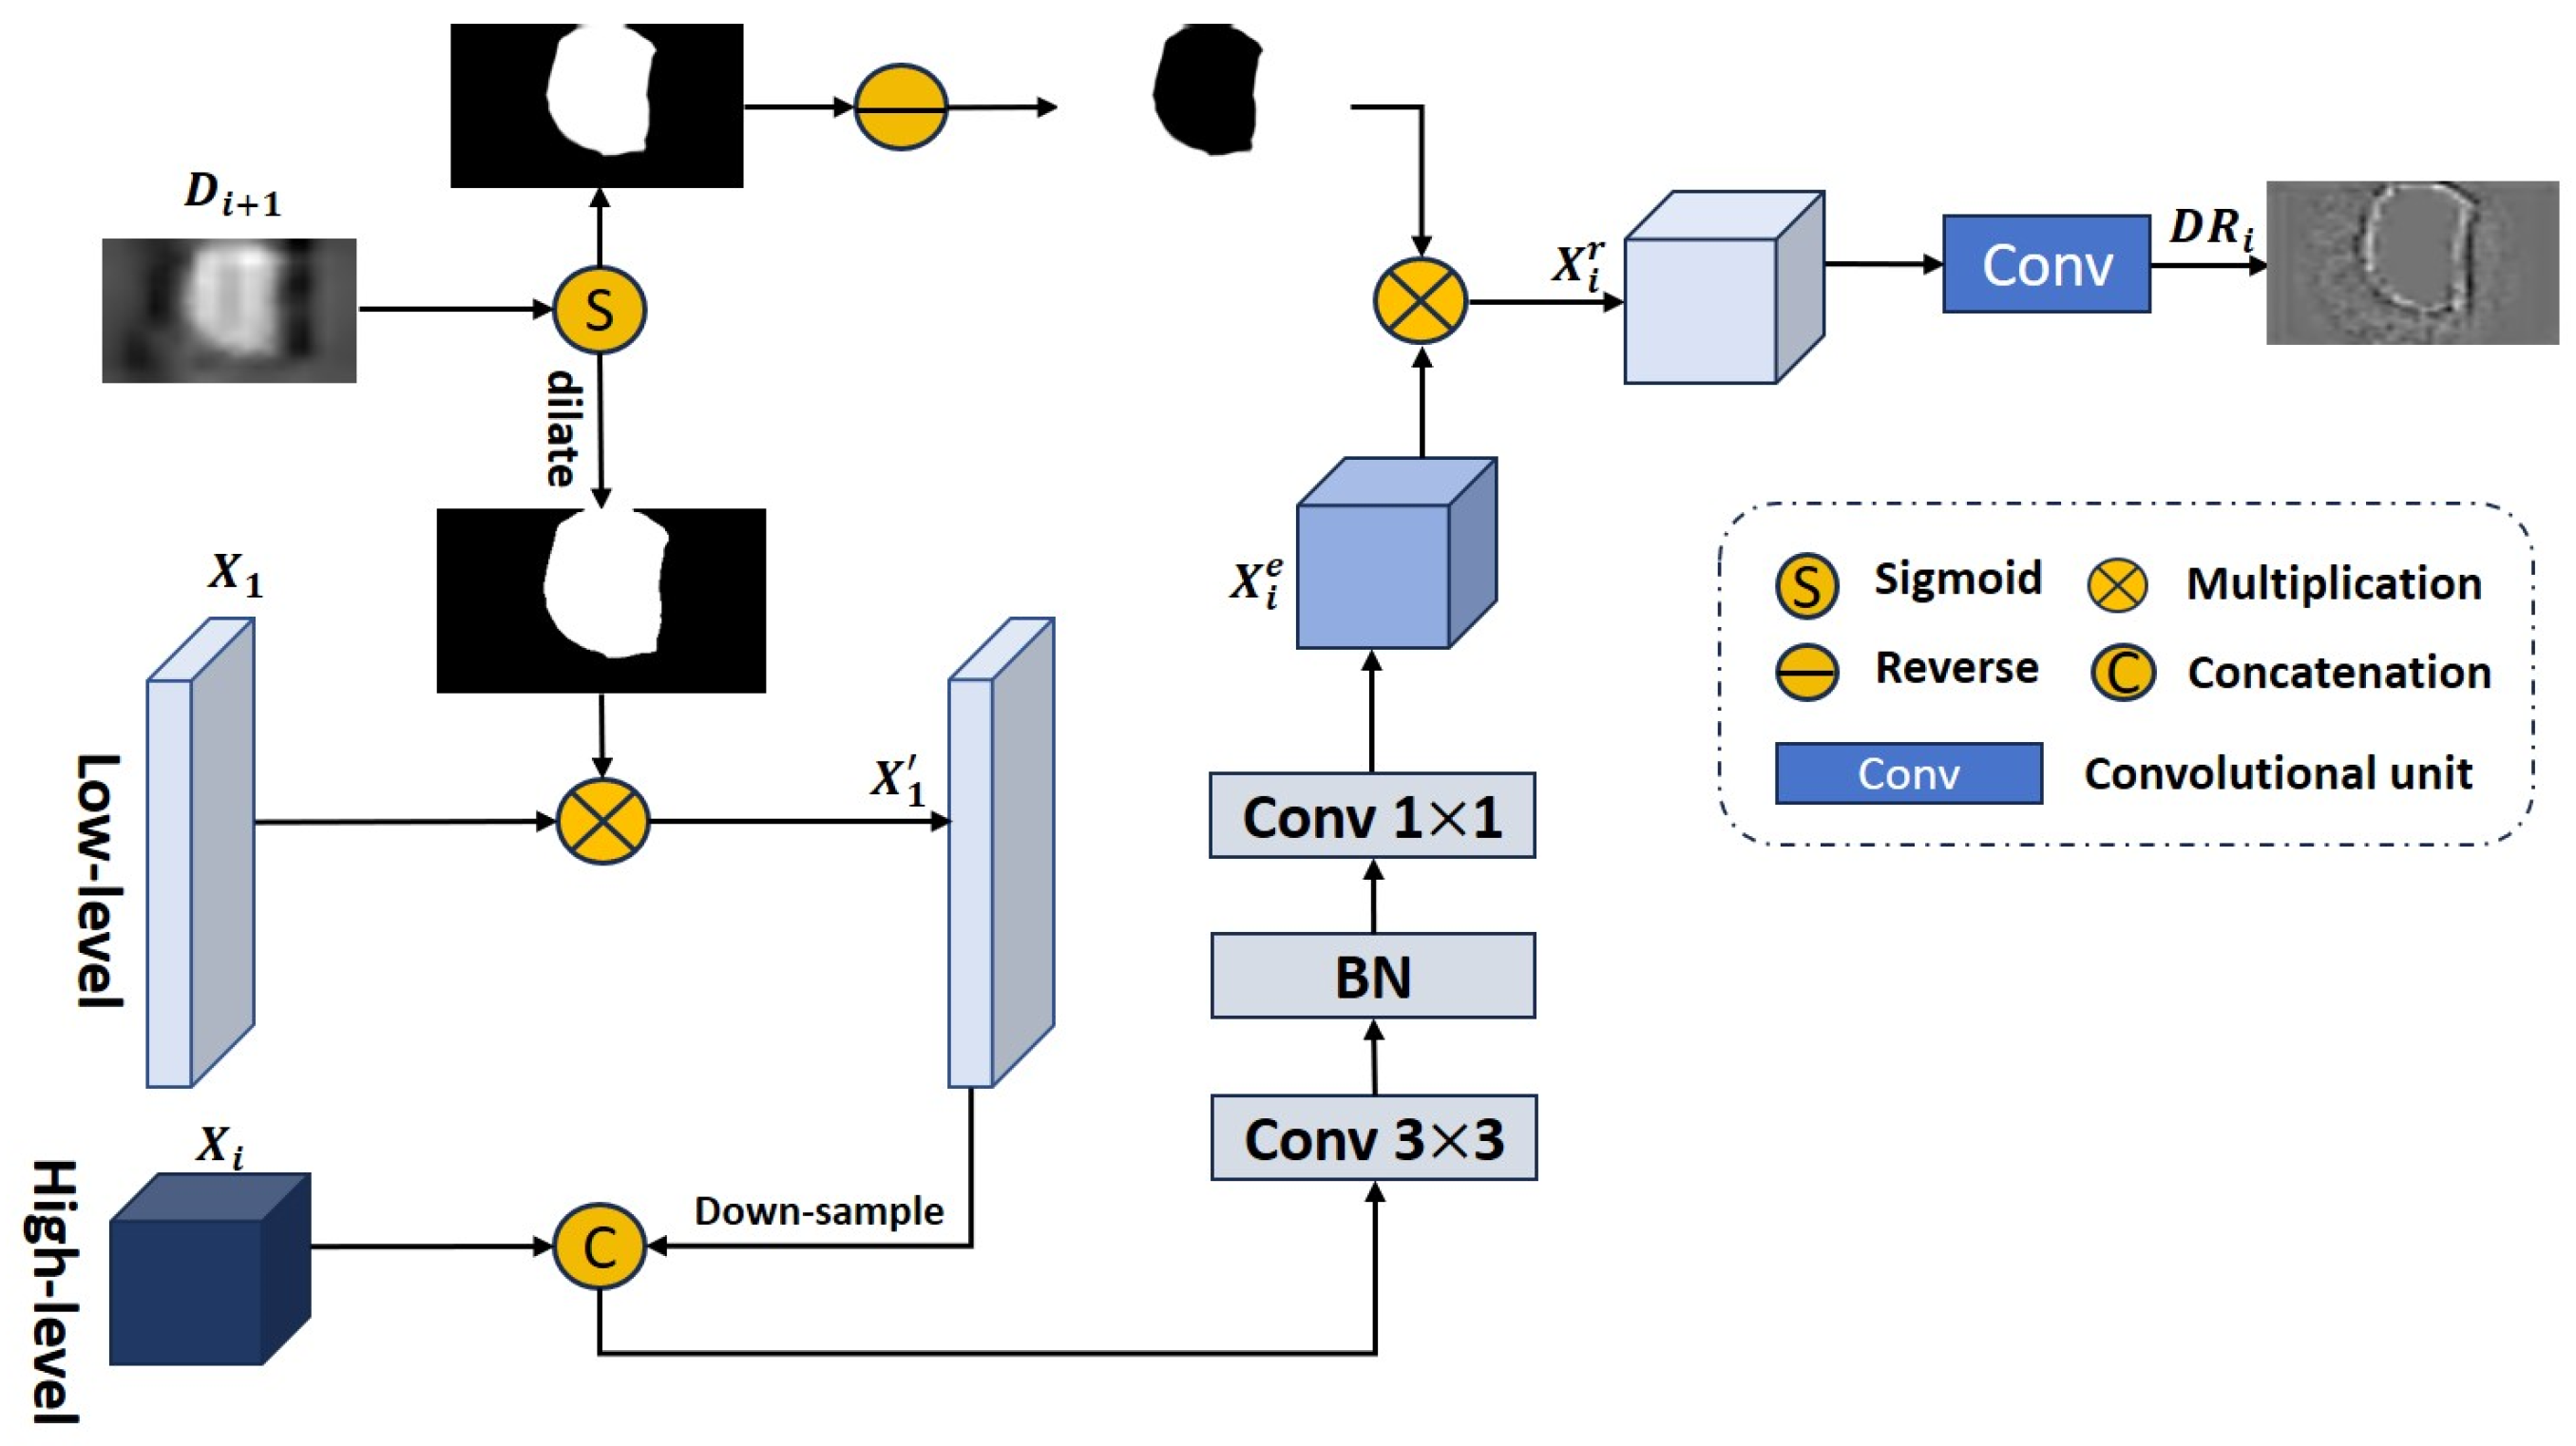
Due to the limited ability of Transformers to process local contextual information between pixels, existing Transformer-based methods have unclear tumor segmentation boundaries when predicting tumor areas in cystoscopy images. To obtain clear bladder tumor boundaries, we propose a new detail-enhanced reverse attention module (DERA) to capture inconspicuous boundary features and gradually explore supplementing tumor boundary feature information and fine-grained detail information. The DERA module consists of two parts: feature detail enhancement and local detail extraction. The structure of this module is shown in
Figure 4.
Feature detail enhancement: To supplement the fine-grained detail information contained in the low-level feature
to high-level features
, we first use the predicted image
obtained in the previous stage to reduce the influence of background information; secondly, to preserve as much fine-grained detail information as possible in the low-level feature
, we use morphological dilation to expand the prediction area, and then, multiply the inflated prediction mask by the low-level feature
to obtain the feature map
. Next, we fuse
with the high-level feature
through downsampling and concatenation operations. Then, we extract and denoise the fused features through a
convolutional layer, and finally, use a
convolutional layer to recover the number of feature channels to obtain the feature map
with enhanced details. This process can be summarized as Equation (8):
In Equation (8), represents the sigmoid activation function used to generate prediction mask, represents morphological dilation operations, represents connection operations in the channel dimension, represents a convolutional layer with a kernel size of , represents batch normalization, and represents a convolutional layer with a kernel size of .
Local detail extraction: The predicted image
generated by the SAM module [
22] lacks boundary details. We use the RA module [
35] to extract local feature details from the detail-enhanced feature map
and explore local boundary clues. The RA module [
34] first uses the prediction map
obtained in the previous stage to generate reverse attention weights
:
Then, the feature map
with enhanced details is multiplied into the reverse attention weight
, the previously predicted tumor regions are deleted, the detailed information of the tumor boundaries is explored, and then, the subsequent feature exploration proceeds through three convolutional units to extract edge detail information and generate a feature map
:
We sequentially integrate into the prediction map of the previous stage to refine the details of the edge structure of the bladder tumor. The DERA module can supplement fine-grained detail information and help the network generate prediction masks containing clear tumor boundaries.
3.5. Efficient Channel Space Attention Module
Due to the rich texture, color, and edge details contained in low-level features, as well as more noise and irrelevant information, to more effectively extract important information from low-level features and capture details of bladder tumors in different dimensions, we propose an efficient channel space attention module (ECSA). The module structure is shown in
Figure 5; it refines the feature map by concatenating linear effective channel attention [
24]
and space attention [
56]
:
Linear efficient channel attention
identifies which feature maps to focus on, and then, assigns greater weights to these feature maps to enhance these features. The process of
can be summarized as Equation (12):
In Equation (12), represents the global average pooling layer, used to perform global information statistics by channel; refers to the feature reshape operation, which converts the 2D tensor to 1D; is a 1D convolutional layer with a kernel size of and a stride of ; represents the inverse operation of ; and represents the sigmoid activation function, used to generate channel attention maps.
Space attention
identifies where to focus in a feature map, and then, gives these regions greater weights in the spatial direction to enhance those features. The process of
can be summarized as Equation (13):
In Equation (13), represents the sigmoid activation function, used to generate spatial attention maps; is a convolutional layer with padding 3 to enhance spatial contextual information; represents the connection operation on the channel dimension; and represent the maximum and average values obtained along the channel dimension, respectively; and represents the input tensor .
3.6. Loss Function
We used a prediction head for each of the six stages in the proposed MDER-Net, including
, using addition aggregation to obtain the final prediction mask:
In Equation (14), is the prediction mask obtained by applying the sigmoid activation function to , and the is the final prediction mask.
To monitor the prediction quality of the six stages of the network, we designed a multi-stage joint loss function, which is defined as
In the above equation,
represents the loss function for each stage, which is composed of weighted intersection over union (wiou) [
57] and weighted binary cross-entropy (wbce) [
57]; wiou and wbce limit the prediction mask from global and local perspectives, respectively;
G represents the ground truth.
Finally, we provide the training process of the proposed MDER-Net algorithm, as shown in Algorithm 1.
| Algorithm 1: The training process of the proposed MDER-Net algorithm. |
Input: Image set ,,......, Label(ground truth) set , ,......
Output: Prediction maps , Model parameters - 1:
While not converging do - 2:
Sample , from ,,......, , ,...... - 3:
Acquire feature maps of four different levels ,,, - 4:
for feature maps do - 5:
for to 4 do - 6:
Use Equation (7) to obtain multi-scale features - 7:
end for - 8:
end for - 9:
Multi-scale high-level features aggregation - 10:
Multi-scale fusion of high-level and low-level features - 11:
for feature maps do - 12:
for to 4 do - 13:
Use Equation (8) to obtain feature maps with enhanced details - 14:
Calculate reverse attention weights by Equation (9) - 15:
Use Equation (10) to generate edge detail feature map - 16:
Generate prediction map - 17:
end for - 18:
end for - 19:
for feature map do - 20:
Generate linear effective channel attention maps by Equation (12) - 21:
Generate space attention maps by Equation (13) - 22:
Edge detail information extraction ,) - 23:
Generate the final prediction map - 24:
end for - 25:
Use Equations (15) and (16) to calculate the total loss - 26:
The Adam optimizer and the loss to update the model parameters - 27:
end while
|
4. Experimental Results and Discussion
In this section, we first introduce the dataset, evaluation metrics, and implementation details. Then, we compare the results of the proposed MDER-Net with state-of-the-art (SOTA) methods to demonstrate its superiority. We also conduct ablation experiments to demonstrate the effectiveness of our proposed three new modules.
4.1. Datasets
4.1.1. Bladder Tumor Dataset: BtAMU
In the field of bladder tumor segmentation, there is a lack of a cystoscopy image dataset for comparative evaluation. Therefore, we have established a bladder tumor dataset, BtAMU. Specifically, BtAMU consists of 1948 bladder tumor images and their corresponding ground truth (GT) labels extracted from 110 cystoscopy examinations and surgical videos provided by the Department of Urology at the First Affiliated Hospital of Anhui Medical University; the GT is manually annotated by professional urology experts. The image resolution is .
4.1.2. Polyp Dataset
To verify the robustness and generalization of the proposed MDER-Net, we selected five publicly challenging polyp datasets, including Kvasir-SEG [
35], CVC-ClinicDB [
36], CVC-ColonDB [
37], ETIS [
38], and CVC-300.
Kvasir-SEG: This dataset consists of 1000 polyp images extracted from colonoscopy videos, with a resolution distribution range of to .
CVC-ClinicDB: This dataset consists of 612 polyp images extracted from 25 colonoscopy videos, with an image resolution of .
CVC-ColonDB: This dataset consists of 380 polyp images extracted from 15 colonoscopy videos, with an image resolution of .
ETIS: This dataset consists of 196 polyp images extracted from 34 colonoscopy videos, with an image resolution of .
CVC-300: This dataset is a subset of the polyp dataset EndoScene [
58], containing 60 images of colorectal polyps with a resolution of
.
As shown in
Table 1, when conducting bladder tumor segmentation experiments using the BtAMU dataset we randomly selected 80% of the dataset for training and 20% for testing. For the polyp segmentation task, we use the same data distribution settings as PraNet [
10]. Specifically, 90% of the Kvasir-SEG dataset and 90% of the CVC-ClinicDB dataset are used for training, and 10% of the Kvasir-SEG dataset and 10% of the CVC-ClinicDB dataset are used for testing. In addition, to evaluate the generalization performance of the model on unseen CVC-ColonDB, ETIS, and CVC-300 datasets, we trained using 0% of the CVC-ColonDB, ETIS, and CVC-300 datasets and tested 100% of the CVC-ColonDB, ETIS, and CVC-300 datasets. In other words, these three datasets were not used for training the model, but only for testing the model.
4.2. Evaluation Metrics
In the bladder tumor segmentation experiment, we selected mean Dice (mDice), mean intersection over union (mIoU), mean absolute error (MAE), Accuracy, weighted Fmeasure (
), and Hausdorff distance (HD) as evaluation metrics for quantitative analysis. In the polyp segmentation task, we used mDice, mIoU, and HD as evaluation metrics. mDice and mIoU are similarity measures at the regional level, representing the degree of agreement between the predicted and actual results of the model. MAE is a pixel-level evaluation metric that represents the average absolute error between the algorithm’s predicted value and the true value. Accuracy represents the proportion of pixels correctly predicted by the model to actual pixels.
is a metric that comprehensively considers precision and recall, and it trades them off through a parameter
. HD is used to measure the accuracy of boundary segmentation. Among these metrics, the higher the value of the mDice, mIoU, accuracy, and
metrics, the better the algorithm’s prediction performance, while the lower the values of the MAE and HD metrics, the better the model’s segmentation performance. The metrics’ definitions are as follows:
In the above equations, TP represents true positive, TN represents true negative, FP represents false positive, and FN represents false positive; N represents the number of test images. In Equation (19), P represents the predicted map, Y represents the ground truth, and W and H are the width and height of the images, respectively. In Equation (20), is a parameter, and denote weighted precision and weighted recall, respectively. In Equation (22), A and B represent the true image and predicted map, respectively, and represents a distance function, such as the Euclidean distance.
4.3. Implementation Details
We implement MDER-Net on an NVIDIA GeForce RTX 3090 GPU card using PyTorch. When training, the optimizer is the Adam optimizer, the learning rate is set to , the decay rate is set to 0.1, and the batch size is set to 16. The proposed network is trained for a total of 100 epochs. In addition, we adjust the size of the input image to and use a multi-scale {0.75, 1.0, 1.25} training strategy with a gradient clip limit of 0.5.
4.4. Experimental Results and Discussion on the BtAMU Dataset
4.4.1. Quantitative Results
To verify the effectiveness of the proposed MDER-Net for bladder tumor segmentation, we compared the quantitative results of the proposed MDER-Net with the results of UNet [
5], PraNet [
10], CaraNet [
13], HarDNet-MSEG [
12], DCRNet [
14], MSRAformer [
25], HSNet [
24], and TGDAUNet [
32], and quantitatively evaluated the segmentation performance of all models on the bladder tumor dataset BtAMU using six medical image segmentation evaluation metrics: mDice, mIoU, MAE, accuracy,
, and HD.
Table 2 presents a comparison of the quantitative results of the different algorithms on the BtAMU dataset. From
Table 2, it can be seen that our proposed MDER-Net achieves state-of-the-art segmentation performance on the BtAMU dataset compared to other models. In terms of the mDice and mIoU metrics, our MDER-Net improved by 1.22% and 1.28%, respectively, compared to the second-best-performing MSRAformer [
25], indicating that MDER-Net can better distinguish bladder tumors from normal tissue backgrounds. The accuracy and
of MDER-Net were also improved by 0.18% and 0.50%, respectively, compared to the second-best-performing MSRAformer [
25]. In addition, MDER-Net showed a decrease of 0.24% and 0.3454 in the MAE and HD indicators, respectively, compared to the second-best-performing HSNet [
24]. The HD metric quantitative results showed that MDER-Net improved the accuracy of bladder tumor boundary segmentation and reduced boundary segmentation errors. To improve the clarity of the quantitative results comparison between different models on the BtAMU dataset, we designed bar charts for the mDice and mIoU metrics, as shown in
Figure 6. These results validate the effectiveness and superiority of the proposed MDER-Net for bladder tumor segmentation in cystoscopy images.
4.4.2. Qualitative Results
To demonstrate the superiority of the proposed MDER-Net more clearly and intuitively, we compared the qualitative results of the proposed MDER-Net with the results of UNet [
5], PraNet [
10], CaraNet [
13], HarDNet-MSEG [
12], DCRNet [
14], MSRAformer [
25], HSNet [
24], and TGDAUNet [
32].
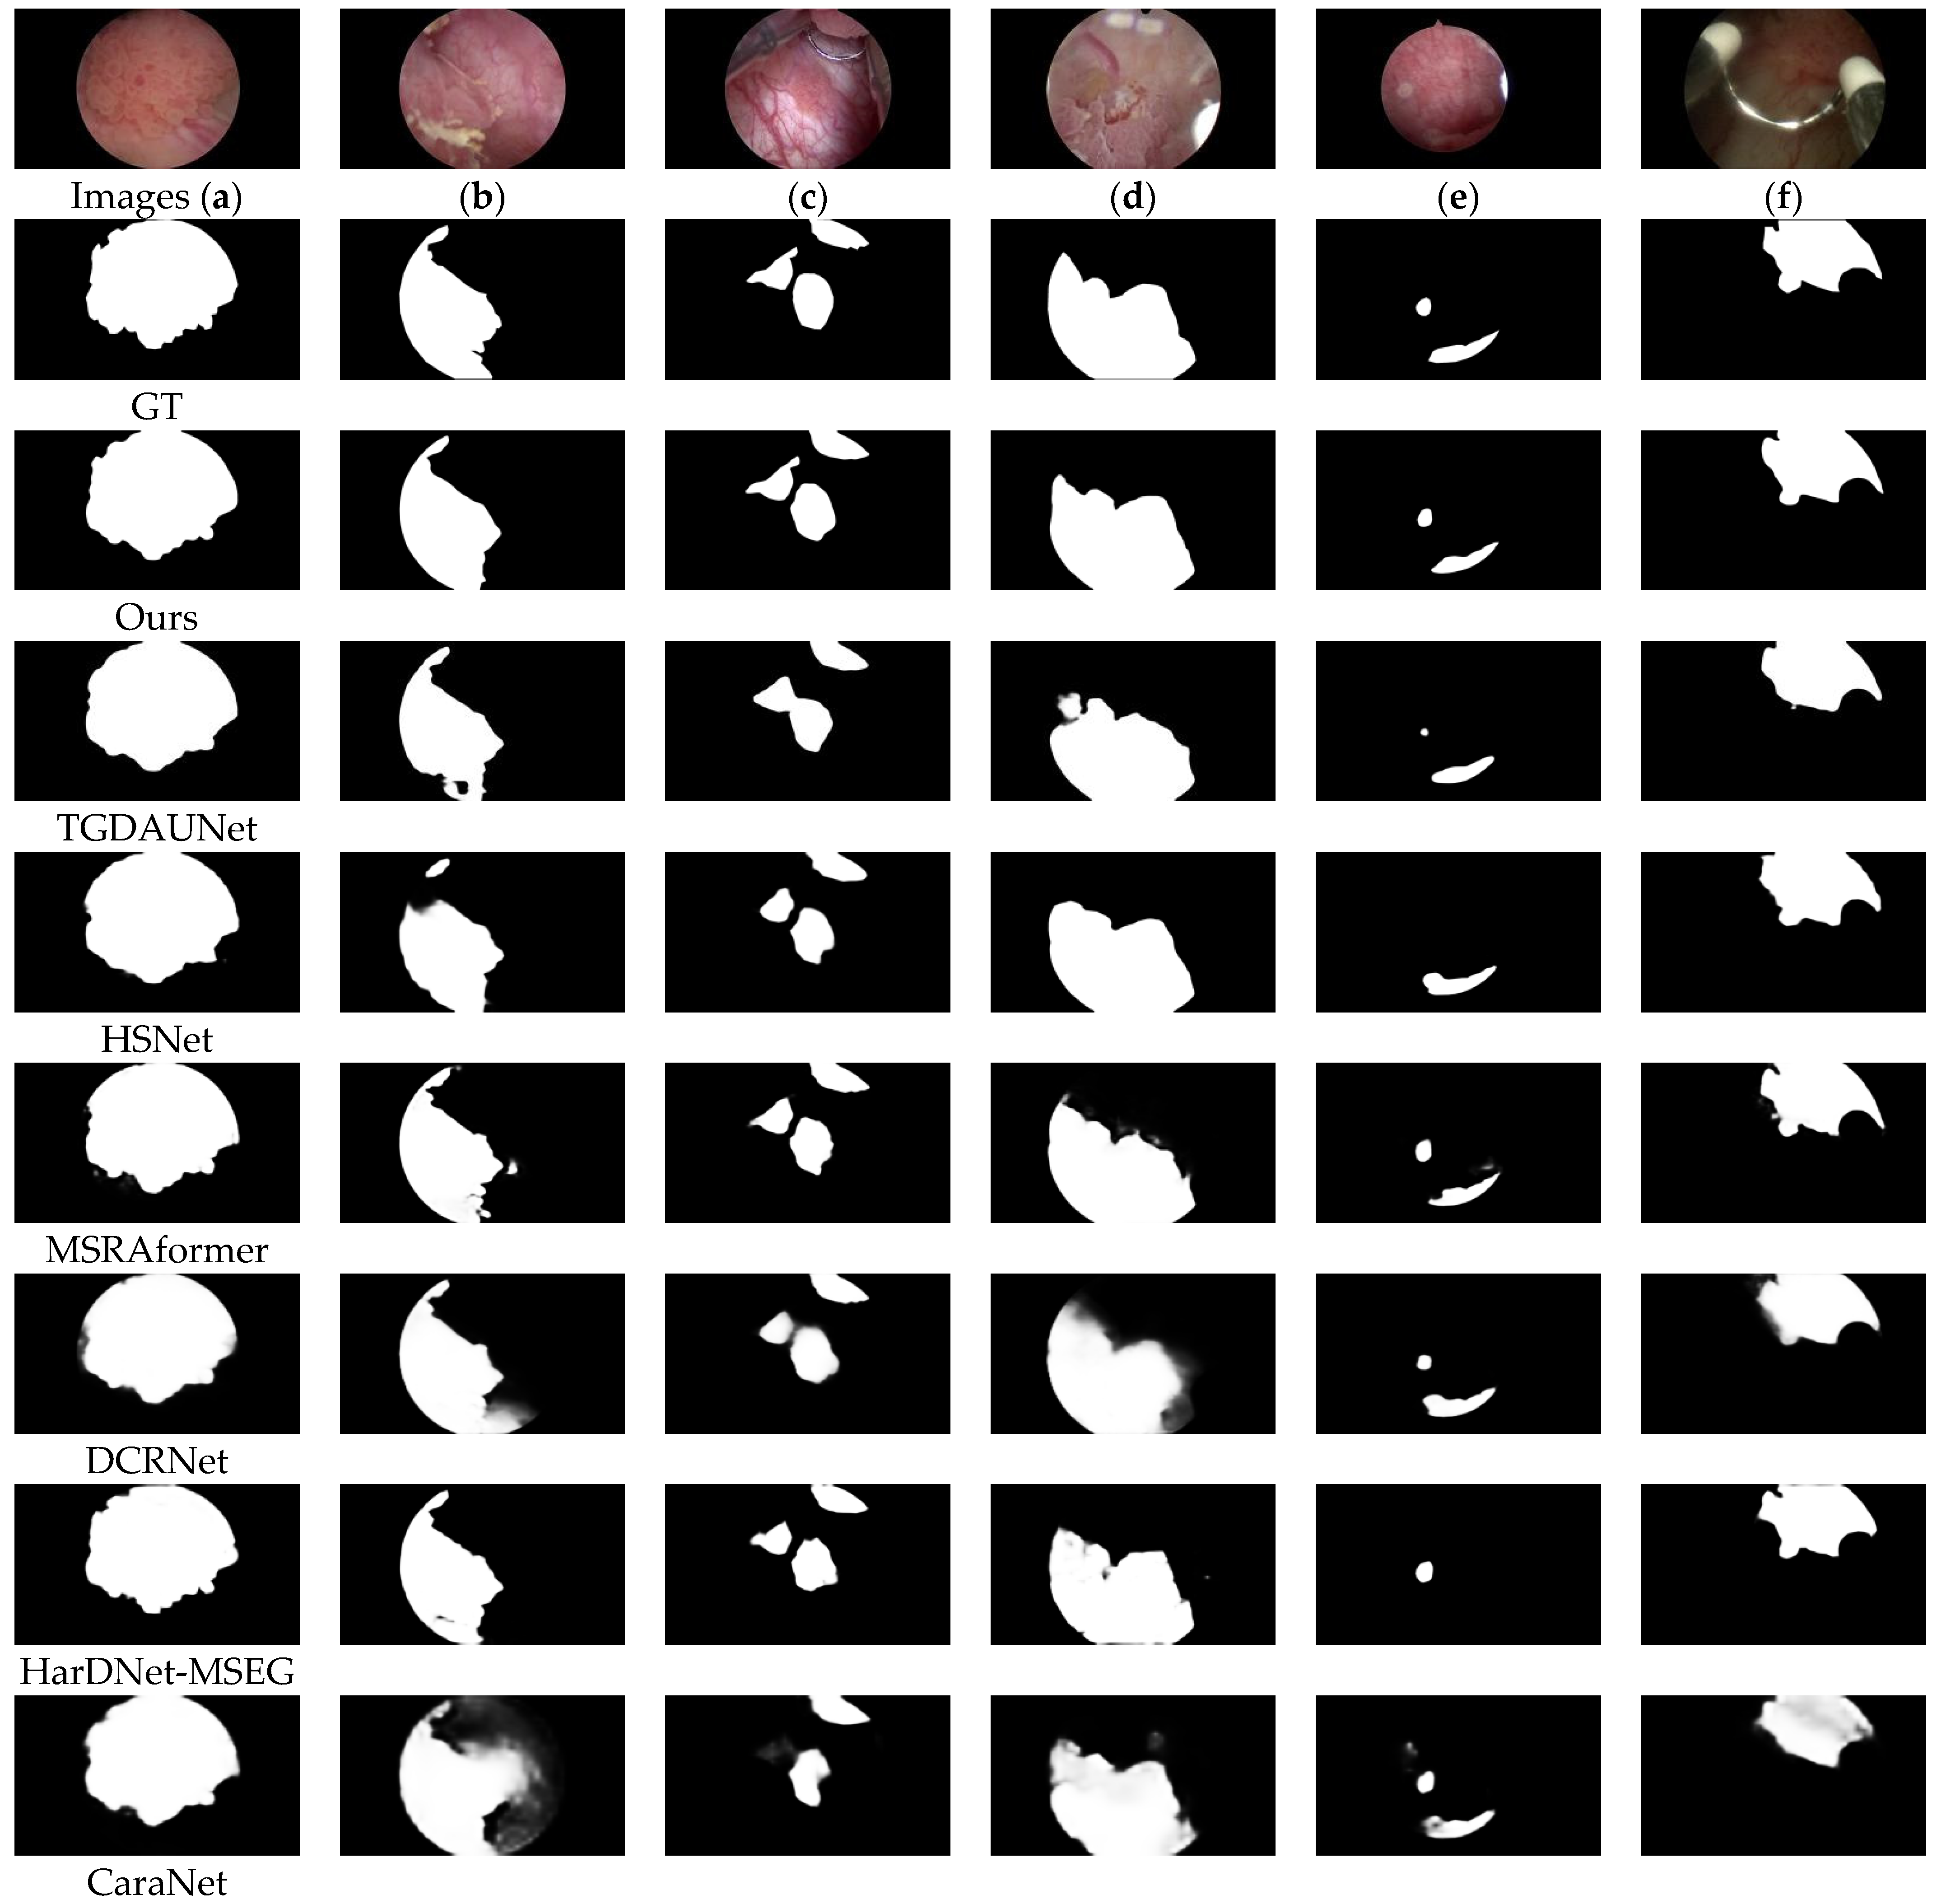
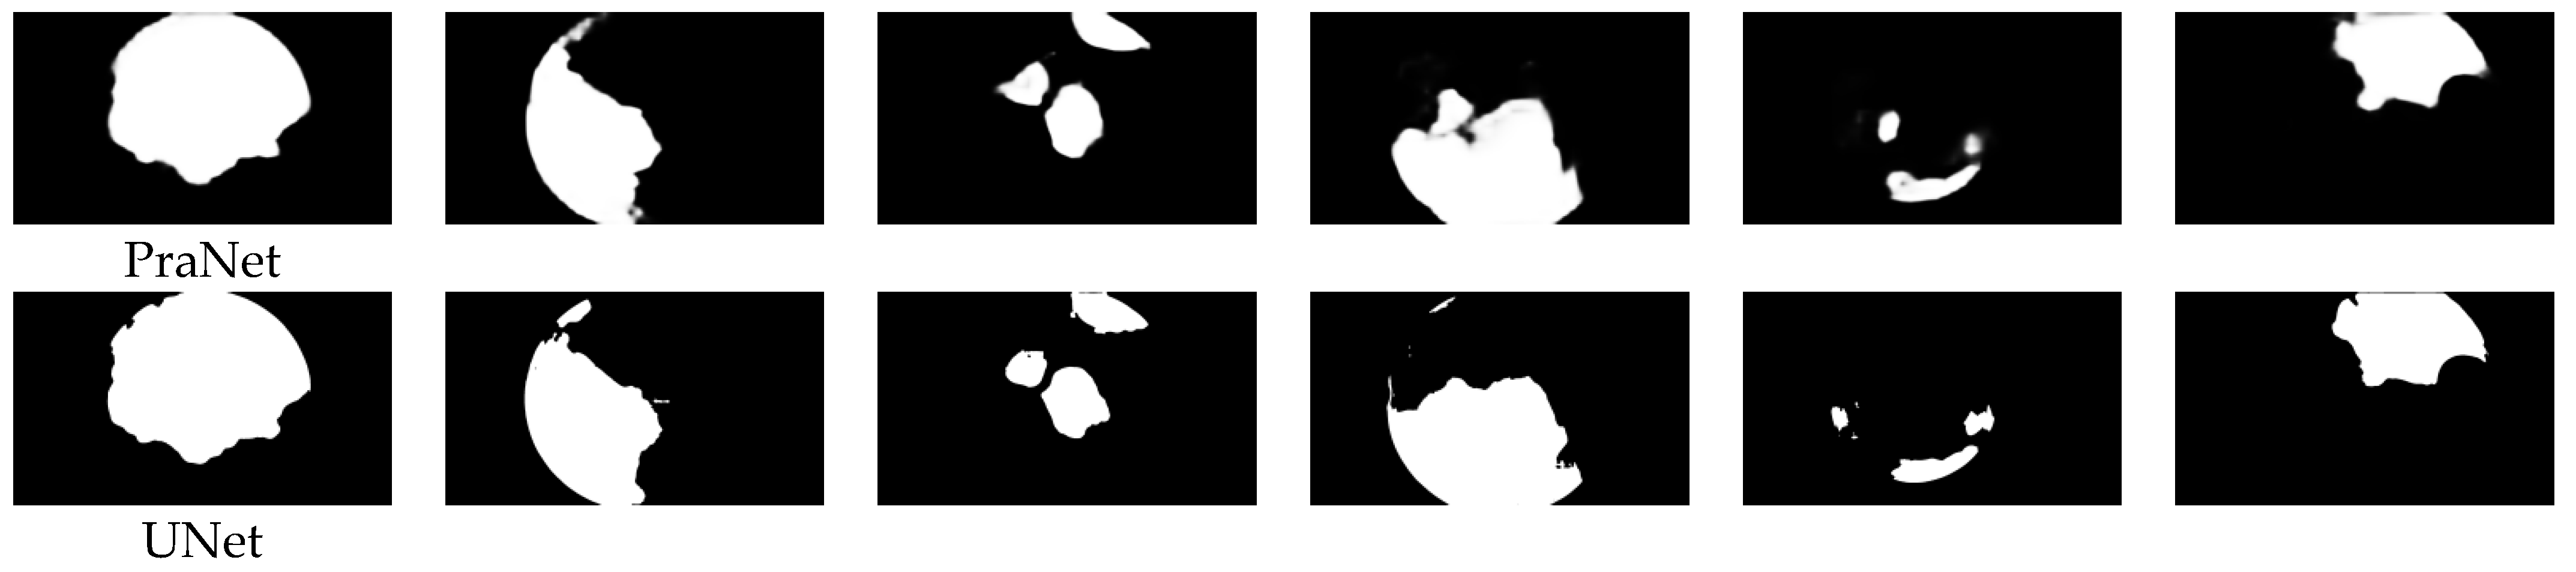
Figure 7 shows a visual comparison of the results of the different models on the BtAMU dataset. From
Figure 7, it can be seen that compared with other models, our proposed MDER-Net has more accurate prediction results. From
Figure 7a,b,f, our proposed MDER-Net is more sensitive to the boundary features of bladder tumors, i.e., it can better outline the boundaries of bladder tumors and remove noisy areas. This is because the DERA module can effectively recover local boundary information, while the ECSA module also reduces the impact of noise and irrelevant information. For
Figure 7c–e, the predicted masks of MDER-Net are closer to the ground truth (GT) images, especially for multiple tumor regions (
Figure 7c,e) and smaller tumor regions (
Figure 7e). Compared with other comparative algorithms, it is more robust. This is because the proposed MECA module improves the network’s multi-scale adaptability to lesions, enabling it to adapt to various changes in the size and morphology of bladder tumors. In addition, MDER-Net can remove noise in images with lower brightness (
Figure 7f), achieving more accurate bladder tumor segmentation. The comparison of qualitative visual results proves that MDER-Net can better solve the challenges brought by the different shapes and sizes of bladder tumors and the uneven brightness. At the same time, it once again verifies the effectiveness and robust stability of the proposed MDER-Net for bladder tumor segmentation.
The quantitative and qualitative results in
Table 2 and
Figure 7 demonstrate the superiority of MDER-Net in the bladder tumor segmentation task. Compared with other SOTA models, MDER-Net can improve the segmentation accuracy of bladder tumors in cystoscopy images, reduce boundary segmentation errors, and achieve more accurate tumor localization and boundary delineation.
4.5. Experimental Results and Discussion on Polyp Datasets
To verify the robustness and generalization of the proposed MDER-Net, we compared the polyp segmentation results of the proposed MDER-Net with the results of UNet [
5], UNet++ [
6], PraNet [
10], HarDNet-MSEG [
12], DCRNet [
14], SSFormer [
23], MSRAformer [
25], and TGDAUNet [
32], and quantitatively evaluated the segmentation performance of all models on the polyp tumor datasets Kvasir-SEG [
35], CVC-ClinicDB [
36], CVC-ColonDB [
37], ETIS [
38], and CVC-300, using three evaluation metrics: mDice, mIoU, and HD.
Table 3,
Table 4,
Table 5,
Table 6 and
Table 7, respectively, present the quantitative results comparison of different algorithms on the Kvasir-SEG dataset, CVC-ClinicDB dataset, CVC-ColonDB dataset, ETIS dataset, and CVC-300 dataset. From
Table 3,
Table 4,
Table 5,
Table 6 and
Table 7, it can be seen that the results of MDER-Net on the five polyp datasets are superior to the other compared methods, consistently achieving state-of-the-art segmentation performance. From
Table 3 and
Table 4, it can be seen that MDER-Net has a stronger feature learning ability than other comparative models. Among them, the mDice metric results of MDER-Net on the Kvasir-SEG dataset and the CVC-ClinicDB dataset reached 92.65% and 92.19%, respectively. From
Table 5,
Table 6 and
Table 7, it can be seen that MDER-Net has stronger generalization ability compared to the other models on the three unseen polyp datasets. On the CVC-ColonDB dataset, the mDice metric results of MDER-Net were 3.01% and 5.95% higher than the second-ranked MSRAformer [
25] and third-ranked TGDAUNet [
32], respectively. On the ETIS dataset, our mDice results were 0.27% and 1.88% higher than the second-ranked MSRAformer [
25] and third-ranked TGDAUNet [
32], respectively. On the CVC-300 dataset, the mDice and mIoU results of MDER-Net increased by 3.03% and 3.08%, respectively, compared to the second-ranked MSRAformer [
25], while HD decreased by 0.1862. These experimental results validate the robustness and generalization ability of MDER-Net.
4.6. Ablation Experiments
In our proposed MDER-Net, we propose three new modules (MECA, DERA, and ECSA) to improve the segmentation performance of bladder tumors. To verify the effectiveness of each module, we conducted ablation experiments on the BtAMU dataset to explore the impact of each module on the segmentation performance of bladder tumors.
Specifically, our baseline is PVT v2. For the validation of the effectiveness of the MECA module, we replace it with a
convolutional layer for comparison; for the DERA module, we compare and verify by replacing all DERA modules with RA modules; and for the ECSA module, we directly remove it to verify its effectiveness. We label the ablation experiments of the MECA, DERA, and ECSA modules as “w/o MECA”, “w/o DERA”, and “w/o ECSA”, respectively. The experimental results are shown in
Table 8. Specifically, in terms of the mDice and mIoU metrics, these decreased by 0.76% and 1.00%, respectively, in “w/o MECA” compared to MDER-Net, indicating that compared to multi-scale features processed by the MECA module, the original features extracted by the encoder have limited adaptability to changes in tumor shape and size. The mDice and mIoU metrics of “w/o DERA” were reduced by 1.1% and 1.17%, respectively, compared to MDER-Net, and the HD was 0.3486 higher. This is due to the failure to supplement fine-grained detail information from low-level features to high-level features, resulting in a decrease in segmentation performance. The mDice and mIoU metrics of “w/o ECSA” decreased by 1.16% and 1.38%, respectively, compared to MDER-Net, indicating that the lack of the ECSA module leads to excessive extraction of noise and irrelevant information in low-level features. We designed bar charts of the mDice and mIoU metrics on the BtAMU dataset to visually represent the results of the ablation experiments, as shown in
Figure 8. From
Table 8 and
Figure 8, it can be seen that replacing or removing any of the proposed modules leads to a significant decrease in the segmentation performance of bladder tumors, proving the effectiveness of the proposed modules. The segmentation performance of “w/o MECA”, “w/o DERA”, and “w/o ECSA” is higher than the baseline, reflecting the effectiveness of cooperation between the various proposed modules.
In addition, we analyzed the impact of each module on computational efficiency, including floating-point operations (GFLOPs) and inference time. From
Table 9, it can be seen that the inference time of all models meets the real-time requirements. MDER-Net has similar inference time and GFLOPs to “w/o MECA”, “w/o DERA”, and “w/o ECSA”, and slightly higher than baseline. However, compared to them, MDER-Net has a significant advantage in segmentation performance. We believe that in medical image segmentation tasks, it is more important to achieve higher segmentation accuracy while ensuring real-time performance.
5. Conclusions
This paper proposes a new multi-scale detail-enhanced reverse attention network MDER-Net for bladder tumor segmentation in cystoscopy images. It uses a PVT v2 encoder and six modules (MECA, DA, SAM, DERA, ECSA, RA) to capture multi-scale global features of bladder tumors and enhance local feature representation. By mixing six deep supervisions, it effectively and accurately locates bladder tumors in cystoscopy images. We propose three new modules: MECA, DERA, and ECSA. The MECA module is used to obtain multi-scale features with channel weight information to adapt to changes in the size and morphology of bladder tumors; the DERA module gradually integrates the fine-grained detail information and local boundary information contained in the fused features at all levels into the global feature map of the previous layer, refining the edge structure details of bladder tumors; and the ECSA module is used to suppress irrelevant information in the underlying features, capture details of bladder tumors in different dimensions, and enhance local context. We also established a new bladder tumor dataset, BtAMU, for comparative evaluation. The quantitative and qualitative results of MDER-Net on the bladder tumor dataset BtAMU are superior to eight state-of-the-art (SOTA) methods, demonstrating the superiority of MDER-Net in bladder tumor segmentation tasks. Meanwhile, the visualized qualitative results also prove that MDER-Net can better solve the challenges caused by the varying shapes and sizes of bladder tumors and uneven brightness. The experimental results of MDER-Net on five publicly available polyp datasets are superior to the compared SOTA models, verifying the robustness and generalization ability of the proposed MDER-Net. In the future, we will collect more cystoscopy images and further improve the tumor segmentation performance of the network. At the same time, we hope that our proposed MDER-Net can help clinical decision-making in bladder tumors and provide new ideas for the diagnosis and treatment of bladder tumors. In addition, we will explore the application of MDER-Net in other types of medical image segmentation tasks, such as skin injuries, blood vessels, retina, and 3D medical images.


