Article

Investment in Data Analytics with Manufacturer Encroachment

1
College of Business, Shanghai University of Finance and Economics, Shanghai 200433, China
2
School of Public Economics and Administration, Shanghai University of Finance and Economics, Shanghai 200433, China
*
Author to whom correspondence should be addressed.
Mathematics 2024, 12(9), 1371; https://doi.org/10.3390/math12091371
Submission received: 26 March 2024 / Revised: 26 April 2024 / Accepted: 30 April 2024 / Published: 30 April 2024

Abstract

:
Online retail platforms such as Amazon and Tmall have the ability to create personalized recommendations based on the consumer’s browsing history, purchase history, and preferences by investing in data analytics capability. In practice, manufacturers may encroach on the retail market through the agency channel that sells products directly to online consumers in addition to wholesale products to retail platforms through the reselling channel. In this study, we develop a game-theoretic model to study the interplay between the manufacturer’s encroachment and the online retail platform’s data analytics capability investment. Our outcomes reveal that the conditions for the manufacturer to encroach become more lenient if the platform invests in data analytics capability, and we show that the investment in data analytics capability can lead to a Pareto improvement and the manufacturer can free ride on the platform’s investment. Moreover, we found that the manufacturer’s encroachment always creates more incentives for the platform to enhance the investment level in data analytics capability. Our research in this study provides useful insights for managers to make encroachment decisions and data analytics capability investment decisions with the manufacturer who sells through the online retail platform.

1. Introduction

1.1. Motivation and Research Background

Over the past decade, global online retailing has boomed at an average rate of 20% per year. According to Statista, the global e-commerce market reached about USD 5.7 trillion and accounted for 19.7% of global retail sales in 2022, with the expectation of USD 8.1 trillion and 24.0% by 2026 (https://www.statista.com/topics/871/online-shopping/#topicOverview, accessed on 1 December 2023). In China, according to the National Bureau of Statistics, the total retail sales of social consumer goods were CNY 43,973.3 billion in 2022 (http://www.stats.gov.cn/english/PressRelease/202301/t20230118_1892301.html, accessed on 6 December 2023). The growing online shopping population helps to maintain the momentum of online retailing. In the United States, retail e-commerce sales are projected to grow at a fast pace in the coming years, going from roughly USD 875 billion in 2022 to over USD 1.3 trillion in 2025 (https://www.statista.com/topics/2443/us-ecommerce/#topicOverview, accessed on 10 December 2023). In 2022, over 2.3 billion people were expected to buy goods and services online, up from 1.66 billion global digital buyers in 2016 (https://www.hostinger.com/tutorials/ecommerce-statistics, accessed on 11 December 2023). The high market demand online has attracted many manufacturers to distribute their products through online retail platforms such as Amazon, JD, Apple, Suning, and Walmart. With the rapid development of new-generation information technology such as big data, cloud computing, and artificial intelligence, online retail platforms have the ability to track and collect consumer transaction and behavior data by investing in data analytics capability. E-commerce platforms can use data analytics to have a better understanding of customers’ preferences and behavior, and make customized recommendations based on the consumer’s browsing history and purchasing history. For example, JD.com has conducted a series of advertising programs for Dyson based on data and realized precision marketing (https://www.sohu.com/a/337065441_641859, accessed on 1 January 2024). Amazon’s “Selling Coach” allows merchants to grow their sales profitably on Amazon.com by tracking key metrics such as sales, traffic, and conversions (https://www.sellerapp.com/amazon-selling-coach.html, accessed on 6 January 2024). In the e-commerce context, inaccurate predictive analytics can lead to underestimating customer value (https://www2.deloitte.com/content/dam/insights/us/articles/3924_Predictably-inaccurate/DUP_Predictably-inaccurate-reprint.pdf, accessed on 15 January 2024). Online retail platforms are well-positioned to collect abundant sales and consumer data and can target the marketing points that best incentivize consumers’ purchase willingness to achieve precise recommendations, and thus increase consumer utility [1,2]. Some experts claim that the revolution is only at its beginning, and the near future will witness most of each company’s data-driven decision making.
In a new era of data analytics capability that largely improves business decisions and even changes the way firms make decisions, the choice of selling format is still one of the most important decisions in the supply chain based on the Internet platform. In practice, some manufacturers choose to encroach on the retail market through the agency channel that sells products directly to online consumers in addition to the reselling channel that wholesale products to the retail platform. Encroachment is a common way for manufacturers to increase sales opportunities, broaden consumer reach, diversity risk, and give them access to more business tools (https://www.webretailer.com/b/hybrid-approach-seller-vendor-central, accessed on 2 January 2024). Although an online retail platform offers an agency channel, some manufacturers sell their products only through the reselling channel, while others adopt both the reselling channel and the agency channel to sell their products. For example, Huawei, and Microsoft resell their products to end users only through JD’s reselling channel, while Haier and OPPO distribute their products through JD’s both reselling channel and agency channel. Similarly, for Amazon, Bose sells products through both the reselling channel and the agency channel, whereas Apple sells products only through the reselling channel. In the existing literature that examines the channel structure of the platform supply chain in the context of data analytics, it usually assumes that the manufacturer sells through either the platform’s agency or reselling channel, but not both. In practice, when the manufacturer distributes through an online retail platform, the product assortments in the reselling channel and the agency channel may not be identical. This can be due to several factors, such as inventory availability, pricing strategies, and distribution agreements. There is no comprehensive study on the incentive for the online retail platform to invest in data analytics capability with the manufacturer who distributes the product through only the reselling channel or both the agency channel and the reselling channel of the platform. It is important to conduct analytical studies on the interplay between the manufacturer’s encroachment and the online retail platform’s data analytics capability investment considering the competition intensity of the products in the reselling channel and the agency channel.

1.2. Research Questions and Major Findings

There is no existing theory to shed light on the impact of data analytics capability on the encroachment decision of online retailing. We hope to bridge this gap by building analytical models to study the matter. We analyzed four cases considering the decisions of the manufacturer and the platform: no data analytics and no encroachment (NN), no data analytics and encroachment (NE), data analytics and no encroachment (DN), and data analytics and encroachment (DE). We hope to shed light on the following research questions.
  • What are the manufacturer’s and the platform’s equilibrium decisions (such as wholesale price and selling quantity) under different scenarios?
  • How do the manufacturer’s and the platform’s equilibrium decisions depend on the agency channel’s commission rate and competition intensity?
  • How does data analytics capability investment interact with the manufacturer’s encroachment decision of whether or not to add an agency channel to an existing reselling channel on the online retail platform?
To address these questions, we developed a game-theoretic model in which one manufacturer has an existing reselling relationship with the online retail platform. First, the platform chooses whether or not to invest in data analytics capability. Next, the manufacturer chooses whether or not to encroach, and the platform chooses whether or not to allow the encroachment. If the manufacturer successfully encroaches, the platform charges a commission rate to receive a fixed portion of the agency channel’s revenue. Then, the platform determines the investment level if the platform chooses to invest in data analytics capability in the earlier stage. After that, the manufacturer decides on the wholesale price for the reselling channel. Then, the platform decides on the order quantity. Finally, if the manufacturer successfully encroaches, the manufacturer decides on the selling quantity for the agency channel. When the manufacturer successfully encroaches, the manufacturer adopts both the reselling and agency channels to distribute products. When the platform chooses to invest in data analytics capability, the platform can better understand customers’ preferences and behavior through data-driven analysis, thereby increasing the utility of consumers. By solving the model, we investigated the interplay between the manufacturer’s encroachment and the online retail platform’s data analytics capability investment. This study is the first, to our knowledge, that considers the interplay between the manufacturer’s encroachment decisions and the online retail platform’s data analytics capability investment decisions. We fully characterize the equilibrium decisions and show how the equilibrium decisions depend on the consumers’ personalized recommendation preference and the marginal investment cost. Our analysis reveals that the conditions for the manufacturer to encroach become more lenient, and the manufacturer is more likely to encroach if the platform invests in data analytics. Encroachment lowers the wholesale price more passively as consumers’ sensitivity to personalized recommendations increases. Encroachment increases the total selling quantity more aggressively as consumers’ sensitivity to personalized recommendations increases. Moreover, we show that the investment in data analytics capability can lead to a Pareto improvement, which means that the e-commerce platform and manufacturer can simultaneously achieve revenue growth. For the manufacturer, the manufacturer can free ride on the platform’s investment in data analytics capability. For the online retail platform, manufacturer encroachment always enhances the platform’s investment level in data analytics capability.
The remainder of the paper is organized as follows. In the next section, we position our paper in the context of the literature related to data analytics, manufacturer encroachment, and channel structure. In Section 3, we set our model and provide the sequences of events. In Section 4, we derive the equilibrium outcomes under different scenarios. In Section 5, we analyze the manufacturer’s encroachment decision and the platforms’ data analytics capability decision. In Section 6, we present our conclusion.

2. Literature Review

Our work is closely related to three streams of literature: data analytics, manufacturer encroachment, and channel structure. In this section, we provide an overview of these research streams and highlight our contributions.

2.1. Data Analytics

Data analytics is emerging as a prominent field of operations management [3,4,5]. Rust and Huang [6] studied the role of big data in offering more customized services. Jiang et al. [7] and Besbes et al. [8] proposed improved mathematical models based on big data for click-through rate estimation and product recommendation. Singhal et al. [9] showed that big data can shorten the virtual distance between firms and their customers, which makes it easier to provide personalized products and services. Lutfi et al. [10] developed an integrated model drawing on the technology-organization-environment framework and resource-based view theory to examine the drivers and implications of adopting big data analytics (BDA). Few scholars have examined the influence of data analytics on decision-making and profit by developing the mathematical model. Ghoshal et al. [11] quantitatively analyze the platform’s data alliance decisions about personalized recommendations based on big data. Liu et al. [12] investigated the online retail platform’s preferences between the agency channel and reselling channel considering the impact of data-driven marketing. Zhang et al. [13] showed that investing in data analytics capabilities by a marketplace can lead to a situation where the marketplace, merchants, and consumers all benefit. Different from the extant literature, in our paper, we analyzed the impact of data analytics on the manufacturer and the platform’s profit and selling format decision. Our paper makes a novel contribution to this literature by showing how the channel structure impacts a platform’s incentive in data analytics capability investment.

2.2. Manufacturer Encroachment

Our work is also related to the stream of literature on manufacturer encroachment. Chiang et al. [14] and Arya et al. [15] showed that manufacturer encroachment can mitigate the impact of the double marginal effect. Li et al. [16,17] extended Arya et al. [15] by investigating the role of information asymmetry on manufacturer encroachment. Yoon [18] argued that encroachment may incentivize the manufacturer to have a vested interest in the retail level which consequently leads manufacturers to make cost-cutting investments. Yang et al. [19] demonstrated that manufacturer encroachment always harms the retailer and the impact on itself depends on bargaining power under nonlinear pricing. Zhang et al. [20] investigated the impact of advertising by either the supplier or the retailer on encroachment decisions. Gao et al. [21] showed that upstream private information can improve channel efficiency and consumer surplus. Ha et al. [22] studied the interplay of encroachment decisions and information sharing in a supply chain where a manufacturer sells the product through on online retail platform. Guan et al. [23] examined the value of manufacturers acquiring information and sharing information with the retailer. Huang et al. [24] studied the interplay among manufacturer encroachment, platform dual-purpose concern, and retail competition. Shi et al. [25] endogenized the manufacturer’s choice between the integrated and the decentralized structures in encroachment pursuit. Our paper contributes to this literature by analyzing the interplay between the manufacturer’s encroachment and the online retail platform’s data analytics capability investment.

2.3. Channel Structure

Our paper is mostly related to the rich literature on the channel structure of online retailing. Hagiu and Wright [26] considered the strategic choice between the reselling channel and the agency channel when the sellers and the platform can exert effort to incentivize demand. Abhishek et al. [27] examined a supply chain with a single manufacturer selling to two competing online retailers, each of whom has the option of choosing from one of the two selling formats. Kwark et al. [28] studied a similar issue but considered the impact of third-party information (such as product reviews). Tian et al. [29] demonstrated that the interaction between order-fulfillment expenses and upstream competition intensity moderates the choice of the most efficient mode for the online retailer. Jerath and Zhang [30] investigated the platform’s problem of selecting between the reselling channel and the agency channel for two competing manufacturers. Ha et al. [31] studied the impact of a platform’s service effort on a manufacturer’s decision to choose the distribution channel. Cao et al. [32] investigated the impact of the channel structure on an upstream manufacturer’s bundling incentive. Zhen et al. [33] studied the impact of pricing strategies on selecting the channel structure and the joint decision-making of channel structure and pricing strategy. Hong et al. [34] demonstrated that public information sharing leads to increased competition, whereas private information sharing tends to mitigate the competition. This study examines the case where the agency selling format and the reselling format exist simultaneously, that is the case when the manufacturer chooses to encroach. We analyzed how the data analytics capability investment of the platform affects the manufacturer’s encroachment decision.

3. Modeling Framework

We consider a supply chain with a manufacturer (denoted as M) selling through an online platform (denoted as P). In the reselling channel, the manufacturer sets the unit wholesale price, and the platform decides on the selling quantity. Meanwhile, the manufacturer may choose to encroach into the retail market and sell directly to consumers through the platform. For example, the manufacturer can sell the products through the flag shop through the online retail platform. In the agency channel, the manufacturer determines the selling quantity and pays the online retail platform a unit commission rate  λ  ( λ ( 0 , 1 ) ) proportional to the retail price. We assume that the commission rate is exogenous. It makes sense because the online retail platform charges a uniform commission rate for the entire assortment and commits to the rate before negotiating channel contracts with individual manufacturers. The manufacturer incurs a fixed unit production cost and the online retail platform incurs a fixed unit selling cost, and they are normalized to zero without loss of generality.
When a manufacturer sells through both channels of the online retailer, the product assortments in these two channels may not be the same. We assume that the manufacturer can produce an imperfect substitute product rather than a perfect one. Let  b  ( b ( 0 , 1 ) ) capture the substitution degree (competition intensity) between the products offered by the reselling channel and the agency channel. The larger  b  is, the more substitutable the two products are. We consider a classic encroachment model with quantity competition when both the agency and reselling channels exist [35]. When the platform invests in data analytics capability, we consider the platform to face the price given by the following inverse demand function:
p R = a q R b q M + k y
While we consider the manufacturer to face the price given by the following inverse demand function:
p M = a q M b q R + k y
where  a  is the potential market size, and  a  is a positive number. We use  q M  and  q R  to denote the manufacturer’s selling quantity through the agency channel and the platform’s selling quantity through the reselling channel, respectively. We denote the data analytics capability exerted by the platform by  y , and we denote the consumers’ sensitivity to personalized recommendations by  k  ( k ( 0 , 1 ) ). To realize the data analytics capability  y , the platform is required to pay the corresponding data analysis expenses. The cost of data analytics investment incurred by the platform is given by  1 / 2 c y 2  where a higher  c  means a higher cost of data analytics. Here, a quadratic cost function implies that it is increasingly expensive to apply data analysis capabilities to achieve unit demand for demand growth. Such a quadratic cost function has been widely used in the recent literature [11,12]. The profits of the manufacturer and the platform are:
Π M = w q R + ( 1 λ ) p M q M
Π P = p R q R + λ p M q M 1 2 c y 2
where  w  is the wholesale price. If the manufacturer does not encroach on the retail market, the manufacturer’s quantity in the direct channel is  q M = 0 , and only the indirect channel sells products. If the platform does not invest in data analytics capability, we set  y = 0 . Notations are summarized in Table 1.
The sequence of events is as follows. In Stage 1, the platform chooses whether or not to invest in data analytics capability. In Stage 2, the manufacturer chooses whether or not to encroach, and the platform chooses whether or not to allow the encroachment. In Stage 3, if the platform chooses to invest in data analytics capability, then determines the investment level y. In Stage 4, the manufacturer decides on the wholesale price w. In Stage 5, after observing w, the platform decides on the order quantity  q R  for the reselling channel. In Stage 6, if the manufacturer encroaches and the platform allows the encroachment, then the manufacturer decides on the selling quantity  q M  for the agency channel. In the last stage (Stage 7), the market price is realized, and then the manufacturer and the platform receive their payoffs. The timing of events is illustrated in Figure 1.

4. Equilibrium Results

In this section, we derive the equilibrium results of four scenarios: NN, NE, DN, and DE. The first letter represents the platform’s data analytics capability investment decision in Stage 1; while the second letter denotes the manufacturer’s encroachment decision in Stage 2. For these four cases, we derive the equilibrium outcomes by backward induction. To make all equilibrium solutions positive and ensure the existence of the optimal solution (Hessian matrix as negative definite matrix), we can derive:  c > c ¯ = m a x { k 2 8 , A k 2 2 ( 8 b 2 ( 5 + λ ) ) 2 } . Among them,  A = 16 + 64 λ + b ( b ( 8 + 8 b ( 2 + λ ) 4 λ ( 21 + 4 λ ) + b 2 ( λ ( 3 + λ ) ( 7 + λ ) 8 ) ) 32 ) .

4.1. No Data Analytics and No Encroachment (NN)

When the manufacturer does not encroach on the retail market and the platform does not invest in data analytics capability investment, the platform decides the selling quantity to solve the following problem:  max q R ( a q R w ) q R . In the second stage, we first derive the platform’s best response to the wholesale price  w , and it can be shown as  q ^ R ( w ) = 1 2 ( a w ) . Anticipating the platform’s best response function, the manufacturer decides the wholesale price  w  to solve the following problem:  max w w q ^ R ( w ) . By solving the equilibrium wholesale price  w  from the problem and substituting it back, we obtain the following equilibrium decisions:  w NN = a 2 ,   q R NN = a 4 . By substituting the equilibrium decisions back to the profit functions, the equilibrium profits of the manufacturer and platform under the NN scenario are, respectively,  Π M NN = a 2 8  and  Π P NN = a 2 16 .

4.2. No Data Analytics and Encroachment (NE)

In this setting, the manufacturer decides the selling quantity to maximize the profit:  max q M w q R + ( 1 λ ) ( a q M b q R ) q M . Solving the above problem, we obtain the manufacturer’s best response to  q R :   q ^ M ( q R ) = 1 2 ( a b q R ) . Taking the manufacturer’s subsequent best response into account, the platform maximizes the total profit from both channels:  max q R ( a q R b q ^ M ( q R ) w ) q R + λ ( a q ^ M ( q R ) b q R ) q ^ M ( q R ) . Solving the above problem, we obtain the platform’s best response to  w :   q ^ R ( w ) = 2 w + a ( b + b λ 2 ) b 2 ( 2 + λ ) 4 . By anticipating the platform’s best response function, the manufacturer solves the following problem:  max w w q ^ R ( w ) + ( 1 λ ) ( a q ^ M ( q ^ R ( w ) ) b q ^ R ( w ) ) q ^ M ( q ^ R ( w ) ) . By solving the equilibrium  w  from the problem and substituting it back, we obtain the following equilibrium decisions:  w NE = a ( 8 + b ( b 2 ( 1 + λ ( 4 + λ ) ) 6 b 8 λ ) ) 2 ( 8 b 2 ( 5 + λ ) ) q R NE = 2 a ( 1 b ) 8 b 2 ( 5 + λ ) q M NE = a ( 8 b 2 ( 3 + λ ) 2 b ) 2 ( 8 b 2 ( 5 + λ ) ) . By substituting the equilibrium decisions back to the profit functions, the equilibrium profits of the manufacturer and platform under the NE scenario are, respectively,  Π M NE = a 2 ( 12 b ( 8 + b b λ ( 4 + λ ) ) 8 λ ) 4 ( 8 b 2 ( 5 + λ ) )   and   Π P NE = a 2 A 4 ( 8 b 2 ( 5 + λ ) ) 2 .

4.3. Data Analytics and No Encroachment (DN)

When the manufacturer does not encroach on the retail market and the platform invests in data analytics capability investment, the platform decides the selling quantity to maximize the profit as follows:  max q R ( a q R + k y w ) q R 1 2 c y 2 . Solving the above problem, we obtain the platform’s best response to  w :   q ^ R ( w ) = 1 2 ( a w + k y ) . By anticipating the platform’s best response function, the manufacturer solves the following problem:   max w w q ^ R ( w ) . Solving the above problem, we obtain the manufacturer’s best response to  y :   w ^ ( y ) = 1 2 ( a + k y ) . By solving the equilibrium data analytics investment level  y  from the problem and substituting it back, we obtain the following equilibrium decisions:  y DN = a k 8 c k 2 w DN = 4 a c 8 c k 2 q R DN = 2 a c 8 c k 2 . By substituting the equilibrium decisions back to the profit functions, the equilibrium profits of the manufacturer and platform under the DN scenario are, respectively,  Π M DN = 8 a 2 c 2 ( 8 c k 2 ) 2  and  Π P DN = a 2 c 2 ( 8 c k 2 ) .
By taking the derivative of equilibrium outcomes with respect to  k  and  c , we have the following Proposition 1.
Proposition 1.
When the manufacturer does not encroach on the retail market, as the consumers’ personalized recommendation preference and the marginal investment cost (i.e.,  k ,   c ) increases, the changes of the equilibrium for the manufacture and platform satisfy the following:
( a ) w D N k > 0 ,   y D N k > 0 ,   Π M D N k > 0 ,   Π P D N k > 0 ;
( b ) w D N c < 0 ,   y D N c < 0 ,   Π M D N c < 0 ,   Π P D N c < 0 .
The proofs of all propositions are presented in Appendix A.
Proposition 1 indicates that when the manufacturer does not encroach on the retail market, the whole price, the data analytics investment level, the profit of the manufacturer, and the profit of the platform rise as the consumers’ personalized recommendation preference increases and the marginal investment cost decreases.

4.4. Data Analytics and Encroachment (DE)

When the manufacturer encroaches on the retail market and the platform invests in data analytics capability investment, the manufacturer decides the selling quantity to maximize the profit:  max q M w q R + ( 1 λ ) ( a q M b q R + k y ) q M . Solving the above problem, we obtain the manufacturer’s best response to  q R :   q ^ M ( q R ) = 1 2 ( a + k y b q R ) . The platform solves the following problem:  max q R ( a q R b q ^ M ( q R ) + k y w ) q R + λ ( a q ^ M ( q R ) b q R + k y ) q ^ M ( q R ) 1 2 c y 2 . Solving the above problem, we obtain the platform’s best response to  w :   q ^ R ( w ) = 2 w + a ( b + b λ 2 ) + k y ( b + b λ 2 ) b 2 ( 2 + λ ) 4 . By anticipating the platform’s best response function, the manufacturer solves the following problem:  max w w q ^ R ( w ) + ( 1 λ ) ( a q ^ M ( q ^ R ( w ) ) b q ^ R ( w ) + k y ) q ^ M ( q ^ R ( w ) ) . Solving the above problem, we derive the manufacturer’s best response to  y :   w ^ ( y ) = ( a + k y ) ( 8 + b ( b ( b + b λ ( 4 + λ ) 6 ) 8 λ ) ) 2 ( 8 b 2 ( 5 + λ ) ) . By solving the equilibrium data analytics investment level  y  from the problem and substituting it back, we obtain the following equilibrium decisions:
y DE = a k A 2 c ( 8 b 2 ( 5 + λ ) ) 2 k 2 A , w DE = a c ( 8 b 2 ( 5 + λ ) ) ( 8 + b ( b ( b + b λ ( 4 + λ ) 6 ) 8 λ ) ) 2 c ( 8 b 2 ( 5 + λ ) ) 2 k 2 A , q R DE = 4 a c ( 1 b ) ( 8 b 2 ( 5 + λ ) ) 2 c ( 8 b 2 ( 5 + λ ) ) 2 k 2 A , q M D E = a c ( 8 b 2 ( 5 + λ ) ) ( 8 b ( 2 + b ( 3 + λ ) ) ) 2 c ( 8 b 2 ( 5 + λ ) ) 2 k 2 A .
By substituting the equilibrium decisions back to the profit functions, the equilibrium profits of the manufacturer and platform under the DE scenario are, respectively:
Π M DE = a 2 c 2 ( 8 b 2 ( 5 + λ ) ) 3 ( 12 8 λ + b ( b ( λ ( 4 + λ ) 1 ) 8 ) ) ( 2 c ( 8 b 2 ( 5 + λ ) ) 2 k 2 A ) 2 , Π P DE = a 2 c A 2 ( 2 c ( 8 b 2 ( 5 + λ ) ) 2 k 2 A ) .
By taking the derivative of equilibrium outcomes with respect to  k  and  c , we have the following Proposition 2.
Proposition 2.
When the manufacturer encroaches on the retail market, as the consumers’ personalized recommendation preference and the marginal investment cost (i.e.,  k ,   c ) increases, the changes of the equilibrium for the manufacture and platform satisfy the following:
( a ) w D E k > 0 ,   y D E k > 0 ,   Π M D E k > 0 ,   Π P D E k > 0 ;
( b ) w D E c < 0 ,   y D E c < 0 ,   Π M D E c < 0 ,   Π P D E c < 0 .
According to Proposition 2, we find that when the manufacturer encroaches on the retail market, the whole price, the data analytics investment level, the profit of the manufacturer, and the profit of the platform rise as the consumers’ personalized recommendation preference increases and the marginal investment cost decreases.

5. Decision Analyses

5.1. Encroachment Decisions

We compared the wholesale price and selling quantity when the manufacturer decides not to encroach and to encroach. The results are as Proposition 3.
Proposition 3.
(a) When the platform does not invest in data analytics capability, the wholesale price in the NE case is lower than that in the NN case, and the total selling quantity in the NE case is higher than that in the NN case, that is,  w N E w N N ,   q R N E + q M N E q R N N . (b) When the platform invests in data analytics capability, there exists  c 1  such that the wholesale price in the DE case is lower than that in the DN case, that is,    w D E < w D N   if  c > m a x ( c 1 , c ¯ ) ; there exists  c 2  such that the total selling quantity in the DE case is higher than that in the DN case, that is,  q R D E + q M D E > q R D N if  c > m a x ( c 2 , c ¯ ) .
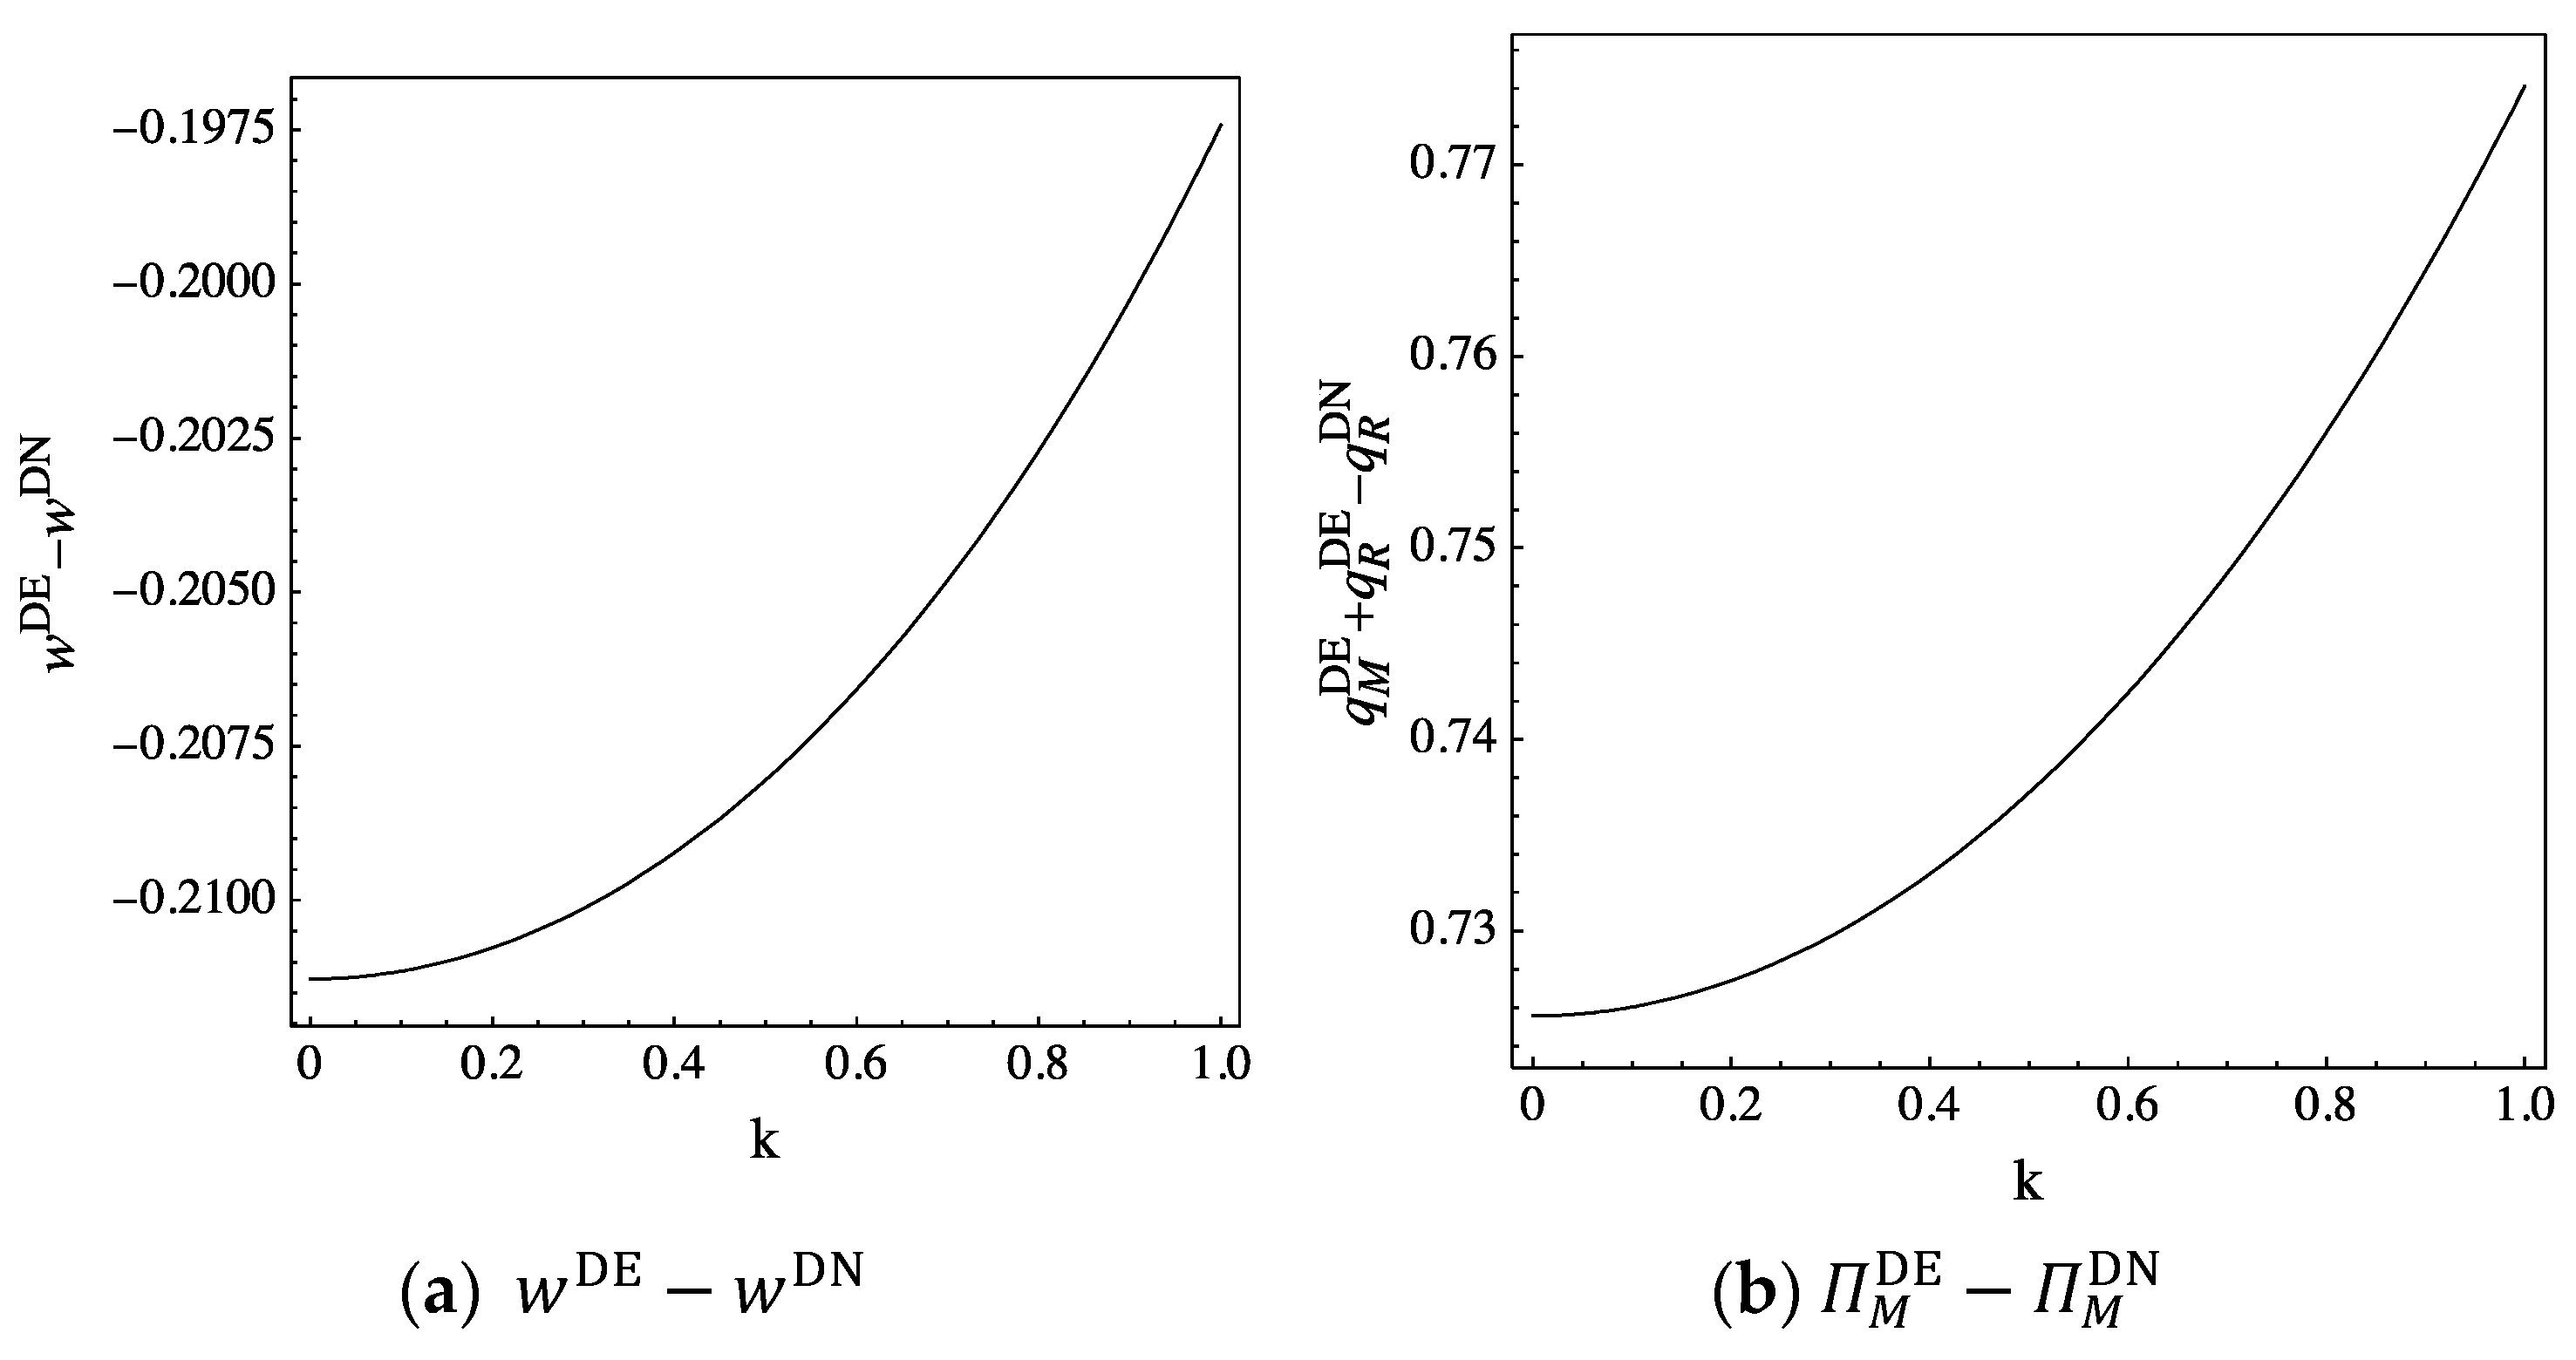
Proposition 3 shows that the manufacturer’s encroachment lowers the wholesale price and increases the total selling quantity when the platform does not invest in data analytics capability. This is because the encroachment mitigates the reselling channel’s double marginalization effect and lowers the wholesale price and the selling price of the product in the reselling channel. When the platform invests in data analytics capability, the manufacturer should increase the wholesale price if the marginal investment cost is small, and the manufacturer should lower the wholesale price if the marginal investment cost is high. We present part (b) of Proposition 3 in Figure 2. The values of the parameters are set as  a = 2 c = 5 b = 0.5 , and  λ = 0.4 . As shown in Figure 2, encroachment lowers the wholesale price more passively and increases the total selling quantity more aggressively as consumers’ sensitivity to personalized recommendations increases.
We compared the platform’s profit when the manufacturer decides not to encroach and to encroach. The results are summarized in Proposition 4.
Proposition 4.
There exists  λ 1  such that the platform’s profit in the NE case is larger than that in the NN case, and the platform’s profit in the DE case is larger than that in the DN case, that is,  Π P N E > Π P N N ,  Π P D E > Π P D N  if  λ > λ 1  otherwise.
Proposition 4 shows that when the commission rate is high, the manufacturer’s encroachment benefits the platform regardless of whether there is data analytics capability investment or not. If the commission rate increases, it becomes more profitable for the platform if the manufacturer encroaches by selling through the agency channel. The e-commerce platform will only allow the manufacturer to encroach if the e-commerce platform’s revenue from the agency channel is sufficient to compensate for the loss of revenue in the reselling channel. This is because the manufacturer’s encroachment not only enables the platform to capture a larger share of the revenue in the agency channel but also lowers the average wholesale price and mitigates the reselling channel’s double marginalization effect with the higher commission rate.
We compared the manufacturer’s profit in the NE case and NN case. The results are shown in the following proposition.
Proposition 5.
When the platform does not invest in data analytics capability, there exists  λ 2  such that the manufacturer’s profit in the NE case is larger than that in the NN case, that is,  Π M N E > Π M N N  if  λ < λ 2  otherwise.
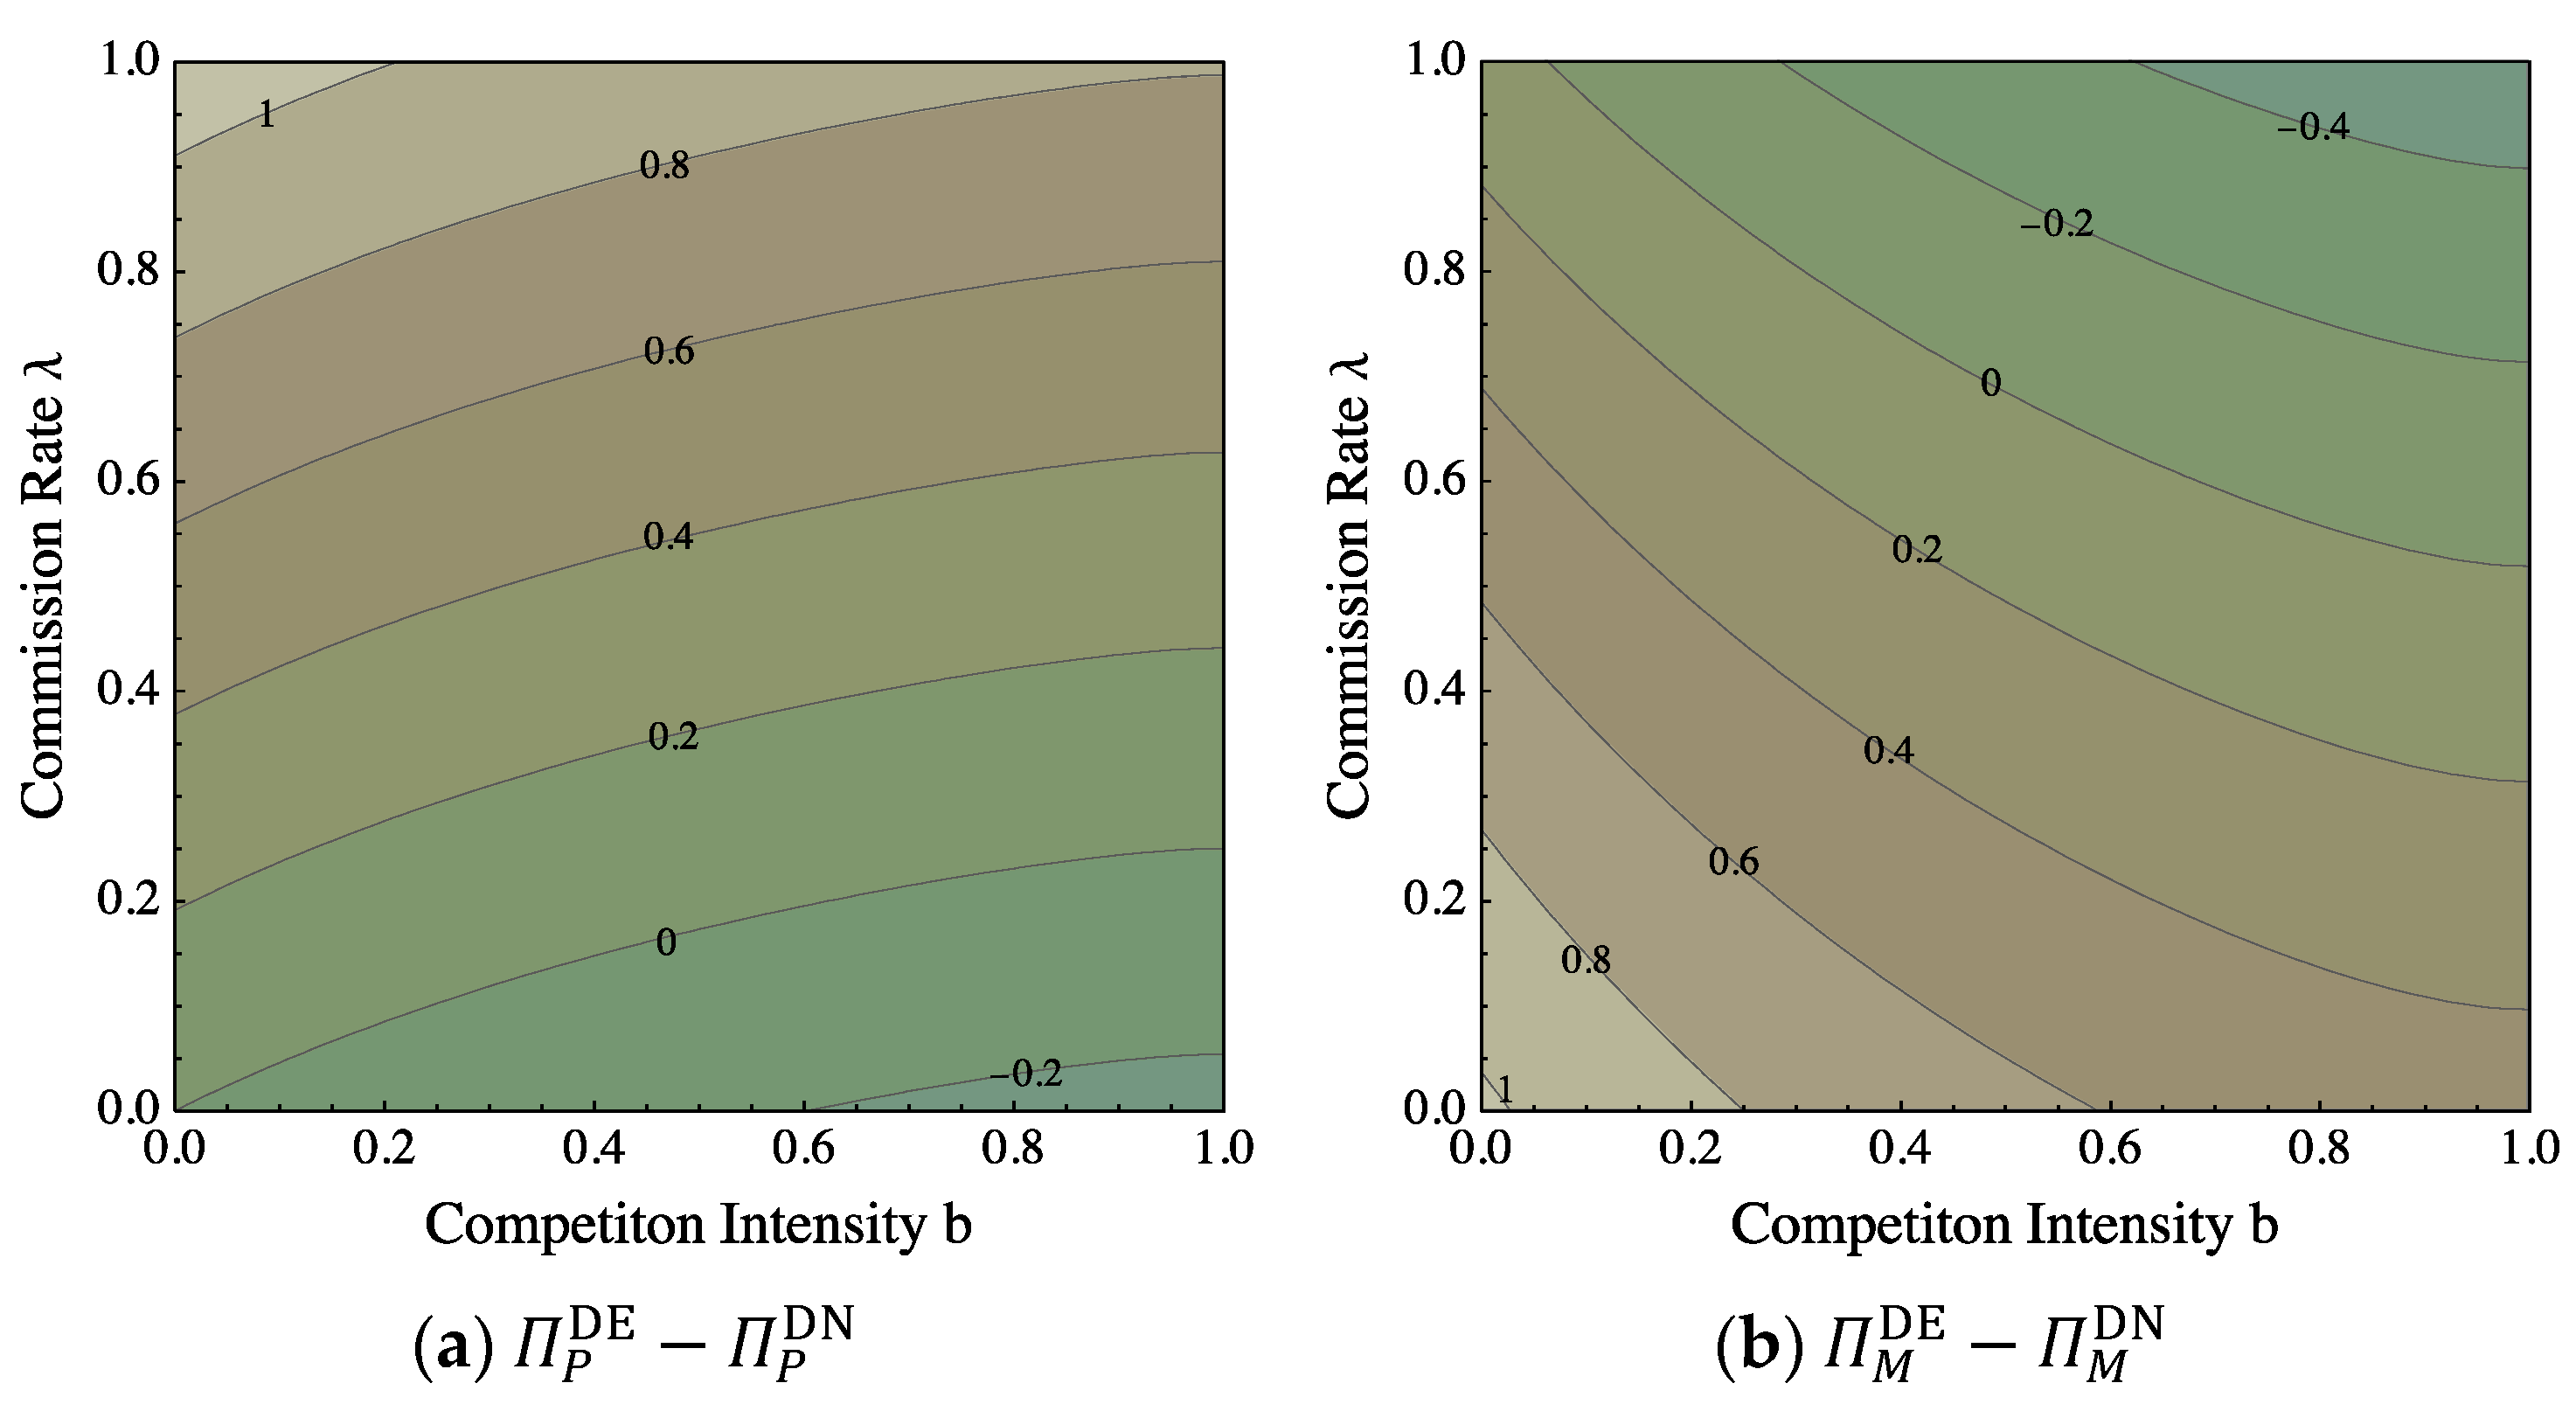
Proposition 5 demonstrates that the manufacturer should encroach when the commission rate is low. This is because when the commission rate is lower, the manufacturer receives a larger share of the agency channel’s revenue and, therefore, has more incentive to encroach. When the platform invests in data analytics capability, expressions for the equilibrium decisions and outcomes are complicated. As such, we performed numerical analyses to compare the equilibrium profit. We illustrate the results using contour plots in Figure 3 whereby, for this particular figure, we set  a = 2 c = 5 , and  k = 0.8  while varying  b  and  λ . Each curve in the contour plot joins points of equal value of either  Π P DE Π P DN  in Panel (a) or  Π M DE Π M DN  in Panel (b). We can observe from Figure 3 that the manufacturer chooses to encroach if the commission rate  λ  is sufficiently small, and the platform chooses to allow the encroachment if the commission rate  λ  is sufficiently high.
When the commission rate is high, the platform should choose to allow the encroachment, that is,  Π M DE > Π M DN  if  λ < λ 3  otherwise. As shown in Figure 4, when the platform invests in data analytics capability, the conditions for the manufacturer to encroach become more lenient, that is,  λ 2 < λ 3 . Therefore, the manufacturer is more likely to encroach when the platform invests in data analytics. The threshold  λ 1  is larger as competition intensity  b  becomes larger, and the threshold  λ 2  and  λ 3  are smaller as competition intensity  b  becomes larger.

5.2. Data Analytics Investment Decisions

We compared the wholesale price and selling quantity when the platform decides not to invest and to invest in data analytics capability. We present the results in Proposition 6.
Proposition 6.
(a) When the manufacturer decides not to encroach, the wholesale price and selling quantity in the DN case is greater than that in the NN case, that is,  w D N > w N N , q R D N > q R N N . (b) When the manufacturer decides to encroach, the wholesale price and selling quantity in the DE case is greater than that in the NE case, that is,  w D E > w N E , q R D E > q R N E , a n d   q M D E > q M N E .
Proposition 6 shows that the investment in data analytics capability boosts the wholesale price and selling quantity of the reselling channel and agency channel. When the online platform invests in data analytics capability, the consumer utility from purchasing the product increases. Consumers are willing to pay a higher price for the product, and the selling price and demand for the product subsequently increase.
We compared the platform’s profit and the manufacturer’s profit when the platform decides not to invest and to invest in data analytics capability. See the following proposition.
Proposition 7.
(a) When the manufacturer decides not to encroach, the profits in the DN case are higher than that in the NN case, that is,  Π M D N > Π M N N , Π P D N > Π P N N . (b) When the manufacturer decides to encroach, the profit in the DE case is higher than that in the NE case, that is,  Π M D E > Π M N E , Π P D E > Π P N E .
Proposition 7 shows that whether the manufacturer encroach or not, investing in data analytics is a dominant strategy for the e-commerce platform. The investment in data analytics capability can lead to a Pareto improvement, which means that the e-commerce platform and manufacturer can simultaneously achieve revenue growth. For the e-commerce platform, investing in data analytics capability realizes an increase in both demand and pricing of the product. The investment generates additional revenue that exceeds the cost of investment, thereby ensuring a positive return on investment, and ultimately leading to increased profit. For the manufacturer, the manufacturer can free ride on the platform’s investment in data analytics capability. The e-commerce platform’s investment in data analytics increases the demand for the product, leading to a subsequent increase in revenue for the manufacturer.
We compared the platform’s investment level in data analytics capability when the manufacturer decides not to encroach and to encroach. We present the results in Proposition 8.
Proposition 8.
The encroachment of the manufacturer enhances the platform’s investment level in data analytics capability, that is,  y D E > y D N .
Proposition 8 shows the investment level in the data analytics capability of the platform when the manufacturer encroaches is greater than the investment level in the data analytics capability of the platform when the manufacturer does not encroach. Proposition 8 offers an important insight that it creates more incentive for the platform to enhance the platform’s investment level in data analytics capability when the manufacturer encroaches. When the manufacturer encroaches, the platform invests more in data analytics to expand the market demand.

6. Conclusions

In this study, we analyzed four cases considering the manufacturer’s encroachment decisions and the platform’s data analytics capability investment decisions: no data analytics and no encroachment (NN), no data analytics and encroachment (NE), data analytics and no encroachment (DN), and data analytics and encroachment (DE). We performed sensitivity analysis to analyze the impact of some parameters on the equilibrium. We found that whether the manufacturer encroaches on the retail market or not, the whole price, data analytics investment level, the profit of manufacture, and the profit of the platform rise as the consumers’ personalized recommendation preference increases and the marginal investment cost decreases. Our outcomes revealed that when the platform invests in data analytics, the conditions for the manufacturer to encroach become more lenient, and encroachment lowers the wholesale price more passively and increases the total selling quantity more aggressively as consumers’ sensitivity to personalized recommendations increases. Moreover, we showed that the investment in data analytics capability can lead to a Pareto improvement, which means that the e-commerce platform and manufacturer can simultaneously achieve revenue growth. For the manufacturer, the manufacturer can free ride on the platform’s investment in data analytics capability. For the online retail platform, manufacturer encroachment always creates more incentive for the platform to enhance the platform’s investment level in data analytics capability.
The findings of this study have important practical implications. When these platforms make data analytics capability investment decisions, they have to account for their impact on the manufacturers’ channel decisions. As for the manufacturers, when they make channel decisions, they need to account for their impact on the platform’s incentive to invest in data analytics capability. Because the encroachment and data analytics capability investment decisions are complementary, one decision enhances the value of the other decision to the decision-maker. There are several limitations to this research. One limitation of our model is that we did not consider the negative effects of personalized recommendations to consumers, such as accurate recommendations causing consumers’ concerns about privacy disclosure. Another limitation is that we assumed there is no encroaching cost for the manufacturers’ encroachment so that we could focus on some key drivers (e.g., commission rate and competition intensity) that impact the manufacturer’s encroachment decisions and the platform’s data analytics capability investment decisions. It would be interesting to extend to the case where the manufacturer has an encroaching cost and examine how the main findings might change. Therefore, in subsequent studies, studying the impact of consumers’ privacy concerns and manufacturers’ encroaching costs could offer additional insights. In addition, the equilibrium results of this paper can be viewed as testable hypotheses, and empirically analyzing the impact of the factors on firms’ channel decisions verifies that our theory is a valuable extension.

Author Contributions

Writing—original draft preparation, F.H.; writing—review and editing, J.G.; supervision, F.H. All authors have read and agreed to the published version of the manuscript.

Funding

This research was funded by Shanghai University of Finance and Economics Graduate Innovation Fund (Grant No. CXJJ-2021-343, Grant No. CXJJ-2021-379).

Data Availability Statement

No new data were created or analyzed in this study. Data sharing is not applicable to this article.

Conflicts of Interest

The authors declare no conflicts of interest.

Appendix A

Proof of Proposition 1.
When the manufacturer does not encroach on the retail market and the platform invests in data analytics capability investment, by taking the derivative of equilibrium outcomes with respect to  k  and  c , we have:
w DN k = 8 a c k ( 8 c k 2 ) 2 > 0   y DN k = a ( 8 c + k 2 ) ( 8 c k 2 ) 2 > 0 Π M DN k = 32 a 2 c 2 k ( 8 c k 2 ) 3 > 0 Π P DN k = a 2 c k ( 8 c k 2 ) 2 > 0 w D N c = 4 a k 2 ( 8 c k 2 ) 2 < 0   y D N c = 8 a k ( 8 c k 2 ) 2 < 0 Π M D N c = 16 a 2 c k 2 ( 8 c k 2 ) 3 < 0 Π P D N c = a 2 k 2 2 ( 8 c k 2 ) 2 < 0
This completes the proof. □
Proof of Proposition 2.
When the manufacturer encroaches on the retail market and the platform invests in data analytics capability investment, by taking the derivative of equilibrium outcomes with respect to  k  and  c , we have:
w DE k = 2 a A c k ( 8 b 2 ( 5 + λ ) ) ( 8 b ( 8 λ + b ( 6 b b λ ( 4 + λ ) ) ) ) ( 2 c ( 8 b 2 ( 5 + λ ) ) 2 A k 2 ) 2 > 0   y DE k = a A ( 2 c ( 8 b 2 ( 5 + λ ) ) 2 + A k 2 ) 2 ( 2 c ( 8 b 2 ( 5 + λ ) ) 2 A k 2 ) 2 > 0 Π M DE k = 4 a 2 A c 2 k ( 8 b 2 ( 5 + λ ) ) 3 ( 12 8 λ b ( 8 + b ( 1 λ ( 4 + λ ) ) ) ) ( 2 c ( 8 b 2 ( 5 + λ ) ) 2 A k 2 ) 3 > 0 Π P DE k = a 2 A 2 c k ( 2 c ( 8 b 2 ( 5 + λ ) ) 2 A k 2 ) 2 > 0 w D E c = a A k 2 ( 8 b 2 ( 5 + λ ) ) ( 8 b ( 8 λ + b ( 6 b b λ ( 4 + λ ) ) ) ) ( 2 c ( 8 b 2 ( 5 + λ ) ) 2 A k 2 ) 2 < 0   y D E c = 2 a A k ( 8 b 2 ( 5 + λ ) ) 2 ( 2 c ( 8 b 2 ( 5 + λ ) ) 2 A k 2 ) 2 < 0 Π M D E c = 2 a 2 A c k 2 ( 8 b 2 ( 5 + λ ) ) 3 ( 12 8 λ b ( 8 + b ( 1 λ ( 4 + λ ) ) ) ) ( 2 c ( 8 b 2 ( 5 + λ ) ) 2 A k 2 ) 3 < 0 Π P D E c = a 2 A 2 k 2 2 ( 2 c ( 8 b 2 ( 5 + λ ) ) 2 A k 2 ) 2 < 0
This completes the proof. □
Proof of Proposition 3.
When the platform does not invest in data analytics capability:
w NE w NN = a b ( b ( b + λ + b λ ( 4 + λ ) 1 ) 8 λ ) 2 ( 8 b 2 ( 5 + λ ) ) < 0 q R NE q R NN = a b ( b ( 5 + λ ) 8 ) 4 ( 8 b 2 ( 5 + λ ) ) < 0
When the platform invests in data analytics capability:
w DE w DN = 1 ( 2 c ( 8 b 2 ( 5 + λ ) ) 2 A k 2 ) ( 8 c k 2 ) ( a c ( ( 8 b 2 ( 5 + λ ) ) ( 8 + b ( b ( b + b λ ( 4 + λ ) 6 ) 8 λ ) ) ( 8 c k 2 ) 4 ( 2 c ( 8 b 2 ( 5 + λ ) ) 2 A k 2 ) ) )
We can show that  w DE w DN  is equal to a positive factor multiplied by  f 1 = ( 8 b 2 ( 5 + λ ) ) ( 8 + b ( b ( b + b λ ( 4 + λ ) 6 ) 8 λ ) ) ( 8 c k 2 ) 4 ( 2 c ( 8 b 2 ( 5 + λ ) ) 2 A k 2 ) . Given  b  and  λ , we can look at  f 1  as a function of  c .  When  0 λ 1  and  0 < b < 1 , the function  f 1  is decreasing in  c .
The solution of  f 1 = 0  is  c = c 1 .
c 1 = k 2 ( 4 A ( 8 b 2 ( 5 + λ ) ) ( 8 b ( 8 λ + b ( 6 b b λ ( 4 + λ ) ) ) ) ) 8 b ( 8 b 2 ( 5 + λ ) ) ( 8 λ + b ( 1 b λ b λ ( 4 + λ ) ) )
It follows that  f 1 > 0  if  c < c 1 .
When the platform invests in data analytics capability:
q R DE + q M DE q R DN = 1 ( 2 c ( 8 b 2 ( 5 + λ ) ) 2 A k 2 ) ( 8 c k 2 ) ( a c ( ( b ( b ( b ( 5 + λ ) ( 6 + b ( 3 + λ ) ) 4 ( 21 + 5 λ ) ) 48 ) + 96 ) ( 8 c k 2 ) 2 ( 2 c ( 8 b 2 ( 5 + λ ) ) 2 A k 2 ) ) )
We can show that  q R DE + q M DE q R DN  is equal to a positive factor multiplied by  f 2 = ( b ( b ( b ( 5 + λ ) ( 6 + b ( 3 + λ ) ) 4 ( 21 + 5 λ ) ) 48 ) + 96 ) ( 8 c k 2 ) 2 ( 2 c ( 8 b 2 ( 5 + λ ) ) 2 A k 2 ) . Given  b  and  λ , we can look at  f 2  as a function of  c .  When  0 λ 1  and  0 < b < 1 , the function  f 2  is increasing in  c .
The solution of  f 2 = 0  is  c = c 2 .
c 2 = ( 2 A + ( 8 b 2 ( 5 + λ ) ) ( 12 b ( 6 + b ( 3 + λ ) ) ) ) k 2 4 ( 8 b 2 ( 5 + λ ) ) ( 16 b ( 12 + b + b λ ) )
It follows that  f 2 < 0  if  c < c 2 , the proof is completed. □
Proof of Proposition 4.
Note that:
Π P NE Π P NN = a 2 ( 4 A ( 8 b 2 ( 5 + λ ) ) 2 ) 16 ( 8 b 2 ( 5 + λ ) ) 2 Π P DE Π P DN = a 2 c 2 ( 4 A ( 8 b 2 ( 5 + λ ) ) 2 ) ( 2 c ( 8 b 2 ( 5 + λ ) ) 2 A k 2 ) ( 8 c k 2 )
We can show that  Π P NE Π P NN  and  Π P DE Π P DN  are equal to a positive factor multiplied by  f 3 = 4 ( 16 + 64 λ + b ( b ( 8 + 8 b ( 2 + λ ) 4 λ ( 21 + 4 λ ) + b 2 ( λ ( 3 + λ ) ( 7 + λ ) 8 ) ) 32 ) ) ( 8 b 2 ( 5 + λ ) ) 2 . Given  b , we can look at  f 3  as a function of  λ .  When  0 λ 1  and  0 < b < 1 , the function  f 3  is increasing in  λ .
At  λ = 0 f 3 λ  can be expressed as a function of  b :
g 1 = 4 ( 16 + b ( b ( 8 + 16 b 8 b 2 ) ) 32 ) ( 8 5 b 2 ) 2
max b ( 0 , 1 ) g 1 = lim b 0 4 ( 16 + b ( b ( 8 + 16 b 8 b 2 ) ) 32 ) ( 8 5 b 2 ) 2 = 0
Hence, we can get  g 1 < 0 .
At  λ = 1 f 3 λ  can be expressed as a function of  b :
g 2 = 4 ( 80 + b ( b ( 24 b + 24 b 2 92 ) ) 32 ) ( 8 6 b 2 ) 2
min b ( 0 , 1 ) g 2 = lim b 1 4 ( 80 + b ( b ( 24 b + 24 b 2 92 ) ) 32 ) ( 8 6 b 2 ) 2 = 12
Hence, we can get  g 2 > 0 .
Therefore, given  b ,   f 3  crosses zero from below once. The solution of  f 3 = 0  is  λ = λ 3 . It follows that  f 3 > 0  if  λ < λ 1  and  f 3 < 0  if  λ < λ 1 , the proof is completed. □
Proof of Proposition 5.
Note that:
Π M NE Π M NN = a 2 ( 16 ( 1 λ ) + b ( b ( 3 + λ ( 9 + 2 λ ) ) 16 ) ) 8 ( 8 b 2 ( 5 + λ ) )
We can show that  Π M NE Π M NN  is equal to a positive factor multiplied by  f 4 = 16 ( 1 λ ) + b ( b ( 3 + λ ( 9 + 2 λ ) ) 16 ) . Given  b , we can look at  f 4  as a function of  λ .  When  0 λ 1  and  0 < b < 1 , the function  f 4    is decreasing in    λ .
At  λ = 0 f 4 λ  can be expressed as a function of  b :
g 3 = 16 b ( 16 3 b )
min b ( 0 , 1 ) g 3 = lim b 1 16 b ( 16 3 b ) = 3  
Hence, we can get  g 3 > 0 .
At  λ = 1 f 4 λ  can be expressed as a function of  b :
g 4 = b ( 16 14 b )
max b ( 0 , 1 ) g 4 = lim b 0 b ( 16 14 b ) = 0
Hence, we can get  g 4 < 0 .
Therefore, given  b ,   f 4  crosses zero from below once. The solution of  f 4 = 0  is  λ = λ 2 . It follows that  f 4 > 0  if  λ < λ 2  and  f 4 > 0  if  λ > λ 2 , the proof is completed. □
Proof of Proposition 6.
When comparing the wholesale price and selling quantity when the platform decides not to invest and to invest in data analytics capability, we can get:
w DN w NN = 4 a c 8 c k 2 a 2 > 0
q R DN q R NN = 2 a c 8 c k 2 a 4 > 0
w DE w NE = a A k 2 ( 8 + b ( b ( b + b λ ( 4 + λ ) 6 ) 8 λ ) ) 2 ( 8 b 2 ( 5 + λ ) ) ( 2 c ( 8 b 2 ( 5 + λ ) ) 2 A k 2 ) > 0
q R DE q R NE = 2 a A ( 1 b ) k 2 ( 8 b 2 ( 5 + λ ) ) ( 2 c ( 8 b 2 ( 5 + λ ) ) 2 A k 2 ) > 0
q M DE q M NE = a A k 2 ( 8 b ( 2 + b ( 3 + λ ) ) ) 2 ( 8 b 2 ( 5 + λ ) ) ( 2 c ( 8 b 2 ( 5 + λ ) ) 2 A k 2 ) > 0
This completes the proof. □
Proof of Proposition 7.
When comparing the platform’s profit and the manufacturer’s profit when the platform decides not to invest and to invest in data analytics capability, we can get:
Π M DN Π M NN = 8 a 2 c 2 ( 8 c k 2 ) 2 a 2 8 > 0
Π P DN Π P NN = a 2 c 2 ( 8 c k 2 ) a 2 16 > 0
Π M DE Π M NE = a 2 A k 2 ( 4 c ( 8 b 2 ( 5 + λ ) ) 2 A k 2 ) ( 12 8 λ + b ( b ( λ ( 4 + λ ) 1 ) 8 ) ) 4 ( 8 b 2 ( 5 + λ ) ) ( 2 c ( 8 b 2 ( 5 + λ ) ) 2 A k 2 ) 2 > 0
Π P DE Π P NE = a 2 A 2 k 2 4 ( 8 b 2 ( 5 + λ ) ) 2 ( 2 c ( 8 b 2 ( 5 + λ ) ) 2 A k 2 ) > 0
This completes the proof. □
Proof of Proposition 8.
Note that:
y DE y DN = 2 a c k ( 4 A ( 8 b 2 ( 5 + λ ) ) 2 ) ( 2 c ( 8 b 2 ( 5 + λ ) ) 2 A k 2 ) ( 8 c k 2 )
We can show that  y DE y DN  is equal to a positive factor multiplied by  f 3 = 4 ( 16 + 64 λ + b ( b ( 8 + 8 b ( 2 + λ ) 4 λ ( 21 + 4 λ ) + b 2 ( λ ( 3 + λ ) ( 7 + λ ) 8 ) ) 32 ) ) ( 8 b 2 ( 5 + λ ) ) 2 .
Details are omitted. From Proposition 4, we can know that  f 3 < 0  if  λ < λ 1  and  f 3 0  if  λ λ 1 , and the platform allows the manufacturer to encroach only if  λ > λ 1 , so we always have  y DE y DN > 0 , the proof is completed. □

References

  1. Cohen, M.C. Big Data and Service Operations. Prod. Oper. Manag. 2018, 27, 1709–1723. [Google Scholar] [CrossRef]
  2. Curko, K.; Silovic, T.; Merkas, Z. Challenges of Application of the Big Data in Marketing: Case Study Croatia. WSEAS Trans. Bus. Econ. 2018, 15, 162–170. [Google Scholar]
  3. Choi, T.M.; Wallace, S.W.; Wang, Y. Big Data Analytics in Operations Management. Prod. Oper. Manag. 2018, 27, 1868–1883. [Google Scholar] [CrossRef]
  4. Kumar, S.; Mookerjee, V.; Shubham, A. Research in Operations Management and Information Systems Interface. Prod. Oper. Manag. 2018, 27, 1893–1905. [Google Scholar] [CrossRef]
  5. Feng, Q.; Shanthikumar, J.G. How Research in Production and Operations Management May Evolve in the Era of Big Data. Prod. Oper. Manag. 2018, 27, 1670–1684. [Google Scholar] [CrossRef]
  6. Rust, R.T.; Huang, M.-H. The Service Revolution and the Transformation of Marketing Science. Mark. Sci. 2014, 33, 206–221. [Google Scholar] [CrossRef]
  7. Jiang, H.; Qi, X.; Sun, H. Choice-Based Recommender Systems: A Unified Approach to Achieving Relevancy and Diversity. Oper. Res. 2014, 62, 973–993. [Google Scholar] [CrossRef]
  8. Besbes, O.; Gur, Y.; Zeevi, A. Optimization in Online Content Recommendation Services: Beyond Click-through Rates. Manuf. Serv. Oper. Manag. 2016, 18, 15–33. [Google Scholar] [CrossRef]
  9. Singhal, K.; Feng, Q.; Ganeshan, R.; Sanders, N.R.; Shanthikumar, J.G. Introduction to the Special Issue on Perspectives on Big Data. Prod. Oper. Manag. 2018, 27, 1639–1641. [Google Scholar] [CrossRef]
  10. Lutfi, A.; Alrawad, M.; Alsyouf, A.; Almaiah, M.A.; Al-Khasawneh, A.; Al-Khasawneh, A.L.; Alshira’h, A.F.; Alshirah, M.H.; Saad, M.; Ibrahim, N. Drivers and Impact of Big Data Analytic Adoption in the Retail Industry: A Quantitative Investigation Applying Structural Equation Modeling. J. Retail. Consum. Serv. 2023, 70, 103129. [Google Scholar] [CrossRef]
  11. Ghoshal, A.; Kumar, S.; Mookerjee, V. Dilemma of Data Sharing Alliance: When Do Competing Personalizing and Non-personalizing Firms Share Data. Prod. Oper. Manag. 2020, 29, 1918–1936. [Google Scholar] [CrossRef]
  12. Liu, W.; Yan, X.; Li, X.; Wei, W. The Impacts of Market Size and Data-Driven Marketing on the Sales Mode Selection in an Internet Platform Based Supply Chain. Transp. Res. Logist. Transp. Rev. 2020, 136, 101914. [Google Scholar] [CrossRef]
  13. Zhang, Z.; Shivendu, S.; Wang, P. Is Investment in Data Analytics Always Profitable? The Case of Third-Party-Online-Promotion Marketplace. Prod. Oper. Manag. 2021, 30, 2321–2337. [Google Scholar] [CrossRef]
  14. Chiang, W.K.; Chhajed, D.; Hess, J.D. Direct Marketing, Indirect Profits: A Strategic Analysis of Dual-Channel Supply-Chain Design. Manage Sci. 2003, 49, 1–20. [Google Scholar] [CrossRef]
  15. Arya, A.; Mittendorf, B.; Sappington, D.E.M. The Bright Side of Supplier Encroachment. Mark. Sci. 2007, 26, 651–659. [Google Scholar] [CrossRef]
  16. Li, Z.; Gilbert, S.M.; Lai, G. Supplier Encroachment under Asymmetric Information. Manage Sci. 2014, 60, 449–462. [Google Scholar] [CrossRef]
  17. Li, Z.; Gilbert, S.M.; Lai, G. Supplier Encroachment as an Enhancement or a Hindrance to Nonlinear Pricing. Prod. Oper. Manag. 2015, 24, 89–109. [Google Scholar] [CrossRef]
  18. Yoon, D. Supplier Encroachment and Investment Spillovers. Prod. Oper. Manag. 2016, 25, 1839–1854. [Google Scholar] [CrossRef]
  19. Yang, H.; Luo, J.; Zhang, Q. Supplier Encroachment under Nonlinear Pricing with Imperfect Substitutes: Bargaining Power versus Revenue-Sharing. Eur. J. Oper. Res. 2018, 267, 1089–1101. [Google Scholar] [CrossRef]
  20. Zhang, J.; Cao, Q.; He, X. Manufacturer Encroachment with Advertising. Omega (Westport) 2020, 91, 102013. [Google Scholar] [CrossRef]
  21. Gao, L.; Guo, L.; Orsdemir, A. Dual-channel Distribution: The Case for Cost Information Asymmetry. Prod. Oper. Manag. 2021, 30, 494–521. [Google Scholar] [CrossRef]
  22. Ha, A.Y.; Luo, H.; Shang, W. Supplier Encroachment, Information Sharing, and Channel Structure in Online Retail Platforms. Prod. Oper. Manag. 2022, 31, 1235–1251. [Google Scholar] [CrossRef]
  23. Guan, H.; Yang, Z.; Gurnani, H. Value of Information with Manufacturer Encroachment. Prod. Oper. Manag. 2023, 32, 780–793. [Google Scholar] [CrossRef]
  24. Huang, S.; Chen, Y. Manufacturer Encroachment with Competing Dual-Purpose Online Retail Platforms. J. Retail. Consum. Serv. 2023, 73, 103370. [Google Scholar] [CrossRef]
  25. Shi, S.; Wang, C.; Cheng, T.C.E.; Liu, S. Manufacturer Encroachment with an E-commerce Division. Prod. Oper. Manag. 2023, 32, 2002–2019. [Google Scholar] [CrossRef]
  26. Hagiu, A.; Wright, J. Marketplace or Reseller? Manag. Sci. 2015, 61, 184–203. [Google Scholar] [CrossRef]
  27. Abhishek, V.; Jerath, K.; Zhang, Z.J. Agency Selling or Reselling? Channel Structures in Electronic Retailing. Manag. Sci. 2016, 62, 2259–2280. [Google Scholar] [CrossRef]
  28. Kwark, Y.; Chen, J.; Raghunathan, S. Platform or Wholesale? A Strategic Tool for Online Retailers to Benefit from Third-Party Information. MIS Q. 2017, 41, 763–786, A1–A17. [Google Scholar] [CrossRef]
  29. Tian, L.; Vakharia, A.J.; Tan, Y.; Xu, Y. Marketplace, Reseller, or Hybrid: Strategic Analysis of an Emerging E-commerce Model. Prod. Oper. Manag. 2018, 27, 1595–1610. [Google Scholar] [CrossRef]
  30. Jerath, K.; Zhang, Z.J. Platform Retailing: From Offline “Stores within a Store” to Online “Marketplaces”. In Handbook of Research on Distribution Channels; Edward Elgar Publishing: Cheltenham, UK, 2019; pp. 52–74. [Google Scholar]
  31. Ha, A.Y.; Tong, S.; Wang, Y. Channel Structures of Online Retail Platforms. Manuf. Serv. Oper. Manag. 2022, 24, 1547–1561. [Google Scholar] [CrossRef]
  32. Cao, Q.; Geng, X.; Zhang, J. Impact of Channel Structure on a Manufacturer’s Bundling Decision with an Application to Digital Goods. Prod. Oper. Manag. 2022, 31, 1679–1697. [Google Scholar] [CrossRef]
  33. Zhen, X.; Xu, S. Who Should Introduce the Third-Party Platform Channel under Different Pricing Strategies? Eur. J. Oper. Res. 2022, 299, 168–182. [Google Scholar] [CrossRef]
  34. Hong, X.; Gong, Y.; Rekik, Y.; Li, Q. Public versus Private Information: The Impact of Quality Information Sharing on Competition under Different Channel Structures. Comput. Ind. Eng. 2023, 176, 108937. [Google Scholar] [CrossRef]
  35. Hotkar, P.; Gilbert, S.M. Supplier Encroachment in a Nonexclusive Reselling Channel. Manage Sci. 2021, 67, 5821–5837. [Google Scholar] [CrossRef]
Figure 1. Timing of events.
Mathematics 12 01371 g001
Figure 2. (a) Wholesale price comparison in the presence of data analytics; (b) Selling quantity comparison in the presence of data analytics.
Mathematics 12 01371 g002
Figure 3. (a) The platform’s profit comparison in the presence of data analytics; (b) The manufacturer’s profit comparison in the presence of data analytics.
Mathematics 12 01371 g003
Figure 4. Equilibrium profit comparison.
Mathematics 12 01371 g004
Table 1. Summary of notation.
ParametersDescription
  i = R , M Subscripts representing reselling channel and agency channel, respectively
  N N No data analytics and no encroachment
  N E No data analytics and encroachment
  D N Data analytics and no encroachment
  D E Data analytics and encroachment
  a Potential market size
  b Competition intensity
  c Marginal investment cost
  w Wholesale price
  k Consumers’ sensitivity to personalized recommendation
  λ Commission rate
  y Data analytics investment level
  q i Selling quantity
  p i Selling price
  Π M Profit of the manufacturer
  Π P Profit of the platform
Disclaimer/Publisher’s Note: The statements, opinions and data contained in all publications are solely those of the individual author(s) and contributor(s) and not of MDPI and/or the editor(s). MDPI and/or the editor(s) disclaim responsibility for any injury to people or property resulting from any ideas, methods, instructions or products referred to in the content.