Article

Evolution of Wellbore Pressure During Hydraulic Fracturing in a Permeable Medium

Department of Civil Engineering, Faculty of Engineering, University of Zanjan, Zanjan 45371-38791, Iran
Mathematics 2025, 13(1), 135; https://doi.org/10.3390/math13010135
Submission received: 3 November 2024 / Revised: 12 December 2024 / Accepted: 27 December 2024 / Published: 1 January 2025
(This article belongs to the Topic Analytical and Numerical Models in Geo-Energy)

Abstract

:
In hydraulic fracturing tests, the initial crack length and the compressibility of the injection system have a significant effect on the initiation and propagation of the fracture. Numerical or theoretical models that ignore the compressibility of the injection system are unable to accurately predict fracture behavior. In this paper, a 2D analytical/numerical model based on linear elastic fracture mechanics is presented for the initiation and propagation of hydraulic fracturing from two transversely symmetrical cracks in a borehole wall. It is assumed that the fracture is driven by compressible inviscid fluid in a permeable medium. To solve the problem, the governing equations are made dimensionless and the problem is solved in the compressibility–toughness-dominated propagation regime. According to the results, the initial crack length and the compressibility of the injection system have a significant effect on fracture initiation behavior. When the initial flaw length is small or compressibility effects are important, the initiation of the fracture is accompanied by instability and the occurrence of a sudden decrease in borehole pressure and a sudden increase in crack length. If the initial crack length is large or the compressibility effects are negligible, the crack propagation is stable. The leak-off coefficient has no effect on the pressure level required for crack propagation, but with an increase in leak-off, more time is required to reach the conditions for crack propagation. The results obtained in this paper provide good insights into the design of hydraulic fracturing processes.

1. Introduction

Hydraulic fracturing plays an important role in many applications in the natural gas and oil industry [1,2]. The process can generally be defined as the unintentional (or intentional) initiation and propagation of fracturing due to the pressure of the fluid flowing within the fracture [3]. Knowledge of fracture dimensions, fracture geometry, and well pressure is critical for the design and integrity of hydraulic fracture field operations. In hydraulic fracturing operations, one of the basic questions is whether or not fracture containment is achieved.
Hydraulic fracture experiments with low-viscosity fluids have shown that immediately after the initiation of fracturing, cracks undergo unstable growth, during which their length increases very rapidly while the borehole pressure drops very sharply [4]. So far, many models have been proposed for determining hydraulic fracturing initiation pressure; however, models that do not consider the compressibility of the fluid and the injection system are unable to predict the unstable growth of initial cracks [5,6]. In some other numerical models, the borehole is considered as a small injection source. These models ignore the near-borehole effect on the fracture initiation pressure [7,8].
Desroches and Thiercelin [5] presented a fully coupled numerical model for analyzing the pressure response during the propagation and closure of a radial hydraulic fracture. However, one of the assumptions of this model was that the fracture fluid was incompressible; furthermore, it did not consider the effect of the borehole. Using a laboratory model of hydraulic fracturing, Tanikella et al. [6] attempted to measure the width of a penny-shaped or disk-like radial fracture. In this model, it was assumed that radial cracks grew from a source point during the injection of a viscous fluid at a constant flow rate. Experiments showed that crack propagation in the impermeable medium continued even after the injection was stopped. Savitski and Detournay [7] presented an analytical/numerical model for the propagation of penny-shaped hydraulic fractures in impermeable elastic media. In this model, it was assumed that the crack was driven by the injection of an incompressible Newtonian fluid from a source at the center of the crack. The scaled equations for that model showed that the different crack propagation regimes were controlled only by the dimensionless toughness. Adachi and Detournay [8] presented a solution to the plane–strain problem of hydraulic fracturing propagated in a permeable linear elastic medium; that analysis also considered injection from a source point and the effect of the borehole was not considered in the model. These models did not consider the effect of fluid compressibility and borehole radius and therefore, they are not suitable for investigating fracture pressure at early stages.
In the conventional interpretation of the hydraulic fracturing process, it is assumed that the fracture pressure (breakdown pressure), i.e., the maximum pressure that is obtained during the pressurization of the wellbore test interval, represents an example of the initiation of hydro-fracturing [9,10]. However, the assumption that hydraulic fracture necessarily initiates at peak pressure has been challenged. For example, using fracture mechanics theory, Detournay and Carbonell [11] identified three critical pressures in the hydraulic fracture test; the first of these was the fracture initiation pressure, the second the pressure corresponding to unstable crack propagation, and the third the peak pressure. They assumed that the conditions for unstable fracture propagation, characterized as the state of continued crack propagation during pressure reduction, was actually equal to the breakdown pressure. They defined the fracture initiation pressure as the pressure at which a pre-existing small natural flaw around the wellbore achieved limit equilibrium. They inferred that under conditions of uniform far-field stress and slow pressurization rates, fracture propagation is always unstable at initiation and therefore, the initiation stress in this condition is the breakdown pressure. Conversely, when the in situ far-field stresses are non-isotropic, the fracture propagation can be either unstable or stable, meaning that the fracture initiation pressure in this case is usually lower than the breakdown pressure.
Fatahi et al. presented a hydraulic fracturing simulation model using the distinct element method [12]. Using that model, they described the fracture initiation pressure and breakdown pressure. Their studies showed that the initiation pressure and the breakdown pressure are not necessarily the same, and once initiation occurs, the pressure can still increase until it reaches its peak. Also, at the time of fracture initiation, the pressure–time curve deviates from the linear trend. Li et al. [13] investigated the mechanism of fracture network propagation using the two-dimensional finite element method and the finite pore-pressure cohesive zone method. They observed that fluid viscosity and injection rate affected the propagation of the fracture network at different times. Zhu et al. [14] stated that the bottom hole pressure of hydraulic fractures in ductile reservoirs was much higher than that in hydraulic fracturing simulations. Using a numerical analytical model, Bunger et al. [15] showed that the difference between fracture initiation pressure and peak pressure depended on the fluid viscosity, deviatoric stress, initial flaw length, and wellbore radius. Mokryakov [16] proposed an analytical solution for hydraulic fracturing with Barenblatt’s cohesive zone, based on the KGD model, assuming impermeable elastic rock, showing that the derived solutions from the cohesive zone model fitted the pressure log much more accurately than the LEFM approach. Wang et al. [17] developed a poro-elasto-plastic model using the cohesive zone method and investigated the effect of the plastic properties of the formation on the fracture process. Their results showed that plastic and highly deformable formations exhibited higher breakdown and propagation pressure. In another study, using a finite element numerical model, the effect of cross-sectional elongation in breakout boreholes and elliptical boreholes on the fracture initiation pressure and fracture initiation position was investigated [18,19].
Analytical solutions of fluid-driven fractures have played a major role in the design of early-stage fracture analysis. For example, the PKN [20] and KGD [21,22] models are two well-known fracture models that can predict the behavior of constant-height plane–strain bi-wing fractures. The PKN model is suitable for long fractures with low height and an elliptical vertical cross-section, while the KGD model is suitable for short fractures where the plane–strain assumptions are applicable. The penny-shaped or radial crack model is applicable to homogeneous reservoirs where the injection zone is nearly a point source [23].
In recent years, scaling law and asymptotic solutions have been used to sense the different propagation regimes of hydraulic fractures [24,25,26,27]. General scaling laws were introduced in the original work presented by Detournay [24] to address the problem of hydraulic fracturing. Scaling is able to reduce the number of parameters on which a solution depends [28]. After scaling, crack propagation regimes depend on the dimensionless parameters of the problem.
The motivation of this study was to investigate the effect of borehole radius and injection system compressibility on the early stages of hydraulic fracturing. Meanwhile, using the model presented in this article, the effect of leak-off coefficient and deviatoric stresses on crack initiation and propagation was also investigated. To achieve this goal, an analytical model was used in which the crack volume and stress intensity factor at the crack tip were expressed in terms of their equivalent quantities for a reference Griffith crack. The geometry of the problem includes two symmetric cracks originating across a borehole in a permeable medium, where the cracks are driven by a compressible inviscid fluid. It is assumed that fluid infiltration into the rock medium obeys the one-dimensional Carter’s law, and the coupling between rock deformation and fluid flow is ignored. In the second part of the article, the mathematical model is presented. The third part of the article is derived from a dimensional analysis, during which the governing equations of the problem are transformed into a special form such that six dimensionless groups consisting of the physical parameters of the problem are created. In the fourth section, the solution to the problem in the compressibility–toughness regime is presented. In the compressibility–toughness regime, most of the energy dissipation is related to the creation of new fracture surfaces in the rock, while the volume of the crack is similar to the volume of the fluid that is compressed in the injection system. In this propagation regime, the fluid leak-off can be neglected. In Section 5, the presented analytical model is validated and in Section 6, the results are presented.

2. Mathematical Model

Two symmetric cracks of length l transverse to a borehole with radius a are considered in a rock medium with linear elastic behavior and Young’s modulus E , Poisson’s ratio ϑ and fracture toughness K I C (Figure 1). The in situ stresses are equal to σ h , the minimum principal stress perpendicular to the crack surfaces, and σ H , the maximum principal stress along the cracks. As seen in Figure 1, the pre-existing cracks are along σ H and crack propagation is along this direction. It is assumed that non-viscous fluid is injected into the system with a constant flow rate Q 0 during time t . In the following, we use the C f to designate the apparent system compressibility, which accounts for the compliance of the injection system and the borehole but also the compressibility of the volume of fluid upstream of the fracture inlet. It is considered that the system compressibility is constant. The relation between the change of pressure in the borehole and the change of fluid volume due to compressibility is given as follows [15]:
d V c d t = C f V 0 d P w d t
where V 0 is the initial fluid volume in the injection system under zero net pressure, i.e., when P w = σ h . Integrating (1) with respect to time and with appropriate initial conditions leads to:
V c = C f V 0 P w σ h
which shows that the change of fluid volume in the system as a result of compressibility effect, as a first approximation, is proportional to the fluid pressure in the borehole.
In this study, the modeling of the process of fluid loss follows the conventional approach used in the design of hydraulic fracture treatment in the gas and oil industry. This is based on the so-called Carter’s leak-off model [29], which has been successfully used and widely accepted throughout the industry since its introduction. Carter’s leak-off model can be expressed as Equation (3):
g x , t = 2 C L t t 0 x , t
where g x , t is the velocity at which the fracturing fluid infiltrates into the surrounding rock medium. It is assumed that the velocity g is perpendicular to the crack propagation axis, i.e., the fluid infiltration or leak-off is treated as a one-dimensional process. C L is the Carter leak-off coefficient and t 0 is the exposure time of any point x ; the exposure time is the time lapsed between the time at which the crack tip arrives at the point x and the current time t . The factor 2 comes from the consideration that the leak-off process occurs on both faces of the crack. Integration of (3) over time and space leads to the volume of fracturing fluid that infiltrates into the rock surrounding the fracture (Equation (4)). The analysis is performed for each initial crack length in a quasi-static manner and the gradual development of the crack is not considered; therefore, t 0 = 0 . Thus, the following applies:
V L = 8 C L l t
Now, using Equations (2) and (4), the global fluid volume balance equation is expressed as follows:
V f = Q 0 t C f V 0 P 8 C L l t
where P is the net pressure:
P = P w σ h
Equation (5) shows that the volume of the cracks is equal to the total fluid volume injected minus the total fluid lost into the medium and the fluid compressed in the borehole. Since the fluid is assumed to be inviscid, the fluid pressure on the crack surfaces is uniform and equal to the wellbore pressure P w = P f .
Next, we express the crack volume V f and stress intensity factor at the crack tip K I in terms of the crack volume and stress intensity factor for the reference Griffith crack, according to Equations (7) and (8) [30,31]:
V f = P H 1 η σ D H 2 η V G r
K I = P F 1 η σ D F 2 η K G r
where the following applies:
η = l a
and σ D is deviatoric stress, which is defined as follows:
σ D = σ H σ h
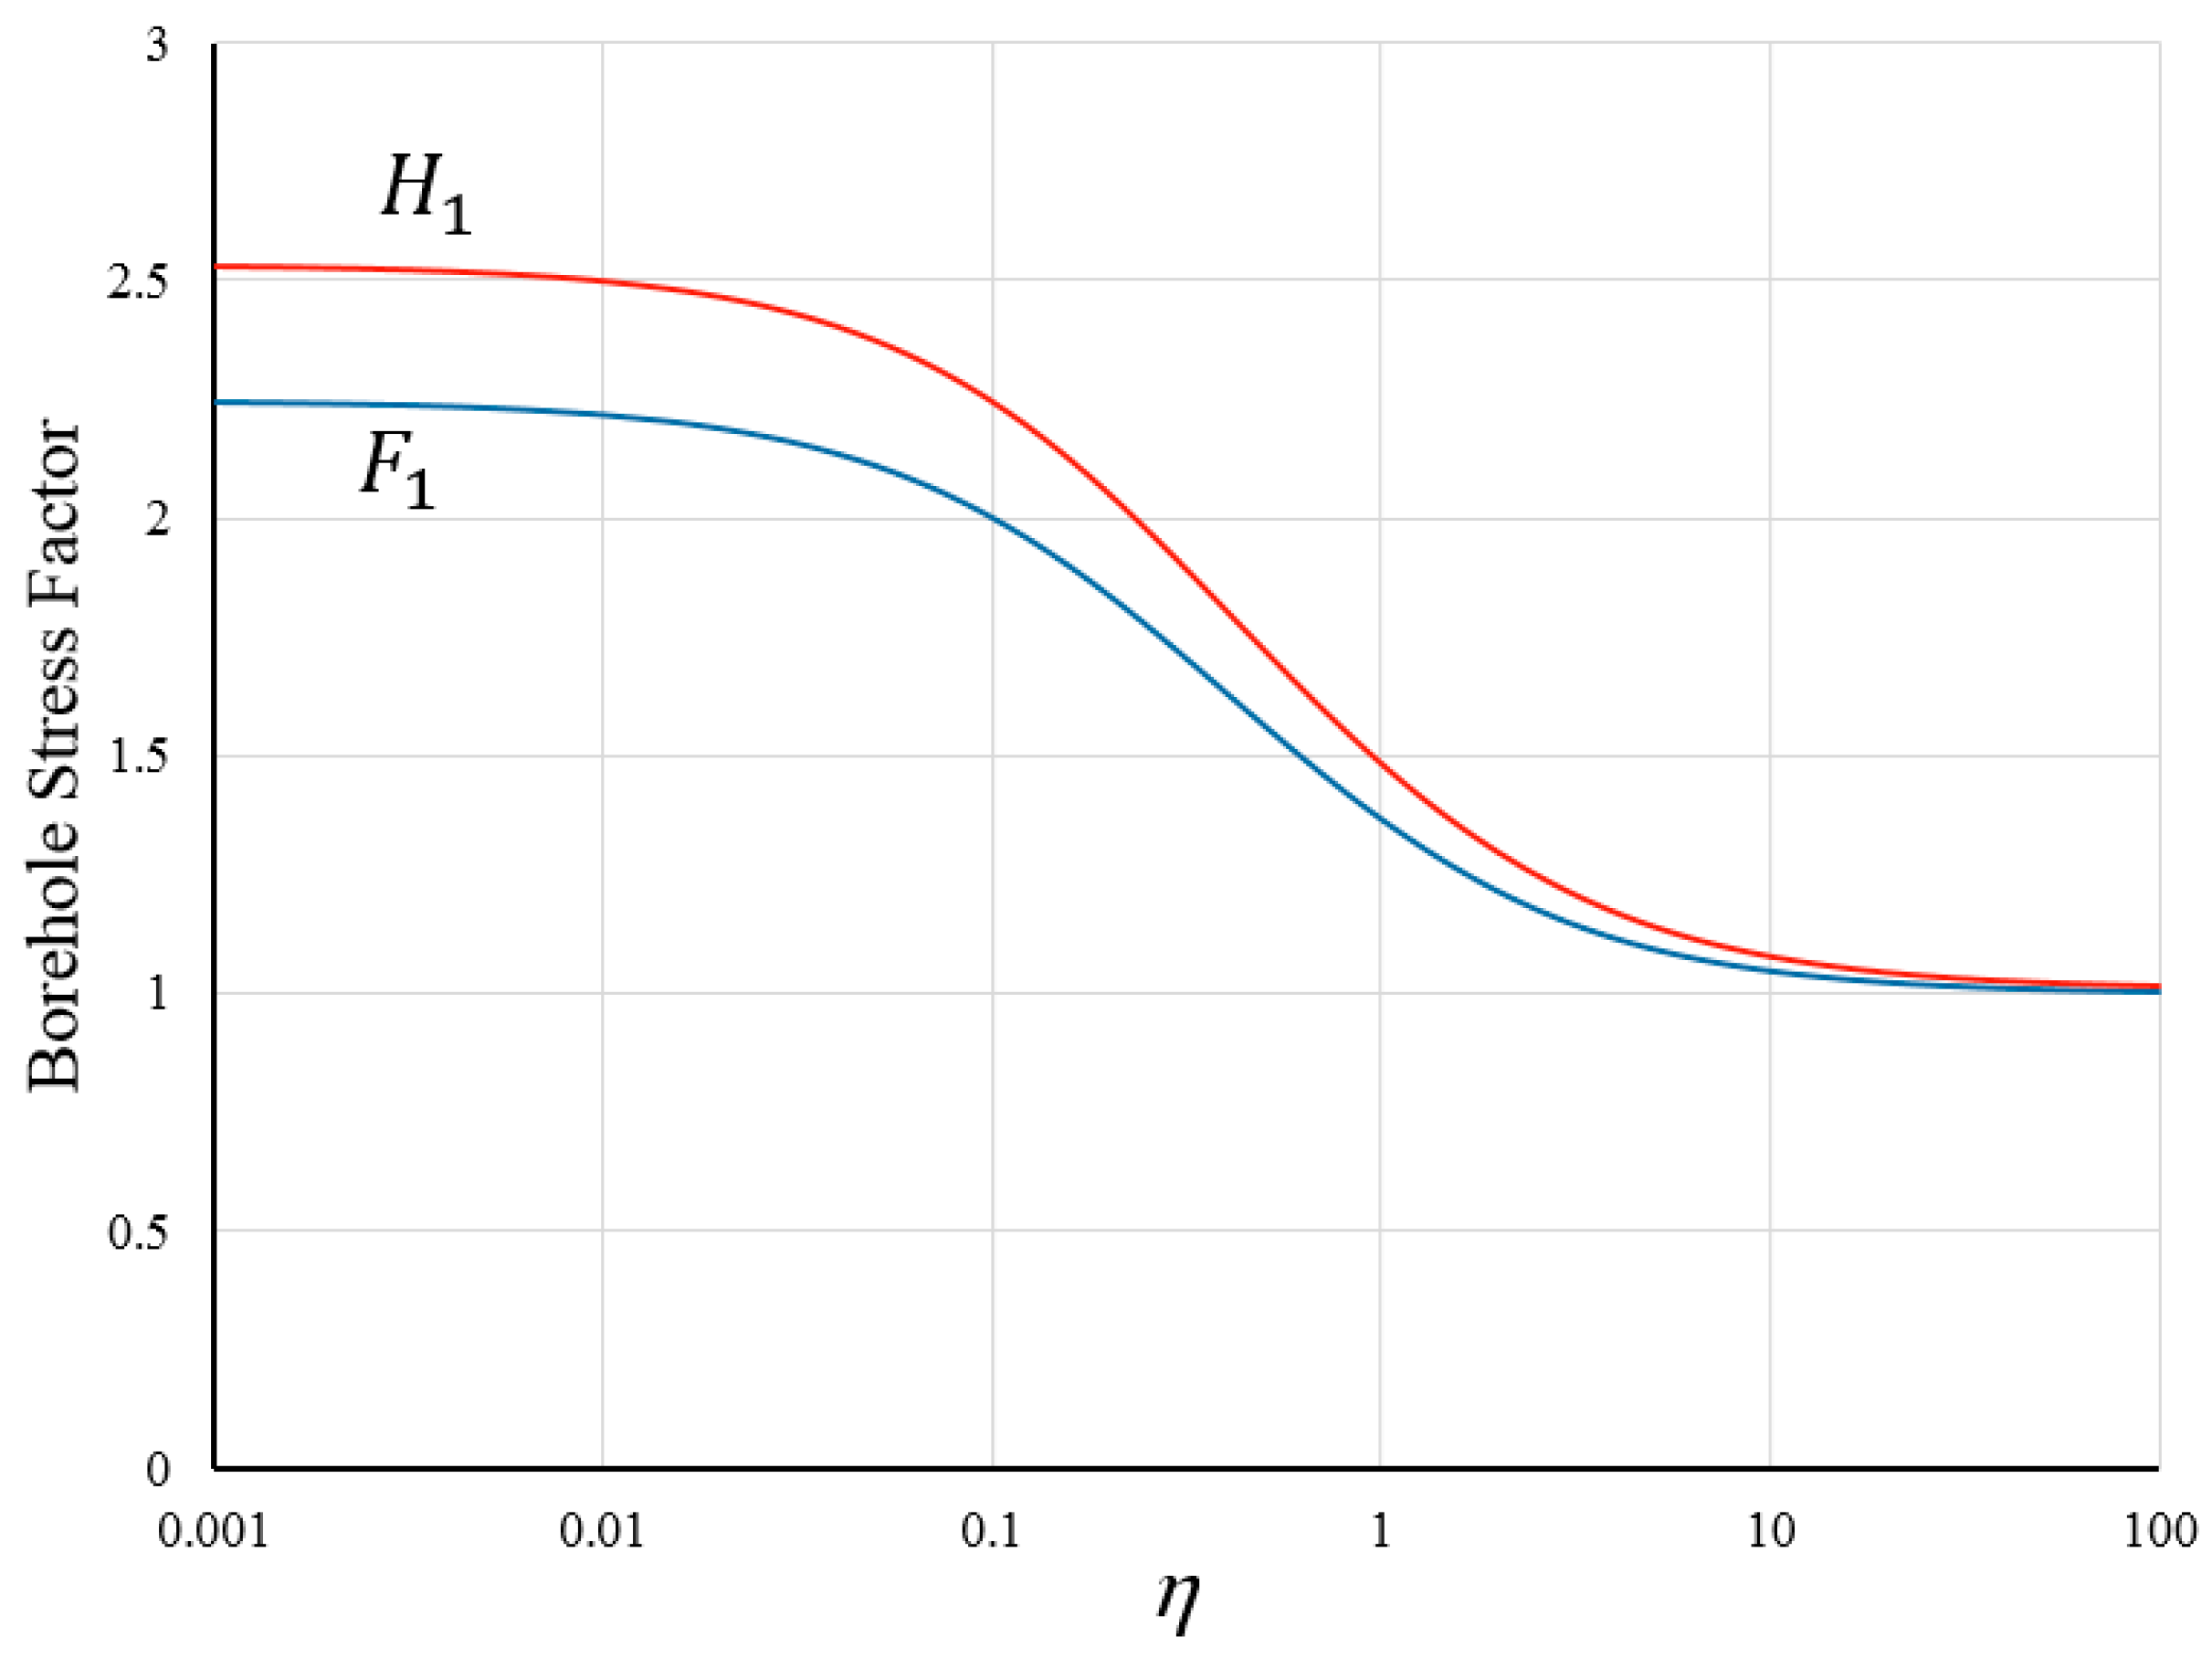
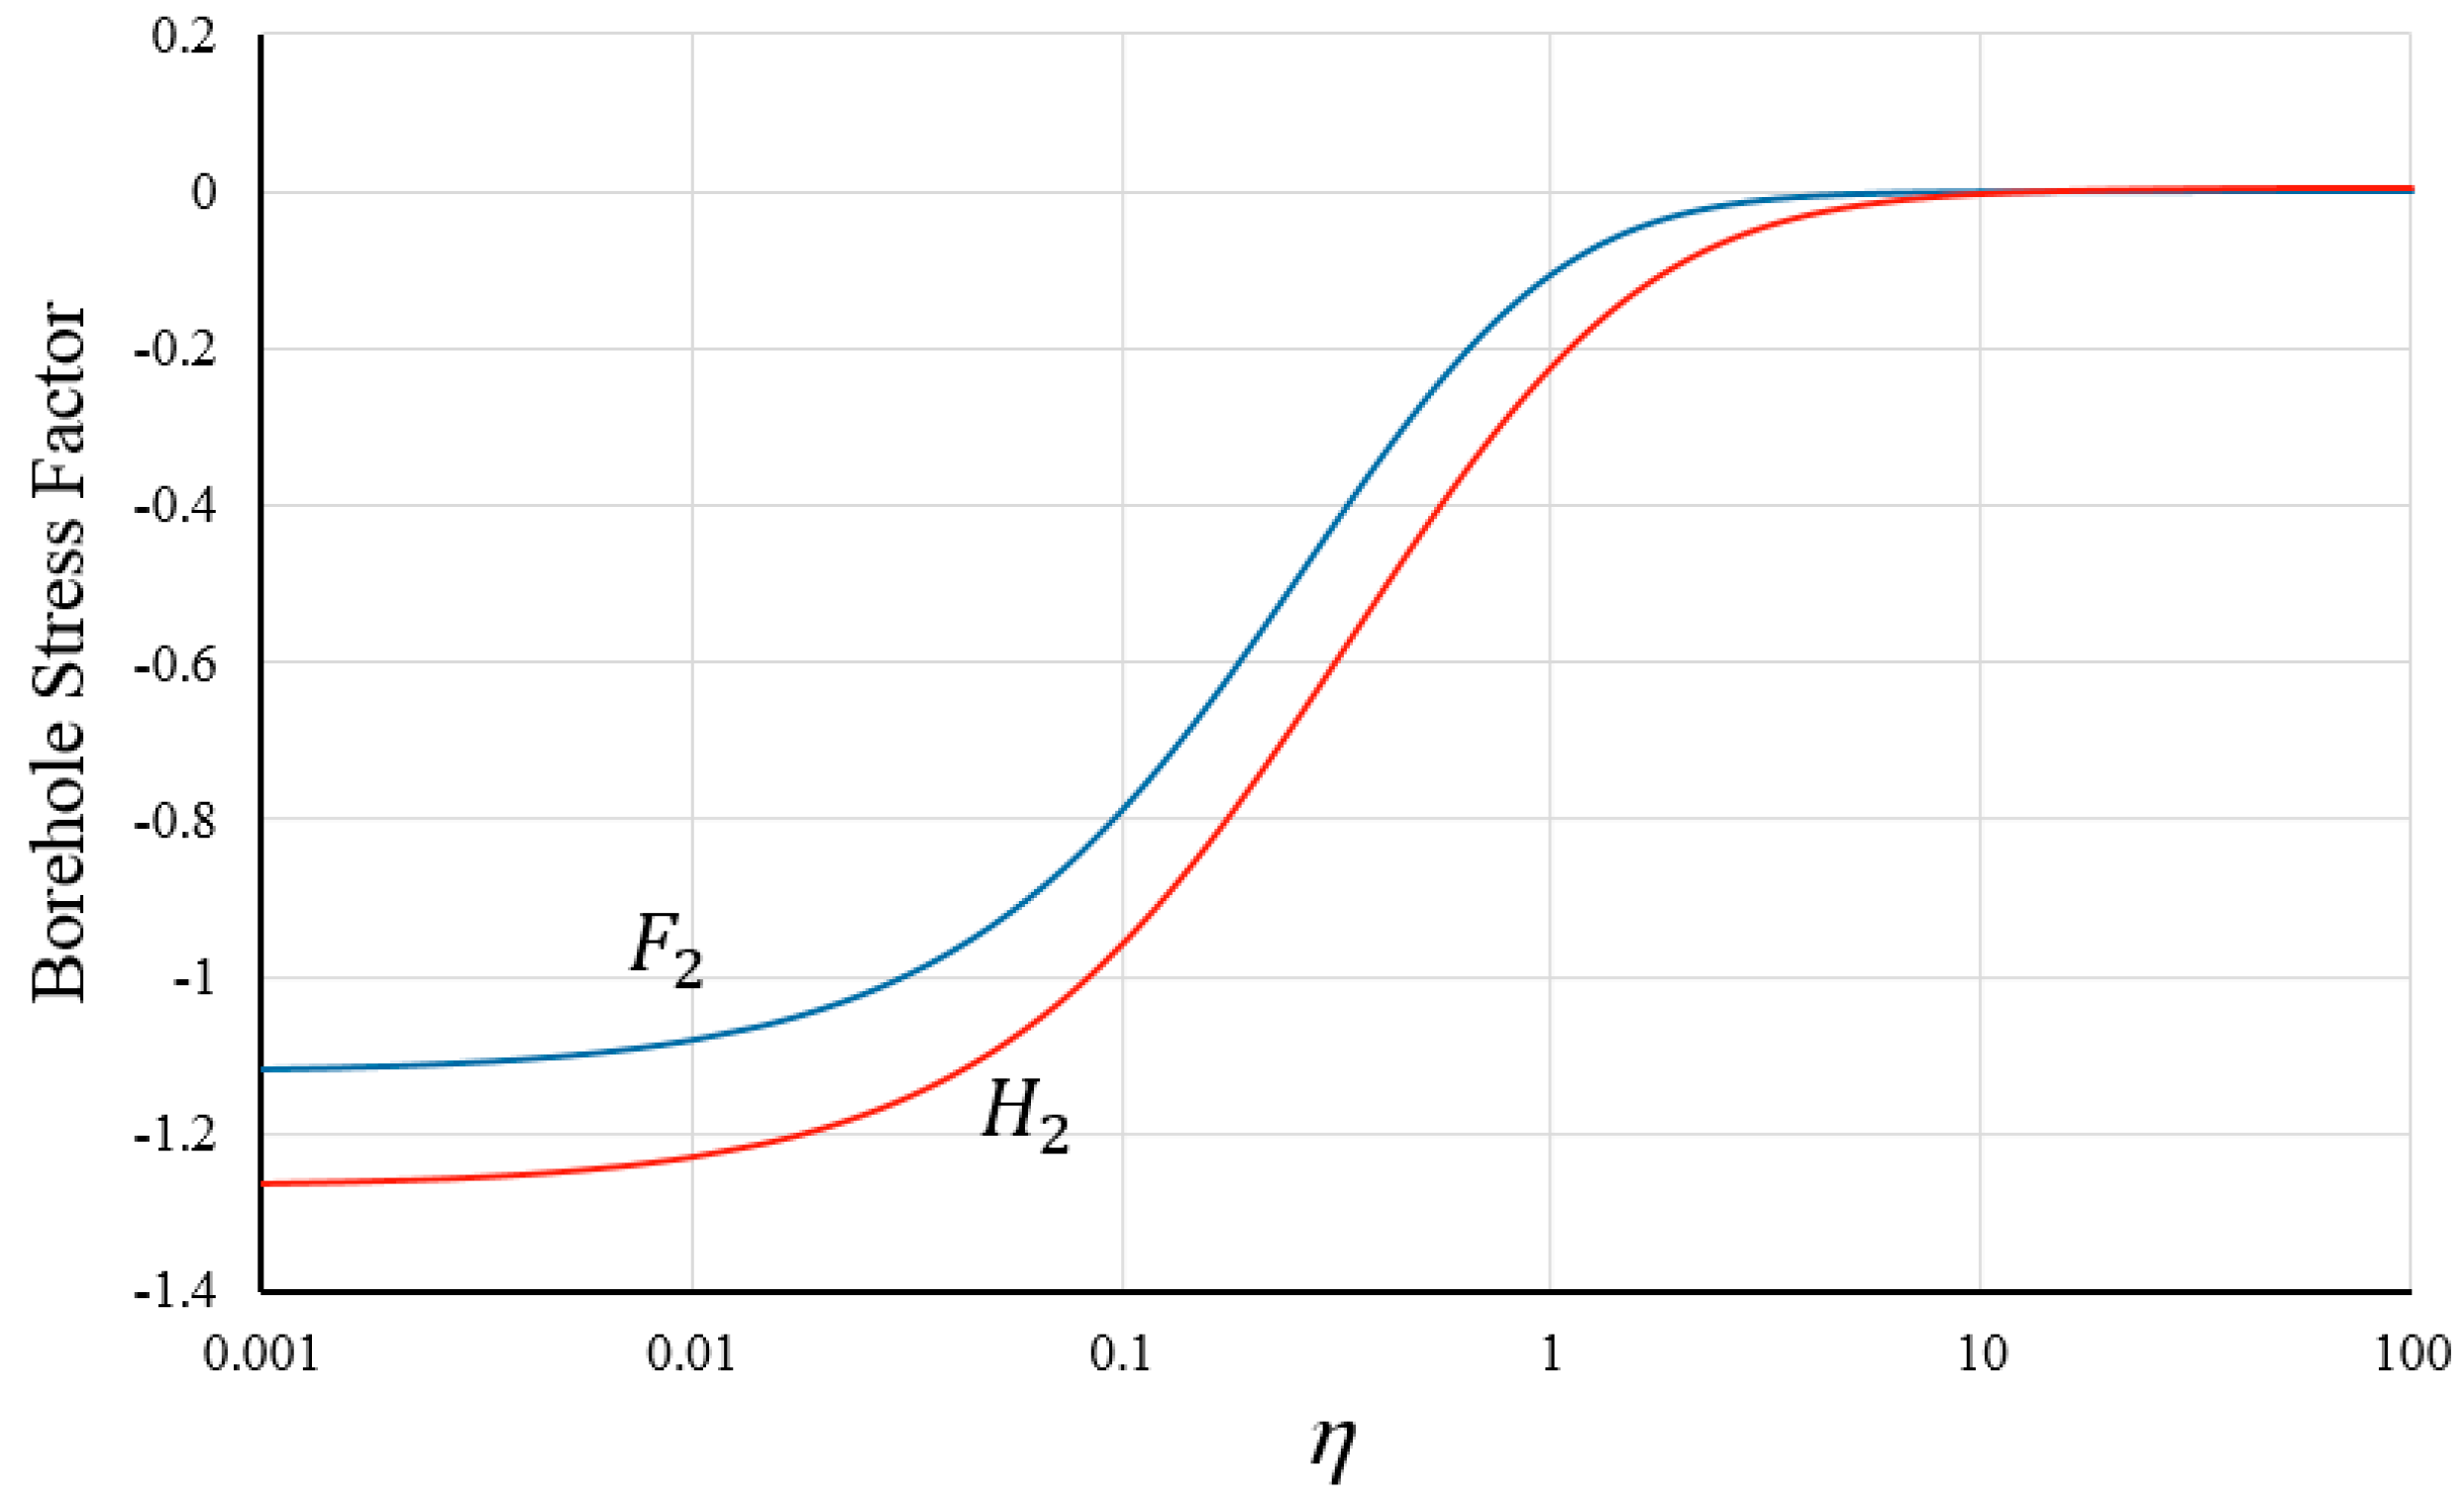
In Equations (7) and (8), the functions H 1 η and F 1 η , respectively, express the normalized crack volume and the normalized stress intensity factor in the case that the borehole and cracks are under unit net pressure (Figure 2). Similarly, the functions H 2 η and F 2 η represent the normalized crack volume and the normalized stress intensity factor for the condition that the borehole and cracks are under the unit deviatoric stress (Figure 3). These functions are obtained numerically using the displacement discontinuity method [30,31]. In Equations (7) and (8), V G r and K G r are the crack volume and stress intensity factor for the Griffith crack with the unit net pressure (Equations (11) and (12)) [32]:
V G r = 2 π l 2 E
K G r = π l
E is the plane–strain modulus:
E = E 1 ϑ 2
The only boundary condition of the problem is the crack propagation condition. The propagation condition is expressed as follows [33]:
K I = K I C
where K I C is the fracture toughness at mod I fractures.
Combining Equations (12) and (14) with Equation (8), the resultant expression in terms of P is given as follows:
P = K I C π 1 2 l 1 2 F 1 η + σ D F 2 η F 1 η
and by combining Equation (11) with Equation (7), Equation (16) is obtained:
V f = P H 1 η σ D H 2 η 2 π E l 2
Combining Equations (5) (the global volume balance) and (16), we obtain:
Q 0 t C f V 0 P 8 C L l t = P H 1 η σ D H 2 η 2 π E l 2
The set of Equations (15) and (17) are the governing equations of the problem. The governing equations show that the net pressure is a function of various parameters:
P = f l , a , K I C , t , C L , σ D , C f V 0

3. Scaling

Proper scaling for the problem under study must be derived with two main considerations: on the one hand, the scaling should reflect the physical process taking place during fracture propagation; on the other hand, whenever possible, it should reduce the problem variables to dimensionless quantities of order O 1 . In the first step, the crack length is made dimensionless using an appropriate length scale according to Equation (19):
λ = l L
In this relation, λ is the dimensionless crack length and L is the length scale, which is determined later. Scaling of the problem hinges on defining the dimensionless net pressure as follows:
= P ε E
In this relation, is the dimensionless net pressure and ε is a small number to be determined later. In the following, for the sake of simplicity, parameters K , U , and C are defined as follows [8]:
K = 2 5 2 π 1 2 K I C
U = C f V 0
C = 2 C L
As a consequence of the scaling given in Equations (19) and (20) and considering Equations (21) to (23), the main equations (Equations (15) and (17)) are transformed as follows:
= K ε L 1 2 E 2 5 2 λ 1 2 F 1 λ / a L + σ D ε E F 2 λ / a L F 1 λ / a L
= Q 0 t ε L 2 + 2 π λ 2 σ D ε E H 2 λ / a L 4 C t 1 2 ε L λ 2 π λ 2 H 1 λ / a L + ε U E Q 0 t Q 0 t ε L 2
Studying Equations (24) and (25), we notice the presence of six dimensionless groups G K , G S , G A , G V , G C , and G U :
G K = K ε L 1 2 E
G V = Q 0 t ε L 2
G U = ε U E Q 0 t
G C = C t 1 2 ε L
G A = a L
G S = σ D ε E
Of the six dimensionless groups listed above, one is related to the energy dissipation process; group G K is associated with the energy dissipation process via the creation of new fracture surfaces in solid material. Group G C is related to the volume of the fluid leaked from the fracture into the surrounding medium. Group G V is related to the volume of the fluid Q 0 t stored inside the fracture. Group G U is related to the fluid stored in the borehole by compressibility before fracture initiation, and the elastic modulus E is related to the elastic strain energy.

4. Compressibility-Toughness Scaling

Different scalings can be considered to address the problem. Each scaling provides a solution to the problem in a specific hydraulic fracture propagation regime. Various scaling forms can be obtained by setting one fluid storage group and the energy dissipation group equal to one. Since the emphasis in this paper is on the compressibility of the injection system, the problem is solved in the compressibility–toughness-dominated propagation regime. In this scaling, it is assumed that the crack volume is similar to the volume of fluid stored, due to the compressibility of the injection system. In this scaling, the energy balance is dominated by the generation of new fracture surfaces while the fluid leak-off is negligible. The scaling for the compressibility–toughness-dominated propagation regime can be constructed by setting the following:
G U G V = 1 G K = 1
Hence, the small parameter ε and the length scale L are obtained as follows:
ε = K E 5 4 U 1 4 ,   L = E 1 2 U 1 2
Now, let us redefine the groups G A , G S , G V , and G C as a dimensionless borehole radius A , a dimensionless deviatoric stress D , a dimensionless time τ , and a dimensionless leak-off coefficient Γ , respectively, such that:
G A = A = a L = a E 1 2 U 1 2
G S = D = σ D E 1 4 U 1 4 K
G V = τ = t t 1 ,   t 1 = K U 3 4 Q 0 E 1 4
G C = Γ τ 1 2 ,   Γ = C U 1 8 E 5 8 K 1 2 Q 0 1 2
In this scaling, the resultant expressions for the governing equations (Equations (24) and (25)) can be reduced as follows:
= 1 2 5 2 λ 1 2 F 1 λ / A + D F 2 λ / A F 1 λ / A
= τ + 2 π λ 2 H 2 λ / A D 4 Γ τ 1 2 λ 2 π λ 2 H 1 λ / A + 1
Combining the two Equations (38) and (39) yields a nonlinear relationship for dimensionless time τ in terms of dimensionless crack length λ :
τ 4 Γ λ τ 1 2 2 π λ 2 H 1 λ / A + 1 1 2 5 2 λ 1 2 F 1 λ / A + D F 2 λ / A F 1 λ / A + 2 π λ 2 H 2 λ / A D = 0
For a given dimensionless crack length λ , Equation (40) gives the time τ . Then, the dimensionless net pressure can be obtained by Equation (38) or (39). Now, we can see that the dimensionless net pressure is a function of five dimensionless parameters:
= f λ , τ , A , D , Γ
In other words, the net pressure is a function of the dimensionless crack length λ , dimensionless time τ , dimensionless borehole radius A , dimensionless deviatoric stress D , and dimensionless leak-off coefficient Γ .

5. Small Time and Large Time Asymptote, Solution Validation

When τ , the crack length becomes too large relative to the borehole radius and the borehole effect disappears. In this condition, where the crack propagates in an impermeable medium Γ = 0 , the solution reaches the asymptote given by:
λ = 2 π 2 3 τ 2 3 ,   = 1 8 π 1 3 τ 1 3
This relationship is easily obtained from Equations (38) to (40). This case corresponds to the classical solution of a crack under uniform pressure, known as a Griffith crack [34]. If the initial crack length is small, λ < < 1 , using Equations (38) to (40), the dimensionless net pressure and the dimensionless crack length attain the asymptote given by:
λ = 2 5 F 1 λ / A 2 τ 2 ,   = τ

6. Results

The mathematical model presented above simulates both the propagation and initiation of a hydraulic fracture. There is no need to discretize the equations to perform the analyses, and pressure and time can easily be obtained for different initial crack lengths. The results given below include net pressure Π versus time τ , fracture initiation time τ versus initial flaw length λ , and net pressure Π versus crack length λ . Every point on every curve corresponds to another point on the other curves.

6.1. Effect of Initial Flaw Length on the Net Pressure

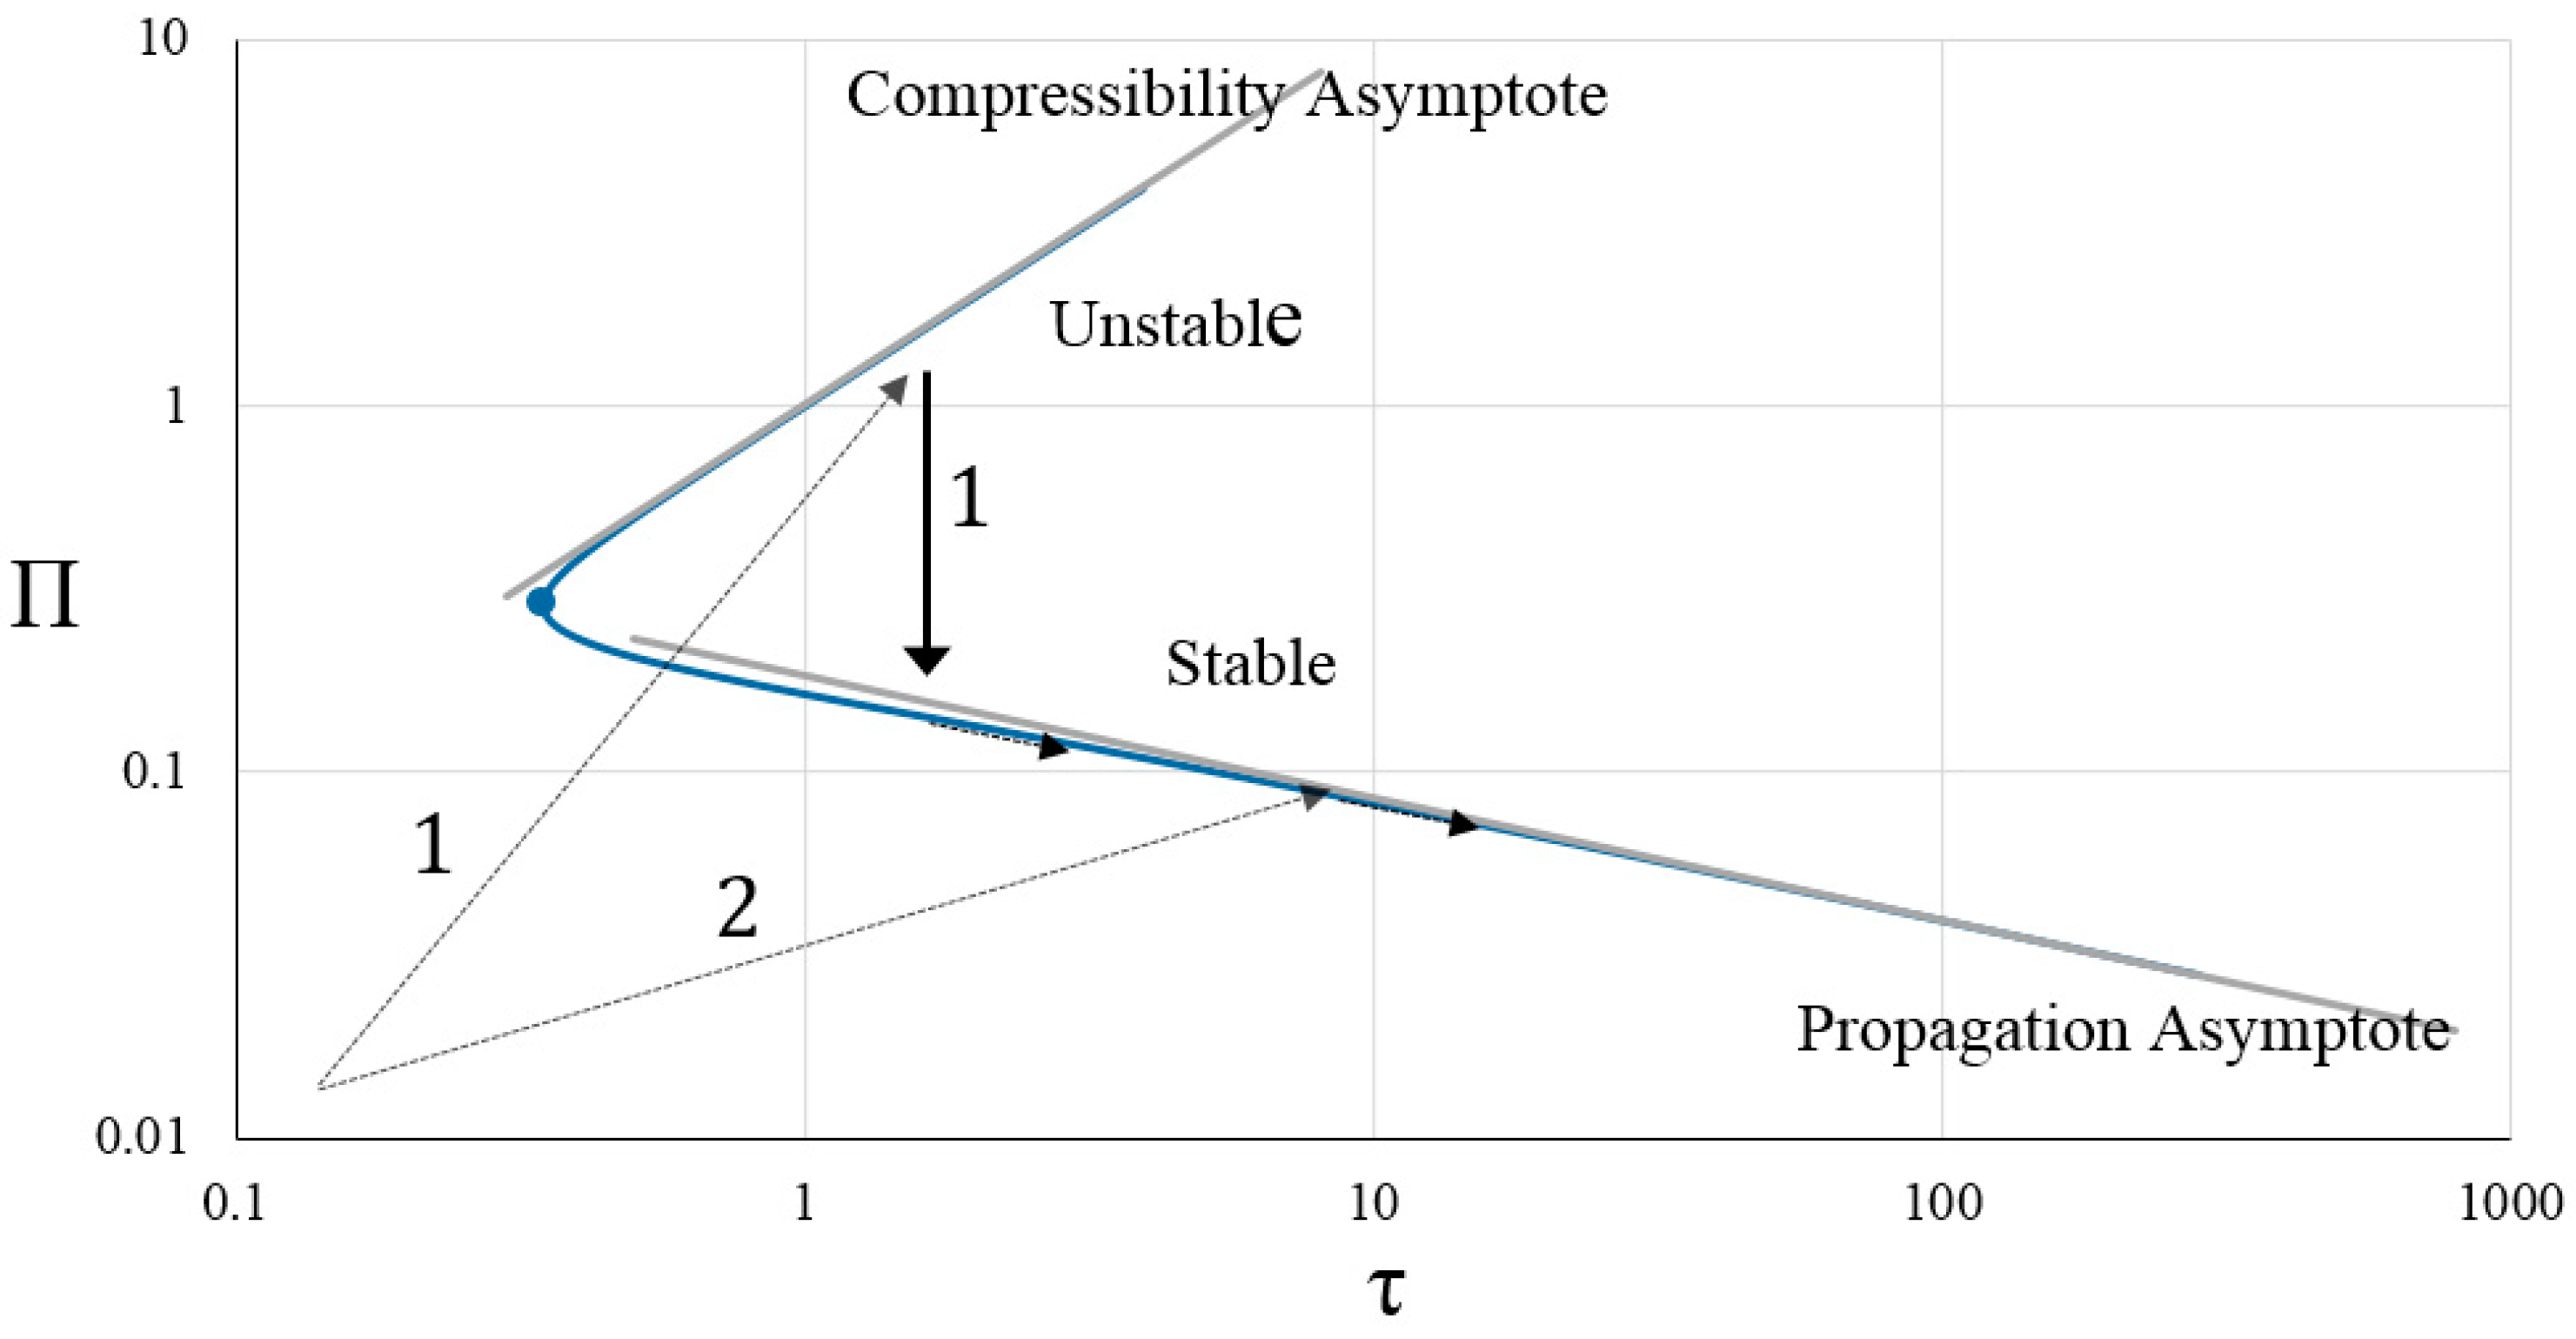
Figure 4 and Figure 5 show the plot of the solutions τ and τ λ 0 along with the asymptotic solution for small and large times, respectively. The characteristics of these solutions are that they have two branches, which means that there are two possible solutions for the same time τ and therefore, the existence of instability.
The upper branch of the solution τ corresponding to the left branch of solution τ λ 0 is for small initial flaw lengths with high pressure, while the lower branch of the solution τ corresponds to the right branch of solution τ λ 0 , for large cracks with low pressure.
As shown in Figure 4, the time origin occurs at the moment when the net pressure of the fluid in the initial flaw is equal to zero. For a given initial flaw length λ 0 , the borehole and the flaw are pressurized until the condition of crack initiation and propagation is reached. It should be noted that the governing equations are applicable only after satisfying the crack propagation conditions, exactly when the initial flaw starts to propagate. The injection time required for fracture initiation depends on the length of the initial flaw, the compressibility of the injection system, fracture toughness, and the fluid injection rate.
If the compressibility effects of the injection system are important or if the length of the initial flaw is small, high pressure is required to satisfy the conditions of crack propagation. In such a situation, the initial solution is located on the upper branch of Figure 4 or the left branch of Figure 5, but immediately after satisfying the fracture propagation condition, instability occurs in crack growth and wellbore net pressure. In other words, the solution jumps from the upper branch of τ to the lower branch and correspondingly, it jumps from the left branch of τ λ 0 to the right branch. This corresponds to a quick decrease in the net pressure and a quick increase in the initial flaw length. For example, Path 1 in Figure 4 and Figure 5 shows how the pressure and crack length change during fracture propagation in a model with small initial flaw length.
Conversely, if fluid compressibility effects are not important or if the initial flaw length is large, the pressure rises more slowly and a longer injection time is required to compress the fluid and reach the pressure for fracture initiation. Longer initial flaws propagate more easily because they require less pressure, but they require more time to fill and reach fracture initiation. In such a situation, the initial solution is located on the lower branch in Figure 4 or the right branch in Figure 5, and the crack propagation is always stable. For example, Path 2 in Figure 4 and Figure 5 shows the variation in pressure and crack length during fracture propagation for a model with large initial flaw length.
As shown in Figure 5, for certain values of deviatoric stress, borehole radius, and leak-off coefficient, there is a critical initial flaw length, here called λ t r a n . If the initial flaw length is smaller than λ t r a n , the initial solution is unstable; if the initial crack length is greater than λ t r a n , the initial solution is stable. λ t r a n corresponds to the minimum τ λ in Figure 5 and is obtained from the following equation:
d τ d λ = 0
For example, in Figure 5, for A = 0.4 , D = Γ = 0 , λ t r a n = 0.134 .
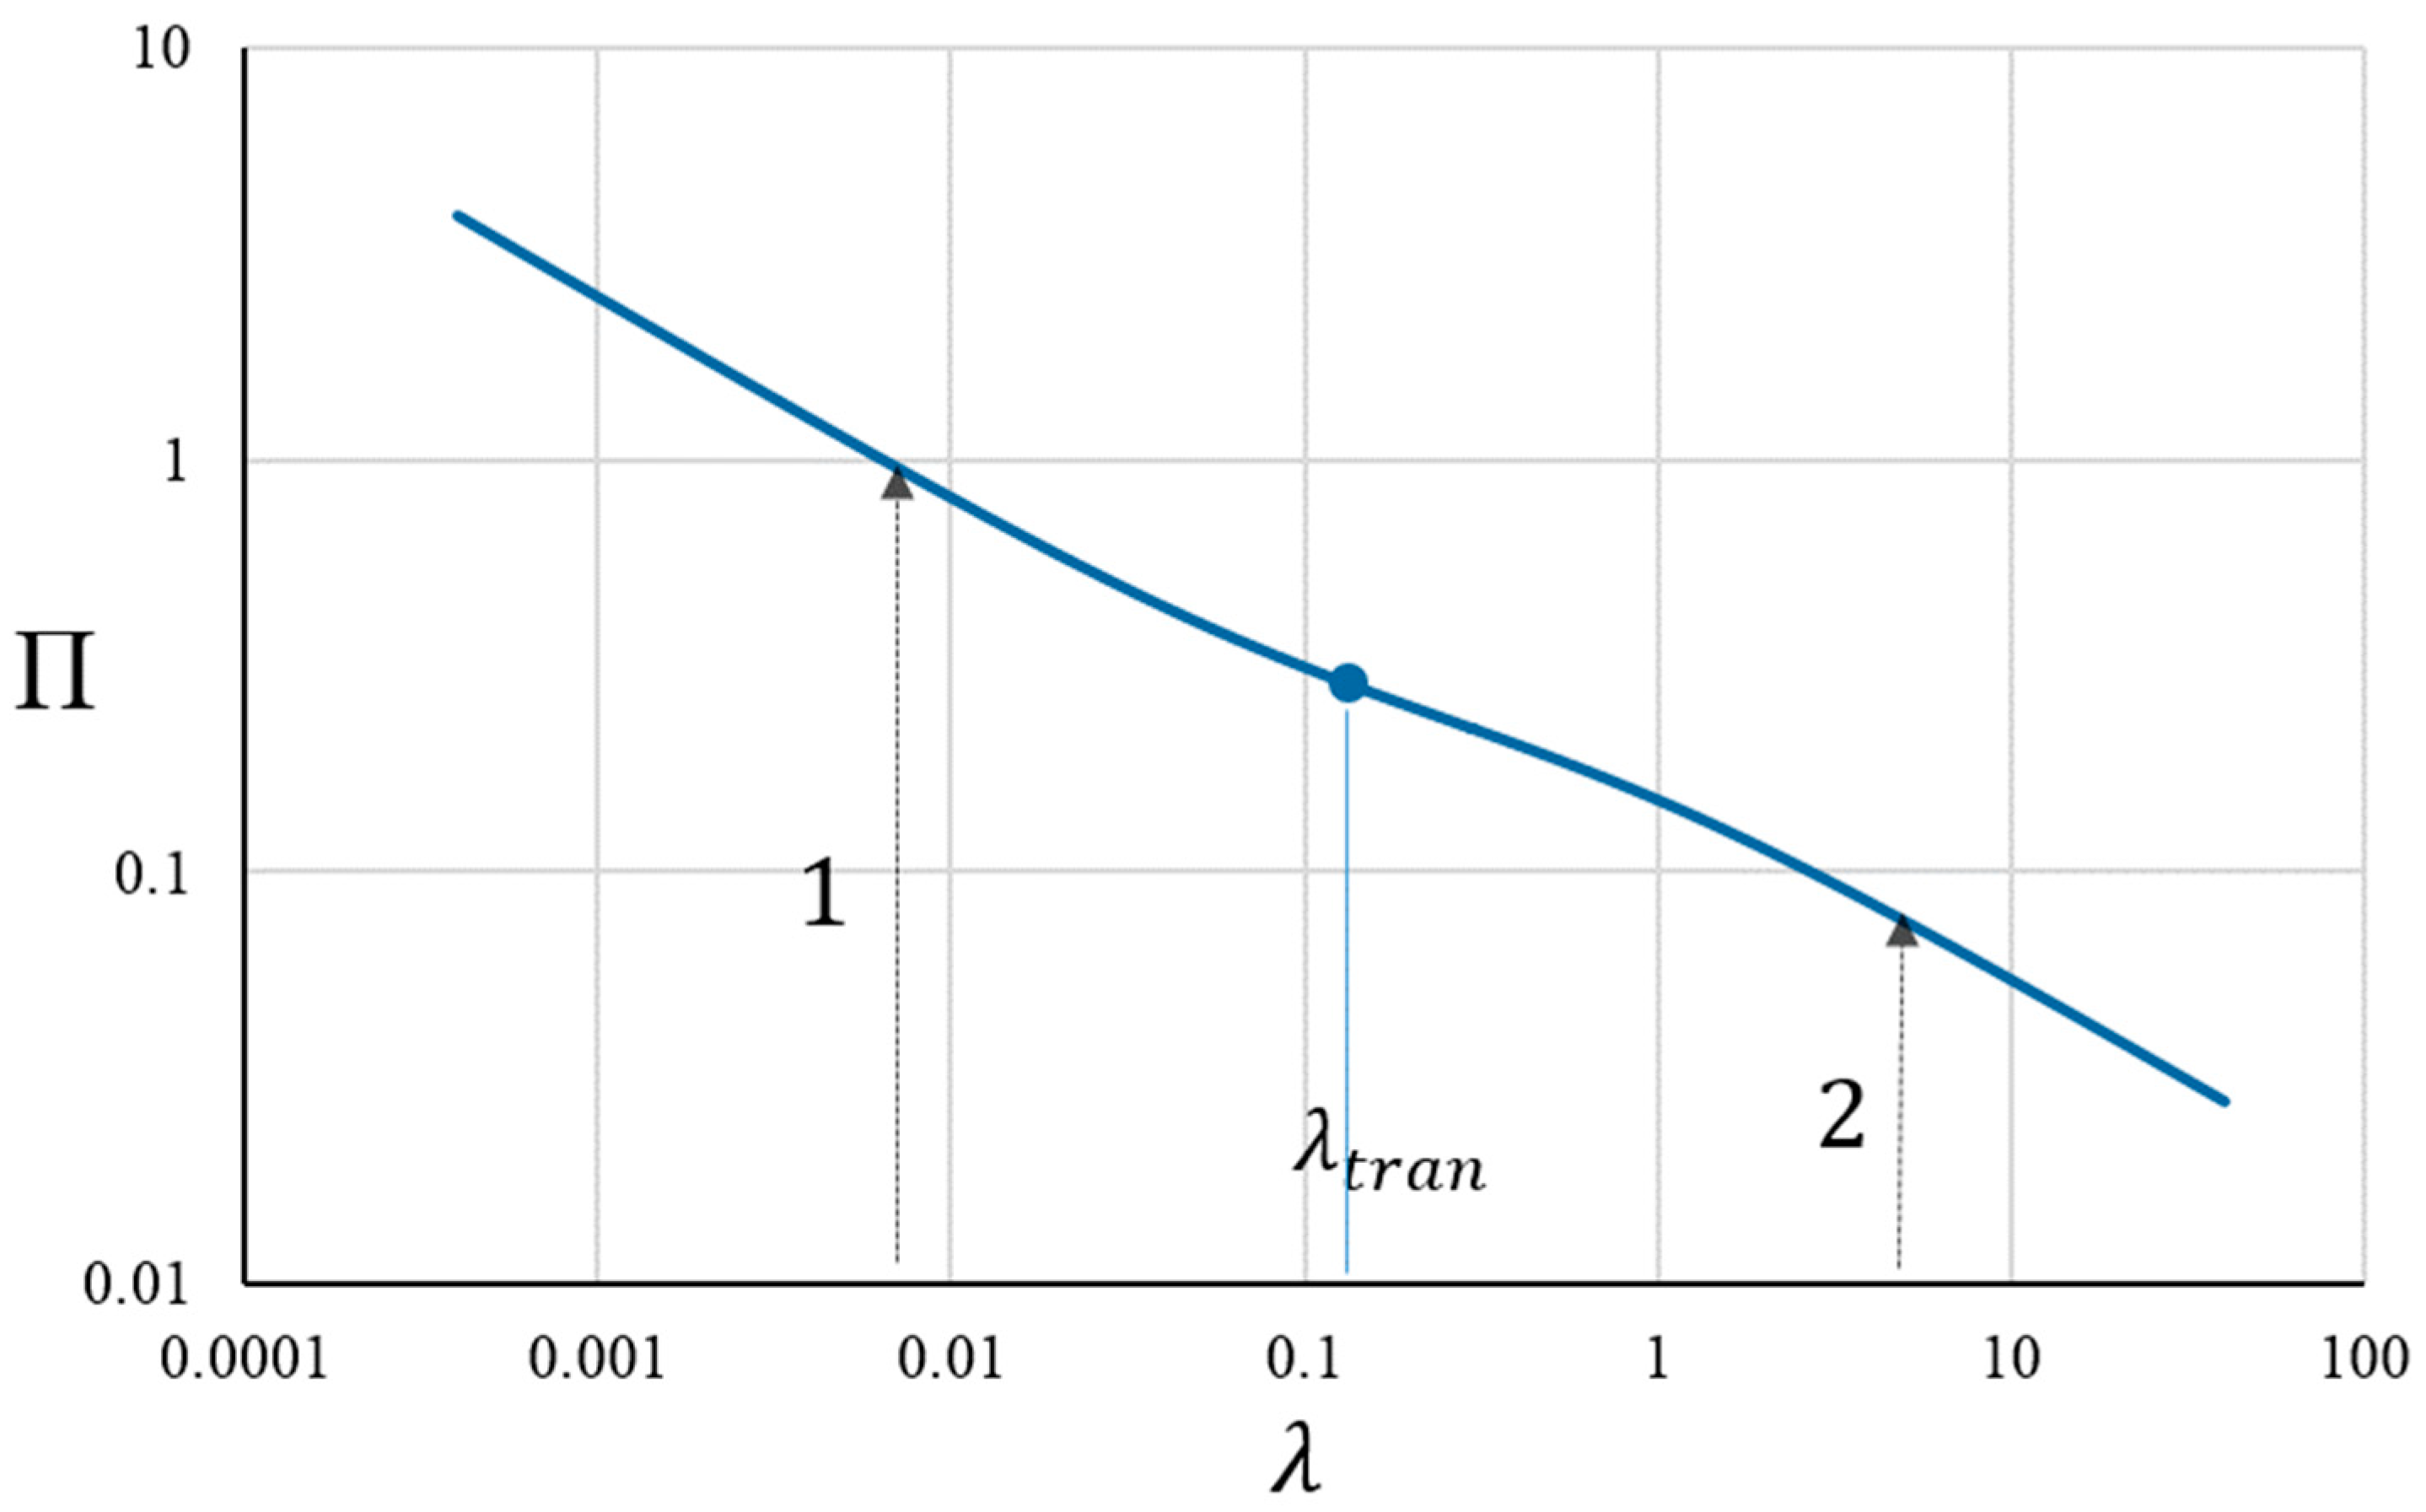
Figure 6 shows the dimensionless net pressure versus the dimensionless crack length. In the figure, it can be seen that the net pressure declines with the increase in crack length. It should be noted that by using the model presented in this article, both the initial solution for the hydraulic fracture and the evolution of borehole pressure versus the propagation of fracture length can be obtained.

6.2. Effect of Dimensionless Leak-Off Coefficient on Net Pressure

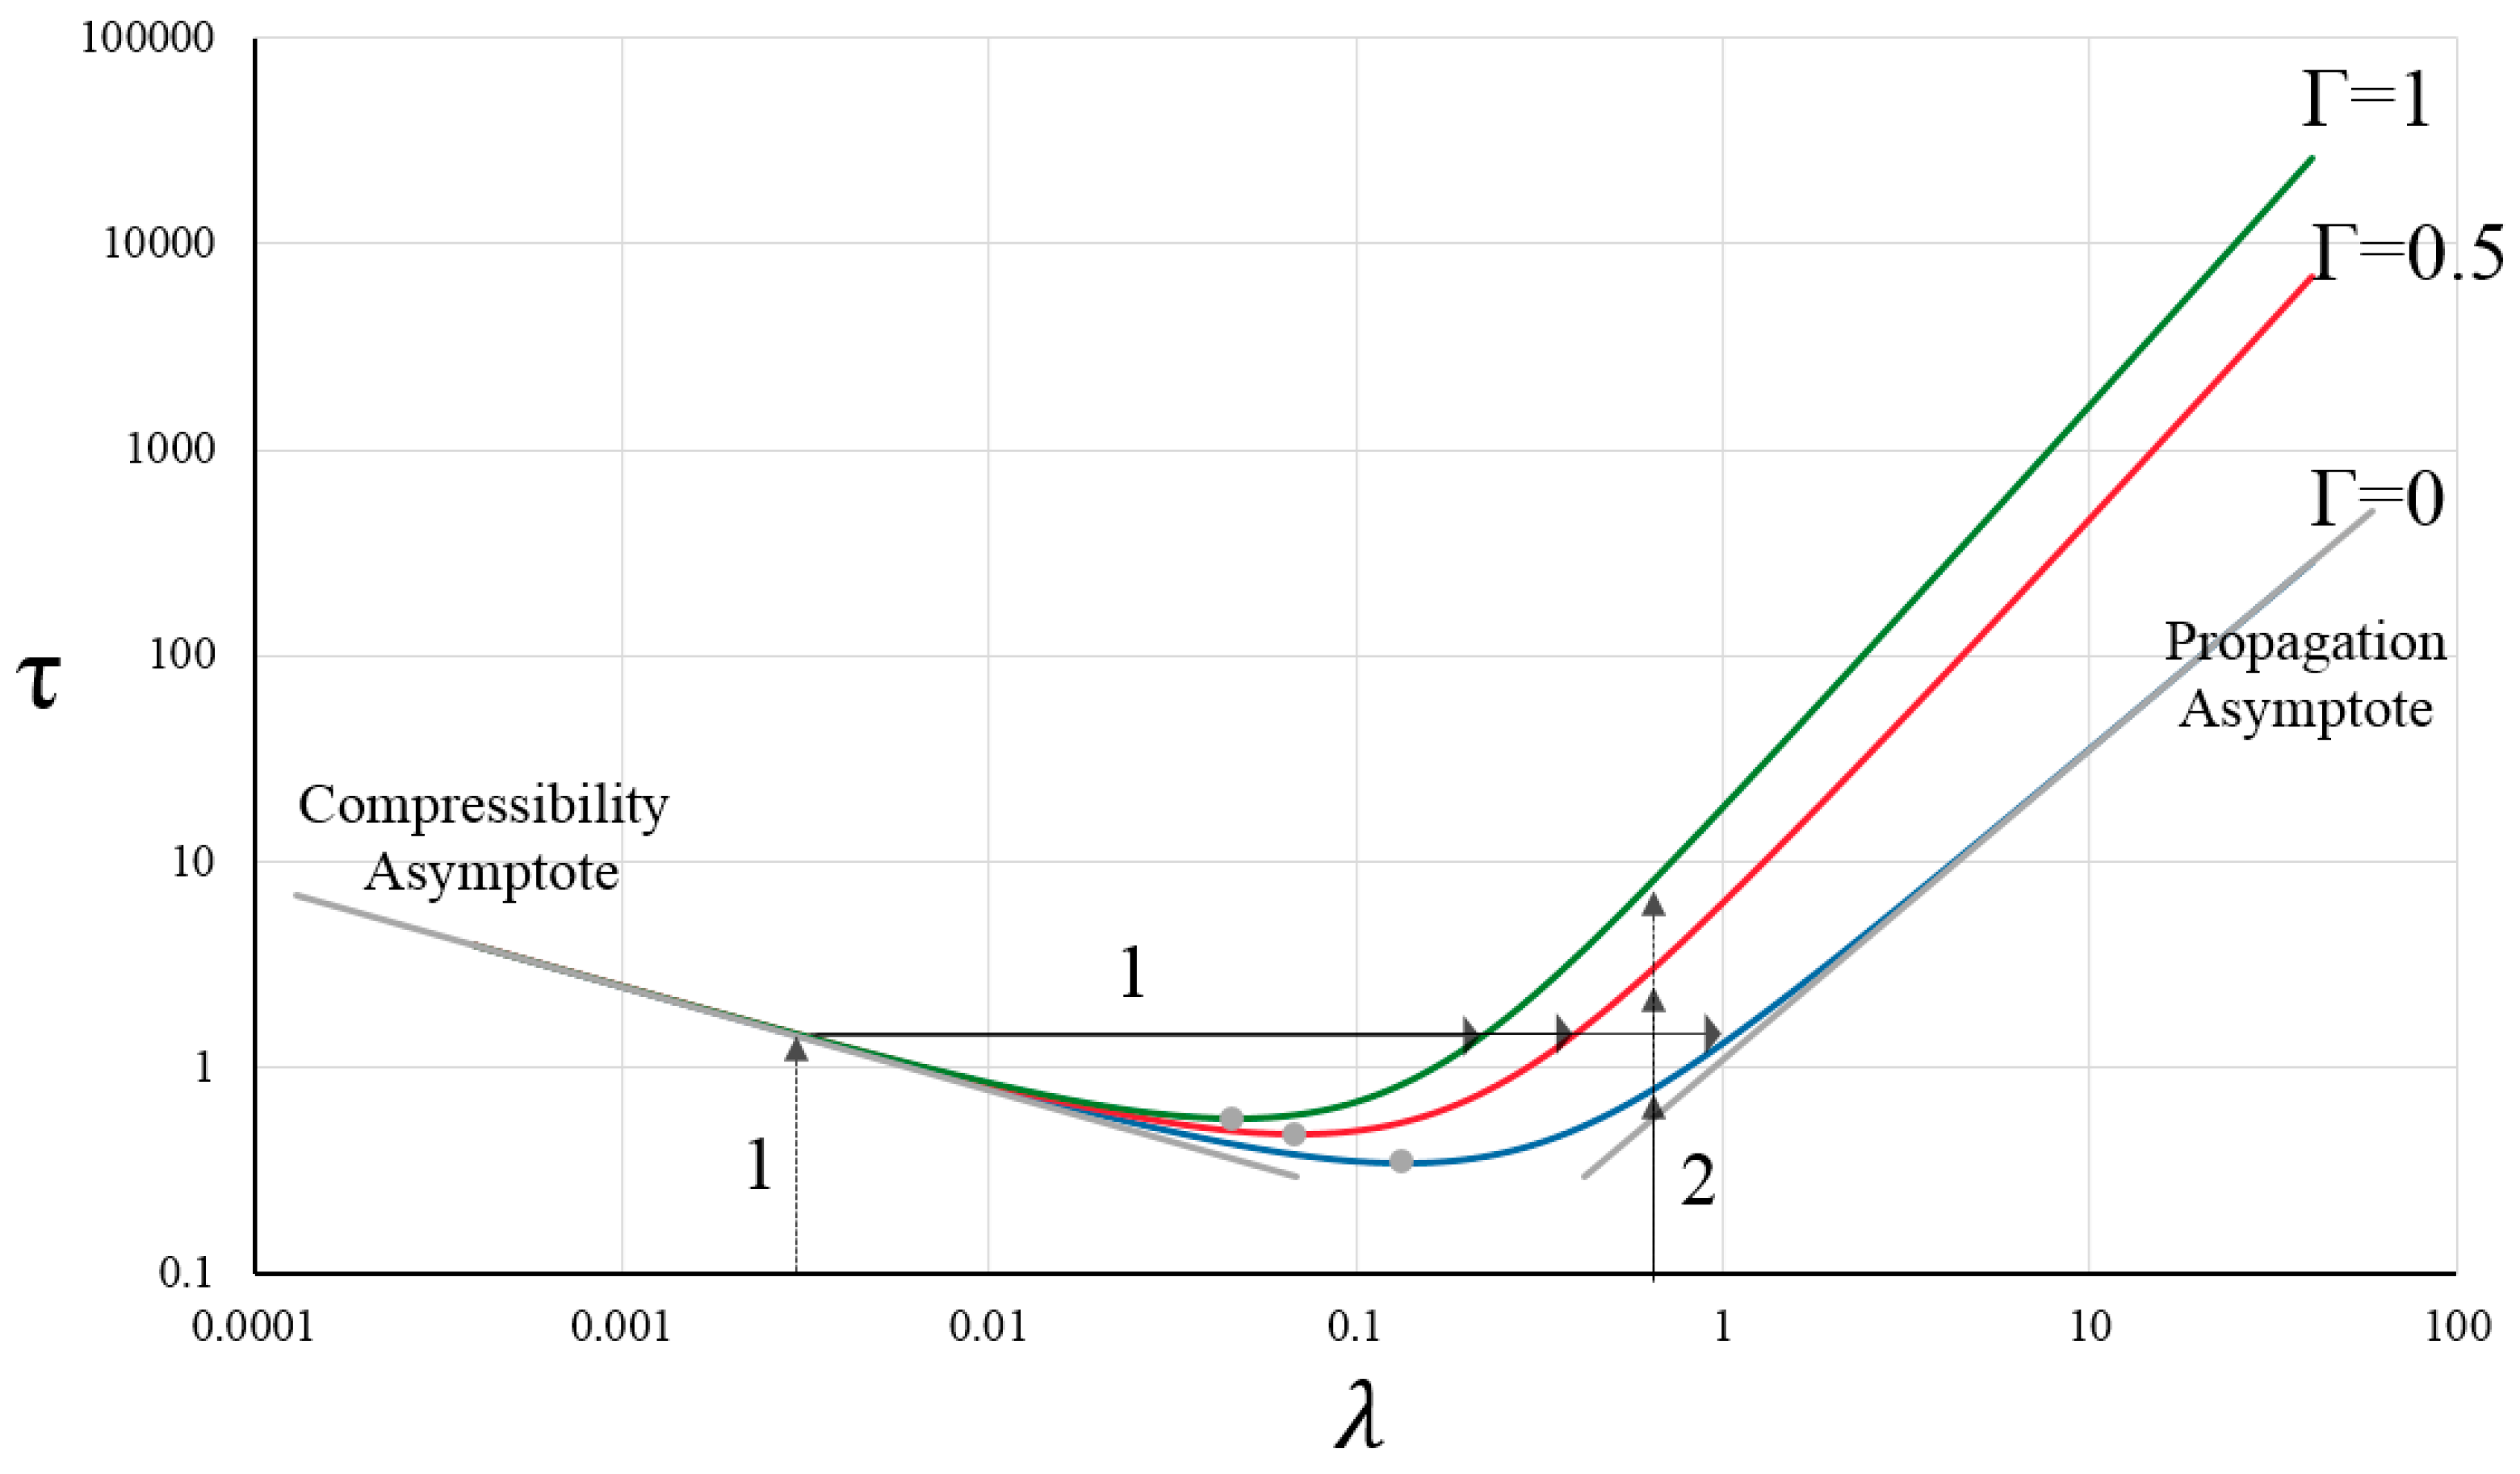
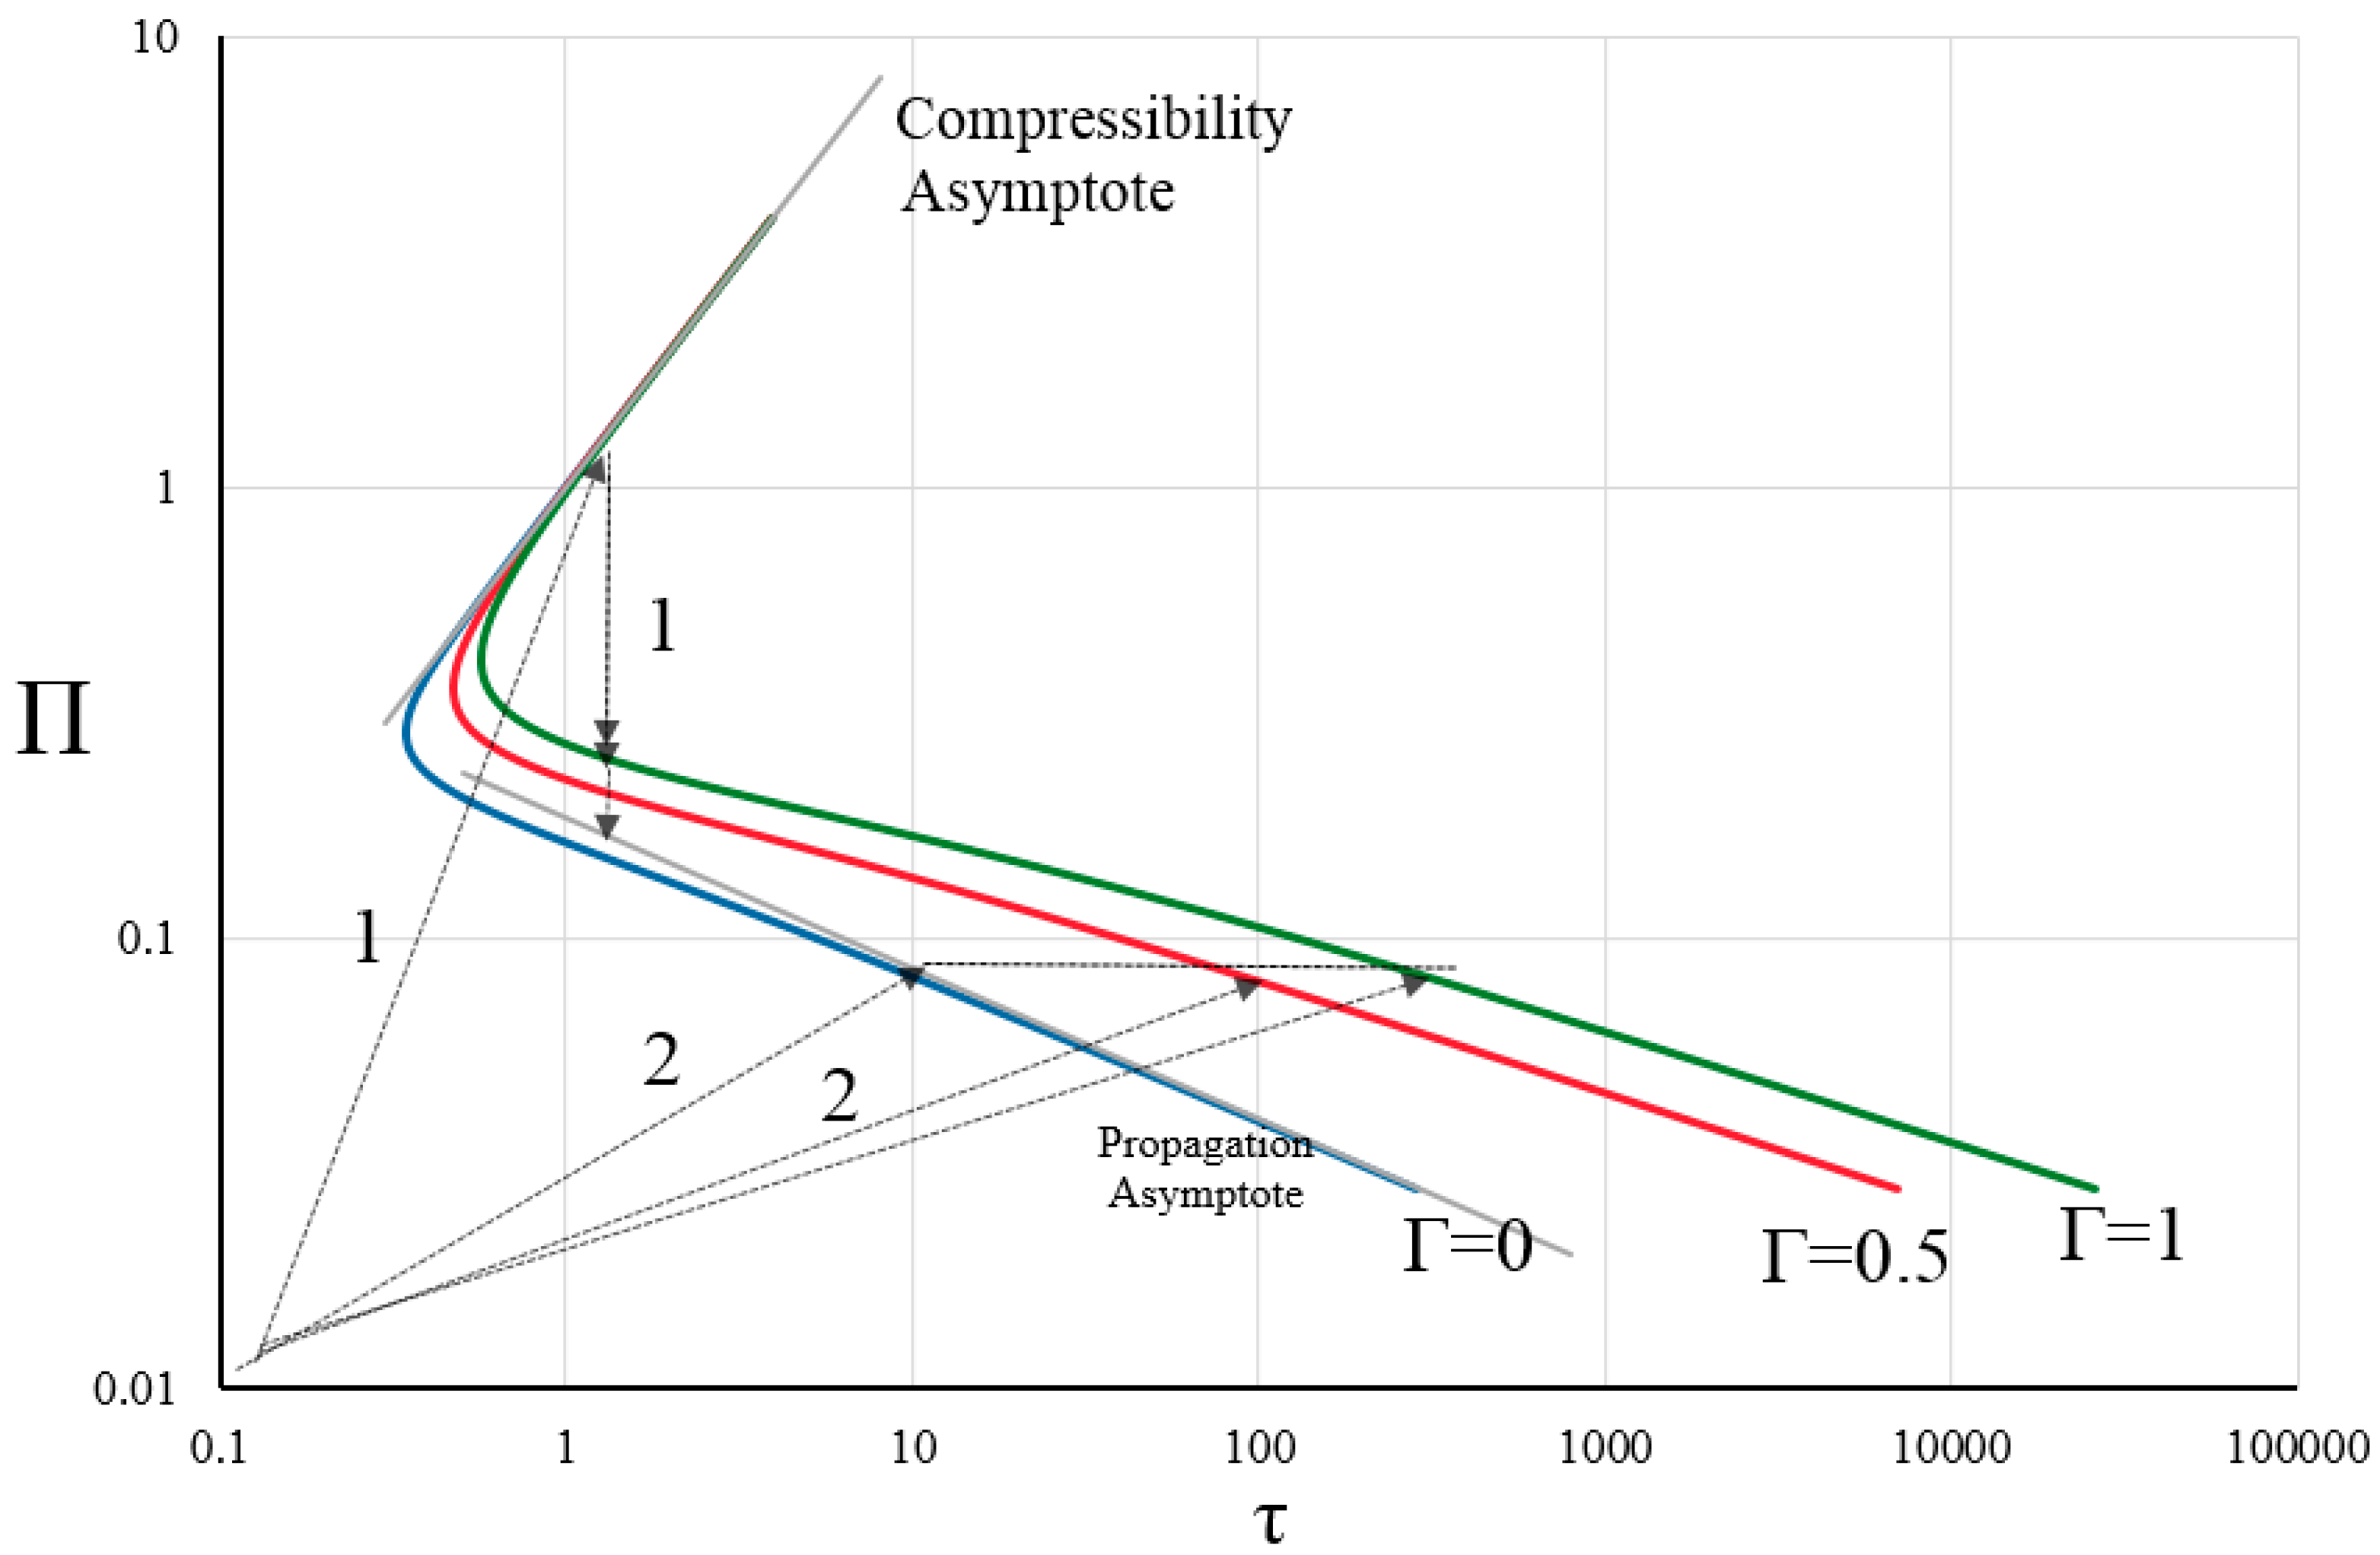
Figure 7 and Figure 8 show functions τ λ and τ , respectively, for different values of dimensionless leak-off coefficient Γ . Figure 7 illustrates that with the increase in the leak-off coefficient, the τ λ curves shift upwards, especially the right branch of the curves, for large initial crack lengths. This is because as the leak-off coefficient increases, part of the fluid infiltrates into the surrounding formation and consequently, more time is required to compress the fluid and reach the pressure required for fracture initiation (Path 2 in Figure 7 and Figure 8). The larger the length of the initial flaw, the longer the injection time that is required.
However, for small initial flaw lengths in the left branch, no difference is observed between the curves. According to Figure 9, in models with different leak-off coefficients but the same initial flaw length, the pressure required to initiate fracturing is the same. After instability, a larger leak-off coefficient corresponds to a lower pressure drop in the borehole and a smaller length for the crack to jump (Path 1 in Figure 7 and Figure 8). This behavior is observed because when the medium is permeable, part of the input energy is lost due to penetration.
Figure 7 and Figure 8 illustrate that when the medium is permeable, the net pressure and crack length no longer converge to the asymptotic solutions for large or very small times. In Figure 7, the position of λ t r a n is marked with a point on the curves; it can be seen that λ t r a n decreases as the leak-off coefficient increases.

6.3. Effect of Dimensionless Wellbore Radius A on Net Pressure

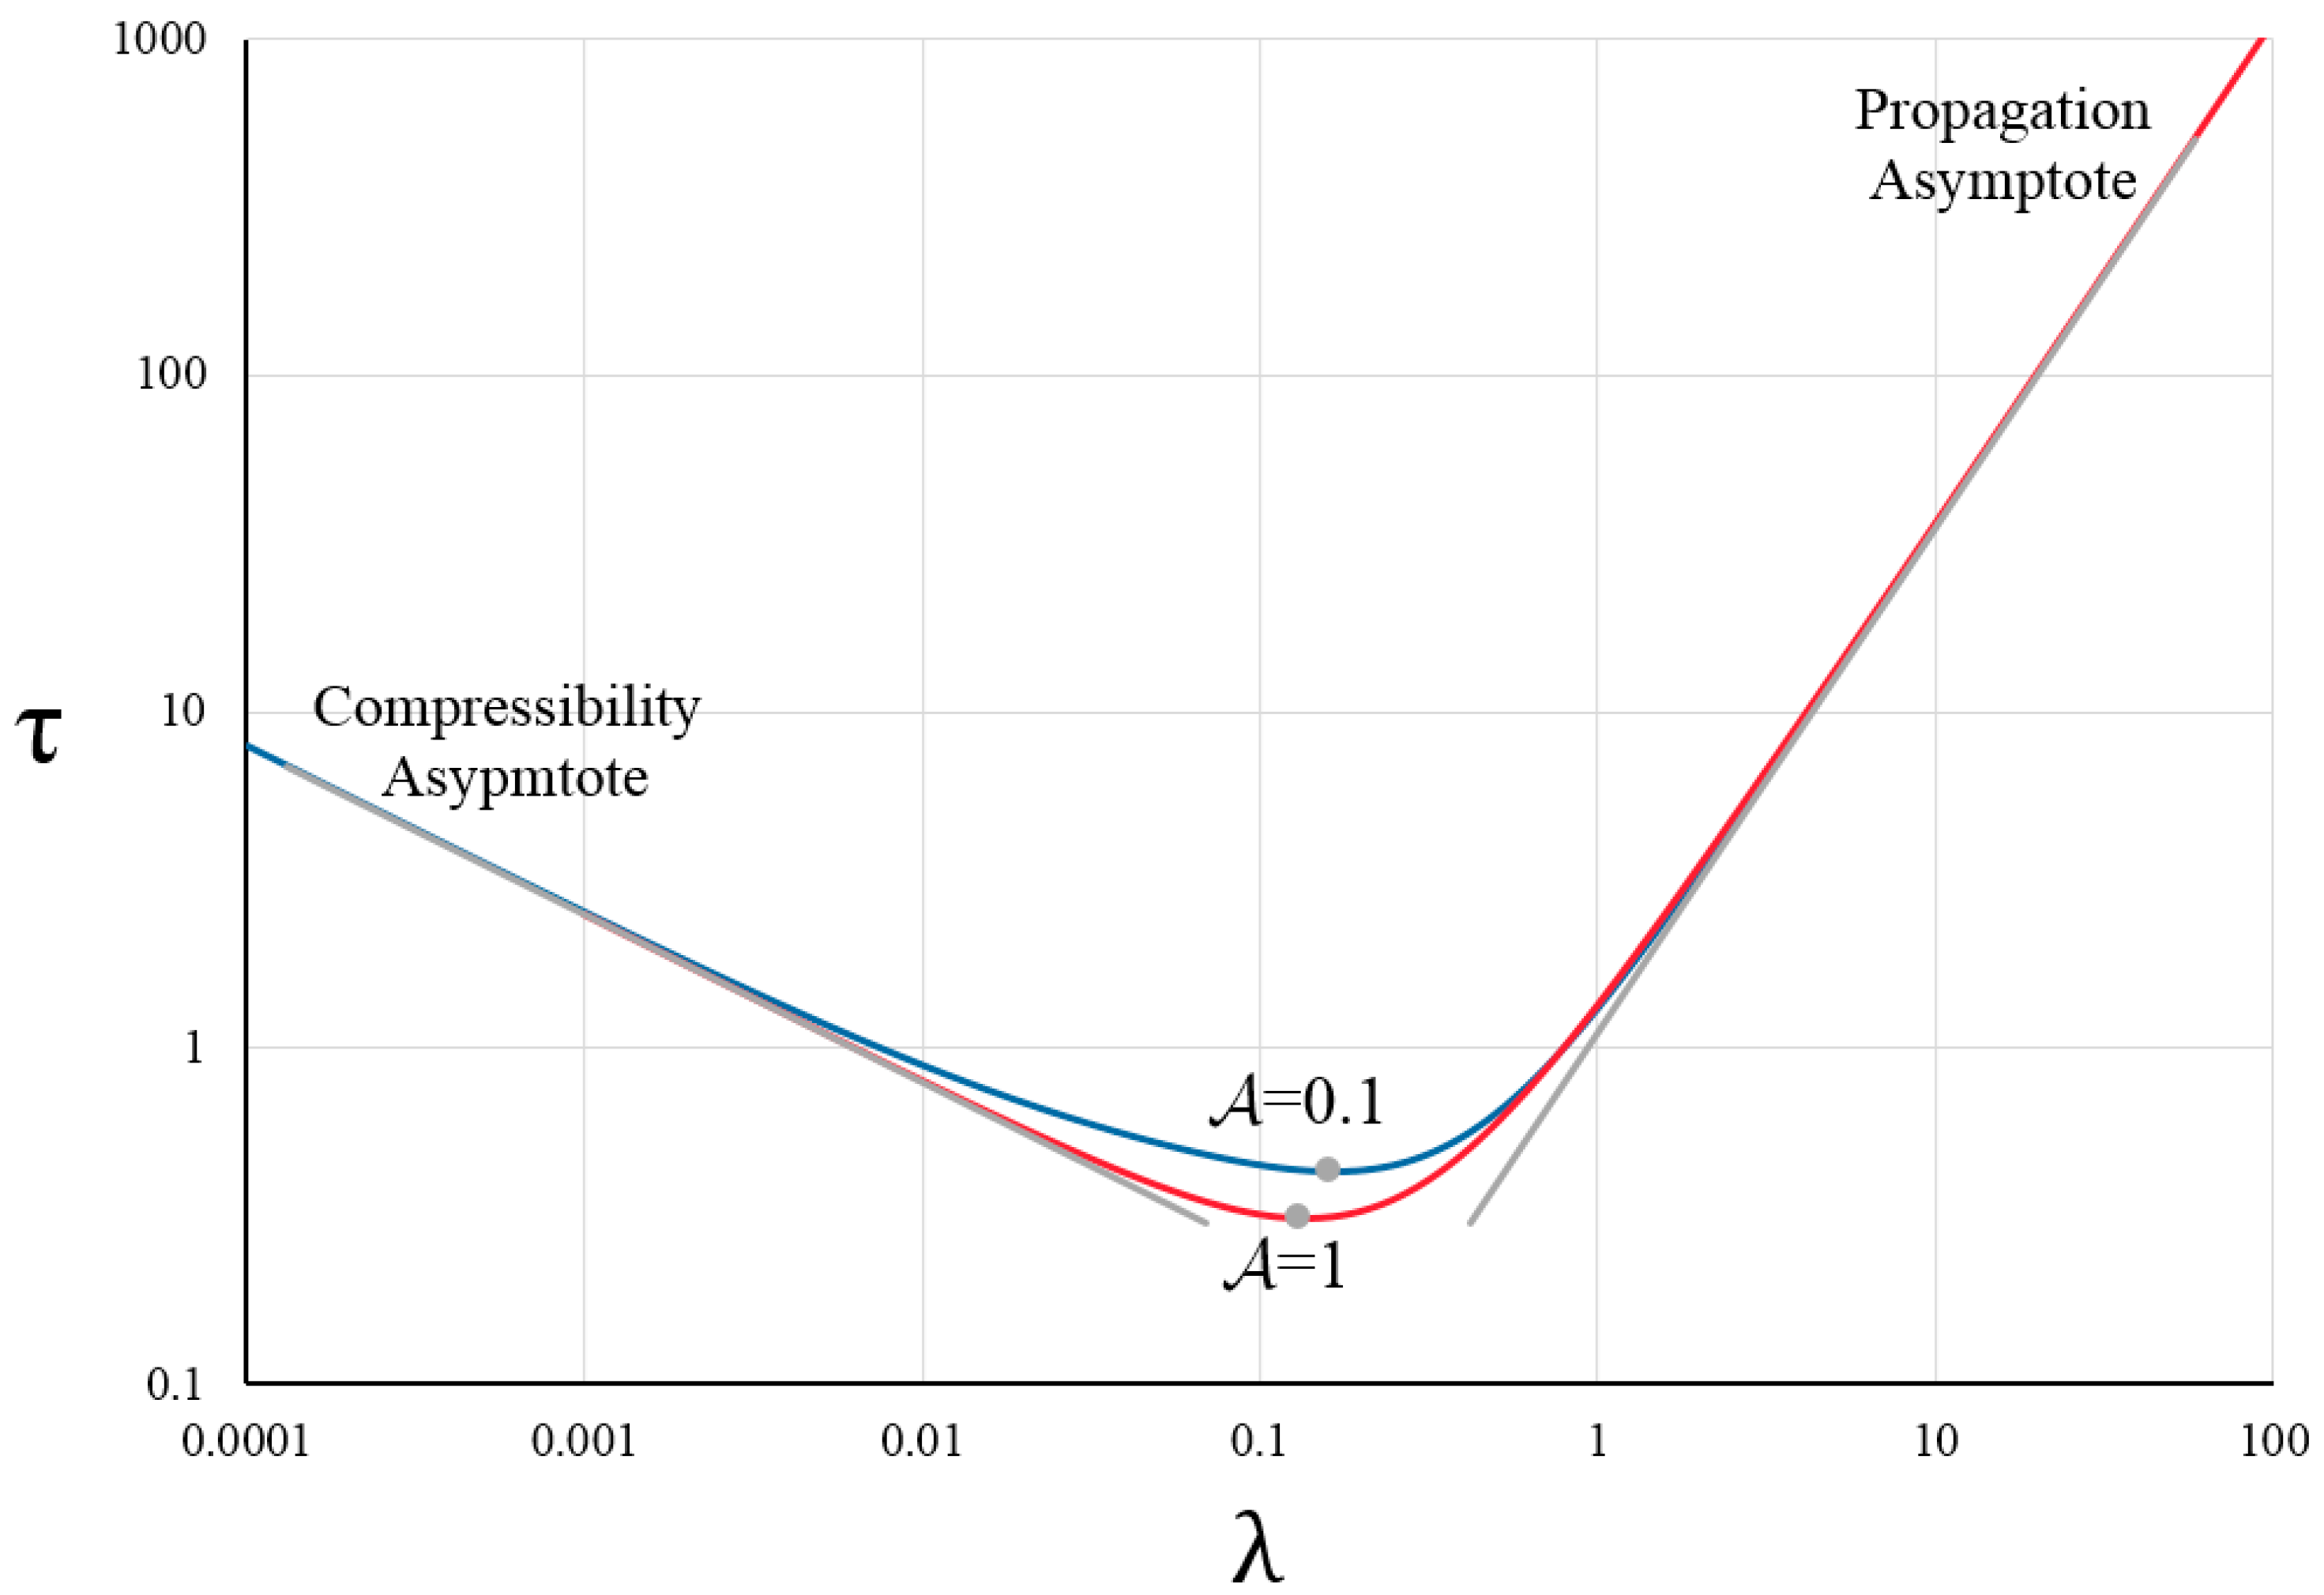
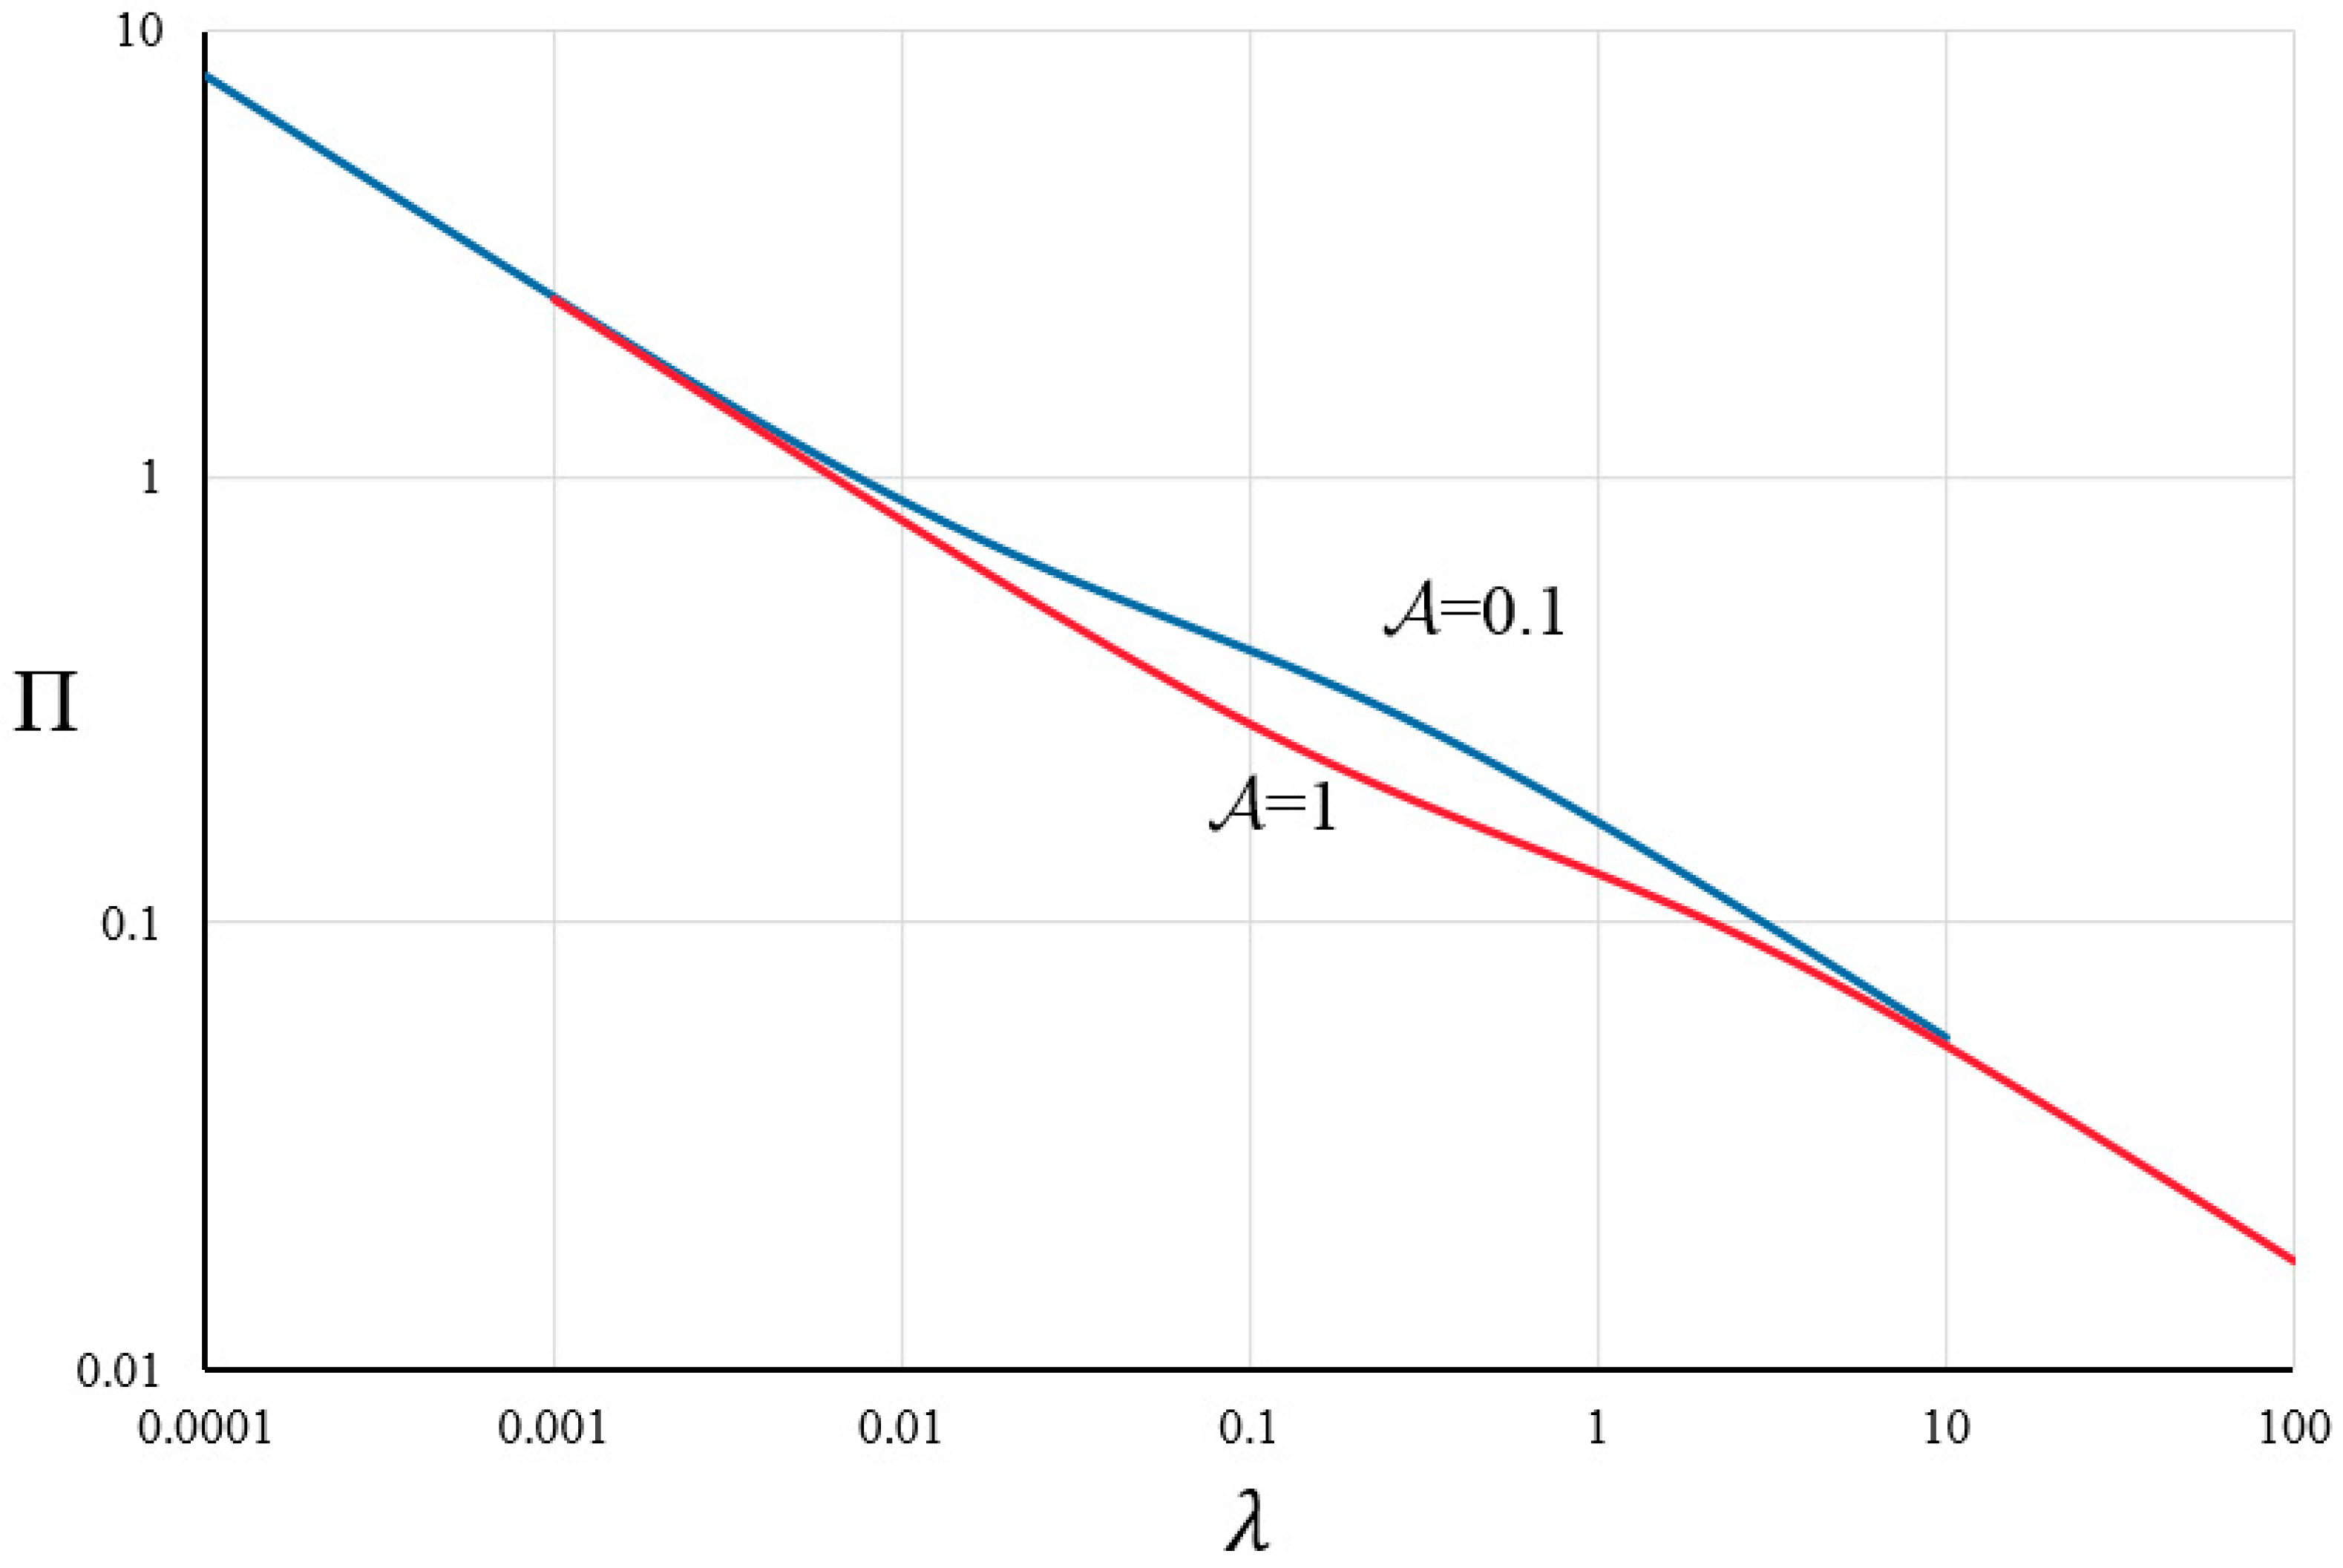
The effects of the dimensionless borehole radius on the net pressure and fracture initiation time are shown in Figure 10, Figure 11 and Figure 12. The results are given for two dimensionless borehole radii of A = 0.1 and A = 1 . Figure 10 shows that for 0.01 < λ < 1 , the model with the smaller dimensionless borehole radius requires a larger injection time to initiate fracture. It can also be seen in Figure 12 that, provided the length of the initial flaw is constant and for 0.01 < λ < 10 , the model with a smaller borehole radius needs a higher pressure level to reach the conditions for crack initiation and propagation. According to Figure 11, as long as the initial flaw length is small, the sudden drop in pressure after instability is greater in the model with a larger borehole radius, although the sudden increase in crack length is almost the same for two models with different borehole radii (Figure 10). With greater time τ > 10 , the effect of the borehole radius disappears and the crack length and net pressure become similar to the asymptotic solution for the Griffith crack given in Equation (42). In Figure 10, the position of λ t r a n is marked by a point on each curve; it can be seen that λ t r a n increases as A decreases.

6.4. Effect of Dimensionless Deviatoric Stress on the Net Pressure

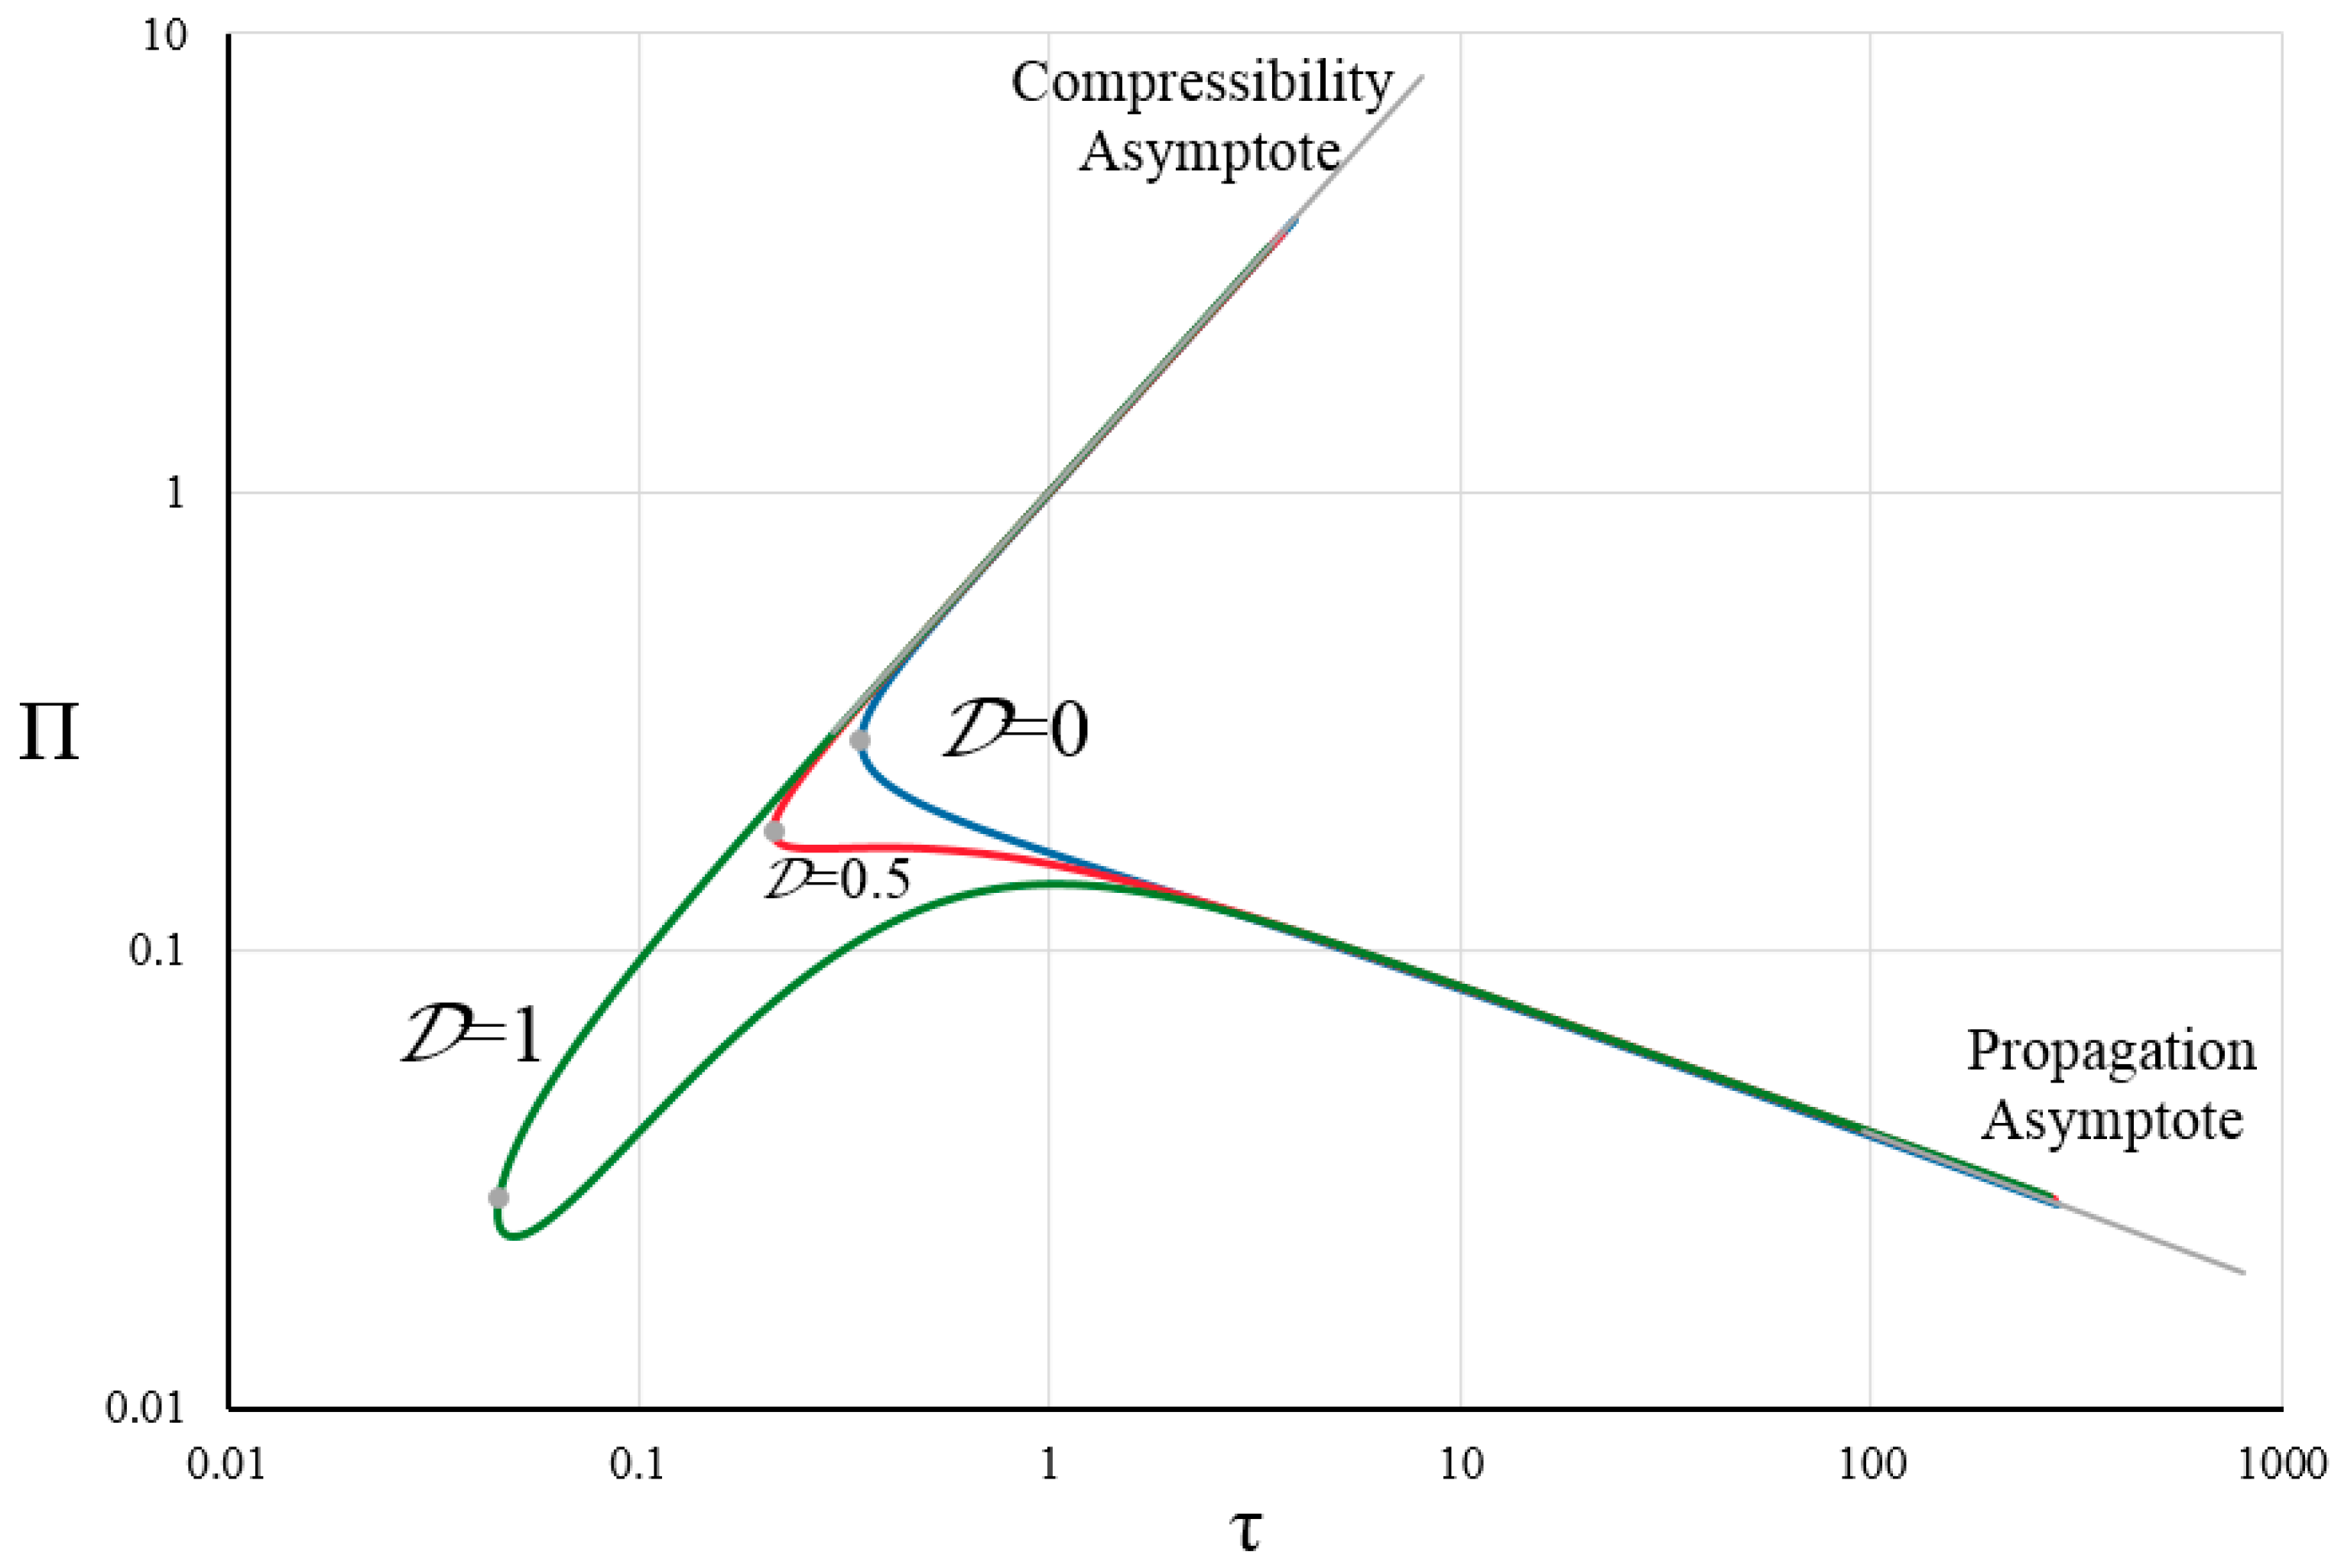
Figure 13, Figure 14 and Figure 15 illustrate functions τ λ 0 , Π τ , and Π λ 0 for three different values of deviatoric stress, D = 0 , D = 0.5 , and D = 1 . According to these figures, in general, with increasing deviatoric stress, cracks propagate more easily; that is, the injection time to reach the initiation pressure decreases. In other words, as the deviatoric stress increases due to the decrease in tangential stress in the borehole wall, less pressure is required to initiate fracturing.
For 0.01 < λ < 1 , the effect of deviatoric stress is significant. However, for λ > 1 , the effect of deviatoric stress disappears and the solution approaches the Griffith crack solution (Equation (42)). As before, the position of λ t r a n is marked with a point on each curve in Figure 13, and it can be seen that λ t r a n decreases with the increase in deviatoric stress.
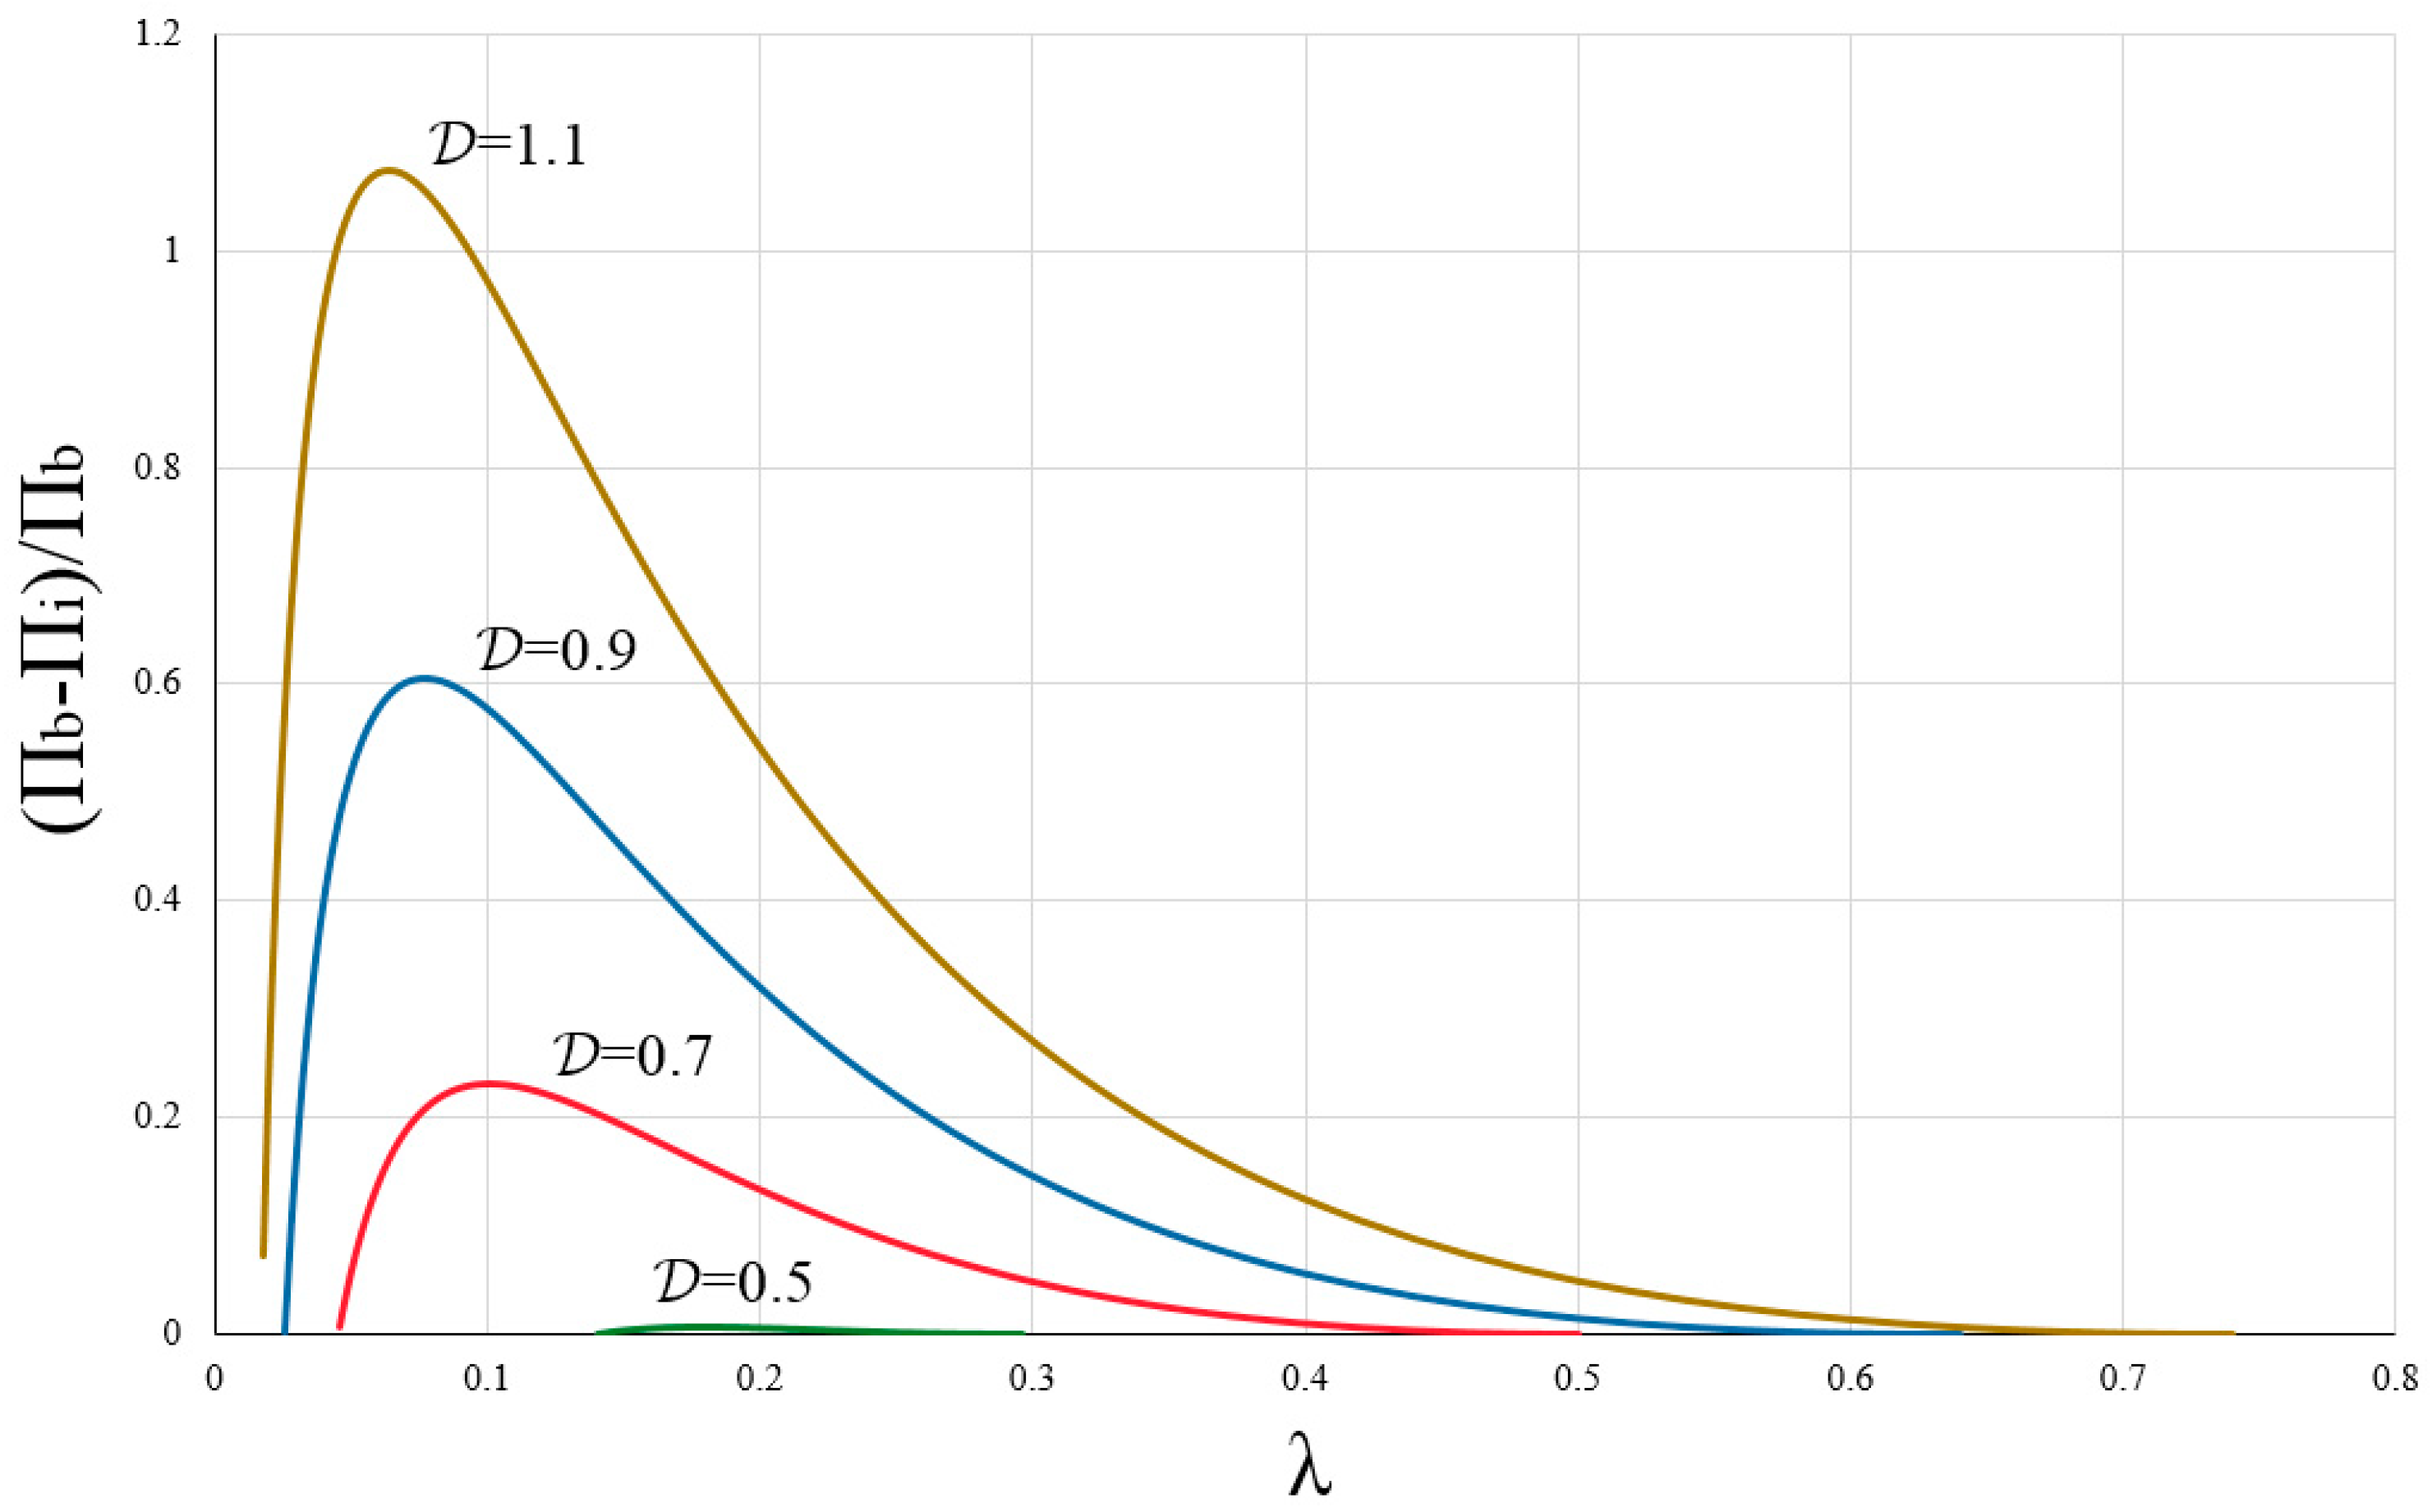
Figure 14 shows that for D 0.5 and for some initial crack lengths, the net pressure on the lower branch of the pressure–time curve increases until it reaches a peak, and the pressure then decreases again. This is a result of crack growth in the region near the borehole, where the stress field is strongly influenced by the deviatoric stress. Here, we denote the pressure at initiation by Π i and the peak pressure, which is known as breakdown pressure in hydraulic fracturing, by Π b . Figure 16 shows the ratio of the difference between the breakdown pressure and the initiation pressureto the breakdown pressure. The figure illustrates that as the deviatoric stress increases, the difference between the fracture initiation pressure and the peak pressure increases, when the crack is driven by an inviscid fluid.

6.5. Comparison of the Presented Model with the Haimson and Fairhurst Criterion

The purpose of this section is to compare the presented analytical model with classical hydraulic fracture models based on the tensile strength of the rock. According to Figure 2 and Figure 3, under conditions where the ratio of the initial flaw length to the radius of the wellbore is very small, i.e., η < < 1 :
F 2 η F 1 η 1 2 ,   F 1 η = 2.243
From a fracture mechanics point of view, for a crack under uniform tensile stress σ T , the stress intensity factor is given as follows:
K I = σ T ς π l
where ς = 1.1215 [35]. Substituting Equations (45) and (46) into Equation (15) and applying the crack propagation condition K I = K I C , Equation (15) after simplification becomes:
P w = 3 2 σ h 1 2 σ H + 1 2 σ T
Equation (47), which describes the borehole pressure required to initiate fracturing in terms of the tensile strength of the rock and the in situ stresses, is the well-known Haimson and Fairhurst breakdown pressure criterion [36]. This represents another validation for the presented model. The comparison also shows that the condition for using the Haimson and Fairhurst criterion to determine the breakdown pressure is that the ratio of the initial crack length to the borehole radius is very small [37].

7. Conclusions

In this article, an analytical model is presented to investigate the evolution of borehole pressure versus time during the hydraulic fracturing process. Scaling rules are used to reduce the number of problem parameters and the problem is solved in the compressibility–toughness-dominated propagation regime. In this regime, the input energy is dissipated through the creation of new crack surfaces in the rock, while the crack volume is similar to the volume of fluid released by decompression. In this crack propagation regime, fluid leak-off is negligible. The parameters affecting the problem include dimensionless borehole radius, dimensionless deviatoric stress, and dimensionless leak-off coefficient. Also, the wellbore net pressure depends on the dimensionless crack length and dimensionless time. Accordingly, the following results were obtained:
  • In cases where the fracture is driven by an inviscid fluid and the injection system is compressible, the fracture initiation may be accompanied by instability. Instability occurs when the initial flaw length is small or the compressibility effects of the system are significant. In such a situation, although a high level of pressure is required to satisfy the conditions for crack propagation, immediately after initiation, there is a quick decrease in borehole pressure and a sudden jump in the crack length;
  • If the compressibility effects of the injection system are negligible or if the initial flaw length is large, the pressure increases slowly until the conditions for crack propagation are met, after which, crack propagation begins in a stable manner;
  • Under conditions where the medium is permeable, some of the injected fluid infiltrates into the medium from the crack surfaces. If the initial flaw length is large and the fracture initiation is stable, with the increase in the leak-off coefficient, more time is needed to reach conditions for crack propagation. If the length of the initial flaw is small and the initiation is unstable, a higher leak-off coefficient means a lower pressure drop in the crack and the crack jumps a smaller length;
  • For 0.01 < λ < 10 , with a smaller dimensionless borehole radius, a higher level of net pressure is required to initiate fracturing;
  • As the dimensionless deviatoric stress increases, cracks propagate more easily because a lower level of stress is required to initiate fracturing;
  • For D 0.5 , pressure evolution versus time fluctuates. Consequently, the fracture initiation pressure becomes lower than the peak pressure. This is due to the effect of deviatoric stress on the stress distribution around the borehole;
  • As the deviatoric stress increases, the difference between the initiation pressure and the peak pressure increases.

Funding

This research received no external funding.

Data Availability Statement

No data were used to support this study.

Conflicts of Interest

The author declare no conflict of interest.

References

  1. Economides, M.J.; Nolte, K.G. Reservoir Stimulation; Wiley: Hoboken, NJ, USA, 2000. [Google Scholar]
  2. Smith, M.B.; Montgomery, C. Hydraulic Fracturing, 1st ed.; CRC Press: Boca Raton, FL, USA, 2015. [Google Scholar]
  3. Haimson, B.C.; Cornet, F.H. ISRM Suggested Methods for rock stress estimation—Part 3: Hydraulic fracturing (HF) and/or hydraulic testing of pre-existing fractures (HTPF). Int. J. Rock Mech. Min. Sci. 2003, 40, 1011–1020. [Google Scholar] [CrossRef]
  4. Lhomme, T.; Detournay, E.; Jeffrey, R.G. Effect of fluid compressibility and borehole on the initiation and propagation of a tranverse hydraulic fracture. Strength Fract. Comp. 2005, 3, 149–162. [Google Scholar]
  5. Desroches, J.; Thiercelin, M. Modelling the propagation and closure of micro-hydraulic fractures. Int. J. Rock Mech. Min. Sci. Geomech. Abstr. 1993, 3, 1231–1234. [Google Scholar] [CrossRef]
  6. Tanikella, S.S.; Sigallon, M.C.; Dressaire, E. Dynamics of fluid-driven fractures in the viscous-dominated regime. Proc. R. Soc. A 2023, 479, 20220460. [Google Scholar] [CrossRef]
  7. Savitski, A.A.; Detournay, E. Propagation of a penny-shaped fluid-driven fracture in an impermeable rock: Asymptotic solutions. Int. J. Solids Struct. 2002, 39, 6311–6337. [Google Scholar] [CrossRef]
  8. Adachi, J.I.; Detournay, E. Plane strain propagation of a hydraulic fracture in a permeable rock. Eng. Fract. Mech. 2008, 75, 4666–4694. [Google Scholar] [CrossRef]
  9. Jin, X.; Shah, S.N.; Roegiers, J.C.; Hou, B. Breakdown Pressure Determination—A Fracture Mechanics Approach. In Proceedings of the SPE Annual Technical Conference and Exhibition, New Orleans, LA, USA, 30 September–2 October 2013; p. D011S006R006. [Google Scholar]
  10. Zeng, Y.; Jin, X.; Ding, S.; Zhang, B.; Bian, X.; Shah, S.; McLennan, J.; Roegiers, J.C. Breakdown pressure prediction with weight function method and experimental verification. Eng. Fract. Mech. 2019, 214, 62–78. [Google Scholar] [CrossRef]
  11. Detournay, E.; Carbonell, R. Fracture-Mechanics Analysis of the Breakdown Process in Minifracture or Leakoff Test. SPE Prod. Facil. 1997, 12, 195–199. [Google Scholar] [CrossRef]
  12. Fatahi, H.; Hossain, M.M.; Fallahzadeh, S.H.; Mostofi, M. Numerical simulation for the determination of hydraulic fracture initiation and breakdown pressure using distinct element method. J. Nat. Gas Eng. 2016, 33, 1219–1232. [Google Scholar] [CrossRef]
  13. Li, J.; Dong, S.; Hua, W.; Li, X.; Pan, X. Numerical investigation of hydraulic fracture propagation based on cohesive zone model in naturally fractured formations. Processes 2019, 7, 28. [Google Scholar] [CrossRef]
  14. Zhu, D.; Han, G.; Zou, H.; Cui, M.; Liang, C.; Yao, F. A review of the hydraulic fracturing in ductile reservoirs: Theory, simulation, and experiment. Processes 2022, 10, 2022. [Google Scholar] [CrossRef]
  15. Bunger, A.P.; Lakirouhani, A.; Detournay, E. Modelling the effect of injection system compressibility and viscous fluid flow on hydraulic fracture breakdown pressure. In Proceedings of the ISRM International Symposium on In-Situ Rock Stress, Beijing, China, 10–12 August 2010. [Google Scholar]
  16. Mokryakov, V. Analytical solution for propagation of hydraulic fracture with Barenblatt’s cohesive tip zone. Int. J. Fract. 2011, 169, 159–168. [Google Scholar] [CrossRef]
  17. Wang, H.; Marongiu-Porcu, M.; Economides, M.J. Poroelastic and poroplastic modeling of hydraulic fracturing in brittle and ductile formations. SPE Prod. Oper. 2016, 31, 47–59. [Google Scholar] [CrossRef]
  18. Jolfaei, S.; Lakirouhani, A. Initiation pressure and location of fracture initiation in elliptical wellbores. Geotech. Geol. Eng. 2023, 41, 4487–4506. [Google Scholar] [CrossRef]
  19. Jolfaei, S.; Lakirouhani, A. Impact of Wellbore Cross-Sectional Elongation on the Hydraulic Fracturing Breakdown Pressure and Fracture Initiation Direction. Processes 2024, 12, 848. [Google Scholar] [CrossRef]
  20. Nordgren, R.P. Propagation of a vertical hydraulic fracture. Soc. Pet. Eng. J. 1972, 12, 306–314. [Google Scholar] [CrossRef]
  21. Zheltov, A.K. Formation of vertical fractures by means of highly viscous liquid. In Proceedings of the World Petroleum Congress, Rome, Italy, 1–4 June 1955. [Google Scholar]
  22. Geertsma, J.; De Klerk, F. A rapid method of predicting width and extent of hydraulically induced fractures. J. Pet. Technol. 1969, 21, 1571–1581. [Google Scholar] [CrossRef]
  23. Sneddon, I.N. The distribution of stress in the neighbourhood of a crack in an elastic solid. Proc. R. Soc. Lond. A Math. Phys. Sci. 1946, 187, 229–260. [Google Scholar]
  24. Detournay, E. Propagation regimes of fluid-driven fractures in impermeable rocks. Int. J. Geomech. 2004, 4, 35–45. [Google Scholar] [CrossRef]
  25. Bunger, A.P.; Jeffrey, R.G.; Detournay, E. Application of scaling laws to laboratory-scale hydraulic fractures. In Proceedings of the ARMA US Rock Mechanics/Geomechanics Symposium, Anchorage, AL, USA, 8–11 June 2005. [Google Scholar]
  26. Garagash, D.I. Plane-strain propagation of a fluid-driven fracture during injection and shut-in: Asymptotics of large toughness. Eng. Fract. Mech. 2006, 73, 456–481. [Google Scholar] [CrossRef]
  27. Dontsov, E.V. Scaling laws for hydraulic fractures driven by a power-law fluid in homogeneous anisotropic rocks. Int. J. Numer. Anal. Methods Geomech. 2019, 43, 519–529. [Google Scholar] [CrossRef]
  28. Barenblatt, G.I. Scaling, Self-Similarity, and Intermediate Asymptotics: Dimensional Analysis and Intermediate Asymptotics; Cambridge University Press: Cambridge, UK, 1996. [Google Scholar]
  29. Howard, G.C.; Fast, C.R. Optimum fluid characteristics for fracture extension. In Drilling and Production Practice; OnePetro: Richardson, TX, USA, 1957. [Google Scholar]
  30. Lakirouhani, A.; Bunger, A.; Detournay, E. Modeling initiation of hydraulic fractures from a wellbore. In Proceedings of the ISRM International Symposium-Asian Rock Mechanics Symposium, Tehran, Iran, 13–16 November 2008. [Google Scholar]
  31. Lakirouhani, A.; Detournay, E.; Bunger, A.P. A reassessment of in situ stress determination by hydraulic fracturing. Geophys. J. Int. 2016, 205, 1859–1873. [Google Scholar] [CrossRef]
  32. Anderson, T.L.; Anderson, T.L. Fracture Mechanics: Fundamentals and Applications; CRC Press: Boca Raton, FL, USA, 2005. [Google Scholar]
  33. Lakirouhani, A.; Jolfaei, S. Hydraulic fracturing breakdown pressure and prediction of maximum horizontal in situ stress. Adv. Civ. Eng. 2023, 2023, 8180702. [Google Scholar] [CrossRef]
  34. Perkins, T.K.; Kern, L.R. Widths of hydraulic fractures. J. Pet. Technol. 1961, 13, 937–949. [Google Scholar] [CrossRef]
  35. Tada, H.; Paris, P.C.; Irwin, G.R. The Stress Analysis of Cracks Handbook; Del Research Corporation: Hellertown, PA, USA, 1973. [Google Scholar]
  36. Haimson, B.; Fairhurst, C. Initiation and extension of hydraulic fractures in rocks. Soc. Pet. Eng. J. 1967, 7, 310–318. [Google Scholar] [CrossRef]
  37. Lakirouhani, A.; Jolfaei, S. Assessment of Hydraulic Fracture Initiation Pressure Using Fracture Mechanics Criterion and Coupled Criterion with Emphasis on the Size Effect. Arab. J. Sci. Eng. 2024, 49, 5897–5908. [Google Scholar] [CrossRef]
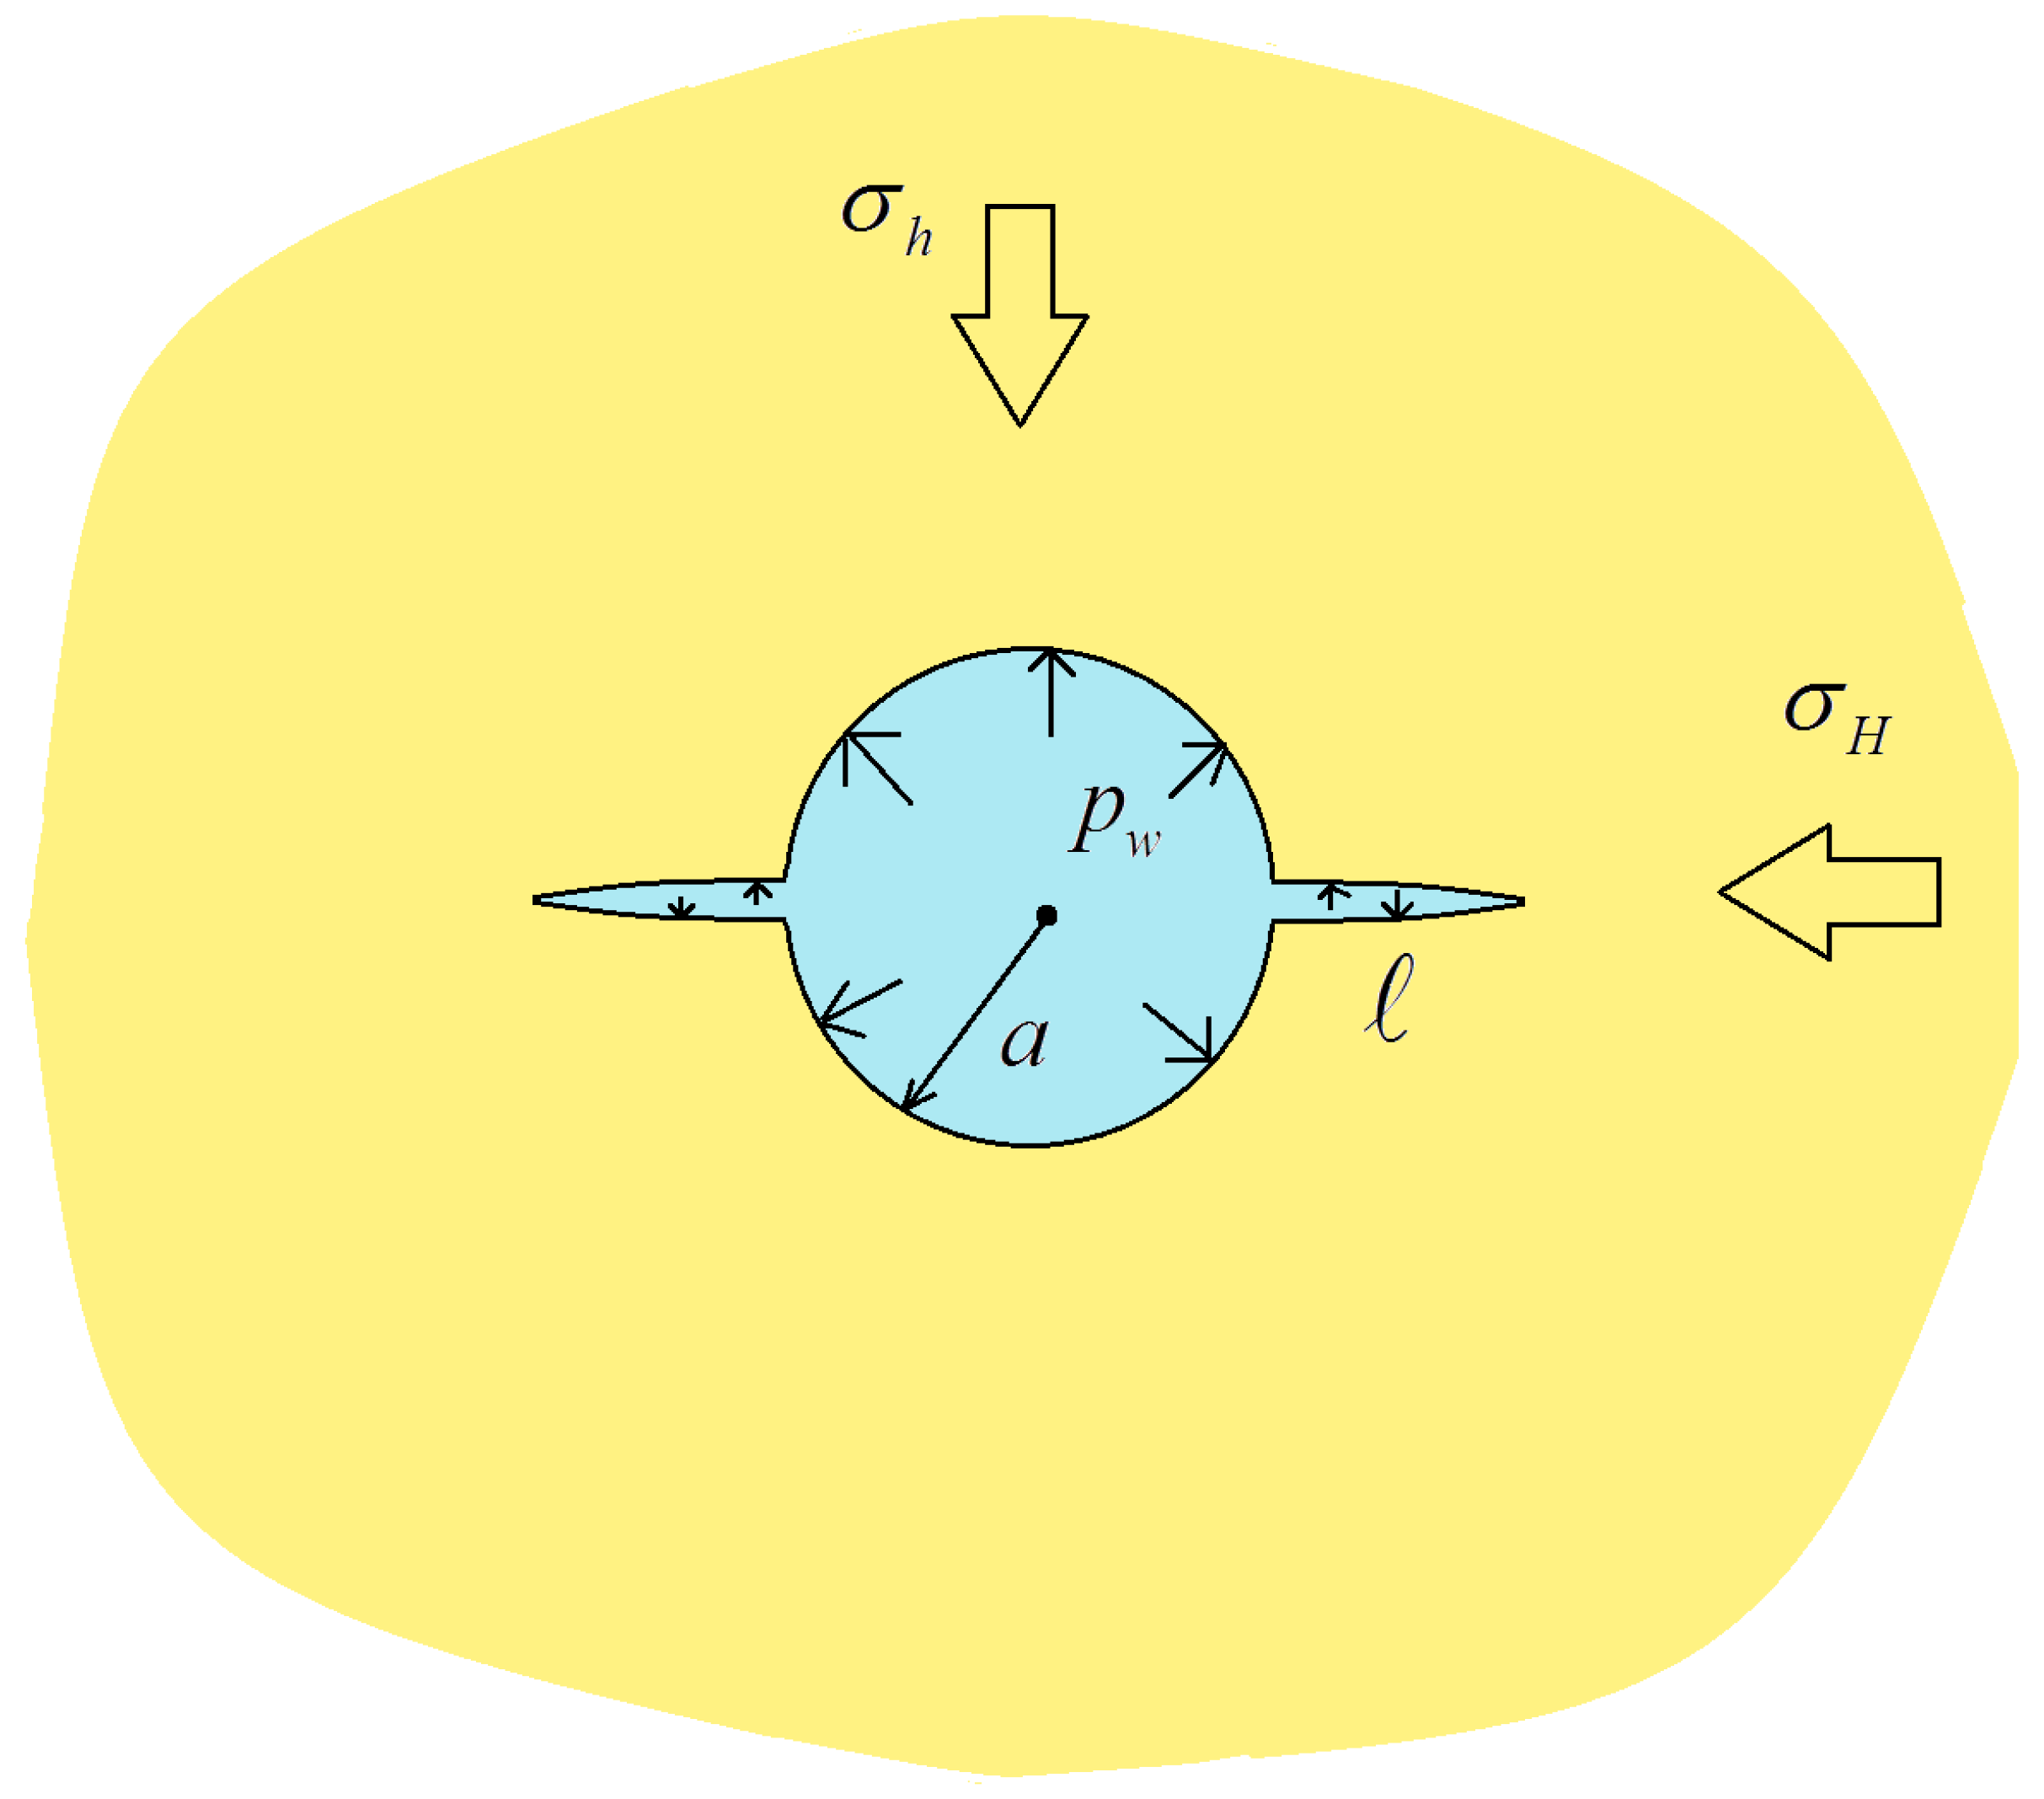
Figure 1. Geometry of the problem.
Mathematics 13 00135 g001
Figure 2. Functions of F 1 and H 1 versus η = l a .
Mathematics 13 00135 g002
Figure 3. Functions of F 2 and H 2 versus η = l a .
Mathematics 13 00135 g003
Figure 4. Evolution of net pressure Π versus time τ   A = 0.4 , D = Γ = 0 .
Mathematics 13 00135 g004
Figure 5. Initiation time τ versus dimensionless initial flaw length λ A = 0.4 , D = Γ = 0 .
Mathematics 13 00135 g005
Figure 6. Dimensionless net pressure Π versus dimensionless initial flaw length λ A = 0.4 , D = Γ = 0 .
Mathematics 13 00135 g006
Figure 7. Time τ versus dimensionless initial flaw length λ for different values of leak-off coefficient Γ   A = 0.4 , D = 0 .
Mathematics 13 00135 g007
Figure 8. Evolution of net pressure Π versus time τ for different values of leak-off coefficient Γ   A = 0.4 , D = 0 .
Mathematics 13 00135 g008
Figure 9. Dimensionless net pressure Π versus dimensionless initial flaw length λ for different values of leak-off coefficient Γ   A = 0.4 , D = 0 .
Mathematics 13 00135 g009
Figure 10. Time τ versus dimensionless initial flaw length λ for various dimensionless borehole radii A   D = Γ = 0 .
Mathematics 13 00135 g010
Figure 11. Evolution of net pressure Π versus time τ for various dimensionless borehole radii A   D = Γ = 0 .
Mathematics 13 00135 g011
Figure 12. Dimensionless net pressure Π versus dimensionless initial flaw length λ for various dimensionless borehole radii A   D = Γ = 0 .
Mathematics 13 00135 g012
Figure 13. Time τ versus dimensionless initial flaw length λ for various levels of deviatoric stress D   Γ = 0 , A = 0.4 .
Mathematics 13 00135 g013
Figure 14. Evolution of net pressure Π versus time τ for various levels of deviatoric stress D   Γ = 0 , A = 0.4 .
Mathematics 13 00135 g014
Figure 15. Dimensionless net pressure Π versus dimensionless initial flaw length λ for various levels of deviatoric stress D   Γ = 0 , A = 0.4 .
Mathematics 13 00135 g015
Figure 16. Difference between breakdown pressure Π b and initiation pressure Π i for various levels of deviatoric stress D   Γ = 0 , A = 0.4 .
Mathematics 13 00135 g016
Disclaimer/Publisher’s Note: The statements, opinions and data contained in all publications are solely those of the individual author(s) and contributor(s) and not of MDPI and/or the editor(s). MDPI and/or the editor(s) disclaim responsibility for any injury to people or property resulting from any ideas, methods, instructions or products referred to in the content.