Article

Prediction of Lithium Carbonate Prices in China Applying a VMD–SSA–LSTM Combined Model

by
Wenyi Wang
1,
Haifei Liu
1,
Lin Jiang
2 and
Lei Wang
2,*
1
School of Management and Engineering, Nanjing University, Nanjing 210093, China
2
School of Economics and Management, Nanjing Tech University, Nanjing 211816, China
*
Author to whom correspondence should be addressed.
Mathematics 2025, 13(4), 613; https://doi.org/10.3390/math13040613
Submission received: 16 January 2025 / Revised: 11 February 2025 / Accepted: 12 February 2025 / Published: 13 February 2025

Abstract

:
Given the highly nonlinear and unstable characteristics of lithium carbonate prices in China’s lithium battery industry chain, the accuracy of a single prediction model is limited. This study introduces the prices of related materials in the lithium battery industry and macro-environmental indicators as key influencing factors. This study utilizes Variational Mode Decomposition (VMD) and the Sparrow Search Algorithm (SSA) to further develop the Long Short-Term Memory (LSTM) network, resulting in a VMD–SSA–LSTM combination model for predicting lithium carbonate pricing. The research results indicate that (1) using the VMD to decompose the time series of the original lithium carbonate prices can accurately extract the core features of the prices and significantly weaken the instability of the data; (2) by leveraging SSA to perform global optimization on the three parameters of the LSTM model and fitting the optimal parameters into the LSTM network, the generalization ability and robustness of the model are enhanced; (3) on the lithium carbonate dataset, the VMD–SSA–LSTM model outperforms the typical LSTM and VMD–LSTM models, achieving the lowest prediction error and a goodness-of-fit (R2) of 0.9880, demonstrating a higher prediction accuracy for lithium carbonate prices. This study presents more precise benchmarks for resource optimization and price decisions in the lithium carbonate industry.

1. Introduction

In recent years, with the growing global focus on green energy, especially the rapid development of the new energy vehicle industry, the demand for lithium batteries has significantly increased [1]. Meanwhile, given that lithium carbonate is one of the key raw materials for lithium battery manufacturing, this has led to a sharp increase in market demand for lithium carbonate materials. China has emerged as the greatest market for new energy vehicles worldwide, accounting for nearly three-quarters of the global market share. With such a large volume of new energy vehicles, China not only has a strong demand for lithium carbonate but is also highly sensitive to its price fluctuations. Specifically, significant price changes in lithium carbonate can directly impact the costs of China’s battery manufacturers as well as the entire cost structure and market competitiveness of China’s new energy automotive industry.
At present, the price of lithium carbonate in China has been on a continuous downward trend after experiencing a round of high prices. This reflects a fundamental shift that has begun to occur in the supply and demand structure of the lithium carbonate industry. Especially in the context of strong demand for new energy batteries, a large number of Chinese lithium carbonate enterprise executives violate the law of market competition in order to pursue short-term high earnings. These executives’ blind and overconfident decision-making results in a large number of short-term influxes in production capacity in the lithium carbonate industry [2]. Coupled with this, the disorderly competition has led to the release of production capacity at a rate far greater than the normal demand of the industry, which in turn has triggered huge fluctuations in the price of lithium carbonate in China [3]. Such dramatic price turbulence is detrimental to the development of the lithium carbonate industry. This further reflects the importance of accurately capturing the trends in the price of lithium carbonate in a timely manner. Therefore, the ability to accurately predict changes in China’s lithium carbonate prices will help provide battery manufacturers and end-users with more precise market predictions, thereby optimizing procurement and production plans and reducing supply chain risks.
Research on lithium carbonate price prediction models can be mainly categorized into three types. The first is supply and demand prediction models [4,5,6]. Although such model are able to predict lithium carbonate prices from the supply and demand dimensions, their accuracy is limited because they do not account for nonlinear market factors or external disturbances. The second is statistical and time series analysis models [7,8]. These models are capable of predicting the trends in lithium carbonate price fluctuations based on historical price data. However, they struggle to handle the instability of lithium carbonate prices when facing sudden events or changes in market structure. The third are machine learning methods [9,10]. Among these, LSTM (Long Short-Term Memory) networks [11,12] have been widely used in time-series forecasting due to their ability to capture long-term dependencies in sequential data. However, applying LSTM alone to predict lithium carbonate prices has certain limitations, such as difficulties handling high volatility and external disturbances. To address these issues, researchers have explored optimized LSTM-based models. These approaches integrate techniques such as VMD (Variational Mode Decomposition) [13] for feature extraction and SSA (Sparrow Search Algorithm) [14] for parameter optimization. While VMD enhances the model’s ability to process nonlinear and non-stationary data, SSA helps in fine-tuning hyper-parameters to improve predictive accuracy. In order to further improve the prediction accuracy, scholars have constructed VMD–SSA–LSTM hybrid models [15,16,17]. A representative study is [16], in which the authors constructed a VMD–SSA–LSTM combined model and accurately predicted the price of silicon in China based on the non-stationarity, nonlinearity, and expanded complexity characteristics of silicon prices across the chain in the photovoltaic industry. However, the existing research primarily focuses on specific commodity markets, with explorations of lithium carbonate pricing mechanisms in the context of the battery industry supply chain being limited. Therefore, inspired by this research, this study aims to accurately predict the price of lithium carbonate in China by constructing a VMD–SSA–LSTM combined model, and taking the highly nonlinear and unstable characteristics of the lithium carbonate price in China’s battery industry chain into full consideration.
In summary, according to the characteristics of China’s lithium carbonate price volatility, sensitivity to macroeconomic factors, and susceptibility to speculative trading activities, this paper comprehensively considers key influencing factors such as the prices of materials related to the lithium battery industry and the macro-environment. At the same time, on the basis of the VMD algorithm, SSA is introduced to the LSTM model to develop a VMD–SSA–LSTM combination model with a higher prediction accuracy for Chinese lithium carbonate prices. The main innovations of this paper are as follows: (1) The prediction model presented in this paper takes into account a combination of the relevant pricing of materials in the industry chain, macroeconomic indicators, and the time series characteristics of lithium carbonate prices. By introducing multidimensional influencing factors, the paper reveals the underlying logic behind lithium carbonate price fluctuations, and thus achieves a more accurate prediction analysis. (2) In this paper, a combined model of a Long Short-Term Memory (LSTM) network optimized using Variational Modal Decomposition (VMD) and the Sparrow Search Algorithm (SSA) is applied to the prediction of lithium carbonate prices. VMD effectively decomposes nonlinear and non-stationary data, while the SSA optimizes the hyperparameters, enhancing the overall predictive performance of the model.
The structure of this paper is as follows: In the second part, three distinct models are assembled. Subsequently, the third part focuses on the construction of the combined VMD–SSA–LSTM model. The fourth part centers around predicting the price of lithium carbonate using the VMD–SSA–LSTM combination model. Finally, the fifth part summarizes the main conclusions drawn from this article.

2. Single Model Construction

2.1. VMD Algorithm

Variational mode decomposition (VMD) is a non-recursive algorithm for signal processing, which can decompose complex signals into simple signals with different center frequencies. These signals have a limited bandwidth and sparse characteristics in the frequency band. By optimizing the limited bandwidth constraint, the VMD method ensures that the decomposed modal components and residuals can accurately reconstruct the original signal [18,19,20]. However, VMD lacks an automated mechanism for determining the optimal K, requiring empirical selection or additional optimization methods. To achieve this, the VMD method consists of the following specific steps:
(1) Analyze the analytical signal corresponding to each mode through the Hilbert transform [18], and subsequently assemble the spectrum to obtain the analytical signal at a certain time t:
s k t = δ t + j π t u k t
where u k t represents the k -th intrinsic mode function (IMF) component; δ t is a pulse signal; j is the imaginary unit; t is time.
(2) To move the spectrum of each mode to the appropriate baseband, correct the estimated center frequency of the analytical signal for each mode.
(3) Using the squared norm, estimate the bandwidth of the demodulated signal while keeping the total bandwidths to a minimum. The following is the constraint:
min u k ω k K μ t δ t + j π t u k t e j ω k t 2 2 s . t . K u k t = y t
in which μ t is a time function; ω k is the center frequency of the k -th mode component; y t is the original signal. In order to solve the above constrained variational problem, the penalty coefficient μ and Lagrange multiplier λ are introduced. , denotes the dot product. The constraint condition is transformed into an equality reduction:
L u k t , ω k , λ = μ K μ t δ t + j π t u k t e j ω k t 2 2 + y t K u k t 2 2 + λ t , y t K u k t

2.2. Sparrow Search Algorithm

The Sparrow Search Algorithm (SSA) is a powerful metaheuristic algorithm for optimizing model hyperparameters, improving forecasting accuracy. However, it does not possess an intrinsic forecasting capability and must be combined with a predictive model to yield meaningful results [21,22]. Three roles are involved in this process: discoverers, joiners, and alarmists. Discoverers are responsible for searching within the population, which requires great fitness and a vast search area. Joiners are comparatively less fit and primarily follow discoverers. When alarmists identify predators in a population, they send out warning signals, alerting discoverers to swiftly relocate the population to a safe region. Consequently, the sparrow population’s matrix representation is as follows:
X = x 1 1 x 1 2 x 1 d x 2 1 x 2 2 x 2 d x n 1 x n 2 x n d
in which n is the population’s number of sparrows; d indicates the dimensionality of the variables in the optimization problem.
The SSA population’s fitness function can be defined as the following:
F x = f x 1 1 x 1 2 x 1 d f x 2 1 x 2 2 x 2 d f x n 1 x n 2 x n d
in which f represents each sparrow’s fitness level.
For discoverers, the precise position update is provided by the following:
X z , j l + 1 = X z , j l × exp z α × i max , R 2 < T s X z , j l + Q × L , R 2 T s
in which X z , j l indicates the position of the z -th sparrow in the j -th dimension at the l -th iteration; i max represents the final iteration number; α 0 , 1 ; Q is a random value; L is the unit row vector. R 2 0 , 1 and T s 0.5 , 1 stand for the safety value and the alarm value, respectively. When R 2 < T s , this signifies that no predators are present in the forage surroundings, enabling the discoverers to conduct extensive searches. When R 2 T s , this indicates that there is dangerous information, and sparrows should be transferred to a safe area to search. Therefore, the following represents the joiners’ foraging process after the action of the discoverers:
X z , j l + 1 = Q × exp X w o r s t l X z , j l z 2 , i > n 2 X q l + 1 + X z , j l X q l + 1 × D T D D T 1 × L , e l s e
in which X q is the greatest position for the discoverers; X w o r s t is the poorest position of the population at that point; D is a s a matrix containing randomly allocated elements of 1 or −1. When i > n 2 , this indicates that the i -th participant must fly across distinct areas to scavenge for extra power.
When alerted to the danger, the position of the alerter is upgraded:
X z , j l + 1 = X z , j l + K × X z , j l X w o r s t l g z g ω + ε , g z = g b X b e s t l + β × X z , j l X b e s t l , g z g b
in which g z represents the sparrow’s current level of fitness; g b and g ω are the global optimal fitness and the worst fitness; X b e s t is the global optimal position at the current time; β is the control step parameter and obeys the standard normal distribution; K is the flight trajectory of the sparrow, which is a random number of 1 , 1 ; and ε is a constant used for avoiding division by zero. When g z g b , this shows that sparrows are vulnerable to danger. When g z = g b , this shows that sparrows are aware of the danger and tend to be close to other individuals at this time, reducing the possibility of them being attacked.
At each iteration, the fitness values of all individuals are calculated and updated according to the size of the fitness values to obtain the position of the current global optimal fitness until the end of the cycle. At the end of the cycle, the best fitness value is taken as the global optimal solution.

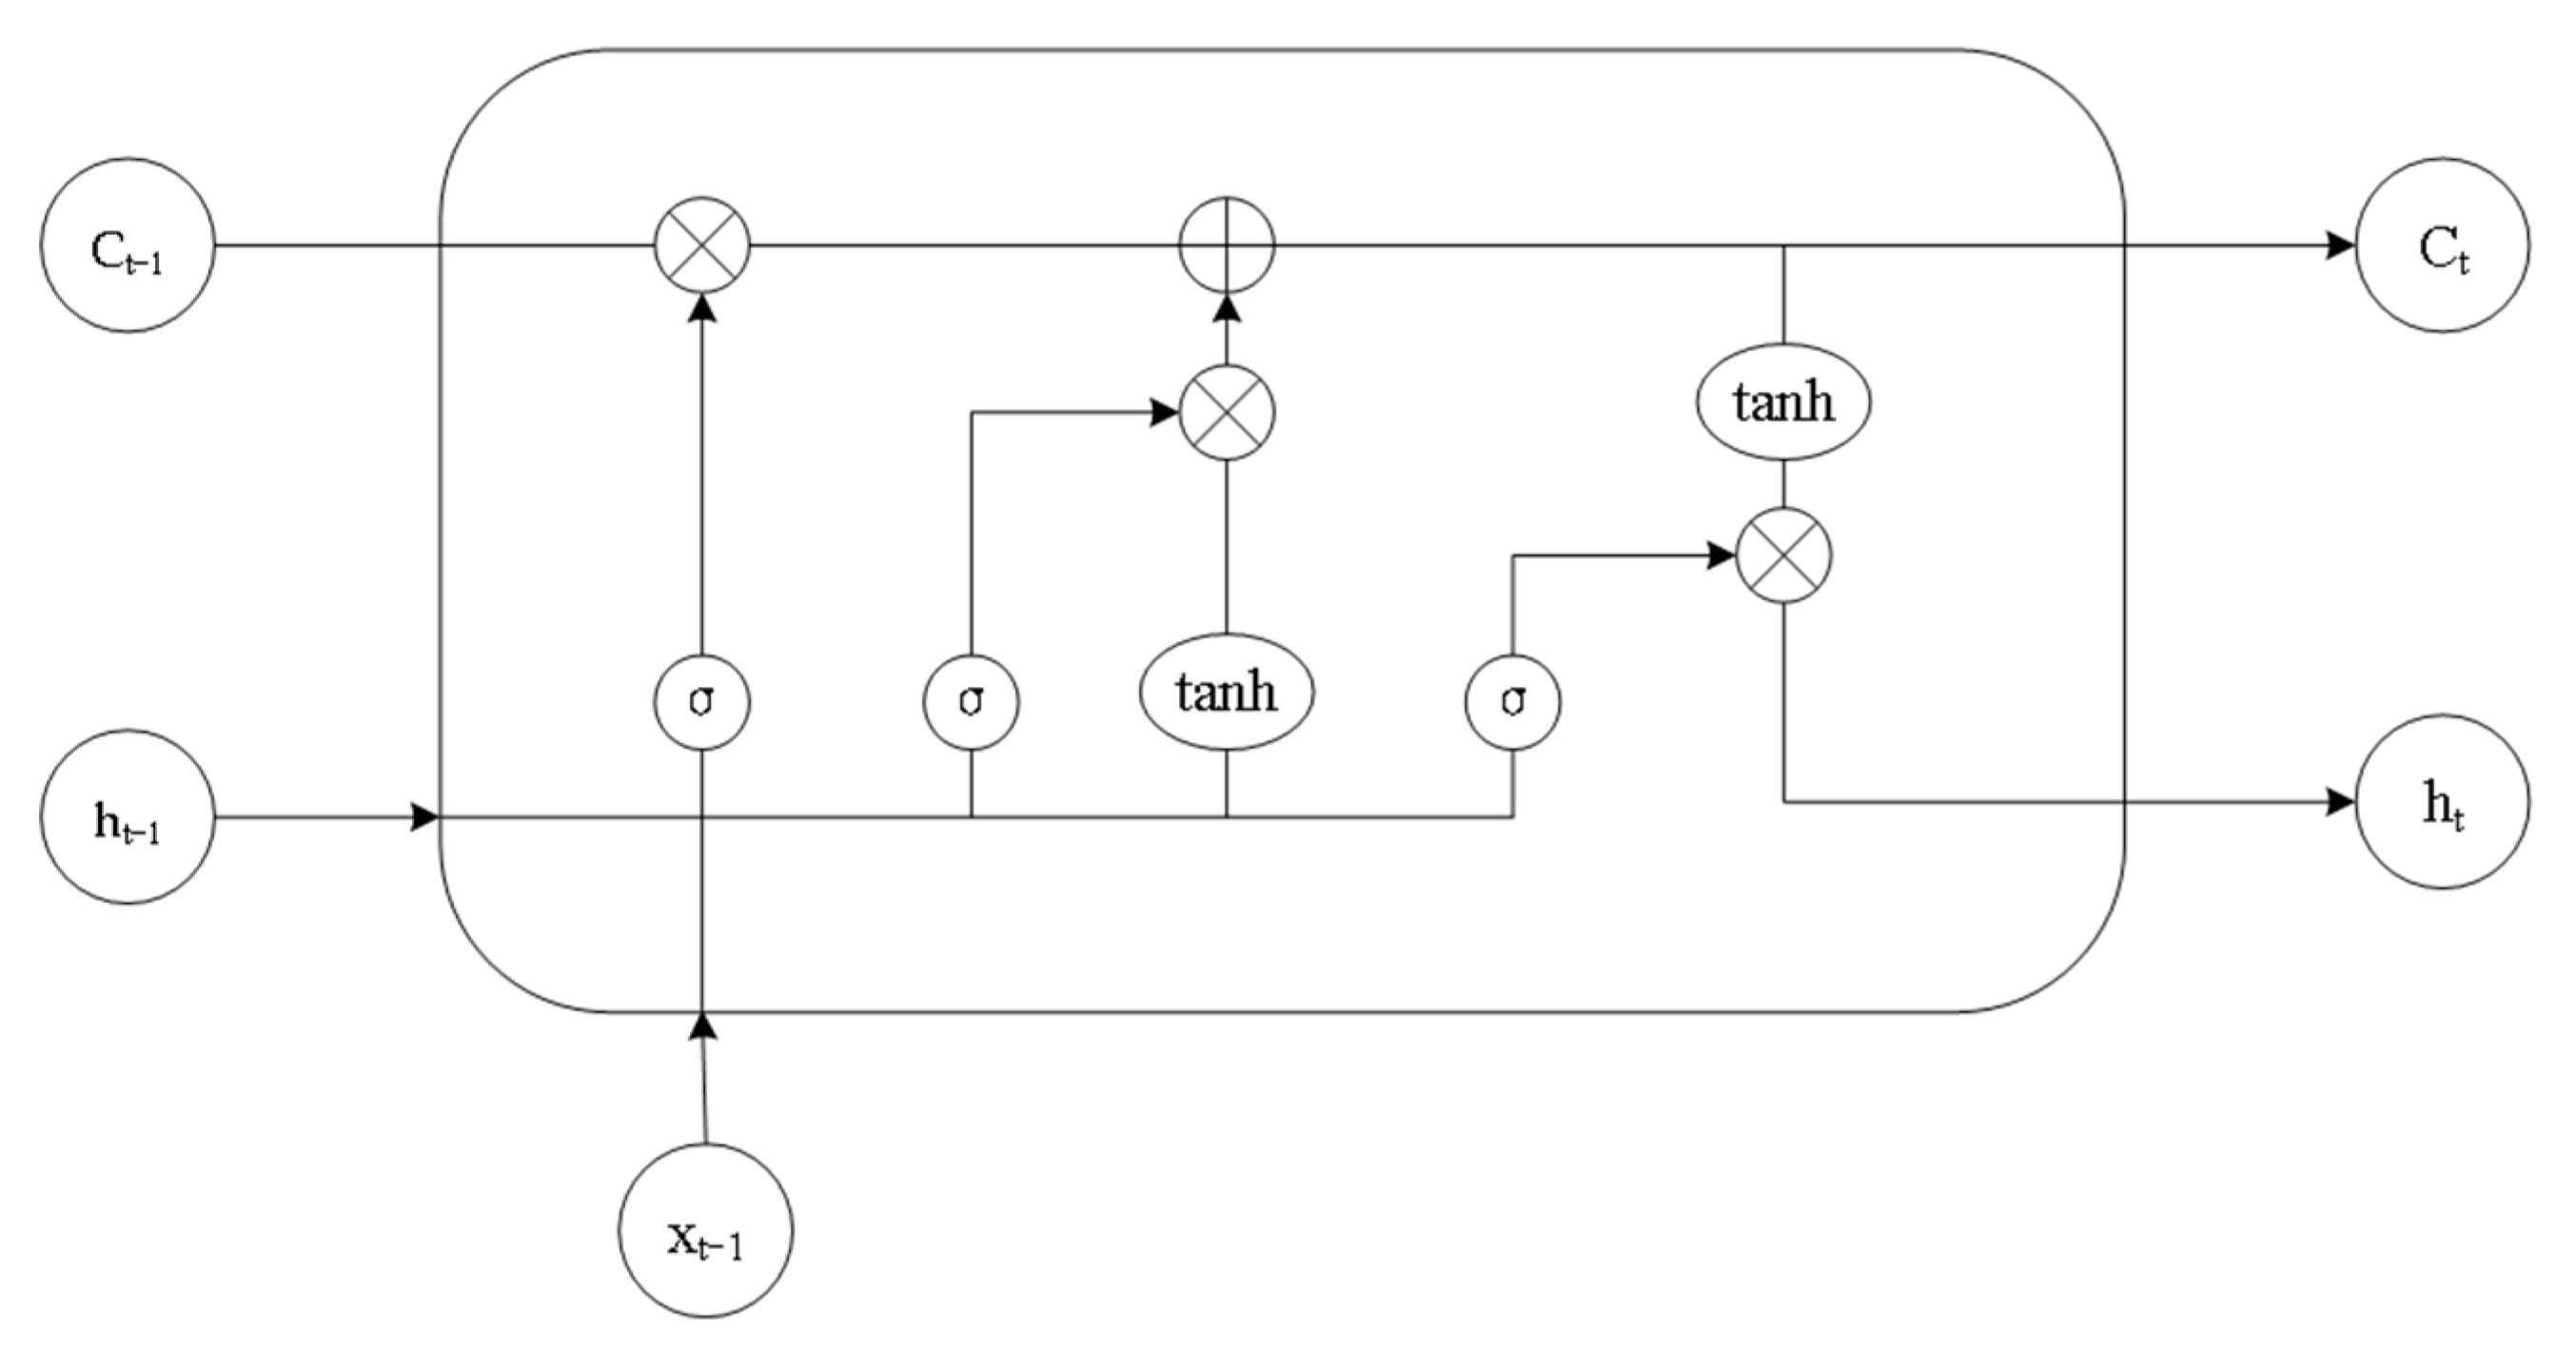
2.3. Long Short-Term Memory Network

Long Short-Term Memory (LSTM), a prominent architecture for neural systems, is designed to capture long-term dependencies in time series data. It achieves this by integrating sophisticated gating mechanisms, namely the forget gate, input gate, and output gate, which collaboratively regulate the flow of information. Through the utilization of these gates, LSTM has a remarkable ability to retain long-term memory within time series data. Moreover, it effectively mitigates the critical issues of gradient disappearance and gradient explosion that commonly occur during the back-propagation process, thereby enhancing the stability and performance of the model in handling sequential data [23].
While LSTM demonstrates strong capabilities in time-series forecasting, its performance can be influenced by certain factors. For instance, due to its reliance on complex gating mechanisms, LSTM models may require considerable computational resources, especially when handling large-scale datasets. Furthermore, the model’s predictive accuracy is sensitive to hyperparameter tuning, necessitating careful optimization to achieve the best results.
LSTM also describes a cell state for storing information. Figure 1 shows the LSTM’s hidden layer cell structure. Equations (9)–(13) provide an illustration of its forward determining technique:
(1) The forget gate functions to determine the information that it is necessary to forget [24,25].
f t = σ W f h t 1 , x t + b f
where f t is the forget gate, h t 1 is the previous output, x t is the input of the current cell, W f is the weight matrix of the forget gate, σ is sigmoid function, and b f is the deviation term.
(2) The input gate is in charge of choosing which fresh data will be kept in the cell state.
i t = σ W i h t 1 , x t + b i
C t = tanh W c h t 1 , x t + b c
where i t is the input gate, σ is sigmoid function, C t is cell state, tanh is hyperbolic tangent activation function, W i and W c are the weight matrix, and b i and b c are the deviation term.
(3) The output gate regulates the amount that data is released by the LSTM unit:
ο t = σ W ο h t 1 , x t + b ο
h t = ο t tanh C t
where ο t is the output gate, σ is sigmoid function, h t is the output value of the current unit, W ο is the weight matrix, b ο is the deviation term, and is the point multiplication of a vector.
Each of the above techniques has its own advantages and limitations when applied individually. To address these limitations, we propose an integrated VMD–SSA–LSTM model, which combines the decomposition capability of VMD, hyperparameter optimization of SSA, and deep learning-based forecasting strength of LSTM. This hybrid approach enhances feature extraction, model robustness, and predictive accuracy, making it suited for handling the high volatility in lithium carbonate prices.

3. VMD–SSA–LSTM Combination Model

3.1. Data Sources and Indicators

This study used applicable information from the Chinese lithium battery industrial chain, which ran from 2 January 2020 to 29 November 2024, as the research sample to guarantee the accuracy and timeliness of the data. The price of lithium carbonate, an important raw material in the lithium battery industry, is impacted by a number of factors. To precisely predict the price, this study chose the prices of lithium hydroxide, lithium iron phosphate, lithium manganese oxide, lithium hexafluorophosphate, the CSI 300 Index, and the Shanghai Composite Index as the factors influencing lithium carbonate prices, as presented in Table 1. After excluding samples that had missing values for the primary variables, the final datasets contained 1182 samples.
In this paper, the lithium battery industry chain, related material prices, and macro-environmental indicators are included in the range of factors to be considered, providing strong support for the comprehensive consideration of the changes in the price of lithium carbonate. These factors interact with each other and jointly determine the market price of lithium carbonate, as explained below:
(1)
Lithium hydroxide and lithium carbonate have certain correlations in terms of preparation processes and uses. The price connection mechanism between the two indicates that fluctuations in the price of lithium hydroxide may have an impact on the supply and demand relationship in the lithium carbonate market. In addition, as a part of the lithium battery materials, the price trend of lithium hydroxide reflects the overall cost changes in the entire lithium battery industry chain.
(2)
Lithium iron phosphate is a key cathode material for lithium batteries, and its demand has a direct impact on lithium carbonate prices. With the rapid growth of the new energy vehicle sector, demand for lithium iron phosphate has skyrocketed, driving up the price of lithium carbonate. However, fluctuations in the price of lithium iron phosphate may have an indirect impact on the lithium carbonate market. For example, if the price of lithium iron phosphate falls, this may lead to a decrease in demand for lithium carbonate, which affects its price.
(3)
As another cathode material for lithium batteries, changes in demand for lithium manganate will have an impact on market demand for lithium carbonate. The supply and demand situation, as well as the price trend of lithium manganate, can be used as an important reference indicator of the lithium carbonate market, particularly in the context of the diversified development of lithium battery materials. Due to its low cost, lithium manganate is primarily used in low-end markets such as power tools and electric bicycles; if demand in these areas surges, the price of lithium carbonate will be lowered.
(4)
Lithium hexafluorophosphate is an important component of lithium battery electrolytes, and supply and demand fluctuations have a direct impact on lithium battery production costs. The rising price of lithium hexafluorophosphate will put more pricing pressure on lithium battery producers, perhaps increasing demand for lithium carbonate. In contrast, a drop in the price of lithium hexafluorophosphate may relieve cost pressure on lithium battery makers, hence inhibiting the lithium carbonate market.
(5)
The stock market’s performance regularly reflects investors’ forecasts for future economy and industry. The movements of the CSI 300 Index and the Shanghai Composite Index can be utilized to assess macroeconomic conditions and market confidence, which can have an indirect impact on lithium carbonate prices. When the macro-environment is performing well, investors may be more willing to invest in lithium battery-related industries, thus pushing up the demand for and price of lithium carbonate.

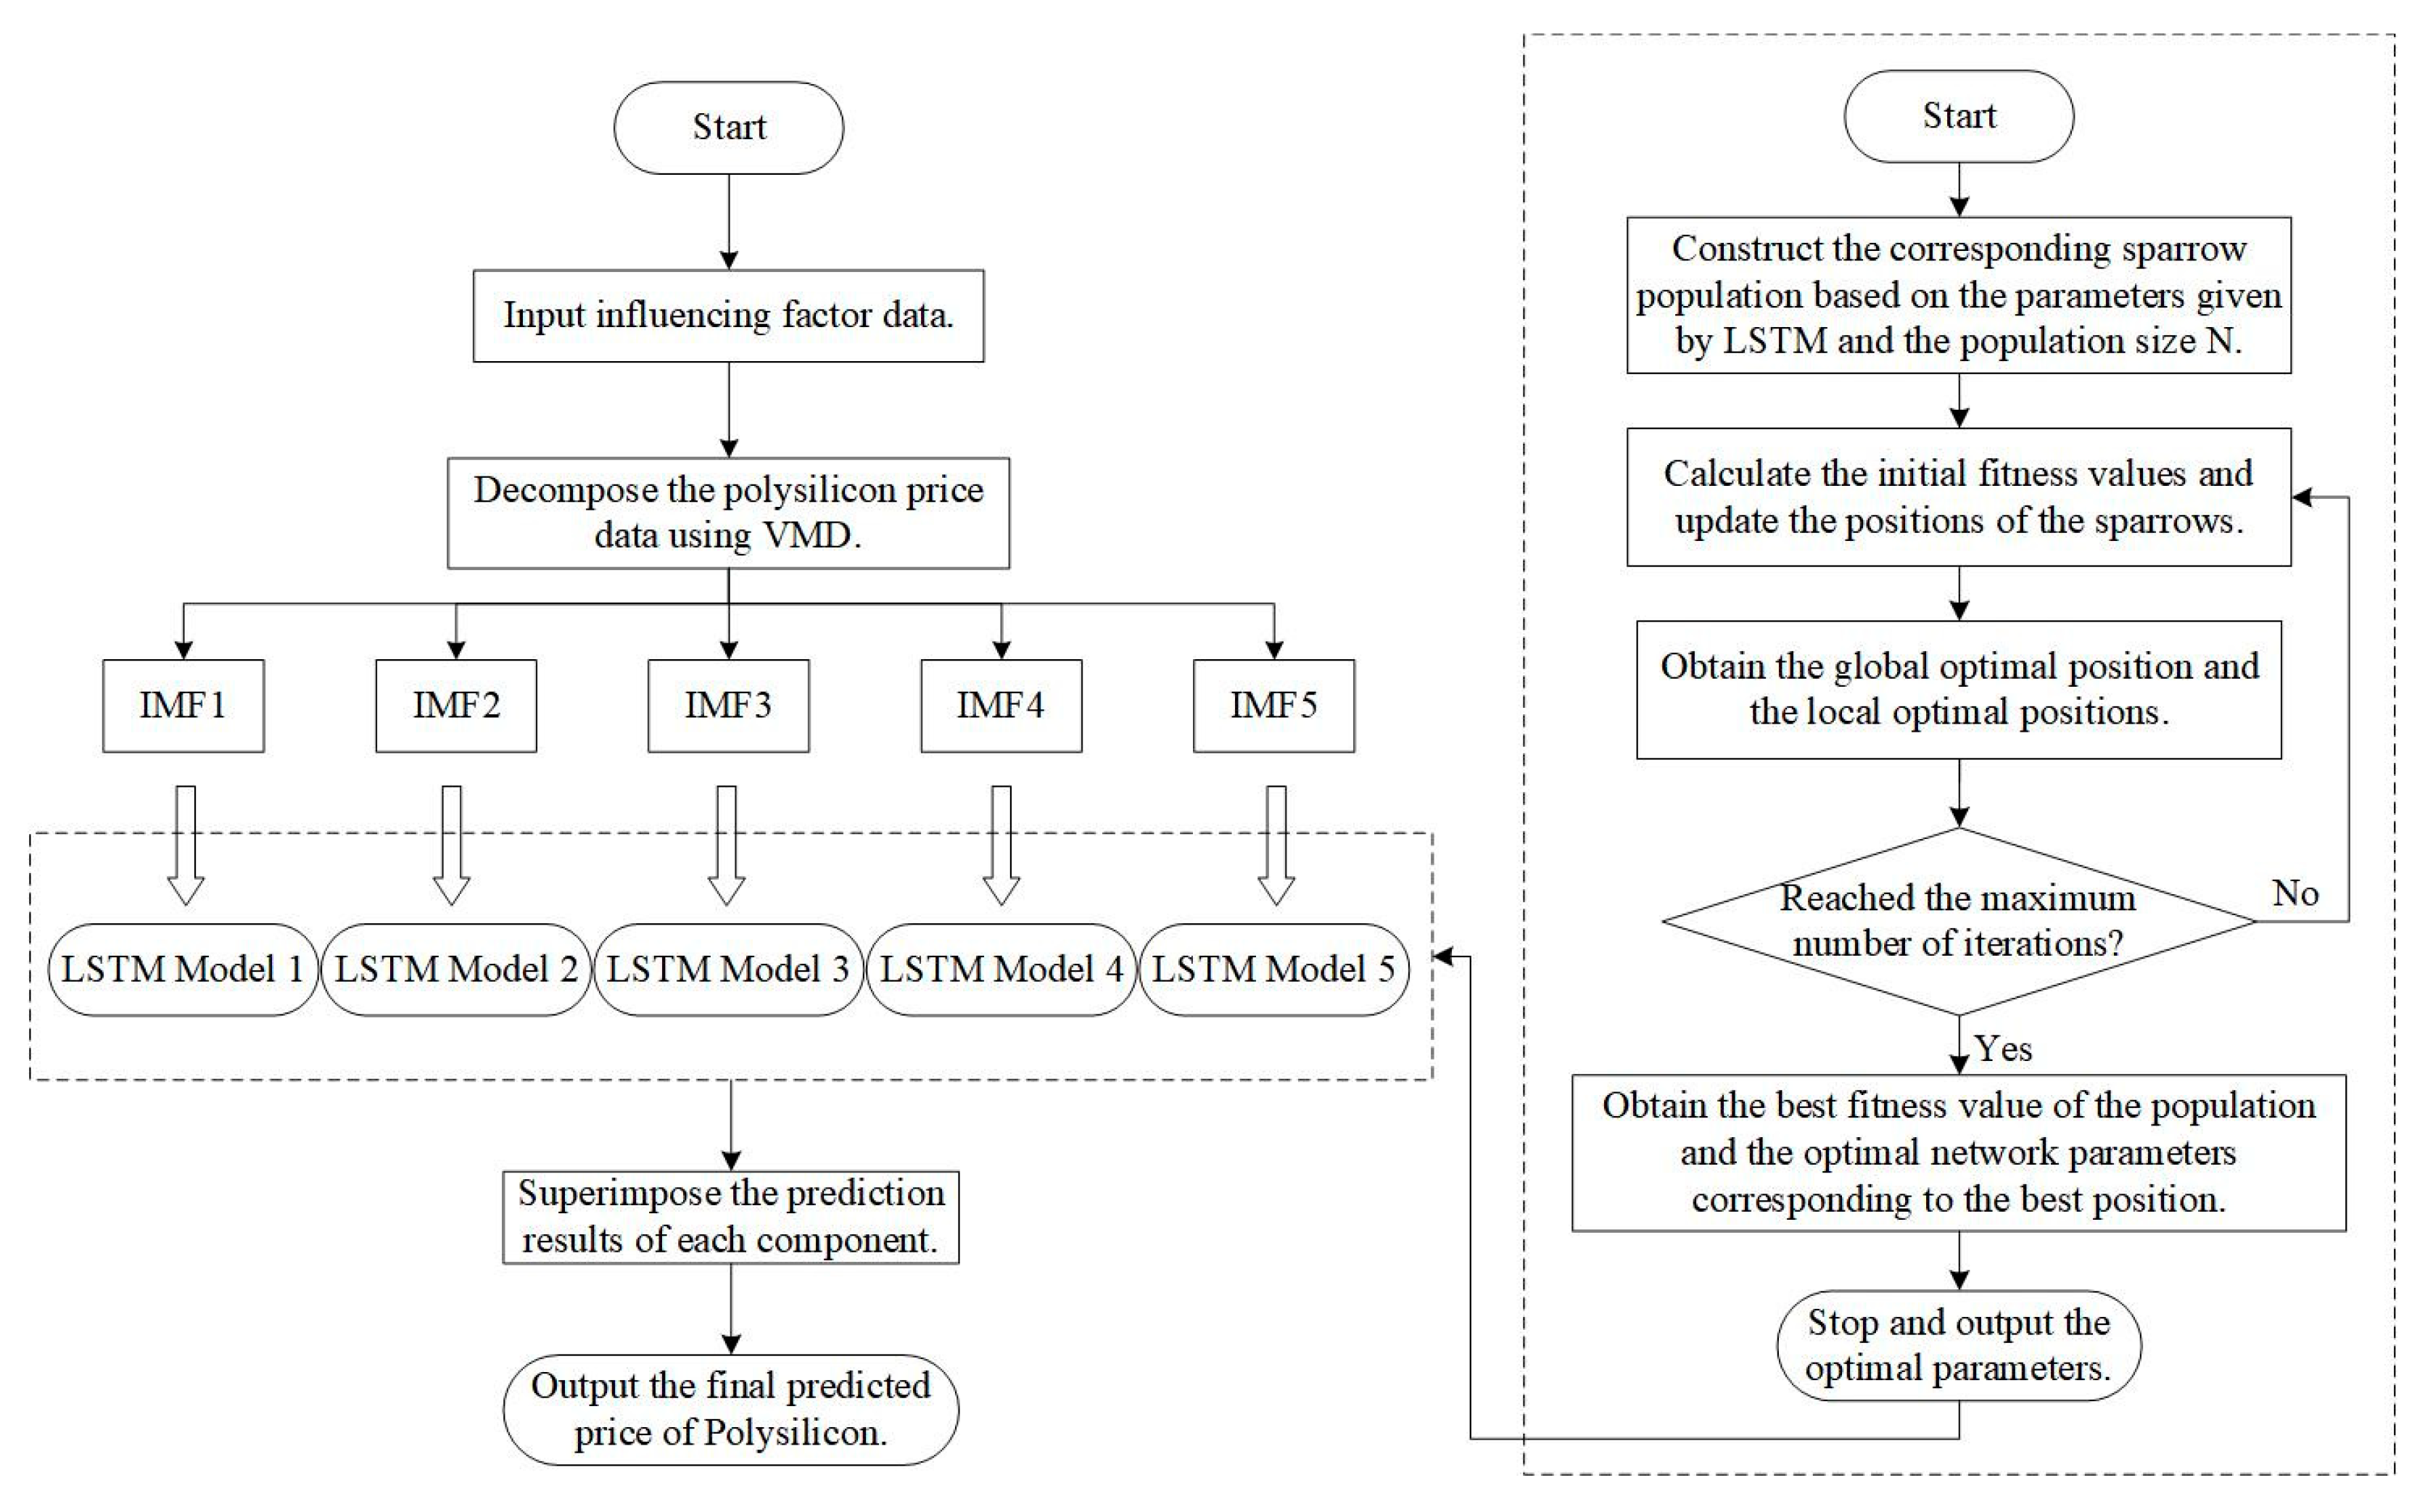
3.2. The Process of Combination Model

To systematically predict lithium carbonate prices, this study constructed a VMD–SSA–LSTM hybrid model, which integrates data decomposition, feature extraction, and parameter optimization to enhance prediction accuracy. The process of the combined model proposed in this paper is shown in Figure 2 and the framework consists of five key steps:
(1)
The model considers seven influencing factors, including lithium hydroxide price, lithium iron phosphate price, lithium manganese oxide price, lithium hexafluorophosphate price, CSI 300 Index, Shanghai Composite Index, and historical lithium carbonate prices. The output variable is the predicted lithium carbonate price. Before modeling, the dataset is divided into training (70%) and validation (30%) sets, and all data are normalized to ensure consistency.
(2)
Since lithium carbonate prices exhibit high volatility and non-stationarity, VMD (Variational Mode Decomposition) is applied only to lithium carbonate price data to decompose them into multiple Intrinsic Mode Functions (IMFs), which helps to extract key frequency components and reduce noise.
(3)
The input value of LSTM stores the data of the first m lithium carbonate prices and the first (m + 1) influencing factors, while the output value outputs the predicted value of the lithium carbonate price at the (m − 1)-th moment.
(4)
Optimization parameters, such as the number of sparrows in the population N and the boundary constraints for the circumstances to be improved, are set in the LSTM. Using the information given from the LSTM, the SSA constructs a matching sparrow population and calculates its ideal fitness value and position.
(5)
The parameter data from the SSA are used to determine the three optimal parameters for the LSTM model. The LSTM prediction model is reconstructed according to these optimal parameters. Next, the projected lithium carbonate prices are renormalized to generate the prediction curve.

3.3. Evaluation Index of Combination Model

This study evaluates prediction model accuracy using Mean Absolute Error (MAE), Root Mean Squared Error (RMSE), Mean Absolute Percentage Error (MAPE), and R-squared (R2) [26].
Mean Absolute Error (MAE) measures the average magnitude of errors in predictions, providing a clear indication of the model’s predictive accuracy. Smaller MAE values indicate fewer deviations between the predicted and actual values, thus reflecting a more accurate model. Root Mean Squared Error (RMSE) penalizes larger errors more heavily by squaring the residuals before averaging. It is sensitive to outliers, making it useful for highlighting large prediction errors. Lower RMSE values indicate better overall model performance. Mean Absolute Percentage Error (MAPE) expresses the prediction error as a percentage, offering an easily interpretable metric, which is particularly useful when comparing models across different scales. Smaller MAPE values indicate higher relative accuracy in predictions. R-squared (R2) indicates the proportion of variance in the target variable explained by the model. An R2 value closer to 1 denotes a higher degree of fit, suggesting the model explains most of the variability in the data.
While an R2 value nearer 1 denotes a higher degree of fit, smaller values of MAE, RMSE, and MAPE imply more accurate model prediction.
M A E = t = 1 N f t y t N
R M S E = t = 1 N f t y t 2 N
M A P E = t = 1 N f t y t y t N × 100 %
R 2 = 1 t = 1 N y t f t 2 t = 1 N y t y ¯ 2
For these equations, y t is the genuine value of lithium carbonate prices; f t indicates the price predictions for lithium carbonate materials; y ¯ stands for the average value of lithium carbonate prices; N shows the quantity of samples in the test datasets.

4. Analysis of Lithium Carbonate Price Prediction in China

4.1. Descriptive Statistical Analysis

Table 2 presents the descriptive statistics of the relevant variables. The mean and standard deviation of lithium carbonate and lithium hydroxide are large, indicating high price volatility, and the minimum and maximum prices of the two are very close to each other, so there may be some market linkage. The skewness of most of the variables is close to positive (>0), indicating that these data have a slight rightward bias, i.e., longer tails. The skewness of the SSE Composite Index is −0.06, which is close to a symmetric distribution. The kurtosis of all variables is close to 3, indicating that they are close to the thickness of the tails of the normal distribution, with lithium hexafluorophosphate prices and lithium manganate prices having relatively high kurtosis.
Subsequently, the Phillips–Perron test was employed to examine the stability of lithium carbonate prices. The calculated p-value was 0.8580, substantially greater than the significance level of 0.05. Thus, the null hypothesis could not be rejected. The results suggest potential non-stationarity in the lithium carbonate price data, indicating that statistical properties like the mean and variance may vary over time. This has crucial implications for the further analysis and modeling of lithium carbonate price trends.

4.2. Variational Mode Decomposition

The VMD approach was used to break down the data because of the volatility and unpredictability of lithium carbonate price data. The selection of decomposition modes has a considerable impact on the VMD outcomes. In light of this, the ideal number of decomposition modes was obtained using the central frequency approach, yielding K = 5 [27]. The choice of K = 5 in VMD was based on the volatility and non-stationary nature of lithium carbonate price data. To determine the optimal number of decomposition modes, the central frequency approach was used. This method involves gradually increasing K and analyzing whether the extracted modes have stable and meaningful frequency distributions. If K is too small, different frequency components may mix, leading to incomplete decomposition. Conversely, if K is too large, redundant modes may appear, introducing noise rather than useful information. Through experimental validation, K = 5 was found to achieve a balance between preserving key information and avoiding excessive decomposition. This selection ensures that VMD effectively captures both short-term fluctuations and long-term trends, ultimately improving the predictive performance of the model. Other parameters have the following numerical settings: penalty factor α = 2500 ; noise tolerance t a u = 0 ; D C = 0 ; and convergence precision t o l = 10 7 .
In this research, a total of 1182 pieces of price data, with empty data removed, were decomposed into five Intrinsic Mode Function (IMF) components. The IMF components resulting from the decomposition of the price data from the 1st to the 1000th trading days are depicted in Figure 3. Among them, the first row represents the original sequence signal and rows 2–6 represent the IMF components (IMF1 to IMF5) decomposed by VMD, arranged from low frequency to high frequency. Each IMF component retains the characteristics of the original lithium carbonate price signal while avoiding modal aliasing effects.
The sample datasets were processed to improve convergence speed and prediction accuracy, minimize the impact of anomalous data on predictions, and prevent notable numerical disparities among features. This also expedites the LSTM prediction model’s training process. Thus, normalization was used to scale the data to a range of (0, 1) for both the lithium carbonate price datasets and the impacting factors. The following equation provides the calculation used for the normalization approach.
y t = x t min x t max x t min x t
In the equation, y t is the normalized result of a given dataset, x t indicates the given initial data, and min x and max x stand for the minimum and maximum values in the sample, respectively.

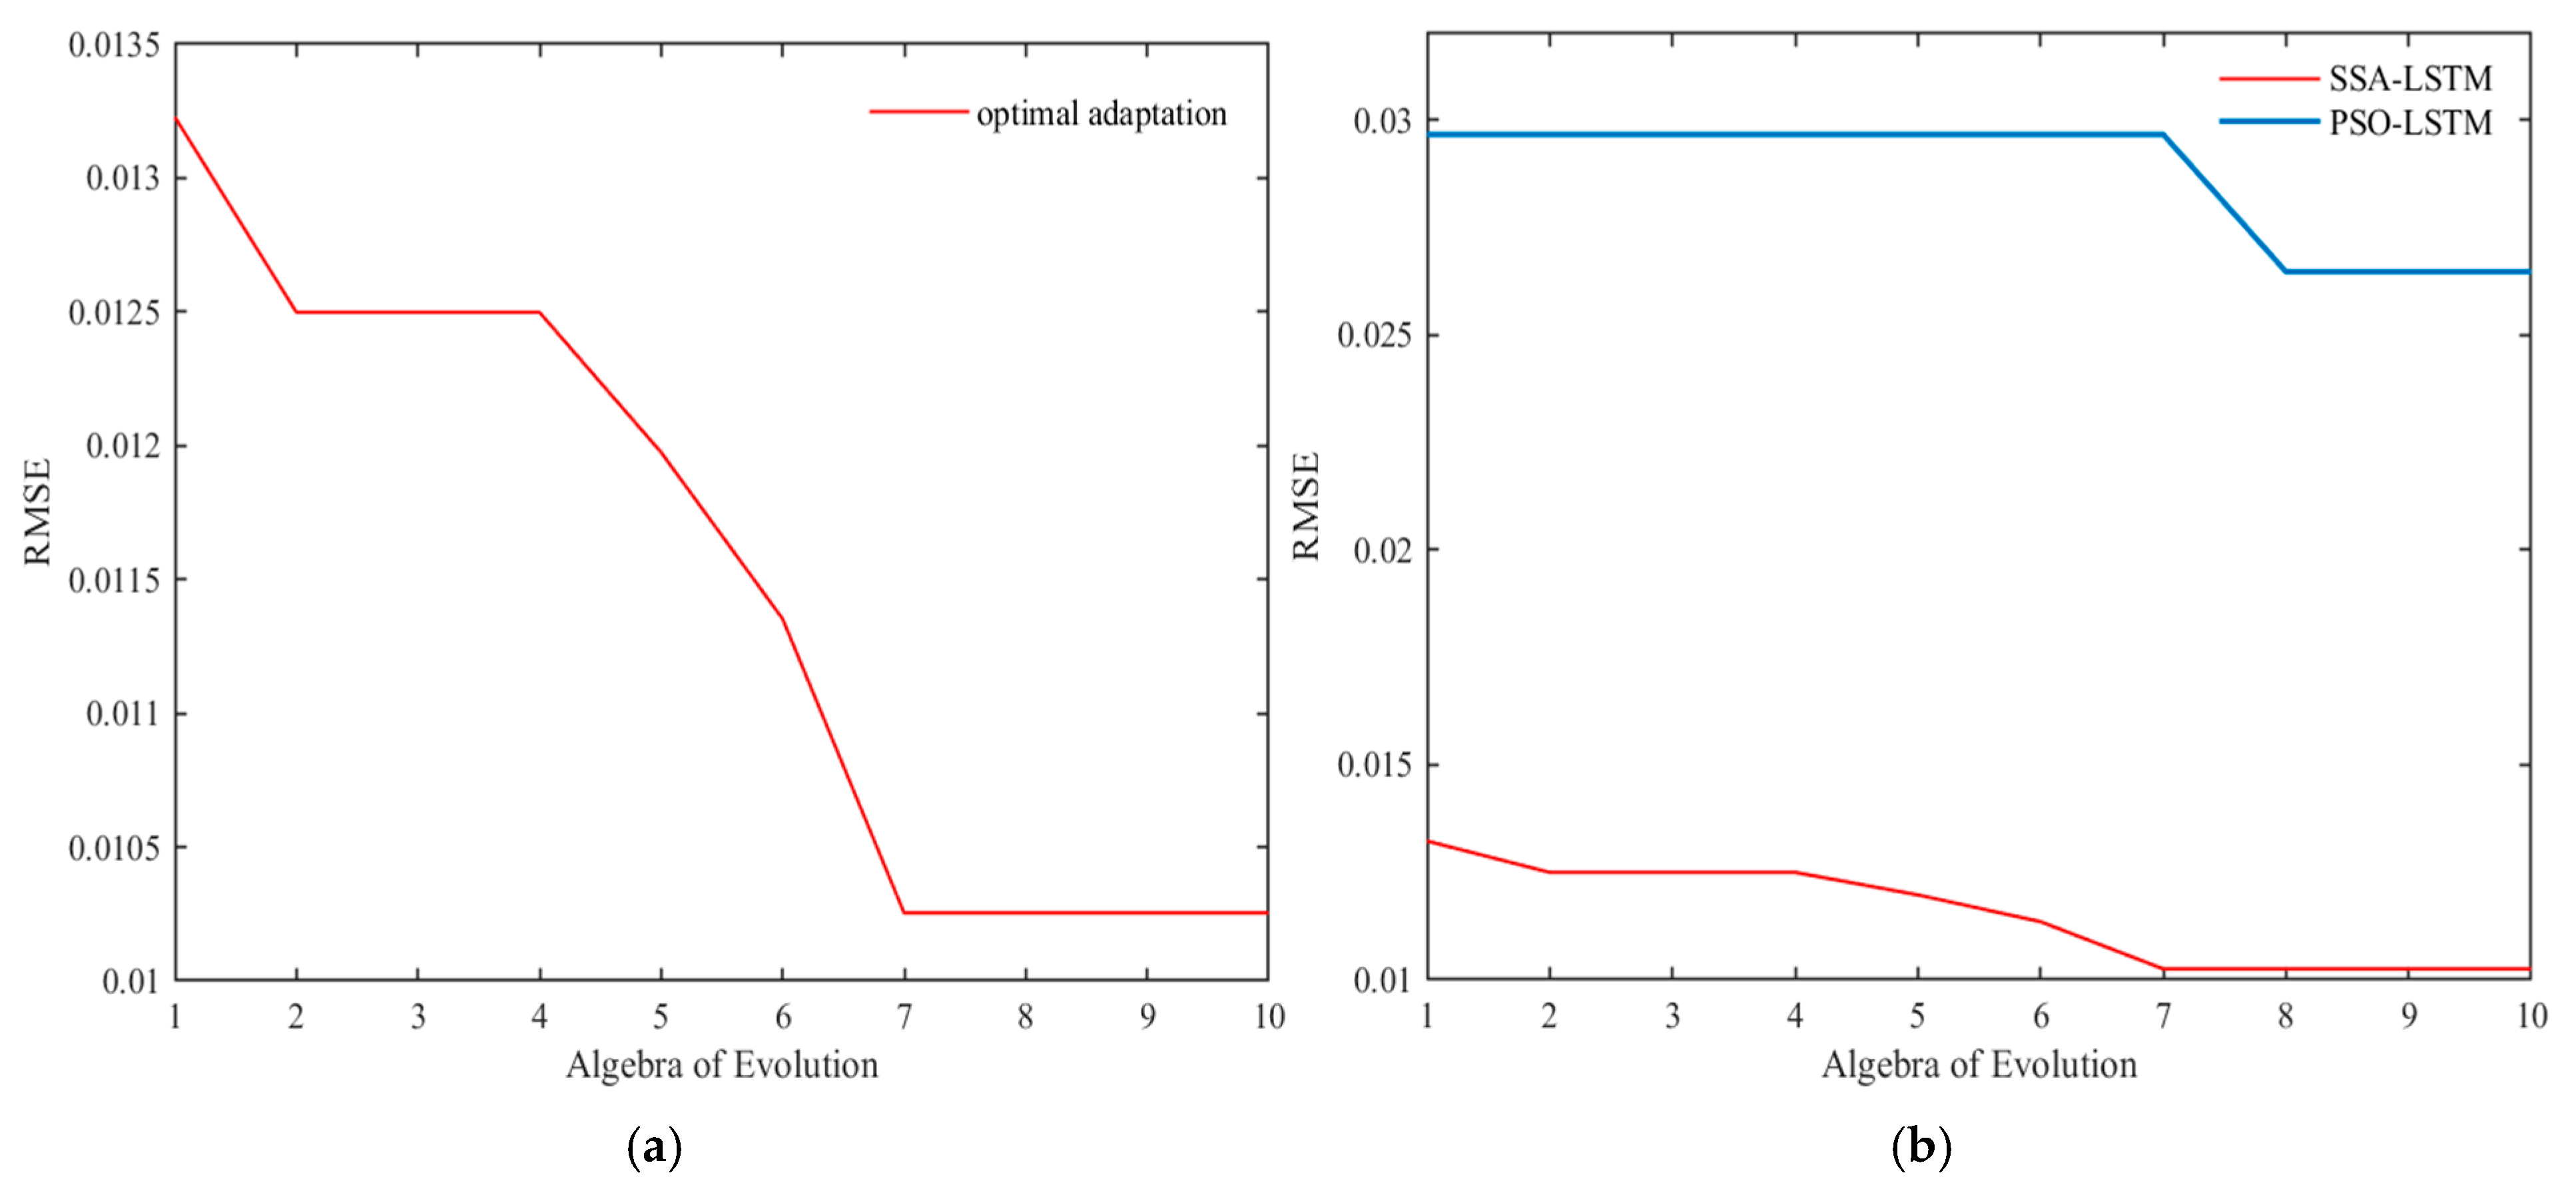
4.3. Parameter Optimization of LSTM

To enhance the model’s expressive capability, activation functions were used to introduce nonlinear factors. The combination model consists of an input layer, LSTM layer, ReLU activation layer, and a formula output layer. To reduce the influence of subjective experience on the combination model, the SSA was employed to optimize three parameters: the number of neurons in the hidden layer, the number of iterations, and the learning rate. The LSTM network step size was set to 5, and upper and lower boundaries were established.
The hyperparameters of the LSTM model were carefully tuned to balance underfitting and overfitting. The number of hidden layer neurons was set to between 50 and 300, as values below 50 led to underfitting, while values exceeding 300 caused overfitting. The iteration count ranged from 50 to 300, considering that excessive iterations increased weight updates, leading to overfitting, whereas too few iterations reduced prediction accuracy. The learning rate was selected to range from 0.001 to 0.01, as a higher rate risked gradient explosion, while a lower rate slowed convergence.
Activation functions were utilized to inject nonlinear elements into the model in order to improve its expressiveness. A suitable optimization algorithm must be used in order to increase the prediction accuracy and create a more accurate prediction model. The three network parameters were optimized through the application of the SSA and the PSO algorithm. The comparison of the fitness and the number of iterations of the two algorithms is shown in Figure 4. As depicted in Figure 4a, the fitness value of the PSO–LSTM model was 0.026, whereas that of the SSA–LSTM model was 0.010. Compared with the PSO optimization algorithm, the SSA optimization showed a stronger optimization ability in the iteration, which shows that the SSA can play a better role in parameter optimization. Therefore, this paper adopted the SSA optimization, which is more suitable for LSTM parameter optimization. The process by which SSA optimizes the LSTM is shown in Figure 4b, and the optimal parameters of the LSTM optimized by the SSA are 103 hidden-layer neurons, 300 iterations, and a learning rate of 0.001.
Subsequently, the LSTM network was be fitted with the optimal hyperparameters, and each component underwent modeling. To verify the reliability and prediction accuracy of the VMD–SSA–LSTM combination model constructed in this paper for predicting lithium carbonate prices, the dataset obtained after performing the Variational Mode Decomposition (VMD) on the lithium carbonate price data was used as the sample dataset. The training sample set was the first 70% of this dataset, which spans roughly 827 trade days between 2 January 2020, and 1 June 2023. The remaining 30% served as the testing sample set, covering roughly 355 trading days between 2 June 2023 to 29 November 2024. This experiment examined the prediction of the sample dataset using the LSTM, VMD–LSTM, and VMD–SSA–LSTM models. Figure 5 shows a comparison of the variations between the actual and anticipated values for each of the three models. It is evident that the single LSTM network fluctuates between [−2.5, 0.6] for the complex lithium carbonate prices when forecasting the 355 lithium carbonate price data in the testing set. The VMD–SSA–LSTM model, on the other hand, shows prediction errors that vary between [−0.5, 2], indicating reduced prediction errors and better stability.
Figure 6 depicts the results of lithium carbonate material price predictions, where Figure 6a shows the results of the models in the training set, and the results of the testing set are shown in Figure 6b. It can be observed that the overall price of lithium carbonate fluctuates greatly during the trading days from 2020 to 2024, and the price shows an obvious downward trend during 2023, from 509,700 CNY/tonne at the beginning of the year to 96,900 CNY/tonne at the end of the year. The price of lithium carbonate fluctuated slightly in 2024 and finally fell to 78,200 CNY/tonne. The single LSTM network fits the target curve the worst overall, especially when the price of lithium carbonate fluctuated greatly. However, the model in this paper fitted the actual prices more accurately.
In order to further verify the effectiveness and stability of the model in this paper, four evaluation indicators were introduced to assess the performance of the model. Table 3 shows the performance index of the models.
The VMD–SSA–LSTM combination model exhibited the best performance in the training set, as indicated by Table 3. In particular, the performance measures demonstrate that, in comparison to the single LSTM model, this approach increased the R2 by 0.0030 and decreased the MAE by 0.1940, the RMSE by 0.3249, and the MAPE by 0.5248 percentage points. This suggests that, in comparison to predictions produced without data decomposition, the model’s prediction accuracy is higher with VMD. The VMD technique helps to decompose the original complex time series data into several relatively simple and more regular sub-components, which might help the model to better understand and model the data structure.
In addition, the MAE decreased by 0.1692, the RMSE by 0.3053, and the MAPE by 0.7927 percentage points, and the R2 increased by 0.0028, in comparison to the VMD–LSTM prediction technique. This further illustrates that the VMD–SSA–LSTM combination model shows great promise in the field of lithium carbonate price prediction, leveraging the strengths of data decomposition, parameter optimization, and neural network modeling. It effectively reduces prediction errors and enhances the model’s ability to capture the underlying patterns in the data, indicating its potential for practical applications in the complex and dynamic market environment of lithium carbonate pricing.

4.4. Further Analysis

According to the results obtained from the above research, and combined with the current reality of the development of China’s lithium carbonate industry, this paper further analyzes how to predict the price of lithium carbonate in 2025:
(1)
Use the supply of lithium resources to further predict the price of lithium carbonate in 2025. The above analysis verified the advantages of this paper’s model in predicting the price of lithium carbonate. This paper predicts the trends in lithium carbonate price changes based on the above model and, combined with the current supply of lithium resources in the world, the situation can be further analyzed and the following information can be obtained: First, the world’s lithium resource reserves and supply is sufficient. In 2024, the world’s total supply of lithium resources is expected to be 1.33 million tonnes, the world’s total demand is expected to be 1.15 million tonnes; the world’s supply of lithium resources exceeds the demand for 180,000 tonnes. This will inevitably lead to a further decline in the price of lithium carbonate raw materials in 2025, which, in turn, will trigger a sustained decline in the price of lithium carbonate. Secondly, China’s lithium resources supply chain is complete. China is currently the world’s largest new energy vehicle market, and also has built a complete lithium resources supply chain system. This will effectively guarantee the effective supply of lithium resources and protect it against the impact of the external uncertainty environment. This further supports the idea that the price of lithium carbonate will generally be lower in 2025. These analyses also further illustrate the robustness of the forecast model presented above.
(2)
The price of lithium carbonate in 2025 can be further predicted based on cognitive biases under the effect of information asymmetry. In the process of constructing the above prediction model, it was found that the fluctuations in lithium carbonate prices are not only the result of the internal and external environment, but also a comprehensive reflection of the cognitive biases of different market participants. This indicates that the accurate prediction of lithium carbonate prices needs to be further analyzed in combination with the cognitive biases of different market participants. A specific analysis can be made of the information asymmetry caused by different market participants’ cognitive biases. Due to the development trend of the lithium carbonate industry and the fluctuations in the trading price, there is a large amount of information asymmetry. On the one hand, the industry’s market participants that make investment decisions, being misled by the past benefits of the rich historical market information that is available, may choose to continue to increase their investment, leading to the release of excessive production capacity. On the other hand, when the lithium carbonate industry suffers short-term losses, market participants’ decisions will also be based on their inherent empirical judgment; they may insist that the losses are short-lived adjustments, and that there will still be better investment returns later on. This would lead to a high lithium carbonate production capacity, resulting in the entire lithium carbonate industry being caught in a capacity trap from which it cannot extricate itself. This further indicates that the price of lithium carbonate in 2025 will not only show an overall low trend, but also may face more frequent fluctuations in the adjustment period.
(3)
The theory of herd behavior can be used to further predict the price of lithium carbonate in 2025. At present, although the lithium carbonate industry has been in a booming stage of development, investors outside the industry are still affected by herd behavior and blindly enter the lithium carbonate industry. Specific analysis shows that first, investors outside the lithium carbonate industry look at the development of new energy industry and believe it will bring huge dividends, choosing a swarm into this industry. This behavior is typical herd behavior. This suggests that investors outside the lithium carbonate industry not only lack the ability to think independently but also rely excessively on the decisions of others. Secondly, under the influence of information asymmetry, these investors ignore in-depth studies of the market and investment targets and, furthermore, ignore their own core business and risk control measures. This leads to a lack of scientific and rational investment decisions by investors outside the lithium carbonate industry, who instead blindly enter the lithium carbonate industry. As a result, due to the effects of herd behavior, the price of lithium carbonate in 2025 will be excessively volatile, further deviating from its true value and increasing the risk and uncertainty of the market. More seriously, under the continuous aggregation of herd behavior, there will be over-investment and investment mistakes in lithium carbonate enterprises, which will bring severe investment risks and financial difficulties.

5. Conclusions

To improve the stability and accuracy of lithium carbonate price prediction, this study examined the features of Chinese lithium carbonate prices. Through the incorporation of the Variational Mode Decomposition (VMD) and the Sparrow Search Algorithm (SSA) method into the Long Short-Term Memory (LSTM) model, we constructed the VMD–SSA–LSTM combination model, which enables a higher accuracy to be obtained when forecasting lithium carbonate prices in China. The primary findings from the research presented in this paper are outlined below:
(1) The VMD–SSA–LSTM combination model not only comprehensively considers various factors affecting lithium carbonate prices but also fully accounts for their intrinsic association with time series data. (2) By using the VMD algorithm to decompose the time series and effectively extract components at different frequencies, combined with the SSA for global parameter optimization of the LSTM model, the VMD–SSA–LSTM combination model effectively integrates the frequency and temporal characteristics of time series data, enabling a holistic consideration of multidimensional data features. (3) On the lithium carbonate pricing datasets, the VMD–SSA–LSTM model performs better in terms of prediction than both the VMD–LSTM model and the traditional LSTM model. The model significantly enhances the convergence accuracy. This enables the model to adapt more quickly and effectively to new data and market dynamics, with a stronger generalization ability and adaptability.
This study provides valuable insights for price decision-making in the lithium carbonate industry. While the research primarily concentrates on the data properties of the Chinese lithium carbonate market, significant heterogeneity exists among lithium carbonate markets in different countries and regions due to differences in policy environments, resource endowments, and industrial structures. Moreover, the global lithium carbonate market has formed close interconnections through trade and industrial chain links. In this context, price fluctuations in any region not only reflect local market characteristics but may also impact other regions through supply chains or demand-side channels. The next phase of this research will focus on the global lithium carbonate market. Through the extensive collection of data from major markets and an analysis of the price transmission mechanisms and the linkages between different regional markets, we can construct a more globally oriented prediction model. This will provide industry participants with decision-making references that are more aligned with actual market dynamics, thereby promoting the sustainable development of the lithium carbonate market. At the same time, in-depth research will be conducted on the types of cognitive biases of Chinese entrepreneurs and their impact on investment decisions regarding lithium carbonate price forecasts. This will provide a decision-making reference for preventing excessive price fluctuations in the lithium carbonate market and ensuring the normal operation of lithium carbonate enterprises.

Author Contributions

H.L.: conceptualization and methodology. W.W. and L.J.: writing—original draft preparation and analysis. L.W.: calculation and supervision. W.W., H.L., L.J., and L.W.: contributed equally to this work. They are co-first authors. All authors have read and agreed to the published version of the manuscript.

Funding

This research is supported by Key Program of International Cooperation and Exchange of National Natural Science Foundation of China (W2411065), National Natural Science Foundation of China (No. 71971111) and Jiangsu Province’s Youth Science and Technology Talent Support Project (JSTJ-2024-438).

Data Availability Statement

The raw data supporting the conclusions of this article will be made available by the authors on request.

Acknowledgments

Thank you to the reviewers for providing insightful feedback, which greatly benefited us.

Conflicts of Interest

The authors declare that they have no competing interests.

References

  1. Peng, Z.; Yin, T.; Zhu, X.; Lu, X.; Li, X. Hybrid price prediction method combining TCN-BiGRU and attention mechanism for battery-grade lithium carbonate. Kybernetes 2024. [Google Scholar] [CrossRef]
  2. Pan, Z.; Guo, J. External Uncertainty and Raw Material Price in Energy Transition: Implications for Green. Renew. Energy 2025, 241, 122354. [Google Scholar] [CrossRef]
  3. Zhao, Z.; Zhang, W.; Cui, K.; Jin, S.; Liu, K.; Yang, S.; Lai, Y.; Chang, X. Multistage gradient crystallization study towards lithium carbonate crystal growth. Sep. Purif. Technol. 2025, 360, 130955. [Google Scholar] [CrossRef]
  4. Ebensperger, A.; Maxwell, P.; Moscoso, C. The lithium industry: Its recent evolution and future prospects. Resour. Policy 2005, 30, 218–231. [Google Scholar] [CrossRef]
  5. Ambrose, H.; Kendall, A. Understanding the future of lithium: Part 1, resource model. J. Ind. Ecol. 2020, 24, 80–89. [Google Scholar] [CrossRef]
  6. Bajolle, H.; Lagadic, M.; Louvet, N. The future of lithium-ion batteries: Exploring expert conceptions, market trends, and price scenarios. Energy Res. Soc. Sci. 2022, 93, 102850. [Google Scholar] [CrossRef]
  7. Zhang, X.; Chang, H.L.; Su, C.W.; Qin, M.; Umar, M. Exploring the dynamic interaction between geopolitical risks and lithium prices: A time-varying analysis. Resour. Policy 2024, 90, 104840. [Google Scholar] [CrossRef]
  8. Su, X.; Zhao, Y. Risk spillovers between Chinese new energy futures and carbon-intensive assets: Asymmetric effect, time–frequency dynamics, and portfolio strategies. North Am. J. Econ. Financ. 2025, 75, 102275. [Google Scholar] [CrossRef]
  9. Li, X.; Sengupta, T.; Mohammed, K.S.; Jamaani, F. Forecasting the lithium mineral resources prices in China: Evidence with Facebook Prophet (Fb-P) and Artificial Neural Networks (ANN) methods. Resour. Policy 2023, 82, 103580. [Google Scholar] [CrossRef]
  10. Sai, W.; Pan, Z.; Liu, S.; Jiao, Z.; Zhong, Z.; Miao, B.; Chan, S.H. Event-driven forecasting of wholesale electricity price and frequency regulation price using machine learning algorithms. Appl. Energy 2023, 352, 121989. [Google Scholar] [CrossRef]
  11. Ding, G.; Qin, L. Study on the prediction of stock price based on the associated network model of LSTM. Int. J. Mach. Learn. Cybern. 2020, 11, 1307–1317. [Google Scholar] [CrossRef]
  12. Jailani, N.L.M.; Dhanasegaran, J.K.; Alkawsi, G.; Alkahtani, A.A.; Phing, C.C.; Baashar, Y.; Capretz, L.F.; Al-Shetwi, A.Q.; Tiong, S.K. Investigating the power of LSTM-based models in solar energy forecasting. Processes 2023, 11, 1382. [Google Scholar] [CrossRef]
  13. Guo, F.; Deng, S.; Zheng, W.; Wen, A.; Du, J.; Huang, G.; Wang, R. Short-Term Electricity Price Forecasting Based on the Two-Layer VMD Decomposition Technique and SSA-LSTM. Energies 2022, 15, 8445. [Google Scholar] [CrossRef]
  14. Han, M.; Zhong, J.; Sang, P.; Liao, H.; Tan, A. A combined model incorporating improved SSA and LSTM algorithms for short-term load forecasting. Electronics 2022, 11, 1835. [Google Scholar] [CrossRef]
  15. Wang, K.; Fan, X.; Yang, X.; Zhou, Z. An AQI decomposition ensemble model based on SSA-LSTM using improved AMSSA-VMD decomposition reconstruction technique. Environ. Res. 2023, 232, 116365. [Google Scholar] [CrossRef]
  16. Wang, J.; Jiang, L.; Wang, L. Prediction of China’s Polysilicon Prices: A Combination Model Based on Variational Mode Decomposition, Sparrow Search Algorithm and Long Short-Term Memory. Mathematics 2024, 12, 3690. [Google Scholar] [CrossRef]
  17. Wang, J.; Zhang, D.; Huang, Q.; Cui, Z. Multiple-step accurate prediction of wave energy: A hybrid model based on quadratic decomposition, SSA and LSTM. Int. J. Green Energy 2025, 22, 100–123. [Google Scholar] [CrossRef]
  18. Dragomiretskiy, K.; Zosso, D. Variational mode decomposition. IEEE Trans. Signal Process. 2013, 62, 531–544. [Google Scholar] [CrossRef]
  19. Wu, J.; Hu, Y.; Wu, D.; Yang, Z. An aquatic product price forecast model using VMD-IBES-LSTM hybrid approach. Agriculture 2022, 12, 1185. [Google Scholar] [CrossRef]
  20. Liu, T.; Ma, X.; Li, S.; Zhang, C. A stock price prediction method based on meta-learning and variational mode decomposition. Knowl. Based Syst. 2022, 252, 109324. [Google Scholar] [CrossRef]
  21. Xue, J.; Shen, B. A novel swarm intelligence optimization approach: Sparrow search algorithm. Syst. Sci. Control Eng. 2020, 8, 22–34. [Google Scholar] [CrossRef]
  22. Awadallah, M.A.; Al-Betar, M.A.; Doush, I.A.; Makhadmeh, S.N.; Al-Naymat, G. Recent versions and applications of sparrow search algorithm. Arch. Comput. Methods Eng. 2023, 30, 2831–2858. [Google Scholar] [CrossRef] [PubMed]
  23. Hochreiter, S. Long Short-term Memory. In Neural Computation; MIT-Press: Cambridge, MA, USA, 1997. [Google Scholar]
  24. Bhandari, H.N.; Rimal, B.; Pokhrel, N.R.; Rimal, R.; Dahal, K.R.; Khatri, R.K. Predicting stock market index using LSTM. Mach. Learn. Appl. 2022, 9, 100320. [Google Scholar] [CrossRef]
  25. Wu, H.; Chen, S.; Ding, Y. Comparison of ARIMA and LSTM for Stock Price Prediction. Financ. Eng. Risk Manag. 2023, 6, 1–7. [Google Scholar]
  26. Mu, G.; Gao, N.; Wang, Y.; Dai, L. A stock price prediction model based on investor sentiment and optimized deep learning. IEEE Access 2023, 11, 51353–51367. [Google Scholar] [CrossRef]
  27. Liu, H.; Li, D.; Yuan, Y.; Zhang, S.; Zhao, H.; Deng, W. Fault diagnosis for a bearing rolling element using improved VMD and HT. Appl. Sci. 2019, 9, 1439. [Google Scholar] [CrossRef]
Figure 1. LSTM unit cell structure.
Mathematics 13 00613 g001
Figure 2. The operation flow chart of VMD–SSA–LSTM.
Mathematics 13 00613 g002
Figure 3. VMD of lithium carbonate price.
Mathematics 13 00613 g003
Figure 4. Optimization iterative process of SSA and PSO. (a) The convergence curves of LSTM optimized by SSA and PSO; (b) the convergence curve of the SSA–LSTM.
Mathematics 13 00613 g004
Figure 5. Comparison of errors regarding the lithium carbonate prices predicted by three models.
Mathematics 13 00613 g005
Figure 6. Comparison of the lithium carbonate prices predicted by three models. (a) Training set results; (b) testing set results.
Mathematics 13 00613 g006
Table 1. Data source.
IndicatorVariablesData Sources
Related Product PricesLithium Hydroxide PriceWind
Lithium Iron Phosphate PriceWind
Lithium Manganese Oxide PriceWind
Lithium Hexafluorophosphate PriceWind
Macroeconomic IndicatorsCSI 300 IndexShanghai Stock Exchange
Shanghai Composite IndexShanghai Stock Exchange
Table 2. Descriptive statistics.
VarNameObsMeanSDMinMaxSkewnessKurtosis
Lithium Hydroxide Price118219.9016.974.8056.020.922.27
Lithium Iron Phosphate Price11827.824.843.2517.700.862.15
Lithium Manganese Oxide Price11823.632.191.188.580.992.93
Lithium Hexafluorophosphate Price118219.9715.775.4259.001.153.18
CSI 300 Index11824215.84605.933159.255807.720.382.07
Shanghai Composite Index11823224.03236.232660.173715.37−0.062.14
Lithium Carbonate Price118220.2317.104.0056.760.882.24
Table 3. Prediction performance indicators of four models for the training set and testing set.
Training SetTesting Set
ModelMAERMSEMAPE%R2MAERMSEMAPE%R2
LSTM1.34671.85014.65140.99061.19761.45565.75040.9532
VMD–LSTM1.32191.83054.91930.99080.60140.76574.58820.9870
VMD–SSA–LSTM1.15271.52524.12660.99360.56140.73594.35680.9880
Disclaimer/Publisher’s Note: The statements, opinions and data contained in all publications are solely those of the individual author(s) and contributor(s) and not of MDPI and/or the editor(s). MDPI and/or the editor(s) disclaim responsibility for any injury to people or property resulting from any ideas, methods, instructions or products referred to in the content.

