Abstract
Agent-based automated negotiation aims to enhance decision-making processes by predefining negotiation rules, strategies, and objectives to achieve mutually acceptable agreements. However, most existing research primarily focuses on modeling the formal negotiation phase, while neglecting the critical role of opponent analysis during the pre-negotiation stage. Additionally, the impact of opponent selection and classification on strategy formulation is often overlooked. To address these gaps, we propose a novel automated negotiation framework that enables the agent to use reinforcement learning, enhanced by opponent modeling, for strategy optimization during the negotiation stage. Firstly, we analyze the node and network topology characteristics within an agent-based relational network to uncover the potential strength and types of relationships between negotiating parties. Then, these analysis results are used to inform strategy adjustments through reinforcement learning, where different negotiation strategies are selected based on the opponent’s profile. Specifically, agents’ expectations are adjusted according to relationship strength, ensuring that the expectations of negotiating parties are accurately represented across varying levels of relationship strength. Meanwhile, the relationship classification results are used to adjust the discount factor within a Q-learning negotiation algorithm. Finally, we conducted a series of experiments, and comparative analysis demonstrates that our proposed model outperforms existing negotiation frameworks in terms of negotiation efficiency, utility, and fairness.
Keywords:
intelligent agent; automated negotiation; social network analysis; opponent modeling; reinforcement learning MSC:
68T42; 91A25
1. Introduction
With the rapid development and widespread popularity of internet technology, the platform economy has seen explosive growth [1]. At the current stage, a large number of manufacturers are directly collaborating with e-commerce platforms [2], attempting to enhance efficiency by reducing intermediary steps [3,4]. This initiative has compelled companies to upgrade the technological level of their supply chain systems and transaction methods to accommodate the growing demand for customer service operations [5,6]. As the transaction scale continues to increase, traditional manual negotiation has become inadequate for meeting the needs of efficient, large-scale transactions [7,8]. In this context, agent-based automated negotiation technology has become a key breakthrough to solve this contradiction.
Agent-based automated negotiation refers to an approach that employs predefined negotiation rules and algorithms to drive intelligent agent systems, with the aim of improving negotiation efficiency and decision-making quality in complex negotiation tasks [9,10]. Surveys indicate that current agent-based automated negotiation systems are gradually beginning to show great potential for development in related fields [5]. For instance, Pactum (https://pactum.com/) is utilizing its automated negotiation system to replace some negotiation experts, offering businesses large-scale personalized automated contract negotiations. Moreover, transaction data ([accessed on 17 May 2023] https://fortune.com/2021/04/27/a-i-startup-pactum-negotiating-software-saving-walmart-money/) reveals that negotiations conducted on behalf of businesses by Pactum’s negotiation agents have resulted in an average profitability increase of 6.5% per transaction. These practices illustrate that the implementation of automated negotiation technology can provide companies with a competitive edge in a dynamic market environment.
Despite these advancements, research on agent-based automated negotiation still faces several core challenges, with one of the most prominent being the need for the adaptive optimization of strategies in dynamic negotiation settings. Most existing research primarily focuses on developing specific strategies that enable agents to automatically select adaptive bidding or negotiation strategies based on different negotiation opponents [11,12,13,14]. However, the dynamic and complex nature of negotiation environments necessitates that agents make decisions within fluid and evolving contexts. This requires agents to continuously optimize their strategies during negotiation interactions to effectively address changing challenges [15]. In this context, reinforcement learning has emerged as a key approach for solving dynamic negotiation problems, owing to its capacity to optimize decisions through trial-and-error learning via interaction with the environment. For instance, the Q-learning algorithm adjusts strategies by constructing a state-action value function (Q-function) and incorporating a reward mechanism [16]. This enables negotiation agents to autonomously learn and flexibly adjust concession strategies in response to uncertain negotiation environments. Nevertheless, such methods heavily rely on real-time interactive feedback. In the early stages of negotiation, agents often struggle to assess their opponents’ characteristics accurately due to a lack of sufficient prior information, leading to the “cold start” problem, where the agent’s strategy selection in the initial stage falls into an inefficient trial-and-error mode due to insufficient information [17]. This limitation not only affects the overall efficiency of the negotiation, but may also increase the risk of cooperation breakdown due to strategy mismatch.
To address the challenges outlined above, some scholars tried to introduce opponent modeling during the pre-negotiation phase [18,19], aiming to extract opponent features from historical data to inform strategy development. For instance, Panzarasa et al. [20] developed a negotiation model grounded in social relationship networks and dynamically adjusted interaction strategies by analyzing the social status of the negotiation participants. However, existing studies still exhibit two major limitations [5,21,22,23]: (1) the integration of opponent modeling with reinforcement learning-based strategy optimization remains insufficient, hindering the ability of pre-negotiation analyses to effectively support subsequent decision-making; and (2) human intervention continues to be required for opponent selection and classification, limiting the full autonomy of the agent systems. Therefore, a key challenge in enhancing the efficiency and quality of automated negotiation is quantifying the relationships between negotiation agents through complex network analysis and embedding these factors within a reinforcement learning framework, enabling agents to autonomously select negotiation opponents and dynamically optimize their strategies.
Therefore, building on existing research, this paper proposes a dynamic negotiation framework that integrates social network analysis with reinforcement learning. Specifically, the framework aims to facilitate the selection and classification of negotiation opponents through relationship modeling, while also deeply integrating opponent modeling with Q-learning-based strategy optimization. This integration enables agents to respond more flexibly to negotiation opponents throughout the process. The primary objectives of the proposed framework are (1) enhancing the autonomy of opponent selection and classification, (2) addressing the cold start problem through opponent modeling during the pre-negotiation phase, and (3) establishing a dynamic mapping mechanism between opponent modeling analysis and strategy adjustment to optimize negotiation interactions. Compared to previous studies, the key contributions of this paper are summarized as follows:
- (1)
- Compared to traditional methods, which often rely on manual processes during the pre-negotiation phase, this study introduces an approach that enhances the autonomy of opponent selection and classification through social network analysis. This approach ensures full autonomy throughout the entire process, from opponent selection to strategy execution, eliminating the need for external intervention or human involvement. As a result, it significantly enhances the agent’s autonomy.
- (2)
- Unlike existing research on automated negotiation, which primarily focuses on the formal negotiation stage—especially on modeling the behavior of the negotiating opponent, and which often faces the “cold start” problem—our study introduces opponent modeling during the pre-negotiation phase. This early modeling serves as the foundation for adjusting agent preferences in subsequent learning, thereby significantly reducing the likelihood of the cold start problem.
- (3)
- We innovatively analyze the relationship between negotiating parties in the pre-negotiation phase and its impact on the negotiation strategies. Our methodology links the modeling of opponents during pre-negotiation to the strategy adjustments made in the formal negotiation phase. This association enables agents to exhibit a higher level of personalization and intelligence during the negotiation interaction process.
The remainder of this paper is organized as follows: Section 2 provides a survey of related studies. Section 3 elaborates on the proposed model. Section 4 details the experimental setup and the evaluation metrics employed, and the experimental results are presented and discussed in Section 5. Section 6 concludes this paper.
2. Literature Review
Our work is related to two streams of research on agent-based automated negotiation, namely opponent modeling during the pre-negotiation phase and strategy optimization during the formal negotiation interaction stage.
2.1. Opponent Modeling Before Negotiation
The modeling of opponents before negotiations is fundamentally aimed at comprehending their characteristics through available data, enabling negotiation agents to gain insights into their counterparts or develop appropriate negotiation strategies accordingly [22,24]. While pre-negotiation opponent modeling has received limited attention in traditional automated negotiation frameworks, it is becoming increasingly essential as the increasing automation demand [21,25]. This process is vital, as it equips agents with the information needed to make effective decisions in subsequent negotiations, directly influencing negotiation efficiency, the likelihood of reaching an agreement, and the overall outcome.
At present, the analysis and modeling of potential negotiation opponents have been explored from various perspectives [19,26,27,28]. Some studies focus on matching negotiation costs and resource levels. For example, Beauprez et al. [29] proposed an agent strategy, similar to classical heuristic approaches, that reorders negotiation counterparts to complete simultaneous bilateral negotiations more quickly, thereby reducing time costs. Alkasasbeh et al. [30] achieved a more reasonable distribution of results by mining the friendship communication network. As research has advanced, recent studies have increasingly explored the social attributes and relationship features of individuals [18,31,32,33], taking into account individual heterogeneity and differences. These studies investigate how negotiation decisions and behaviors can be adjusted according to these differences to facilitate more intelligent and adaptive interactions. Collectively, these studies demonstrate, to varying extents, that opponent modeling during the pre-negotiation stage significantly enhances the efficiency or quality of negotiation.
Additionally, existing studies also demonstrated that social relationship factors significantly shape negotiation dynamics and outcomes [19,34]. Specifically, social relationship-based [20], cooperation-based [19], and trust-based [18] approaches have all been recognized as important determinants in the negotiation context. For instance, Kimiagari et al. [19] identified factors influencing the selection of suitable partners in cooperative settings through literature reviews and expert interviews, proposing a novel decision-making approach that considers decision-makers’ risk tolerance, knowledge base, and educational backgrounds, and the study emphasized the importance of social factors in selecting partners. Yao et al. [18] explored the impact of negotiators’ general trust and satisfaction with different types of trust evolution, revealing a positive link between negotiators’ general trust and outcome satisfaction with their immediate trust adjustment following the negotiation. Additionally, several studies have directly examined the role of social factors in determining which opponent to confront or persuade. For instance, Kadowaki et al. [35] highlighted the significant impact of balanced versus unbalanced social relations on interaction strategies. They explored how the theory of balance facilitates persuasive social relationships between negotiating agents and real human users, underscoring the critical role of social dynamic relationships in enhancing persuasive effectiveness.
Despite the valuable insights provided by previous studies into the influence of social attributes and relationship factors on negotiation opponent modeling and decision-making, few studies have examined the effect of inter-individual relationships on decision-making through the selection and categorization of negotiation opponents from a network topology characteristics perspective. This area remains underexplored, and warrants further investigation. Therefore, this study focuses on the positioning and background of negotiation opponents within complex systems. Specifically, it aims to uncover potential relationships between negotiation parties and their opponents by analyzing node characteristics and network topology in multi-agent systems. By examining the strength and types of social relationships, our study aims to enable negotiation agents to select the negotiation opponent with more autonomy and adjust their strategies more dynamically, depending on the nature of their opponents.
2.2. Strategy Optimization in Automated Negotiations
With the development of the information age, the core issues addressed by automated negotiation have been continuously evolving. Initially, researchers primarily utilized negotiation agents to address the limitations of traditional manual negotiation methods, particularly those related to constraints of location and time [36]. Subsequently, research shifted its focus towards enhancing the automation and intelligence of negotiation agents in order to improve productivity and efficiency in daily life [37]. In recent years, the rapid advancement of artificial intelligence has made decision optimization a crucial research direction in the field of automation [38]. Consequently, the focus of automated negotiation research has gradually shifted toward optimizing negotiation strategies and developing intelligent negotiation agents with capabilities comparable to those of human counterparts. Relevant research mainly focuses on the design and optimization of agents’ concession strategies. For example, Liang et al. [4] designed four distinct concession strategies based on the opponent’s concession behavior, enabling agents to adjust their strategies according to varying degrees of preference using fuzzy rules. Hu et al. [39] explored how to utilize concession strategy adjustment to handle uncertainties and time constraints in complex environments, and they employed Gaussian process regression and dynamic risk strategies to predict the opponent’s concessions and adjust their own agent’s concession rate accordingly. In general, the prevailing focus in these studies has been on the dynamic modeling and optimization of negotiation agents’ concession strategies.
Some of the latest studies have begun exploring how to learn the strategies of opponents through the negotiation interaction process. The application of the learning methods to automated negotiation allows agents to fully utilize the advantages of their autonomy, anthropomorphism, and ability to learn during the negotiation process [4,17]. The mainstream learning methods include Bayesian learning [40], machine learning [41], and reinforcement learning [17,42]. Among them, Q-learning [16], as a classical reinforcement learning algorithm, features a relatively simple model structure and is easy to implement. Meanwhile, it demonstrates strong adaptability in addressing problems with well-defined state and action spaces, which has led to its repeated application in automated negotiation. Additionally, several improved reinforcement learning methods, such as Meta-RL [43] and integrated deep reinforcement learning [44] methods, have also been shown to outperform traditional approaches in decision optimization. However, a notable challenge associated with reinforcement learning agents is their inclination to compromise too quickly, potentially resulting in excessive sacrifice of their own interests in the pursuit of reaching an agreement [42]. At the same time, this reliance on the interaction phase for learning can lead to cold-start problems, where agents lack sufficient data at the outset of negotiations. Additionally, existing research often neglects the complex social relationships between negotiating parties and their impact on the negotiation process.
Based on the above analyses, this study tries to propose an enhancement of the existing reinforcement learning-based automated negotiation framework by integrating relational modeling in the pre-negotiation phase. This integration aims to enable more dynamic and adaptive strategy optimization, ultimately leading to improved negotiation outcomes.
3. The Proposed Model
3.1. Model Framework
In this paper, we constructed a bilateral automated negotiation framework for enhancing reinforcement learning through opponent modeling to optimize negotiation strategies. The proposed framework presented divides agent-based automated negotiation into two phases: the preparation phase and the interaction phase. The goal is to integrate pre-negotiation opponent modeling with dynamic adjustments during the interaction phase to build and continuously update the opponent profile.
During the preparation phase, an initial opponent profile is constructed by using historical interaction data and social relationship networks, quantifying both relationship strength and type. In the interaction phase, learning parameters are dynamically adjusted based on the opponent model created in the previous phase. Simultaneously, the opponent’s strategic characteristics are updated in real time by analyzing their reactions and concession behaviors in response to proposals. This continuous adjustment allows for the optimization of the agent’s Q-learning strategy, ultimately updating personalized proposals. The proposed model framework is depicted in Figure 1.
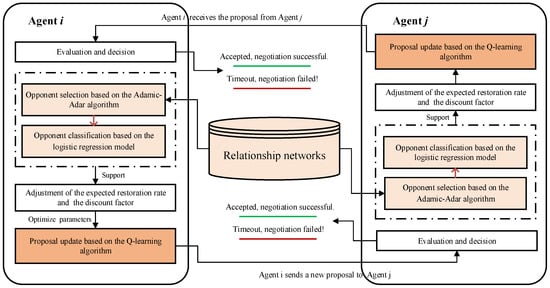
Figure 1.
The framework of the proposed model.
Figure 1 depicts the interaction flow between two negotiation agents (Agent i and Agent j) in bilateral automated negotiation. In the model presented in this paper, the agents interact using a series of algorithms and strategies to achieve a mutually beneficial agreement. The relationship network plays a pivotal role by storing historical interaction data among all agents, which supports opponent selection and categorization. The proposed agent model comprises five key components:
- (1)
- Evaluation and decision: Each negotiating agent first assesses the negotiation problem to identify its goals and constraints. This includes determining critical parameters such as negotiation time constraints and termination conditions.
- (2)
- Opponent selection: Agents use the Adamic–Adar algorithm to select negotiation opponents from the relationship network. This algorithm prioritizes potential opponents with stronger connections to the agent and aims to increase the likelihood of a successful negotiation outcome.
- (3)
- Opponent classification: Once the best-matched opponent is selected, the agent employs a logistic regression model to categorize it. This classification clarifies the nature of the relationship between the parties and provides a foundation for developing more targeted negotiation strategies.
- (4)
- Parameter adjustment: Based on the selection and classification outcomes, the agent modifies its preferences and learning parameters to refine its negotiation strategy. This adjustment aims to enhance the negotiation strategy’s adaptability and flexibility.
- (5)
- Proposal update: The agent updates its proposal using the Q-learning algorithm, allowing dynamic adjustments based on negotiation progress and opponent responses. This learning-based approach enables continuous optimization of the agent’s decisions through the interaction process.
To help further understand how the proposed model can be applied in the real world, a supply chain scenario can be used as an example, particularly focusing on negotiations between a supplier and retailers. Assume that within a supply network, a supplier agent (e.g., a manufacturer) negotiates with multiple retailer agents (e.g., distributors or stores) concerning the sale of goods. Specifically, during the preparation stage, the supplier constructs a personalized relationship network centered on its connections. By employing the Adamic–Adar algorithm [45] and the relation classification prediction based on features and logistic regression, the supplier identifies “friendly or unfriendly nodes”—retailers that show a high degree of association and potential cooperation for subsequent interactions. In the interaction stage, the Q-learning algorithm is employed to continuously update personalized proposals and optimize negotiation strategies based on insights from the preparation stage, thus enabling negotiation agents to better navigate complex situations and challenges.
It is also necessary to note that the Adamic–Adar algorithm is widely used to predict the strength of connections between nodes in a network. This algorithm is applicable in a variety of environments, especially when evaluating and predicting the potential connection strength between nodes in networks, such as social networks and multi-agent systems. The strength between two nodes is calculated using the sum of the inverse logarithm of the degree of each shared neighbor. This method primarily focuses on the structural relationships between nodes, particularly the number of common neighbors and their connectivity, without directly considering the nodes’ qualifications or other attributes. Therefore, when applying the Adamic–Adar algorithm for opponent selection, we assume that all potential adversaries are capable of fulfilling the demand for the item currently under negotiation. This assumption is valid in scenarios involving fixed items (e.g., negotiations over a specific class of products in a supply chain). However, in negotiation contexts involving multiple unfixed items, the application of the Adamic–Adar algorithm requires additional conditions. Specifically, an additional step is needed to evaluate whether a potential opponent has the capability to provide the required items before the opponent selection process. This can be achieved by incorporating filtering mechanisms that consider the counterparty’s resources, capabilities, or historical transaction data. Meanwhile, the negotiation agent in this study adhered to the following negotiation protocol:
- (1)
- The negotiation is limited to bilateral communication.
- (2)
- Agents exchange numerical proposals exclusively, focusing on quantitative attributes such as price or delivery terms.
- (3)
- Negotiations involve multi-attribute proposals, including attributes such as price, quality, and delivery terms.
- (4)
- For either agent, an agreement is reached for the benefit attribute if the opponent’s proposed value is greater than or equal to the agent’s proposed value. For cost-based attributes, an agreement is reached if the opponent’s proposed value is less than or equal to the agent’s proposed value.
- (5)
- T indicates the preset maximum number of rounds, and if no agreement is reached after T rounds, the negotiation is considered a failure.
3.2. Negotiation Opponent Modeling
This section focuses on modeling the relationships between negotiating parties within a complex network, identifying highly correlated opponents, and classify these relationships. Unlike traditional methods, which typically rely on manual processes during the pre-negotiation phase, our approach leverages complex network analysis, enabling the agent to autonomously analyze and select opponents based on network topology and existing relationships. Consequently, the opponent selection and classification process are carried out without external intervention, significantly enhancing the agent’s autonomy.
3.2.1. Opponent Selection
In this section, we enable the agent to construct a personalized relationship network () centered around its own connections, expanding outward based on both direct and indirect relationships. This network does not encompass the entire globally connected framework; rather, it represents the agent’s personal “sub-network.” This sub-network is unique as it is shaped by the agent’s specific connections and interactions, rather than originating from a global perspective. While this personalized network may overlap with others, it retains its uniqueness due to its foundation in the agent’s individual connections. The purpose of this section is to use the link prediction method from social network analysis to uncover nodes that exhibit a high degree of association with negotiating agents, thus identifying potential negotiating opponents. Specifically, the six degrees of separation theory [46] is used to determine the search space for negotiation opponents, then the Adamic–Adar algorithm [47] is applied to calculate the degree of association between nodes, and next, based on the prediction results, sort out the node with the highest predicted strength of association. This personalized approach facilitates a more targeted and efficient negotiation environment.
The six degrees of separation theory [48] is employed to identify the complete set of potential negotiating opponents for an automated negotiating agent in a complex network. In accordance with the principles of the six degrees of separation theory, the negotiating agent that shares a direct connection with the negotiating subject is categorized as having a first-degree relationship. By utilizing the first-degree relationships as a basis for expansion, a second-degree relationship is established with the negotiating agents connected to the first-degree relations. This process continues iteratively until the predetermined requirements are fulfilled. Consequently, the resulting social network represents the search space for the automated negotiation system.
The Adamic–Adar algorithm is a local similarity-based link prediction algorithm. It addresses the issue of nodes with a large number of common neighbors by decomposing the probability weight of shared neighbors into a logarithm-based fitting contribution. This approach penalizes nodes with higher degrees, preventing them from excessively influencing similarity measurements. Consequently, it provides a more accurate reflection of the association level between nodes. The calculation formula for this algorithm is presented in Equation (1).
where and correspond to Agent and Agent and Agent , respectively. and denote the sets of nodes that have direct links with Agent and Agent , respectively, while represents the degree of node .
The specific steps for opponent selection in automated negotiation based on the Adamic–Adar algorithm are as follows:
- (1)
- Define the search space for negotiation opponents, which should encompass all potential opponent nodes.
- (2)
- For each opponent node, calculate its association strength with the negotiating agent by the Adamic–Adar algorithm.
- (3)
- Rank the calculated association values in descending order and select the node with the top-1 association value as the best-matched negotiation opponent.
To enhance the transparency and reproducibility of the opponent selection method, this section provides the pseudocode, offering a clear and concise description of its step-by-step implementation. The details are presented in Algorithm 1.
| Algorithm 1. Opponent selection based on the Adamic–Adar algorithm |
| Input: Agent initiating the negotiation and a social network graph , where denotes nodes (agents) and denotes edges (social ties). Output: The best-matched opponent for negotiation, . Steps: 1. Define the search space 2. for each node : 3. Calculate the association level 4. Create a list containing tuples of each opponent and their association level: 5. Sort in descending order based on : 6. Select the best-matched opponent : 7. Return |
3.2.2. Opponent Classification
Feature engineering techniques are employed in this subsection to classify potential negotiation opponents. Specifically, relevant feature attributes are selected to predict the type of relationship between the negotiating parties, i.e., using logistic regression to predict positive or negative relationships. To achieve this, we construct two major categories of feature attributes possessed by negotiation participants: node features and structure features.
- (1)
- Node features
The node features of negotiation participants primarily serve to record the local aggregation relationships between the participants and others. Taking node as an example to represent negotiation participant , the in-degree of node indicates the number of edges pointing to that node, while the out-degree represents the number of edges originating from that node. Specifically, positive in-degree and positive out-degree refer to the quantities of positive relationships pointing to or originating from the node, whereas negative in-degree and negative out-degree signify the quantities of negative relationships. Generally speaking, historical data on relationship types that nodes have previously sent or received can, to some extent, reflect their preferences and trends in relationship types. This information is primarily derived from historical interaction evaluations, ratings, or labels between individuals, which form a crucial foundation for relationship modeling.
Based on the above analyses, we constructed six node features. Assuming negotiation participant as an example, six specific node features are, respectively, the positive in-degree of node (), the positive out-degree of node (), the negative in-degree of node (), the negative out-degree of node (), the total in-degree of node (), and the total out-degree of node (). The summarized representations and meanings of these node features in Table 1.

Table 1.
Node features and their meanings in network analysis.
- (2)
- Structure features
The balance theory, originally formulated by Heider [49], primarily discusses social relationships among individuals, with a particular focus on triadic relationships that involve both positive and negative connections between three nodes. For instance, principles such as ‘the enemy of my enemy is my friend’ and ‘the friend of my enemy is my enemy’, along with their variations, provide insight into the local structural balance relations within social networks [50]. Therefore, this paper constructs the structural features of negotiation participants based on the structural balance theory [35].
According to the principle of local structural balance, given a set of nodes , , and , with and being the source and target nodes, respectively, each triad involves the links , , and . Assuming each link (disregarding its direction) has its own label, a triad can be considered balanced if the number of negative-labeled links is even. For example, Figure 2a,c depict examples of balanced triads, while Figure 2b,d illustrates examples of unbalanced triads.
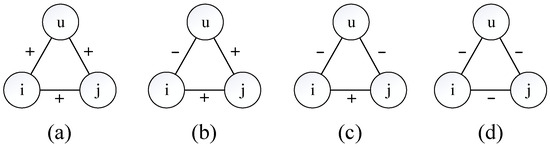
Figure 2.
Examples of balanced and unbalanced triads. (a) Balanced triad with zero negative links (even number of negative labels); (b) Unbalanced triad with one negative link (odd number of negative labels); (c) Balanced triad with two negative links (even number of negative labels); (d) Unbalanced triad with three negative links (odd number of negative labels).
Taking into account the directionality of edges between negotiating parties enhances the ability of structural balance features to depict the relationships among negotiating parties [51]. Expanding on the preceding analysis, consider negotiating parties and as a case in point, where node serves as the source node and node as the target node. This study establishes 16 structural features by taking into consideration both the direction and type of edges between nodes and , as illustrated in Figure 3. Specifically, these features are derived by amalgamating the positive and negative in-degrees of node with the positive and negative out-degrees of node , as well as their vice versa counterparts. The intersections of these combinations are utilized to formulate the structural features.
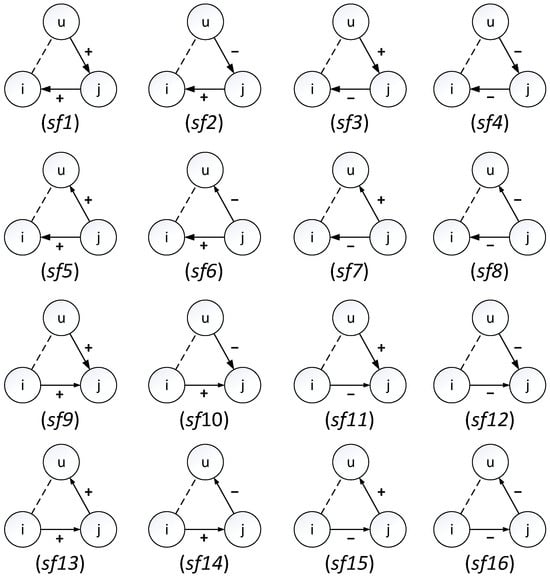
Figure 3.
Structure features with directed edges.
- (3)
- Relationship classification prediction based on logistic regression
Logistic regression constructs a model by utilizing features extracted from the attributes of established entities, enabling the classification of novel entities based on these features. The fundamental principle underlying logistic regression is to establish a probability function that models the association between one or more independent variables and the dependent variable, thereby generating a probability value as the output.
Considering nodes and as the source and target nodes, respectively, this study is based on a hypothesized theory that identifies two types of relationships: (1) a positive relationship between node and node , and (2) a negative relationship between node and node . To predict the relationship type between node and node , this study utilizes a logistic regression model, incorporating node features and structure features. The conditional probability function is presented in Equation (2).
where denotes the probability of a sample belonging to a positive relationship, while represents the feature vector comprising node features and structural features. The feature weight vector is estimated through maximum likelihood estimation.
To further improve the transparency and reproducibility of the opponent classification method, the pseudocode is provided in Algorithm 2.
| Algorithm 2. Opponent classification based on features and logistic regression |
| Input: Agent initiating the negotiation; the opponent whose relationship with needs to be classified; A social network graph , where denotes nodes (agents), denotes edges (social ties), and denotes the relationship label. Output: The predicted relationship type , where indicates a positive relationship and indicates a negative relationship. Steps: 1. is divided into and 2. Extract node features : 3. Extract structural features : 4. Combine feature vectors : 5. Train the logistic regression model on a training dataset : Classifier (Logistics Regression) ← Train () 6. Compute the probability of a positive relationship: 7. Determine the predicted relationship type : 8. Return |
3.3. Proposal Updating Based on Opponent Modeling
Compared to traditional methods, reinforcement learning (RL) offers significant advantages in automated negotiation, particularly in complex and uncertain environments. In these settings, an RL-based agent can autonomously learn and gradually identify optimal strategies through interactions with the environment. This ability makes the agent particularly well-suited for negotiations that involve multiple rounds of interaction and dynamic changes. The negotiation environment examined in this study features a discrete and finite state space (e.g., price ranges). The Q-learning algorithm employs a tabular policy storage approach within this discrete space, directly mapping negotiation rules. This method circumvents the computational redundancies associated with complex function approximations, and meets the requirements for manageable computational complexity while ensuring the transparency and interpretability of the learning process. Therefore, the Q-learning algorithm is used as the basic proposal update in this study.
However, reinforcement learning-based negotiation models also have limitations. A common challenge is that RL-based agents may prematurely compromise, overly sacrificing their own interests in an attempt to reach an agreement [17,42]. To address this issue, this study builds upon recent advancements by Wu et al. [17], and aims to further enhance the learning strategies of RL-based agents. Specifically, it incorporates opponent modeling results from the pre-negotiation phase, introduces an expectation restoration rate to recover the original expected utility, and adjusts the initial discount factor to better balance immediate and long-term rewards.
3.3.1. Basic Proposal Updating Based on Q-Learning
Q-Learning is employed as the foundational algorithm for updating proposal values in this study. According to Chen et al. [42] and Wu et al. [17], the process of the agent proposing offers can be regarded as the transition of an agent’s state by choosing the optimal action. The Q function based on Q-Learning is defined in Equation (3).
where denotes the immediate reward, which can be determined using Equation (4). is agent’s negotiation state, refers agent’s action that is the proposal of an agent, is the discount factor, and is the state transition function.
Here, each negotiating issue is classified as either a benefit type or a cost type, depending on the agent’s perspective. For instance, a buyer agent considers price as a cost-type attribute, whereas a seller agent regards it as a benefit-type attribute. The proposal refers to the offer made by the agent, which can include various aspects, such as price or delivery terms, depending on the specific negotiating issue at hand. Assuming that the negotiation is successful in round. , the expected reward value of the negotiating agent is presented in Equation (5).
where represents the negotiating agent’s belief about the probability distribution in the value interval of negotiation issue. The average reward value at state can be calculated by Equation (6).
Therefore, the basic proposal updating function of an agent in round is presented in Equation (7).
3.3.2. Strategy Enhancement Based on Opponent Modeling
Given that the parameter of expectation restoration rate influences the proposal value [17,42], the method proposed by Wu et al. [17] is referred to as the original model (OM) in this study. This baseline model serves as the initial negotiation framework before any optimization, with its performance representing the initial level of negotiation before any enhancements or adjustments. According to the original model [17], the proposal value update function of the negotiating agent is presented in Equation (8).
Herein, incorporates both the impact of emotions and concession behavior in the original model proposed by Wu et al. [17]. In the original model, the expectation restoration rate is affected by the agent’s emotion and the opponent’s concession behavior. The agent’s emotional value for the given proposal is obtained based on the Weber–Fechner law calculation, where intense emotion results in a lower expectation restoration rate. Additionally, the expectation restoration rate is also affected by the concessionary behavior of the opponent, and the rate is adjusted based on the utility ratio between two consecutive proposals. Consequently, in the original model, both emotion and concession behavior jointly govern the agent’s expectation restoration rate during negotiation. The expectation restoration rate is calculated by Equation (9).
where represents the expectation restoration rate influenced by emotion, denotes the expectation restoration rate influenced by concessionary behavior. Additionally, and are the weights of the influence of emotion and concessionary behavior on the agent’s expectation restoration rate, respectively.
As outlined in Equation (8), Wu et al. [17] proposed an update to the expected restoration rate in their study. However, this rate is entirely dependent on the dynamic adjustment of factors such as emotion and behavior during the interaction process. This dependency can result in a cold-start problem where, at the outset of the negotiation, the agent may lack sufficient interaction data to make an optimal decision, leading to less effective negotiation outcomes. To address this issue, this study incorporates opponent modeling during the pre-negotiation phase, followed by an assessment of the costs associated with maintaining social relationships to adjust the agent’s initial expected restoration rate. This is one of the key innovations in optimizing existing research.
Specifically, the strength of the relationship between negotiating parties directly influences their management of expectations regarding negotiation outcomes [52,53]. Maintaining social relationships incurs costs, and higher costs are often associated with elevated expectations, as participants typically anticipate a proportional return for greater investments. Consequently, when the strength of the relationship is stronger, expectations for the negotiation outcome are likely to be higher. In this study, we assume the level of relational strength between the negotiating parties is denoted as and utilize the Adamic–Adar () algorithm to determine the degree of association between the parties, which can be represented as . To account for the impact of relationship strength on the expected restoration rate, we introduce a cost function, , which acts as a multiplier within the Q-learning algorithm. This cost function adjusts the expected restoration rate, and a high cost usually correlates with an increase in the expected restoration rate. For modeling the cost, we adopt the classical quadratic differentiable nonlinear function proposed by Ye and Zhong [54], formulated as Equation (10).
where represents the rate of marginal cost change, with the condition that .
Based on the above analysis, Equation (8) can be optimized by integrating the influences of the strength of the relationship. The adjusted proposal update function for the negotiating agent is presented in Equation (11).
Furthermore, in practical negotiation settings, negotiators tend to prioritize long-term cooperation and mutual interests when engaging with relationship-friendly opponents, as opposed to immediate gains. In contrast, when dealing with relationship-unfriendly opponents, the emphasis shifts towards immediate gains. Therefore, this section aims to further adjust the foundational preferences of negotiating agents to suit different negotiation scenarios by using relationship types to predict outcomes.
The discount factor is a critical parameter in the Q-learning algorithm, which quantifies the relative importance of future rewards in the current decision-making process. In the framework of RL-based automated negotiation, the dynamic adjustment of the discount factor influences the agent’s decision-making preference. Therefore, by adjusting this parameter, this study aims to enable agents to adopt different strategies tailored to various types of relationships. Specifically, when interacting with a relationship-friendly opponent, the agent adopts a more cautious approach, selecting a higher discount factor to prioritize multiple rounds of negotiation outcomes and place more emphasis on future rewards. Conversely, when engaging with a relationship-unfriendly opponent, the agent adopts a riskier strategy, selecting a lower discount factor and focusing on maximizing returns in the current round, prioritizing immediate benefits.
In this study, the results of relationship classification predictions will be used to adjust the configuration of the discount factor; that is, to adjust the size of the discount factor parameter according to the probability of the positive relationship prediction. When the Q-learning algorithm is employed to update the proposal, the agent adjusts its behavior preference by using a higher discount factor for potential friendly opponents. This strategy adjustment encourages the agent to prioritize long-term cumulative rewards across multiple negotiation rounds, thereby reflecting the attitude of patience and cooperation. In contrast, when negotiating with unfriendly opponents, a lower discount factor is used, prompting the agent to adopt a more aggressive strategy that emphasizes immediate rewards and reduces reliance on future cumulative rewards. Based on the above analysis, the formal representation of the discount factor parameter based on the prediction results of the relationship type is presented in Equation (12).
where represents the probability that negotiators have a positive relationship. A value of approaching 1 signifies an increased likelihood of engaging with amicable negotiation counterparts.
Therefore, within the proposed model framework, the automatic adjustment of both the expected restoration rate and the discount factor significantly impacts the proposal value. Consequently, Equation (11) can be further optimized by integrating the influences of opponent classification. The final proposal update function for the negotiating agent is presented in Equation (13).
Herein, denotes the discount rate parameter that is adjusted according to the predicted relationship type outcomes, with a value range of [0, 1]. A discount factor approaching 0 indicates greater attention to immediate rewards and less consideration for future rewards, whereas a value nearing 1 signifies heightened focus on multiple rounds of cumulative rewards.
4. Experiments
4.1. Experimental Settings
This subsection provides a detailed description of the experimental setup, including the data sources and parameter configurations. The experimental design and initial configuration of the bilateral negotiation are based on the framework established by Wu et al. [17].
The negotiation opponent modeling methods were experimentally validated on the publicly available signed social network dataset, Epinions. This dataset is derived from a “who-trusts-whom” online social network of a consumer review site, Epinions.com. Members of this site can decide whether to “trust” each other, resulting in a relationship network. The dataset is provided by Leskovec et al. [55], and it comprises 131,828 nodes and 841,372 edges. It is important to note that the social network dataset is utilized solely for validating the effectiveness of the proposed methods of negotiating counterpart selection and classification in this paper. Within our proposed framework, we will utilize the proposed methods to uncover latent social connections and enable automated parameter configuration. The Epinions dataset was used for opponent modeling evaluation, primarily because of its larger size compared to the industry-specific supply chain dataset. As a publicly available and widely used sign social network dataset, the Epinions dataset can more comprehensively validate the performance of our method. Furthermore, the opponent selection task within the industry-specific supply chain is influenced by various industry-specific factors, such as qualification audits, which require additional data processing and adjustments. Given these complexities, testing on the Epinions dataset provides a more reliable validation and provides a foundation for its subsequent extension to industry-specific applications, such as coal industry supply chains.
For the further numerical experiments, this study simulates a negotiation scenario within the coal industry supply chain [17], where the buyer and seller agents negotiate the price of a specific product. In this context, supplier agents are randomly selected and undergo a process in which a personalized relationship network is constructed based on their existing connections. At the same time, these supplier agents are enabled to apply the proposed counterpart selection and classification methods outlined in this paper to identify potential negotiation partners. Subsequently, the improved reinforcement learning algorithms guide the price negotiations between the supplier agents and their selected retail counterparts, with negotiation strategies dynamically optimized throughout the interaction process.
The configurations for the simulation experiments were derived from the maximum, minimum, and mean values of historical transaction data for China Power Coal in Port Qinhuangdao ([accessed on 12 November 2023] China Power Coal; see https://www.ceicdata.com/en/country/china), spanning from 1 January 2013 to 18 February 2022. During this period, the coal price varied between 300 CNY/ton and 733 CNY/ton, with 2263 observations averaging 455 CNY/ton. The rules for generating initial conditions are defined as follows: For the seller agent, the initial offer value is randomly selected from a uniform distribution within the interval between the historical mean and the maximum price. The reservation value for the seller agent is also chosen from a uniform distribution within the interval between the historical minimum and the mean. For the buyer agent, the initial offer value is randomly selected from a uniform distribution within the interval between the historical minimum and the mean. The reservation value for the buyer agent is randomly selected from a uniform distribution within the interval between the historical maximum and the mean. For both types of agents, the expected value is generated within the range between the reservation value and the initial offer value.
4.2. Experiment Description
First, in order to simulate the negotiation process and validate the effectiveness of the proposed negotiation model, four different negotiation scenarios are considered, i.e., one party uses the original model while the other utilizes the proposed new model. Figure 4 and Figure 5 depict the graphical representation of 1000 sets of initial, expected, and reserved prices for sellers and buyers, respectively.
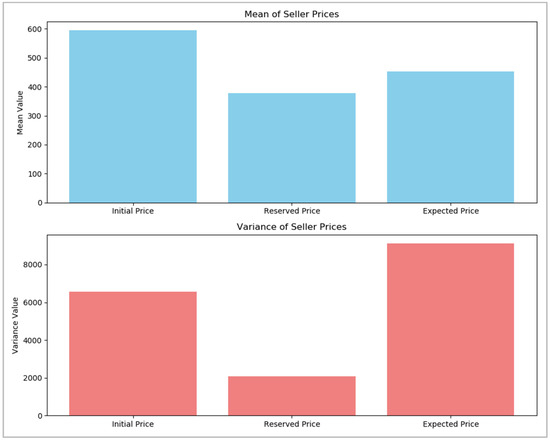
Figure 4.
Information on initial, reserved, and expected values for sellers.

Figure 5.
Information on initial, reserved, and expected values for buyers.
Scenario 1: both parties use the original model.
Scenario 2: the seller party uses the original model, while the buyer party utilizes the proposed new model.
Scenario 3: the buyer party uses the original model, while the seller party utilizes the proposed new model.
Scenario 4: both parties use the proposed new model.
The simulation experiments for these four scenarios aim to assess the efficiency of the negotiation process and the stability of the price under different model combinations, thereby validating the advantages of the new model in automated negotiations.
Next, to assess the effectiveness of the proposed opponent modeling method, we conduct experiments using the cross-validation technique. Firstly, the dataset is to be divided into K subsets. For each subset i, it will be used as the test set, while the remaining K-1 subsets will be used as the training set. The proposed model is trained on the training set, and predictions will be made on the test set. Performance metrics such as accuracy, recall, etc., are computed for the model on each test set. This process is repeated until each subset has been used as the test set. Additionally, to further evaluate the contribution of node and structural features in the proposed method, we initially use a logistic regression model incorporating all available features to predict the type of relationship between nodes, referred to as the “full feature baseline group”. Subsequently, all node-related features are removed to create the “node feature ablation group”, enabling the evaluation of the effect of node feature removal on the model’s classification performance. Finally, all structure-related features are excluded in the “structural feature ablation group”, allowing for the assessment of the impact of removing structural features on classification performance.
In addition, we design a series of ablation experiments to further validate the effectiveness of the proposed model in optimizing the original model. Specifically, we start with the original model (OM) as the baseline and progressively add Component 1 (OM+C1) and Component 2 (PM+C2) to examine their respective impacts on overall performance.
Original model (OM) proposed by Wu et al. [17]: the original model, which serves as the initial model upon which this study is based. Its performance represents the baseline level without any optimization.
Original model with Component 1 added (OM+C1): In this version, we add Component 1 to the original model to evaluate its contribution to overall performance. Component 1, opponent selection, refers to a critical part of the proposed model.
Original model with Component 2 added (OM+C2): Similarly, this version adds Component 2 to the original model to gain a deeper understanding of its influence on model performance. Component 2, opponent classification is also an important component of the proposed mode.
Proposed model (PM): The final version of the proposed model, refined through optimization and improvement. This model is the primary focus of this study.
Finally, to comprehensively validate the proposed model, we conduct a comprehensive comparison and analysis with the four baseline models in the field, including models from Wu et al. [56], another by Wu et al. [17], and Cao et al. [12]. This comparison with these advanced models aims to highlight the relative advantages and improvements of the proposed model, thereby further demonstrating its advancements.
4.3. Baseline Models
To further analyze performance, we compared against four other similar models in the automated negotiation field. Among them, Wu et al. [56] proposed a bilateral negotiation model that incorporates individual emotions and preferences to optimize the negotiation process, performing proposal updates through the simulated annealing algorithm. Qie et al. [57] address adaptive targets and the interactive social nature of negotiations, proposing an emotional persuasion model from a social exchange perspective. Wu et al. [17] focused on evaluating emotions and opponent concession behaviors during bilateral negotiation interactions, employing the Q-learning algorithm to generate proposals. Cao et al. [12] developed a multi-strategy negotiation model, integrating time-dependent and behavior-dependent strategies for strategy selection.
The similarities between these models and ours include considerations of strategy adjustment (Wu et al. [56], Cao et al. [12]), the incorporation of social elements in negotiation (Qie et al. [57]), and the use of Q-learning (Wu et al. [17]). Therefore, this study chooses the above four models as baseline models for comparative analysis.
4.4. Evaluation Metrics
The success rate () indicates the rate at which a negotiation culminates in a successful agreement. Assuming that a deal is reached n times out of N negotiation tests, the success rate can be calculated by Equation (14).
The negotiation round () serves as a key indicator of negotiation efficiency from the time dimension, irrespective of the ultimate outcome of the negotiations. Assuming that in automated negotiation tests, the negotiation in the -th test takes place for rounds, the average number of rounds can be calculated by Equation (15).
Utility Difference () quantifies the magnitude of variance between the utilities of the two parties, and a preferable outcome should aim to minimize this distinction as much as possible, relative to non-perfectly competitive negotiations. The utility difference can be calculated by Equation (16).
Joint Utility () quantifies the joint outcome of the negotiation process, representing the aggregate of utilities acquired by both parties upon reaching an agreement. The joint utility can be calculated by Equation (17).
where and denote the buyer’s and seller’s respective utilities, which can be determined using Equation (18). Assuming that the value at the time of agreement is , and denote the maximum and minimum values provided by the individual, respectively.
As is widely recognized, selecting appropriate evaluation metrics is a crucial step in assessing model performance and effectiveness. Table 2 presents the specific meanings and significance of the above evaluation metrics in negotiation scenarios.
Table 2.
The explanation and significance of evaluation metrics.
Additionally, to improve the evaluation of the proposed methods for negotiating opponent modeling, we introduce the following widely utilized evaluation metrics: accuracy, precision, recall, and score. The calculation formulas for these metrics are respectively presented in Equations (19) to (22).
Among them, the definitions of , , , and are shown in Table 3.
Table 3.
Definitions of TP, TN, FP, and FN.
To further enhance the reliability of our analysis, we also employ the Friedman test alongside the Post hoc Nemenyi test to evaluate the significance of performance differences among the models.
5. Results
5.1. Model Performance
Based on the automated negotiation simulations conducted across the four scenarios described above, the corresponding price negotiation transaction values were obtained. Figure 6 presents the density curves of the price transaction values in the four negotiation scenarios.
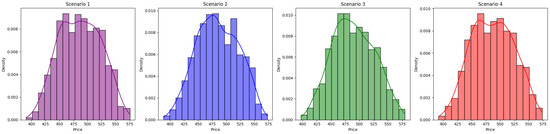
Figure 6.
Distributions of the transaction value with density curve.
To facilitate a comprehensive comparison, the individual utilities of the negotiating parties were further calculated based on the transaction value data. Figure 7 displays the boxplots of the utilities of the negotiating parties in different scenarios.
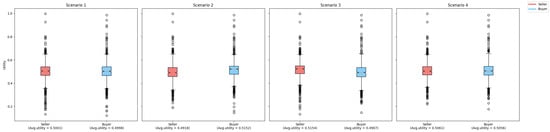
Figure 7.
Comparison of the utilities of negotiating parties in different Scenarios.
By comparing the experimental results of two scenarios, we can reach some other conclusions: (1) According to Figure 6, the automated negotiation results obtained under different situations can be well fitted to a normal distribution through 1000 independent repeated interaction experiments. (2) As illustrated in Figure 7, the utilities obtained using the proposed new model are consistently higher than those achieved with the original model across all scenarios. Specifically, whether both parties employ the original model (Scenario 1), the negotiation involves a combination of the original and proposed new models (Scenarios 2 and 3), or both parties use the new model (Scenario 4), the results consistently demonstrate that the utilities achieved with the proposed new model are significantly superior to those achieved with the original model.
In addition, to better visualize the model’s performance before and after optimization during the interaction process, we compare the distribution of the number of negotiation rounds between the original model and the optimized proposed model under identical negotiation conditions, as shown in Figure 8. These distributions illustrate the number of interactions needed from the start of the negotiation until an agreement is reached.
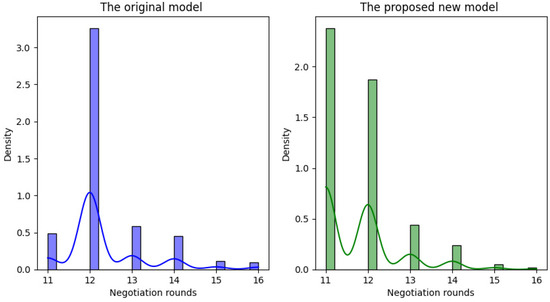
Figure 8.
Comparison of negotiation rounds distribution between the original model and the proposed new model.
By comparing the number of negotiation rounds between the original model and the proposed new model, it is evident that the latter has significant advantages in improving the effectiveness of interaction. The original model shows large fluctuations in the number of negotiation rounds, ranging from 11 to 16 rounds, with a median of about 12 rounds. In contrast, the proposed new model shows a more concentrated distribution of rounds, predominantly between 11 and 13, with fewer instances exceeding 14. The median number of rounds decreases to 11, suggesting that the new model facilitates agreements in fewer rounds. This improvement not only shortens the negotiation time, but also enhances the overall efficiency and effectiveness of the interaction. In summary, the comparative analysis of automated negotiation outcomes under different scenarios effectively validates the effectiveness of the improvement conducted by the proposed new model relative to the original model.
Furthermore, the experimental results verifying the effectiveness of the negotiation opponent modeling method are presented in Table 4.
Table 4.
The performance of the proposed classification method.
Based on the above experimental results in Table 4, the following conclusions can be drawn:
- (1)
- The “full feature baseline group” exhibited the best performance, achieving a relatively high recall, albeit with slightly lower precision. This suggests that the model prioritizes the identification of as many positive class samples as possible, resulting in a higher recall, albeit at the expense of introducing some incorrect positive class predictions, which accounts for the slightly lower precision. The F1 score, calculated at 0.9723, provides a balanced measure between these two metrics.
- (2)
- The removal of node features led to a slight decline in model performance, with accuracy and F1 score decreasing by 0.007 and 0.0037, respectively. This indicates that node features are crucial for identifying relationships between nodes, particularly in capturing potential interactions. Nevertheless, the recall remained high, suggesting that the model continues to identify the majority of positive class samples even in the absence of node features.
- (3)
- Removing structural features caused a more significant decline in performance, with accuracy dropping by 0.0266 and the F1 score by 0.0141. This highlights the importance of structural features in capturing structural relationships between nodes and identifying potential interaction patterns. The removal of structural features resulted in a decreased ability of the model to capture complex relationships between nodes, thereby reducing its classification effectiveness.
In summary, the removal of different feature sets has distinct effects on model performance. Overall, it can be concluded that the proposed negotiation opponent modeling method demonstrates strong overall performance.
5.2. Ablation Study
In the ablation experiments, we sequentially introduce Component 1 (OM+C1) and Component 2 (OM+C2) to the original model (OM) and assess their individual impacts on overall model performance. These experiments were conducted on the same dataset, and the results were compared accordingly. The detailed experimental findings can be found in Figure 9, Figure 10, Figure 11 and Figure 12.
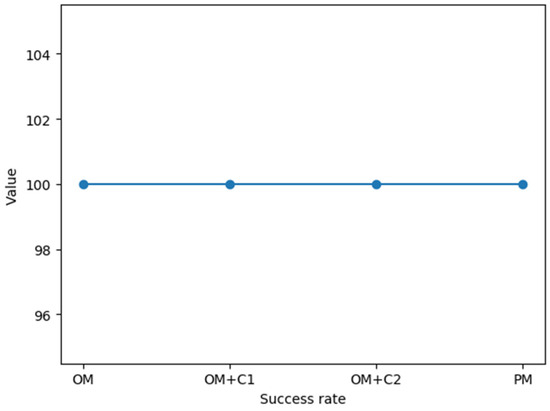
Figure 9.
The result of the success rate on OM, OM+C1, OM+C2, and PM.
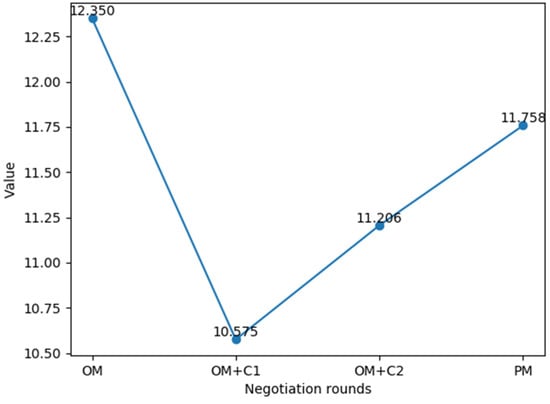
Figure 10.
The result of the negotiation rounds on OM, OM+C1, OM+C2, and PM.

Figure 11.
The result of the joint utility on OM, OM+C1, OM+C2, and PM.
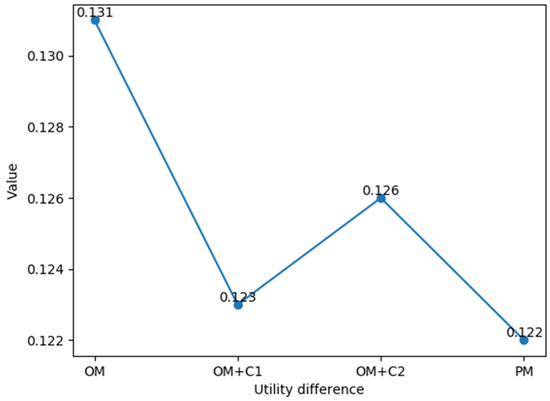
Figure 12.
The result of the utility difference on OM, OM+C1, OM+C2, and PM.
- (1)
- The negotiation success rate achieved 100% under all experimental conditions. This indicates that whether using the original model (OM), the model with Component 1 added (OM+C1), the model with Component 2 added (OM+C2), or the final proposed model (PM), negotiations were consistently successful. This observation suggests that the original model demonstrates high stability and reliability in terms of negotiation success rate.
- (2)
- Regarding negotiation rounds, the original model (OM) had 12.350 negotiation rounds; with the addition of only Component 1, negotiation rounds significantly decreased to 10.575; with the addition of only Component 2, the number of negotiating rounds slightly decreased to 11.206; and the final proposed model (PM), which incorporates both Component 1 and Component 2, had a negotiation round of 11.758. This observation suggests that the combination of the two components may increase the complexity of the model, leading to a further increase in negotiation rounds. However, the PM still showed an improvement in negotiation rounds compared to the OM.
- (3)
- In terms of joint utility and utility difference, these two indicators showed a gradual improvement as the components were gradually added. As for joint utility, with the gradual addition of components, joint utility showed a steady, increasing trend. As for the utility difference, it can be observed that, after only adding Component 1, the utility difference showed a significant decrease, and after only adding Component 2, the utility difference showed a slight decrease. Overall, those indicate that the optimized final proposed model achieves higher joint utility in negotiations and reduces the utility difference among participants.
In summary, based on our analysis of the experiment results, relative to the OM, the PM demonstrated improvements in negotiation rounds, joint utility, and utility differences of 4.79%, 1.05%, and 6.87%, respectively. These findings indicate that the proposed model significantly enhances negotiation performance by reducing negotiation rounds, improving joint utility, and narrowing utility differences. It is noteworthy that the relatively modest improvement in joint utility (1.05%) compared to the reductions in negotiation rounds and utility differences can be attributed to the trade-off between fairness and total utility. As discussed in Section 3.3, our model incorporates an expectation restoration rate to promote negotiation fairness, which encourages agents to avoid premature compromises and preserve their individual interests. Consequently, the improvements in fairness are more pronounced than those in joint utility.
5.3. Comparative Analysis
After inputting the experimental data into the four baseline models described previously, we compared their performance with the model proposed in this study. In the meantime, evaluation metrics, including success rate, negotiation rounds, joint utility, and utility difference, are employed to assess the performance of each model. The experimental results are summarized in Table 5 for comparative analysis.
Table 5.
Comparison of negotiation results between our model and the existing competing models.
To enhance the reliability of our analysis, the Friedman test alongside the Post hoc Nemenyi test was employed to evaluate the significance of performance differences among the models. The results of the Friedman test are presented in Table 5. Additionally, Table 6 displays the findings from the Post hoc Nemenyi test, which demonstrate that the performance of the various methods differs significantly.
Table 6.
The result of the Post hoc Nemenyi test for different models.
Upon comparing the models proposed by Wu et al. [56], Qie et al. [57], Wu et al. [17], Cao et al. [12], and the one proposed in this study, several observations emerge:
- (1)
- Success rate: the model proposed in this paper, along with the models by Qie et al. [57] and Wu et al. [17], achieves a 100% success rate, surpassing those of Cao et al. [12] and Wu et al. [56].
- (2)
- Negotiation rounds: although the model in this paper maintains a comparably low number of negotiation rounds with a high success rate, it slightly trails behind the model proposed by Qie et al. [57].
- (3)
- Joint utility: The model proposed in this paper achieves the highest joint utility score of 1.054 among the five models. This indicates its superiority in optimizing the interests of both negotiating parties.
- (4)
- Utility difference: regarding utility difference, the model presented in this paper outperforms others with a value of 0.122, indicating its ability to effectively mitigate imbalances in interest distribution between negotiating parties.
In summary, the model proposed in this paper exhibits superior performance across all metrics, particularly joint utility and utility difference. This comprehensive analysis underscores the effectiveness and superiority of the proposed model.
6. Conclusions
This study developed a novel automated negotiation model based on opponent modeling and reinforcement learning, with the goal of enhancing the automation, efficiency, and fairness of negotiations. By integrating social network analysis and machine learning techniques, the model can effectively identify and classify potential adversaries in the pre-negotiation phase, significantly reducing the need for human intervention and enabling dynamic strategy adjustments during the negotiation process. A series of experiments confirms the effectiveness of the proposed model. Specifically, by utilizing opponent selection and classification in the pre-negotiation phase, the model enhances the autonomy of the negotiation agent. Furthermore, through the introduction of early opponent modeling, the negotiation agent is provided with a new way to utilize the data, which enables it to adjust the strategy preferences based on the strength and type of the relationship with the opponents, and provides a solid foundation for the entire negotiation process. Additionally, the integration of pre-negotiation analysis with strategy adjustments during the negotiation phase optimizes expectation management and balances long- and short-term strategies by incorporating the expected recovery rate and the adjustment discount factor, thereby improving negotiation outcomes.
However, although this study has conducted substantial work in the preprocessing phase of automated negotiation and achieved certain effectiveness, there remain limitations that require further improvement. First, the negotiation agents in our model primarily exchange quantitative offers focused on numerical attributes such as price or delivery terms. This design overlooks potential qualitative factors in negotiations, such as service quality, which may constrain the model’s capability to handle complex multi-attribute negotiation scenarios. Additionally, despite the model’s scalability, it is primarily suited for bilateral negotiations and is particularly effective in fixed-item scenarios, such as negotiations involving specific product categories within supply chains. These limitations may restrict the model’s applicability in broader negotiation contexts.
To address these limitations, future research will focus on exploring new approaches, including expanding the model to incorporate multi-attribute factors and developing more advanced opponent modeling techniques to enhance both the adaptability of negotiation contexts and the accuracy of predictions.
Author Contributions
Y.Z.: Conceptualization, Investigation, Methodology, Software, Writing—Original Draft. J.W.: Funding. Acquisition, Methodology, Data Curation, Visualization. R.C.: Project Administration, Supervision, Validation, Writing—Review and Editing. All authors have read and agreed to the published version of the manuscript.
Funding
This research was funded by [National Natural Science Foundation of China] grant number [71972177] And the APC was funded by [National Natural Science Foundation of China].
Data Availability Statement
The datasets generated during and/or analyzed during the current study are available from the corresponding author on reasonable request.
Conflicts of Interest
The authors declare no conflict of interest.
References
- Kenney, M.; Zysman, J. The platform economy: Restructuring the space of capitalist accumulation. Camb. J. Reg. Econ. Soc. 2020, 13, 55–76. [Google Scholar] [CrossRef]
- Jiang, Y.Q.; Wu, M.X.; Li, X.H. Cooperation mechanism, product quality, and consumer segment in group buying. Electron. Commer. Res. Appl. 2024, 64, 101357. [Google Scholar] [CrossRef]
- Yadav, R.; Bhatnagar, S. Channel collaboration in e-commerce: A study on channel relationship from the perspective of vendors selling on online platforms, the e-retailers. In Transforming Organizations Through Flexible Systems Management; Springer: Singapore, 2020; pp. 223–241. [Google Scholar]
- Liang, C.-C.; Liang, W.-Y.; Tseng, T.-L. Evaluation of intelligent agents in consumer-to-business e-Commerce. Comput. Stand. Interfaces 2019, 65, 122–131. [Google Scholar] [CrossRef]
- Gao, T.-G.; Huang, M.; Wang, Q.; Wang, X.-W. Dynamic organization model of automated negotiation for 3PL providers selection. Inf. Sci. 2020, 531, 139–158. [Google Scholar] [CrossRef]
- Moghadam, F.S.; Zarandi, M.F. Mitigating bullwhip effect in an agent-based supply chain through a fuzzy reverse ultimatum game negotiation module. Appl. Soft Comput. 2022, 116, 108278. [Google Scholar] [CrossRef]
- Bagga, P.; Paoletti, N.; Alrayes, B.; Stathis, K. ANEGMA: An automated negotiation model for e-markets. Auton. Agents Multi-Agent Syst. 2021, 35, 27. [Google Scholar] [CrossRef]
- Yang, C.H.; Sun, J.Y. Research on Negotiation of Manufacturing Enterprise Supply Chain Based on Multi-agent. J. Internet Technol. 2019, 20, 389–398. [Google Scholar]
- Tesfay, T.; Haouzi, H.B.E.; Demesure, G.; Pannequin, R.; Thomas, A. Multi-agent systems negotiation to deal with dynamic scheduling in disturbed industrial context. J. Intell. Manuf. 2019, 31, 1367–1382. [Google Scholar]
- Pan, Y.H.; Zhang, H.Y.; Zeng, Y.F.; Ma, B.Y.; Tang, J.; Ming, Z. Diversifying agent’s behaviors in interactive decision models. Int. J. Intell. Syst. 2022, 37, 12035–12056. [Google Scholar] [CrossRef]
- Keskin, M.O.; Buzcu, B.; Aydogan, R. Conflict-based negotiation strategy for human-agent negotiation. Appl. Intell. 2023, 53, 29741–29757. [Google Scholar] [CrossRef]
- Cao, M.K.; Hu, Q.; Kiang, M.Y.; Hong, H. A Portfolio Strategy Design for Human-Computer Negotiations in e-Retail. Int. J. Electron. Commer. 2020, 24, 305–337. [Google Scholar] [CrossRef]
- Imran, K.; Zhang, J.; Pal, A.; Khattak, A.; Ullah, K.; Baig, S.M. Bilateral negotiations for electricity market by adaptive agent-tracking strategy. Electr. Power Syst. Res. 2020, 186, 106390. [Google Scholar] [CrossRef]
- Hao, J.; Song, S.; Leung, H.-f.; Ming, Z. An efficient and robust negotiating strategy in bilateral negotiations over multiple items. Eng. Appl. Artif. Intell. 2014, 34, 45–57. [Google Scholar] [CrossRef]
- Eshragh, F.; Shahbazi, M.; Far, B. Real-time opponent learning in automated negotiation using recursive Bayesian filtering. Expert Syst. Appl. 2019, 128, 28–53. [Google Scholar] [CrossRef]
- Wu, J.; Sun, Y.; Li, Y.; Qie, X. A Q-learning approach to generating behavior of emotional persuasion with adaptive time belief in decision-making of agent-based negotiation. Inf. Sci. 2023, 642, 119158. [Google Scholar] [CrossRef]
- Wu, J.; Chen, H.; Li, Y.; Liu, Y. A Behavioral Assessment Model for Emotional Persuasion Driven by Agent-Based Decision-Making. Expert Syst. Appl. 2022, 204, 117556. [Google Scholar] [CrossRef]
- Yao, J.; Storme, M. Trust Building via Negotiation: Immediate versus Lingering Effects of General Trust and Negotiator Satisfaction. Group Decis. Negot. 2021, 30, 507–528. [Google Scholar] [CrossRef]
- Kimiagari, S.; Keivanpour, S.; Jolai, F.; Moazami, M. Application of fuzzy group analytic hierarchy process in partner selection of international joint venture projects. Sci. Iran. 2016, 23, 2959–2976. [Google Scholar] [CrossRef]
- Panzarasa, P.; Jennings, N.R. Social influence, negotiation and cognition. Simul. Model. Pract. Theory 2002, 10, 417–453. [Google Scholar] [CrossRef]
- Zhou, H.Z.; Zhan, J.Y.; Ma, W.J. A negotiation protocol with recommendation for multilateral negotiation in trust networks. Expert Syst. Appl. 2024, 246, 123185. [Google Scholar] [CrossRef]
- Baarslag, T.; Hendrikx, M.J.C.; Hindriks, K.V.; Jonker, C.M. Learning about the opponent in automated bilateral negotiation: A comprehensive survey of opponent modeling techniques. Auton. Agents Multi-Agent Syst. 2016, 30, 849–898. [Google Scholar] [CrossRef]
- Munroe, S.; Luck, M. Motivation-based selection of negotiation opponents. In Engineering Societies in the Agents World V; Lecture Notes in Artificial Intelligence; Gleizes, M.P., Omicini, A., Zambonelli, F., Eds.; Springer: Berlin/Heidelberg, Germany, 2005; Volume 3451, pp. 119–138. [Google Scholar]
- Hou, Y.Q.; Sun, M.Y.; Zhu, W.X.; Zeng, Y.F.; Piao, H.Y.; Chen, X.F.; Zhang, Q. Behavior Reasoning for Opponent Agents in Multi-Agent Learning Systems. IEEE Trans. Emerg. Top. Comput. Intell. 2022, 6, 1125–1136. [Google Scholar] [CrossRef]
- Liu, C.J.; Cong, J.M.; Zhao, T.H.; Zhu, E. Improving Agent Decision Payoffs via a New Framework of Opponent Modeling. Mathematics 2023, 11, 3062. [Google Scholar] [CrossRef]
- Talman, S.; Hadad, M.; Gal, Y.a.; Kraus, S. Adapting to agents’ personalities in negotiation. In Proceedings of the Fourth International Joint Conference on Autonomous Agents and Multiagent Systems, Auckland, New Zealand, 25–29 July 2005; pp. 383–389. [Google Scholar]
- Schröter, K.; Urbig, D. C-IPS: Specifying decision interdependencies in negotiations. In Multiagent System Technologies, Proceedings; Lecture Notes in Computer Science; Lindemann, G., Denzinger, J., Timm, I.J., Unland, R., Eds.; Springer: Berlin/Heidelberg, Germany, 2004; Volume 3187, pp. 114–125. [Google Scholar]
- Cheng, K.; Guo, X.; Cui, X.; Shan, F. Dynamical modeling, analysis, and control of information diffusion over social networks: A deep learning-based recommendation algorithm in social network. Discret. Dyn. Nat. Soc. 2020, 2020, 3273451. [Google Scholar] [CrossRef]
- Beauprez, E.; Caron, A.C.; Morge, M.; Routier, J.C. A Multi-Agent Negotiation Strategy for Reducing the Flowtime. In Proceedings of the 13th International Conference on Agents and Artificial Intelligence (ICAART), Virtual, 4–6 February 2021; pp. 58–68. [Google Scholar]
- Alkasasbeh, A.H.; Badr, E.; Attiya, H.; Shabana, H.M. Radio Number for Friendship Communication Networks. Mathematics 2023, 11, 4232. [Google Scholar] [CrossRef]
- Gong, Y.H.; Chen, L.; Ma, T.H. A Comprehensive Trust Model Based on Social Relationship and Transaction Attributes. Secur. Commun. Netw. 2020, 2020, 8887596. [Google Scholar] [CrossRef]
- Parhizkar, E.; Nikravan, M.H.; Holte, R.C.; Zilles, S. Combining Direct Trust and Indirect Trust in Multi-Agent Systems. In Proceedings of the 29th International Joint Conference on Artificial Intelligence, Yokohama, Japan, 7–15 January 2021; pp. 311–317. [Google Scholar]
- Player, C.; Griffiths, N. Improving trust and reputation assessment with dynamic behaviour. Knowl. Eng. Rev. 2020, 35, e29. [Google Scholar] [CrossRef]
- Hu, L.; Wang, Z. Partner selection of GSC for furniture industry based on method of entropy correction G1-TOPSIS. J. Cent. South Univ. For. Technol. 2018, 38, 129–135. [Google Scholar]
- Kadowaki, K.; Kobayashi, K.; Kitamura, Y. Influence of social relationships on multiagent persuasion. In Proceedings of the 7th International Joint Conference on Autonomous Agents and Multiagent Systems, Estoril, Portugal, 12–16 May 2008; Volume 3, pp. 1221–1224. [Google Scholar]
- Jennings, N.R.; Faratin, P.; Lomuscio, A.R.; Parsons, S.; Sierra, C.; Wooldridge, M. Automated negotiation: Prospects, methods and challenges. Int. J. Group Decis. Negot. 2001, 10, 199–215. [Google Scholar] [CrossRef]
- Kiruthika, U.; Somasundaram, T.S.; Raja, S.K.S. Lifecycle Model of a Negotiation Agent: A Survey of Automated Negotiation Techniques. Group Decis. Negot. 2020, 29, 1239–1262. [Google Scholar] [CrossRef]
- Pandian, J.A.; Thirunavukarasu, R.; Mariappan, L.T. Enhancing lane detection in autonomous vehicles with multi-armed bandit ensemble learning. Sci. Rep. 2025, 15, 3198. [Google Scholar] [CrossRef] [PubMed]
- Hu, J.; Zou, L.; Xu, R. Bilateral Multi-Issue Negotiation Model for a Kind of Complex Environment. Int. Arab J. Inf. Technol. 2018, 15, 396–404. [Google Scholar]
- Sim, K.M.; Guo, Y.Y.; Shi, B.Y. BLGAN: Bayesian Learning and Genetic Algorithm for Supporting Negotiation With Incomplete Information. IEEE Trans. Syst. Man Cybern. Part B-Cybern. 2009, 39, 198–211. [Google Scholar] [CrossRef]
- Mell, J.; Beissinger, M.; Gratch, J. An expert-model and machine learning hybrid approach to predicting human-agent negotiation outcomes in varied data. J. Multimodal User Interfaces 2021, 15, 215–227. [Google Scholar] [CrossRef]
- Chen, L.; Dong, H.; Zhou, Y. A reinforcement learning optimized negotiation method based on mediator agent. Expert Syst. Appl. 2014, 41, 7630–7640. [Google Scholar] [CrossRef]
- Wang, Y.; Liang, X. Application of Reinforcement Learning Methods Combining Graph Neural Networks and Self-Attention Mechanisms in Supply Chain Route Optimization. Sensors 2025, 25, 955. [Google Scholar] [CrossRef]
- Liu, Y.; Yang, T.; Tian, L.; Pei, J. SGD-TripleQNet: An Integrated Deep Reinforcement Learning Model for Vehicle Lane-Change Decision. Mathematics 2025, 13, 235. [Google Scholar] [CrossRef]
- Adamic, L.A.; Adar, E. Friends and neighbors on the web. Soc. Netw. 2003, 25, 211–230. [Google Scholar] [CrossRef]
- Samoylenko, I.; Aleja, D.; Primo, E.; Alfaro-Bittner, K.; Vasilyeva, E.; Kovalenko, K.; Musatov, D.; Raigorodskii, A.M.; Criado, R.; Romance, M.; et al. Why Are There Six Degrees of Separation in a Social Network? Phys. Rev. X 2023, 13, 021032. [Google Scholar] [CrossRef]
- Yang, C.; Liu, T.T.; Liu, L.; Chen, X.H.; Hao, Z.Y. A Personalized Friend Recommendation Method Combining Network Structure Features and Interaction Information. In Proceedings of the 9th International Conference on Swarm Intelligence (ICSI), Shanghai, China, 17–22 July 2018; pp. 267–274. [Google Scholar]
- Milgram, S. The small world problem. Psychol. Today 1967, 2, 60–67. [Google Scholar]
- Heider, F. The Psychology of Interpersonal Relations; Psychology Press: New York, NY, USA, 2013. [Google Scholar]
- Liu, M.; Guo, J.; Chen, J. Link Prediction in Signed Networks Based on Similarity and Structural Balance Theory. Adv. Eng. Sci. 2018, 50, 161–169. [Google Scholar]
- Zhang, B.; Liu, W.Q.; Zhang, Y.; Yang, R.; Li, M.Z. Implicit Negative Link Prediction With a Network Topology Perspective. IEEE Trans. Comput. Soc. Syst. 2023, 10, 3132–3142. [Google Scholar] [CrossRef]
- Tang, L.; Ma, X.; Zhou, Y.; Shi, X.; Ma, J. Social relations, public interventions and land rent deviation: Evidence from Jiangsu Province in China. Land Use Policy 2019, 86, 406–420. [Google Scholar] [CrossRef]
- Son, B.-G.; Kocabasoglu-Hillmer, C.; Roden, S. A dyadic perspective on retailer–supplier relationships through the lens of social capital. Int. J. Prod. Econ. 2016, 178, 120–131. [Google Scholar] [CrossRef]
- Ye, Z.; Zhong, Z. Benefit expectation, social trust and farmer’s choice of farmland transfer-out contract. J. Arid Land Resour. Environ. 2022, 36, 72–80. [Google Scholar] [CrossRef]
- Leskovec, J.; Huttenlocher, D.; Kleinberg, J. Signed networks in social media. In Proceedings of the SIGCHI Conference on Human Factors in Computing Systems, Atlanta, GA, USA, 10–15 April 2010; pp. 1361–1370. [Google Scholar]
- Wu, J.; Wang, W.; Li, Y. Emotional agents enabled bilateral negotiation: Persuasion strategies generated by agents’ affect infusion and preference. Expert Syst. Appl. 2024, 252, 124202. [Google Scholar] [CrossRef]
- Qie, X.T.; Wu, J.H.; Li, Y.; Sun, Y. A stage model for agent-based emotional persuasion with an adaptive target: From a social exchange perspective. Inf. Sci. 2022, 610, 90–113. [Google Scholar] [CrossRef]
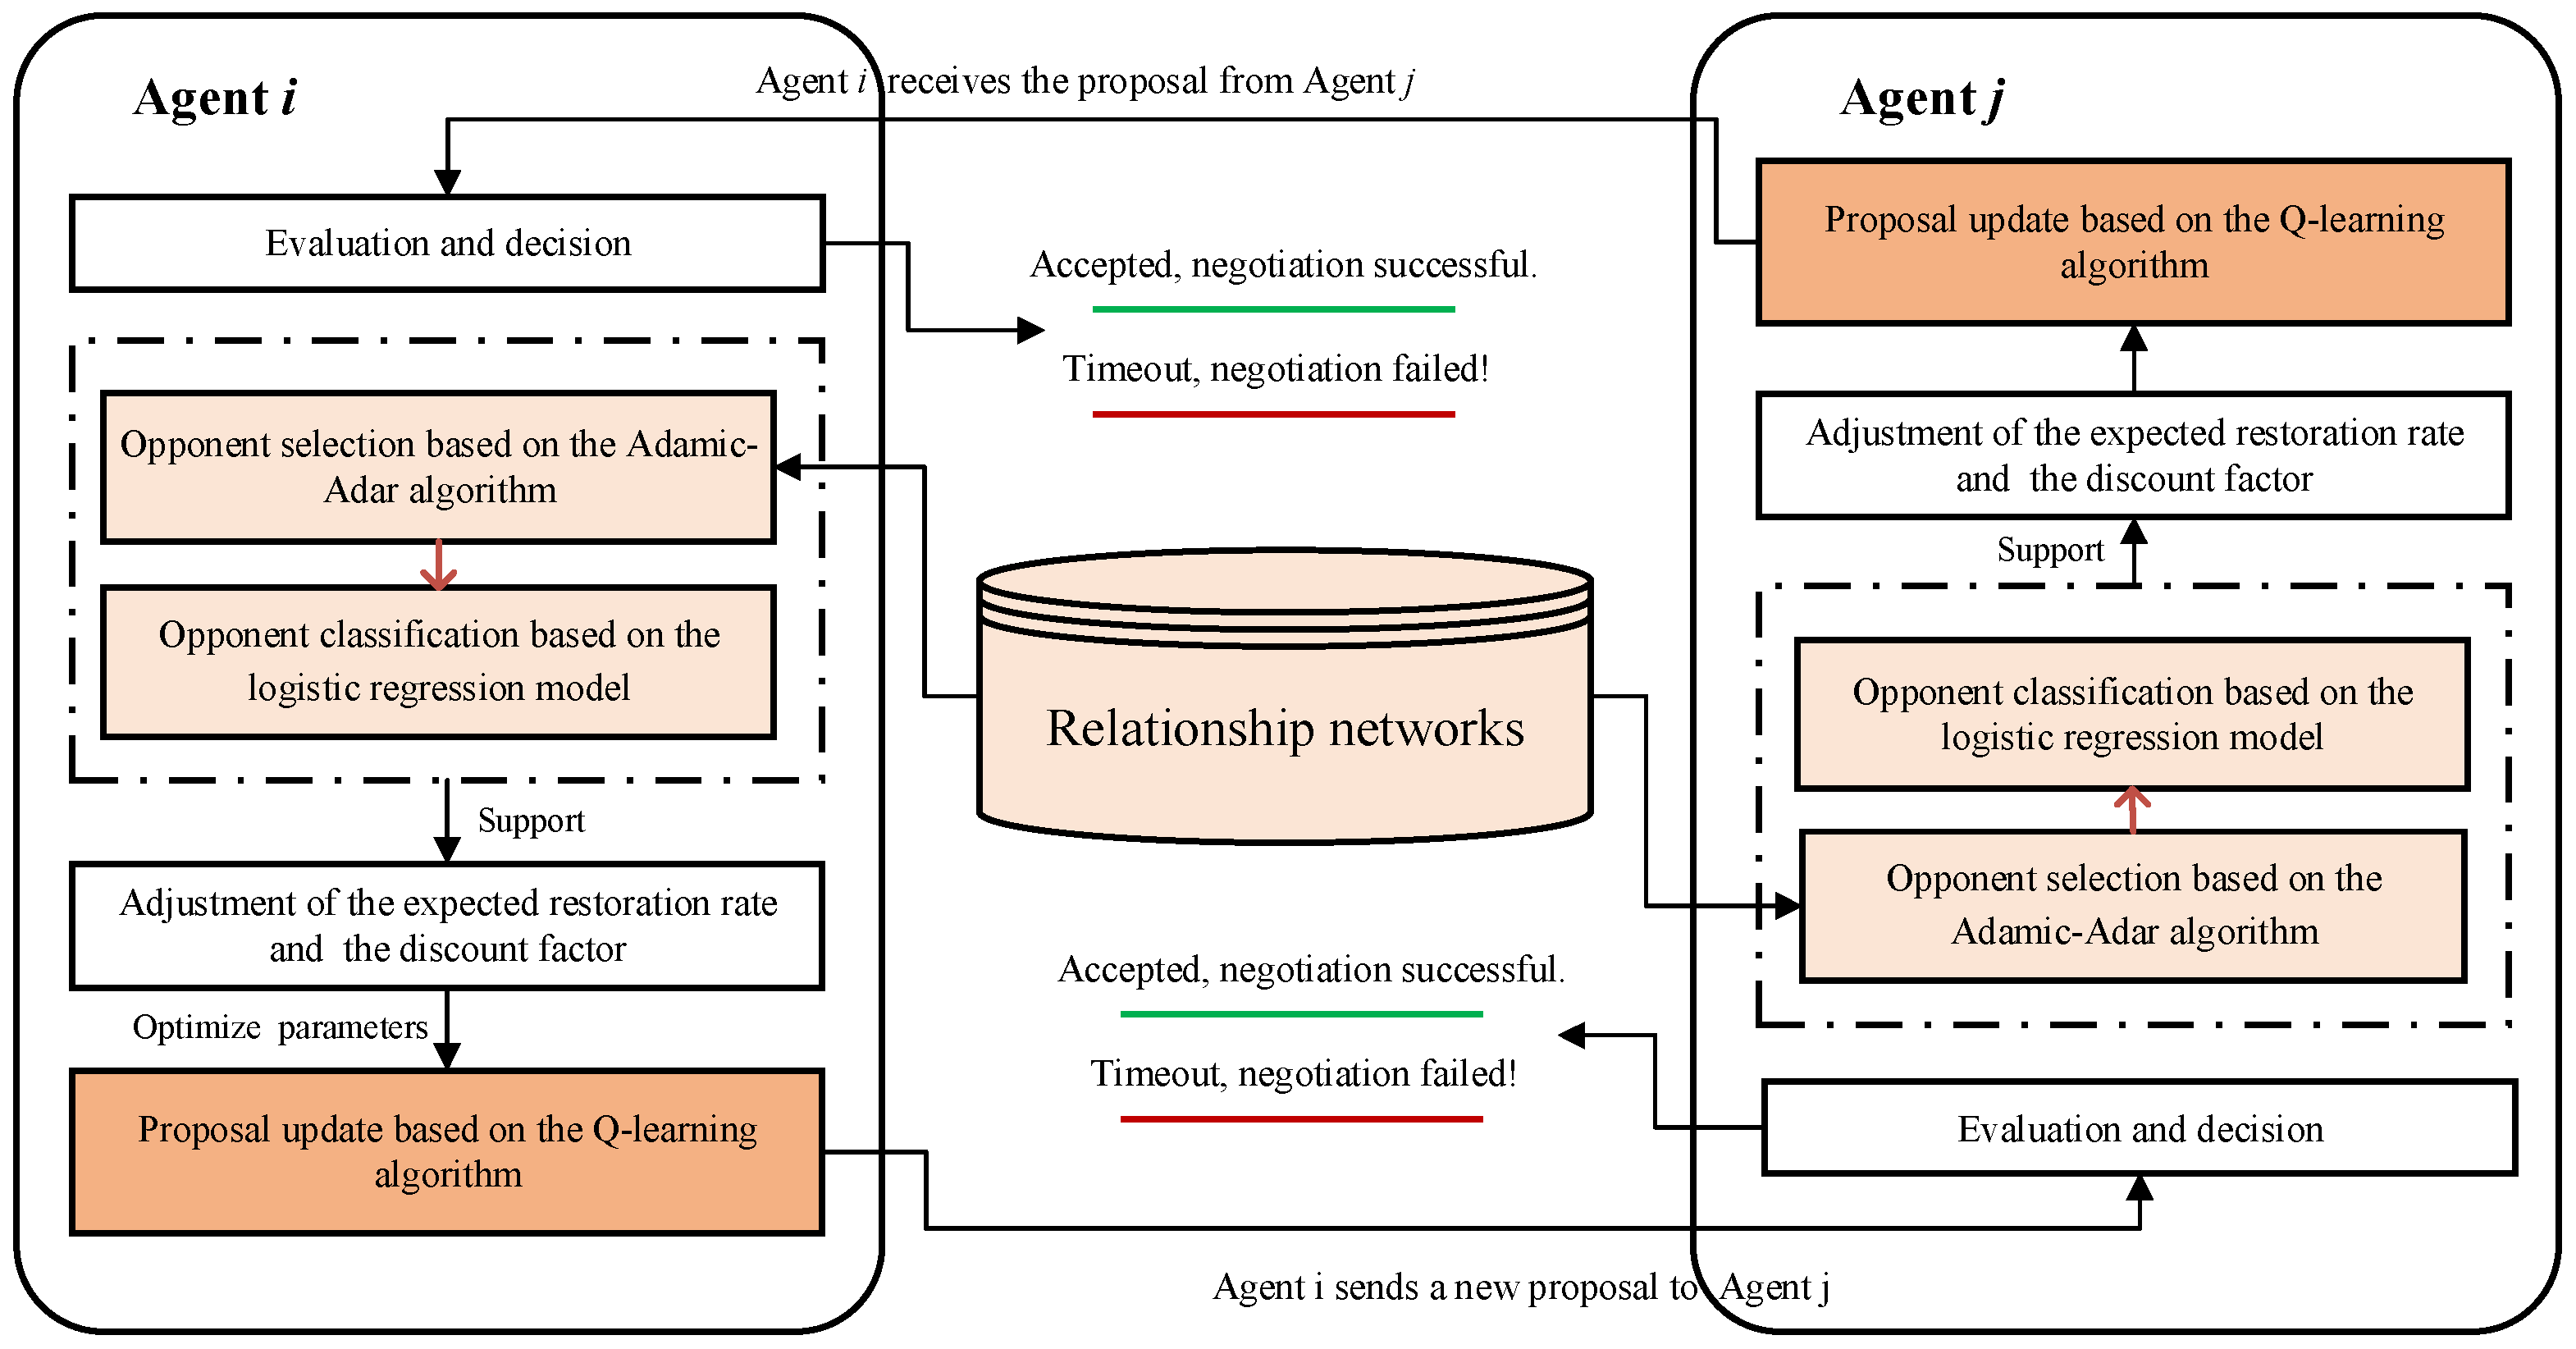
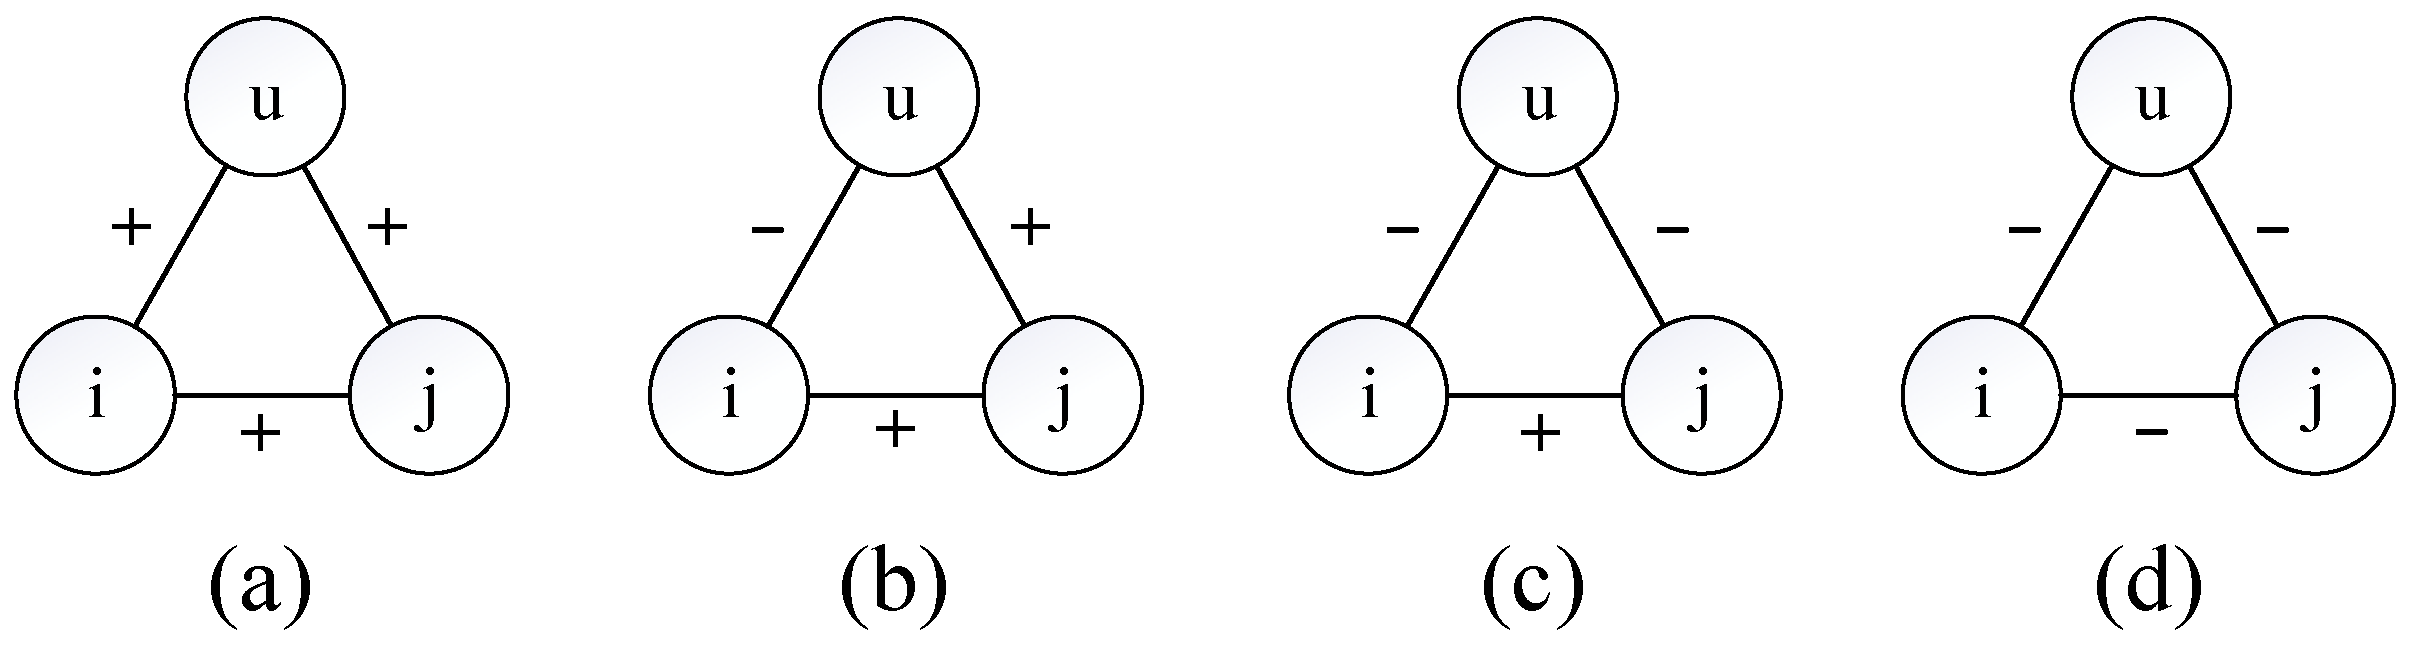
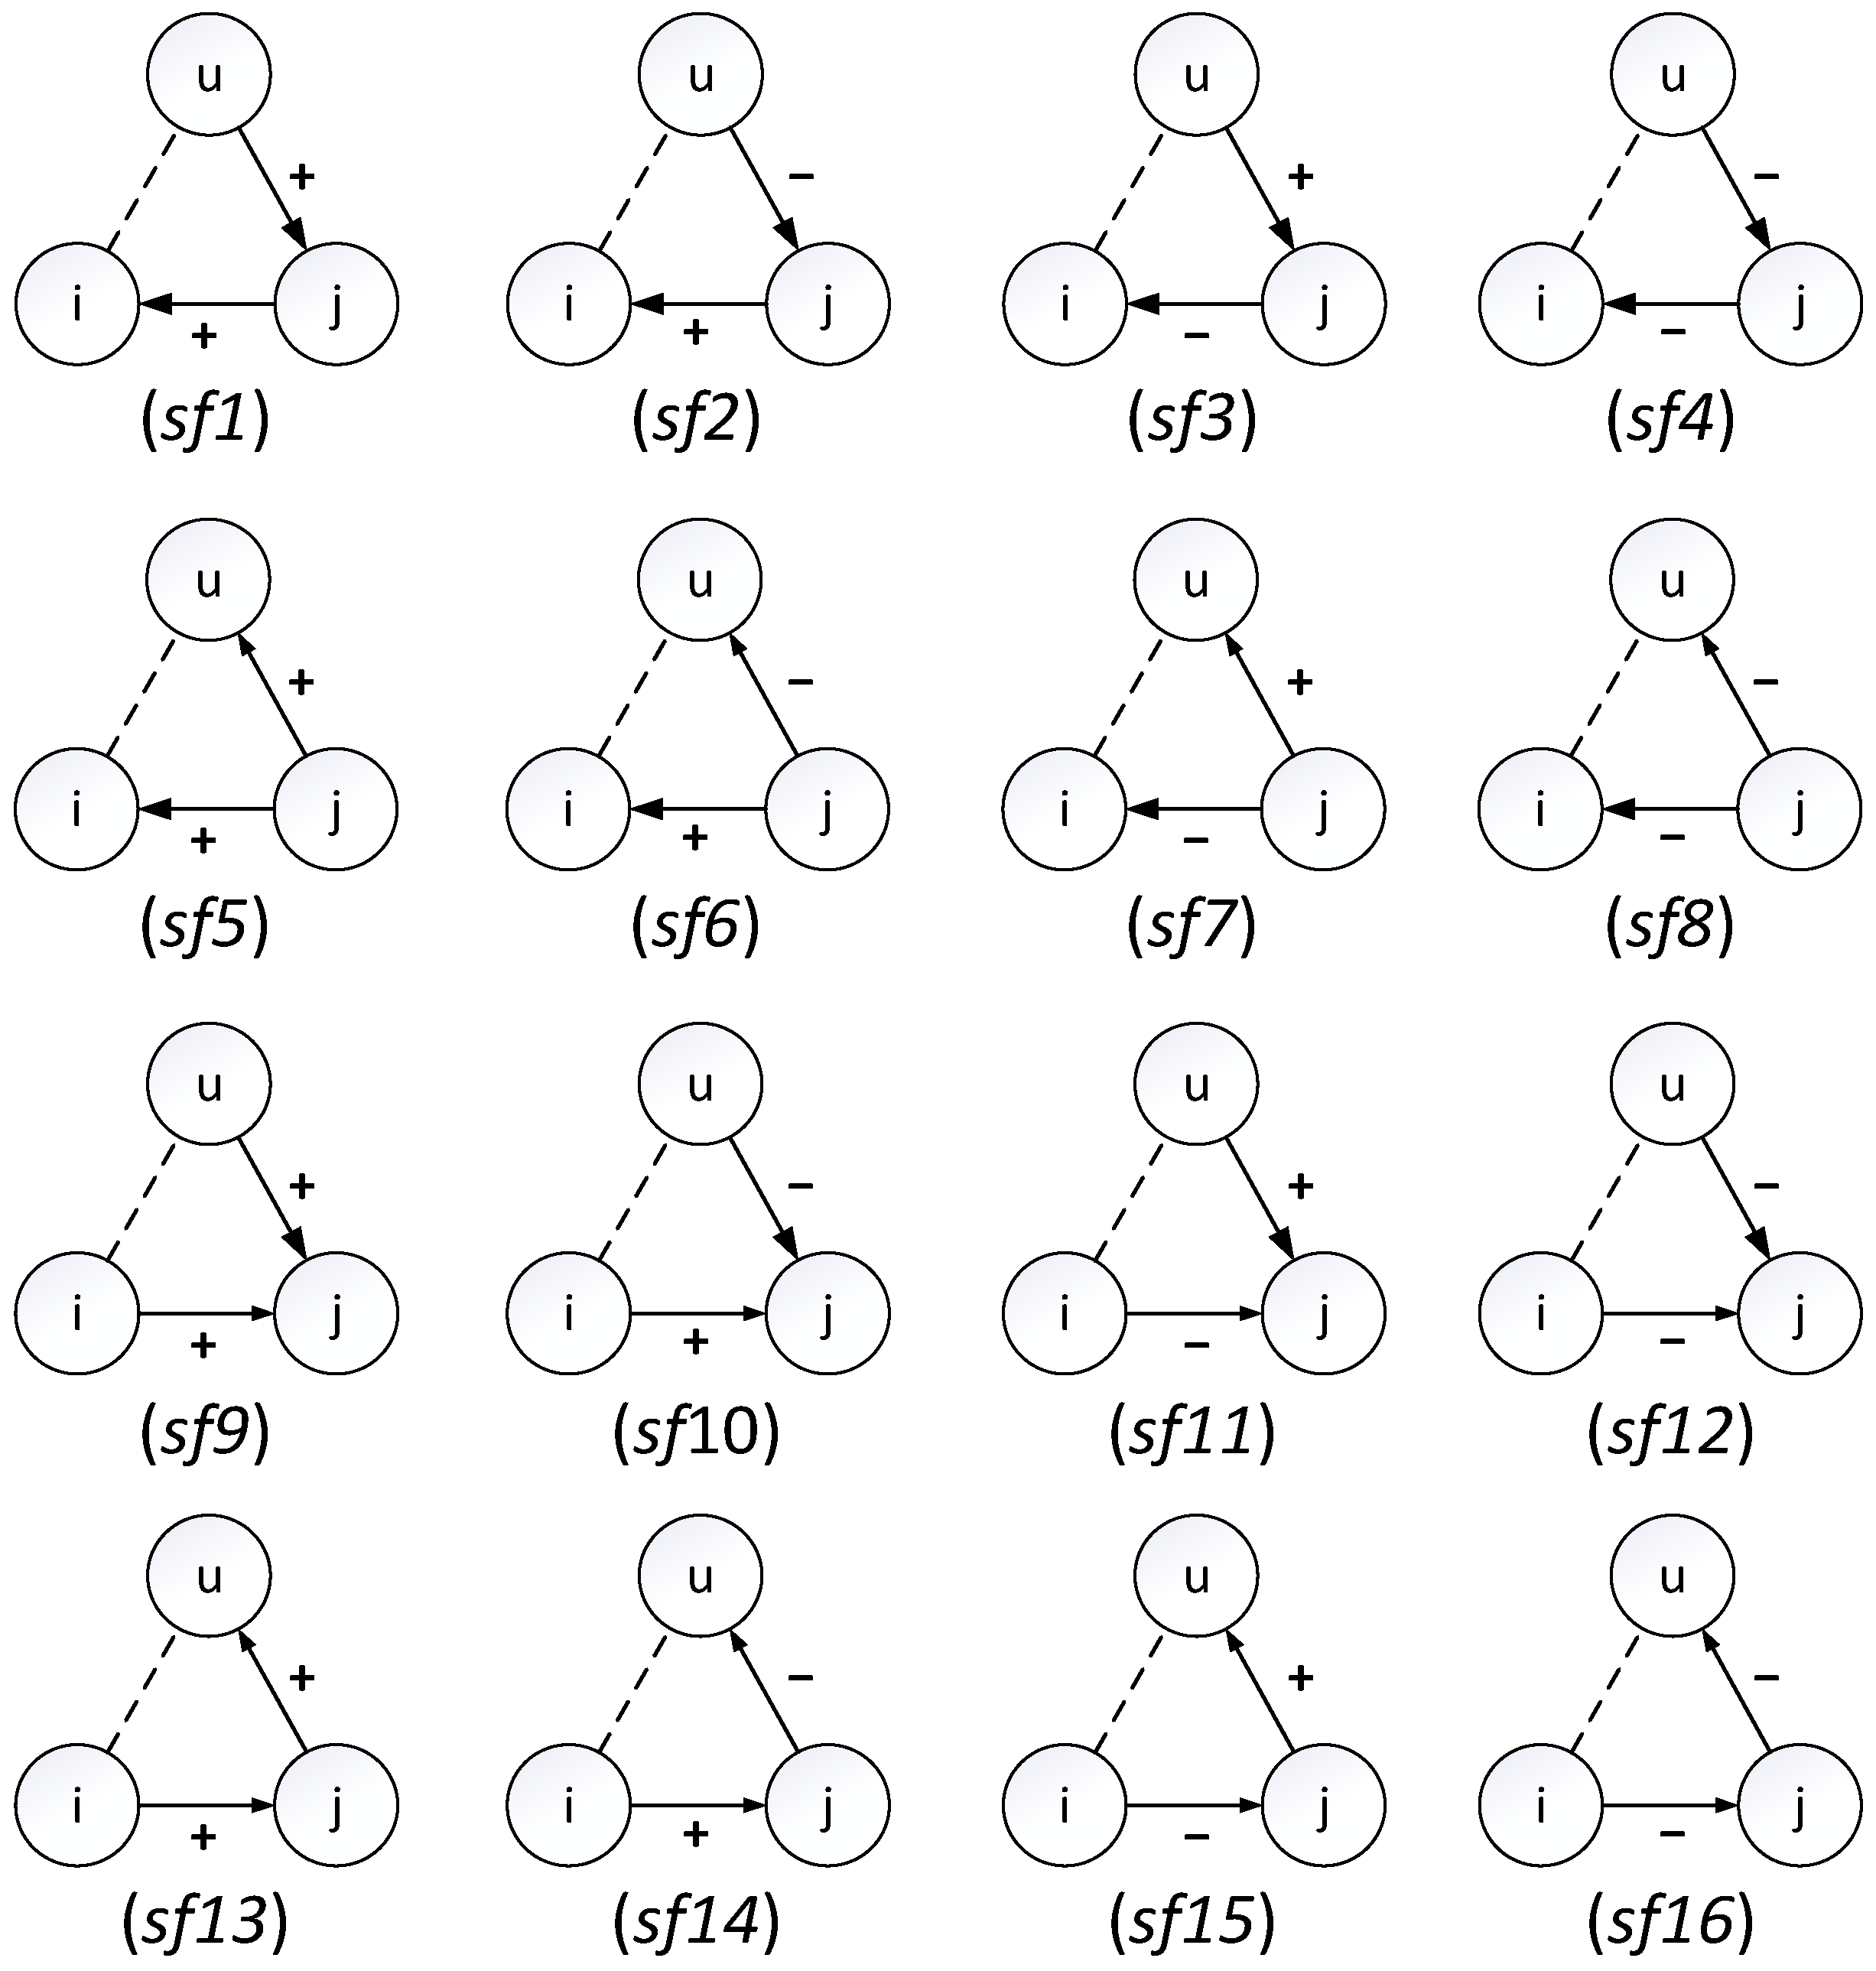

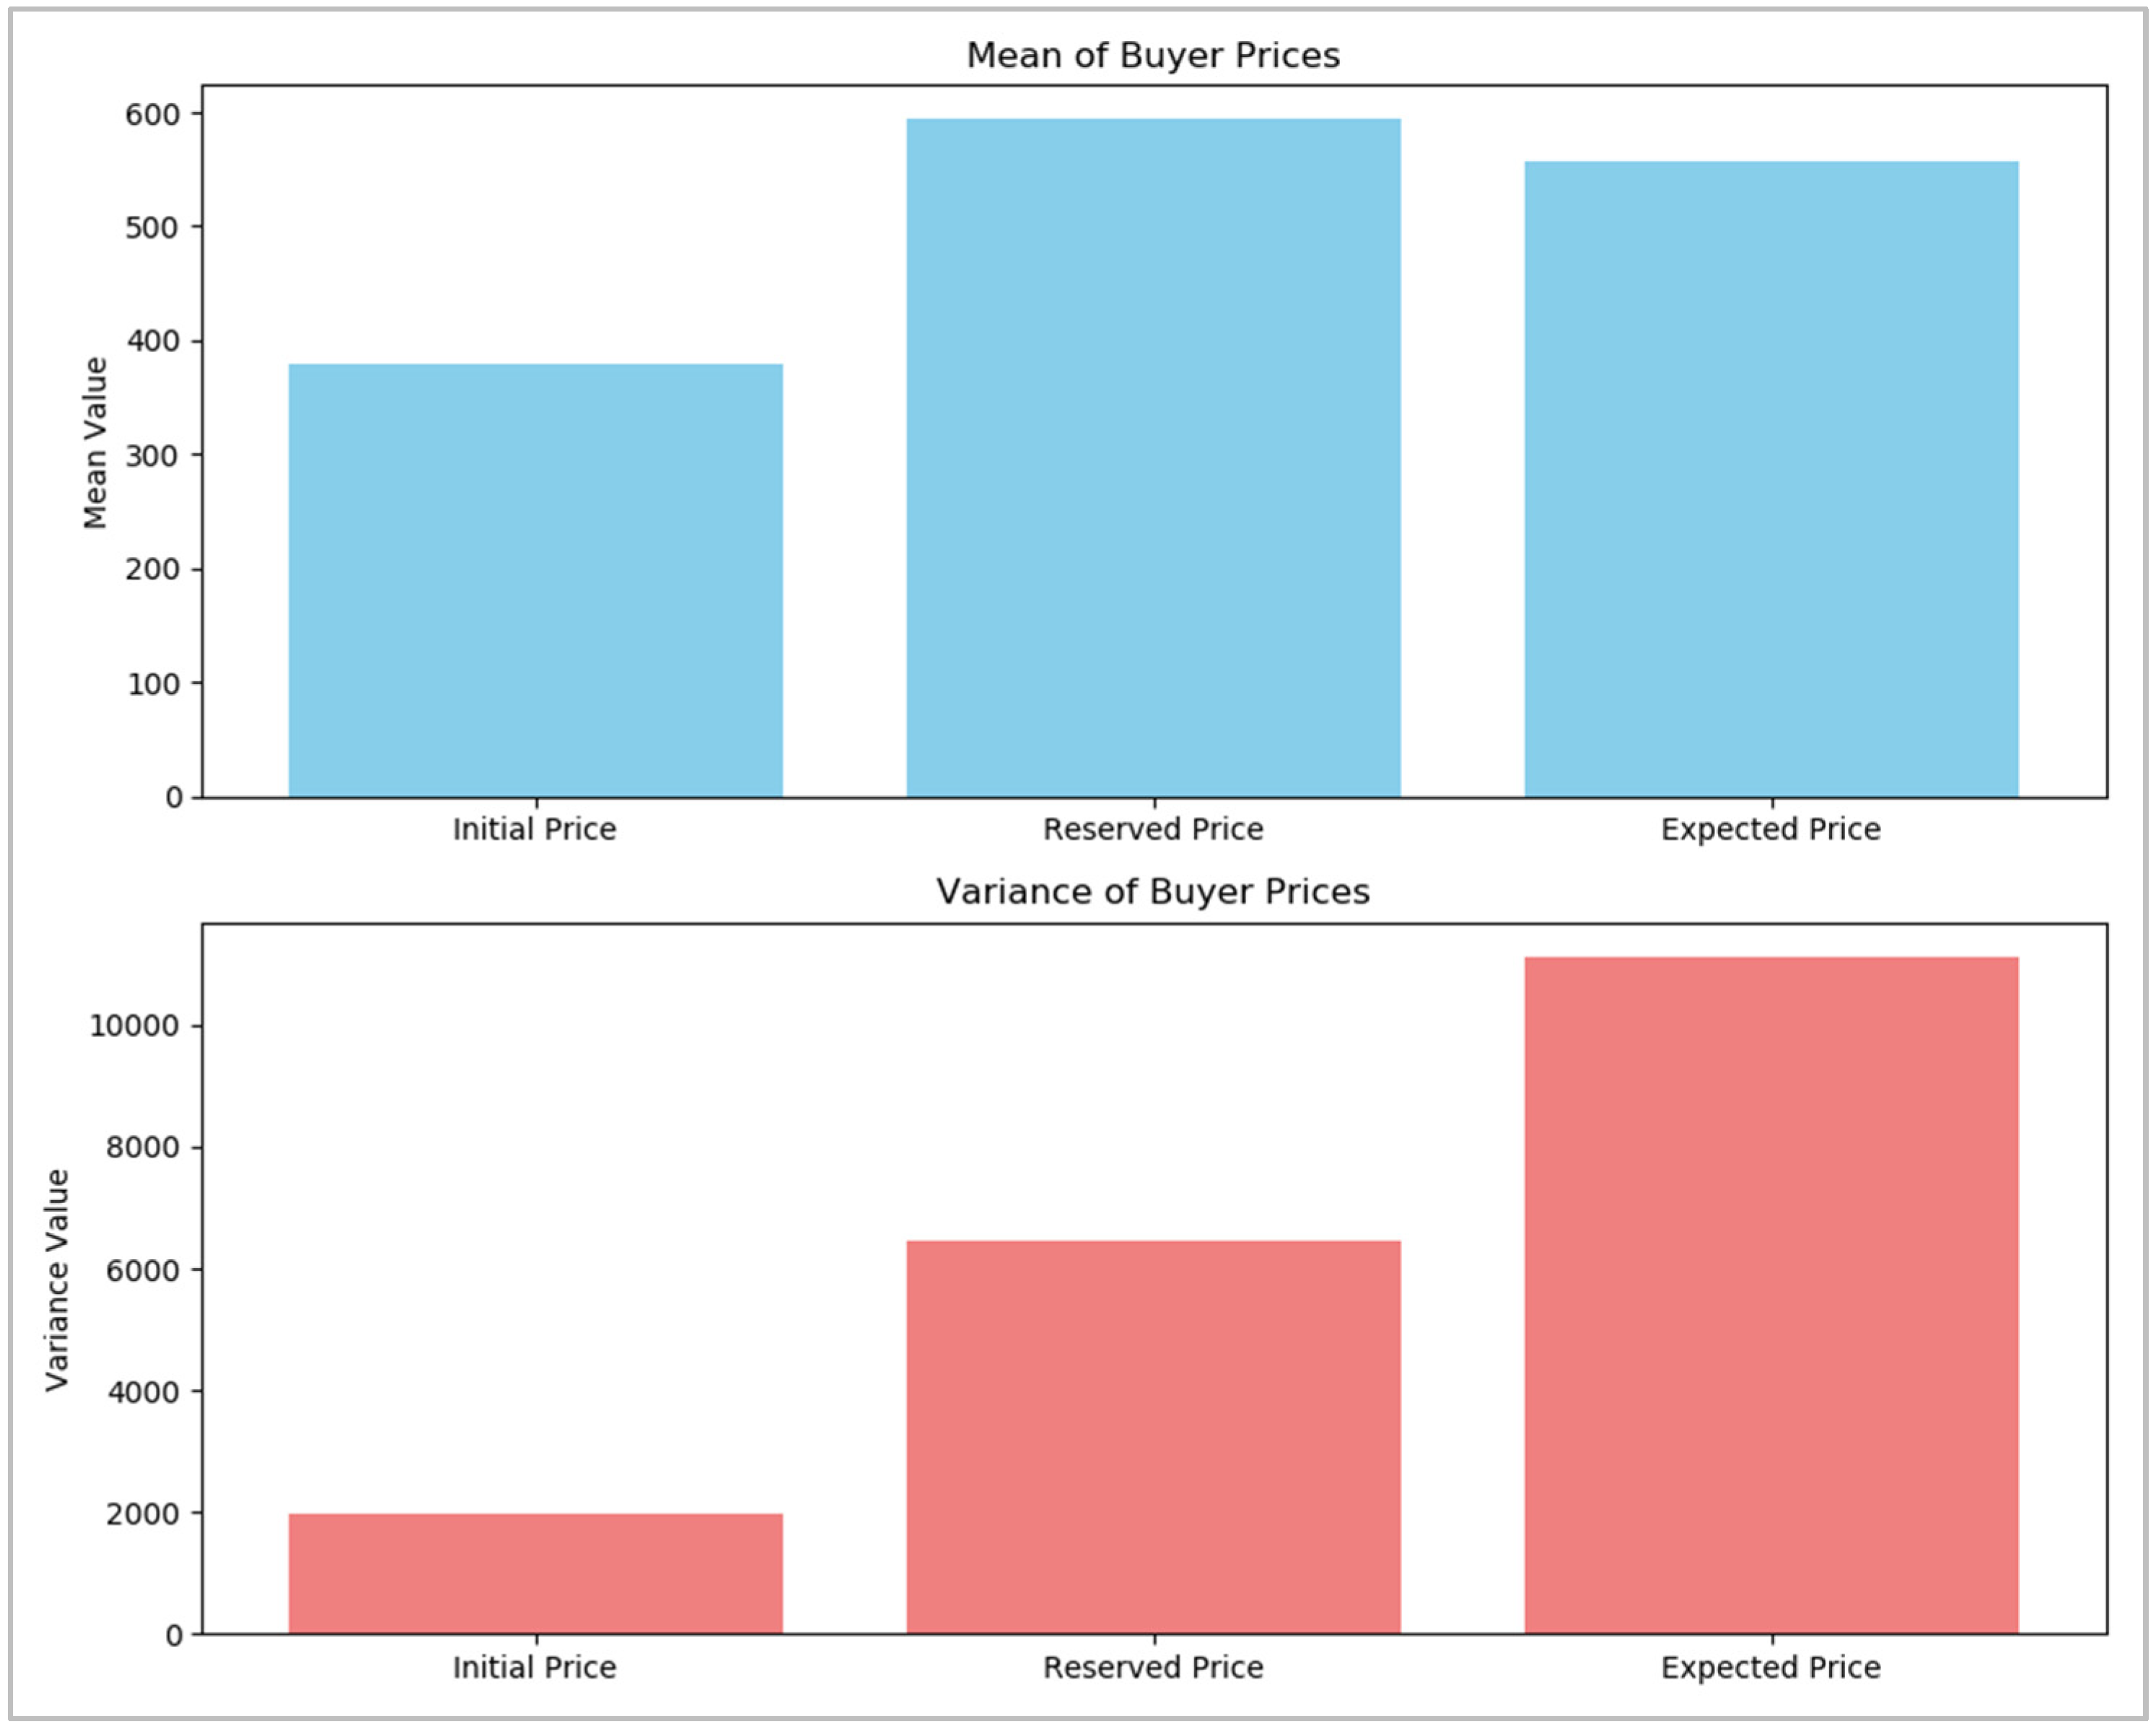
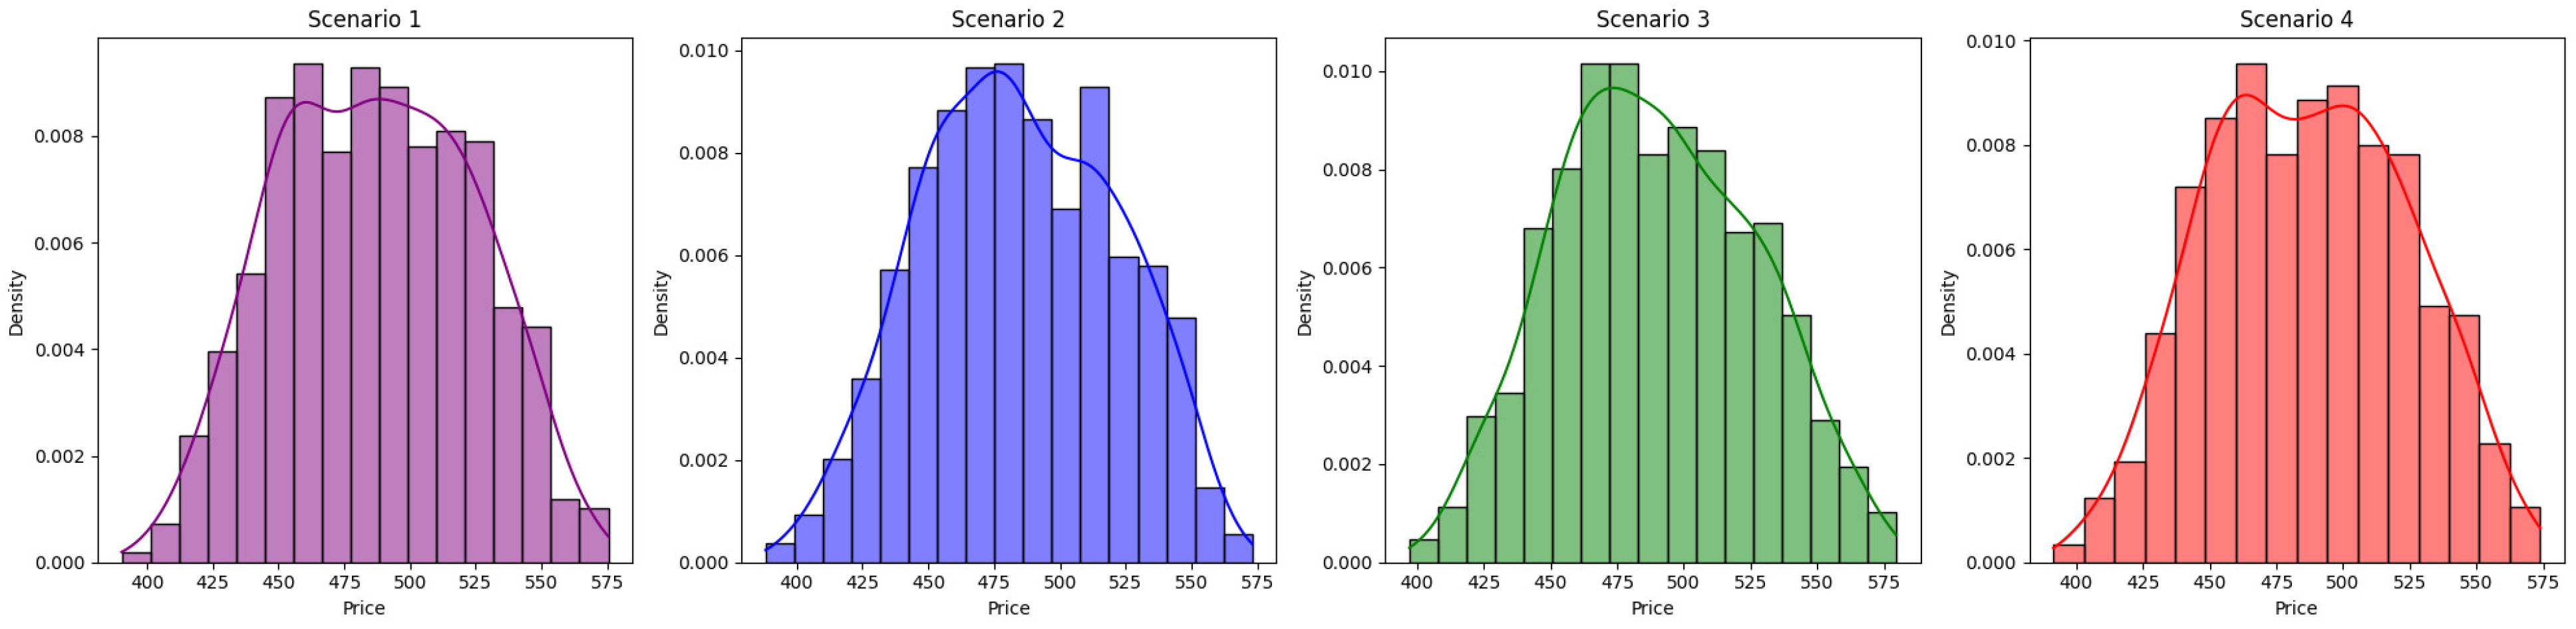
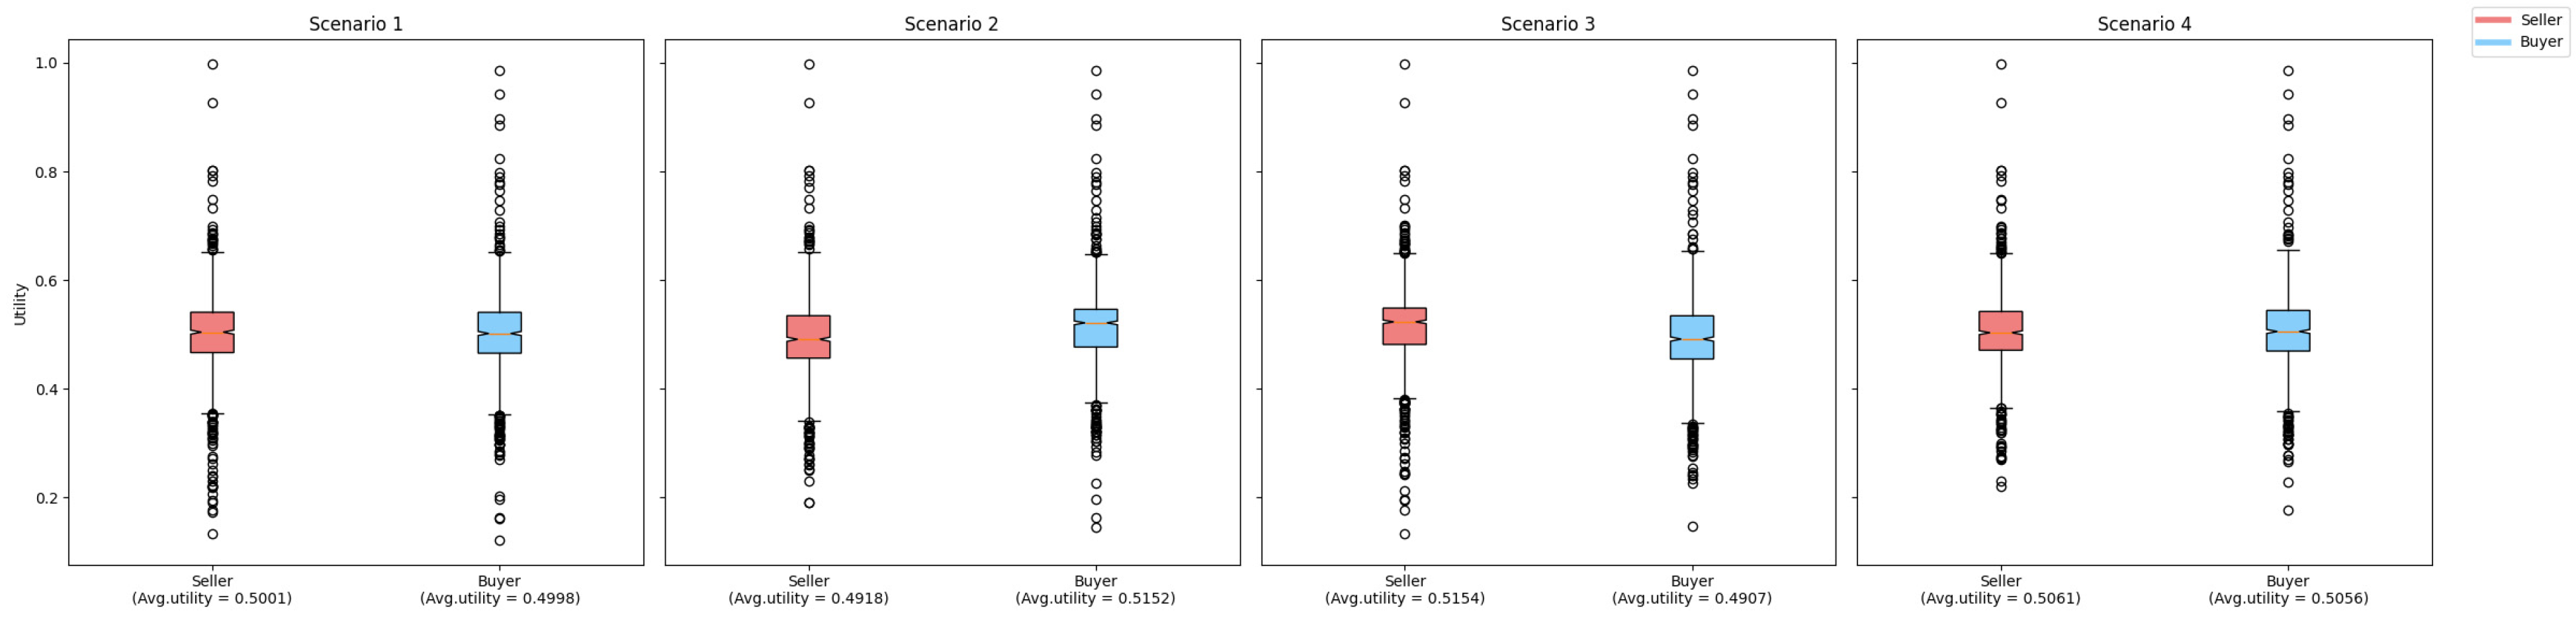
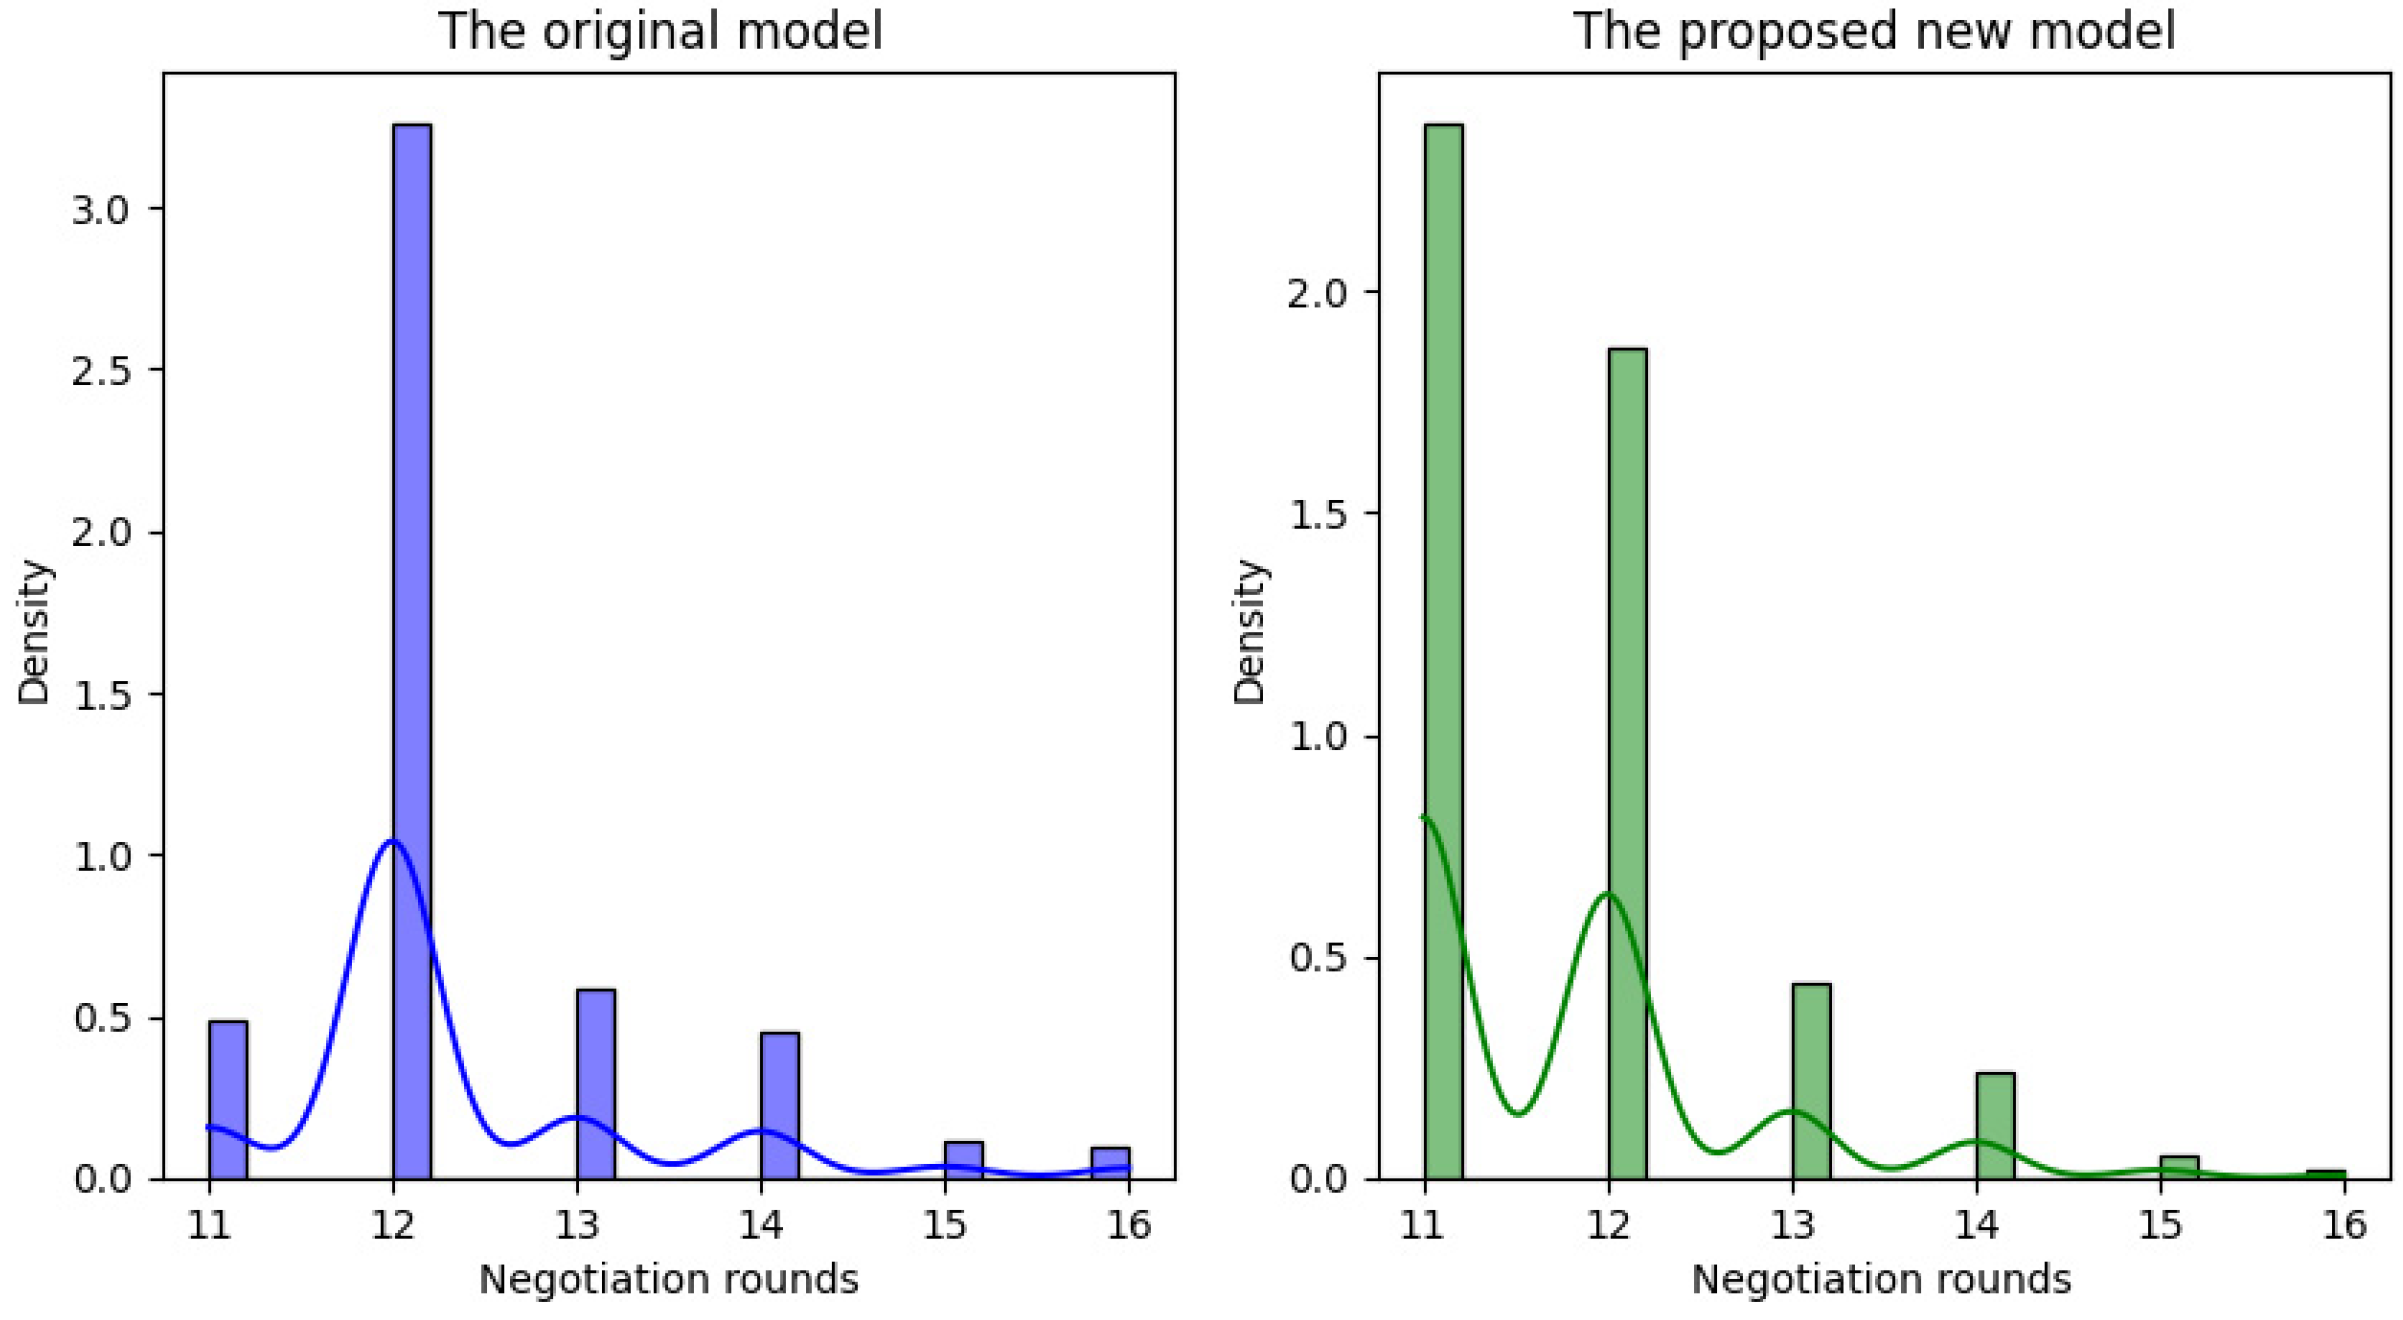


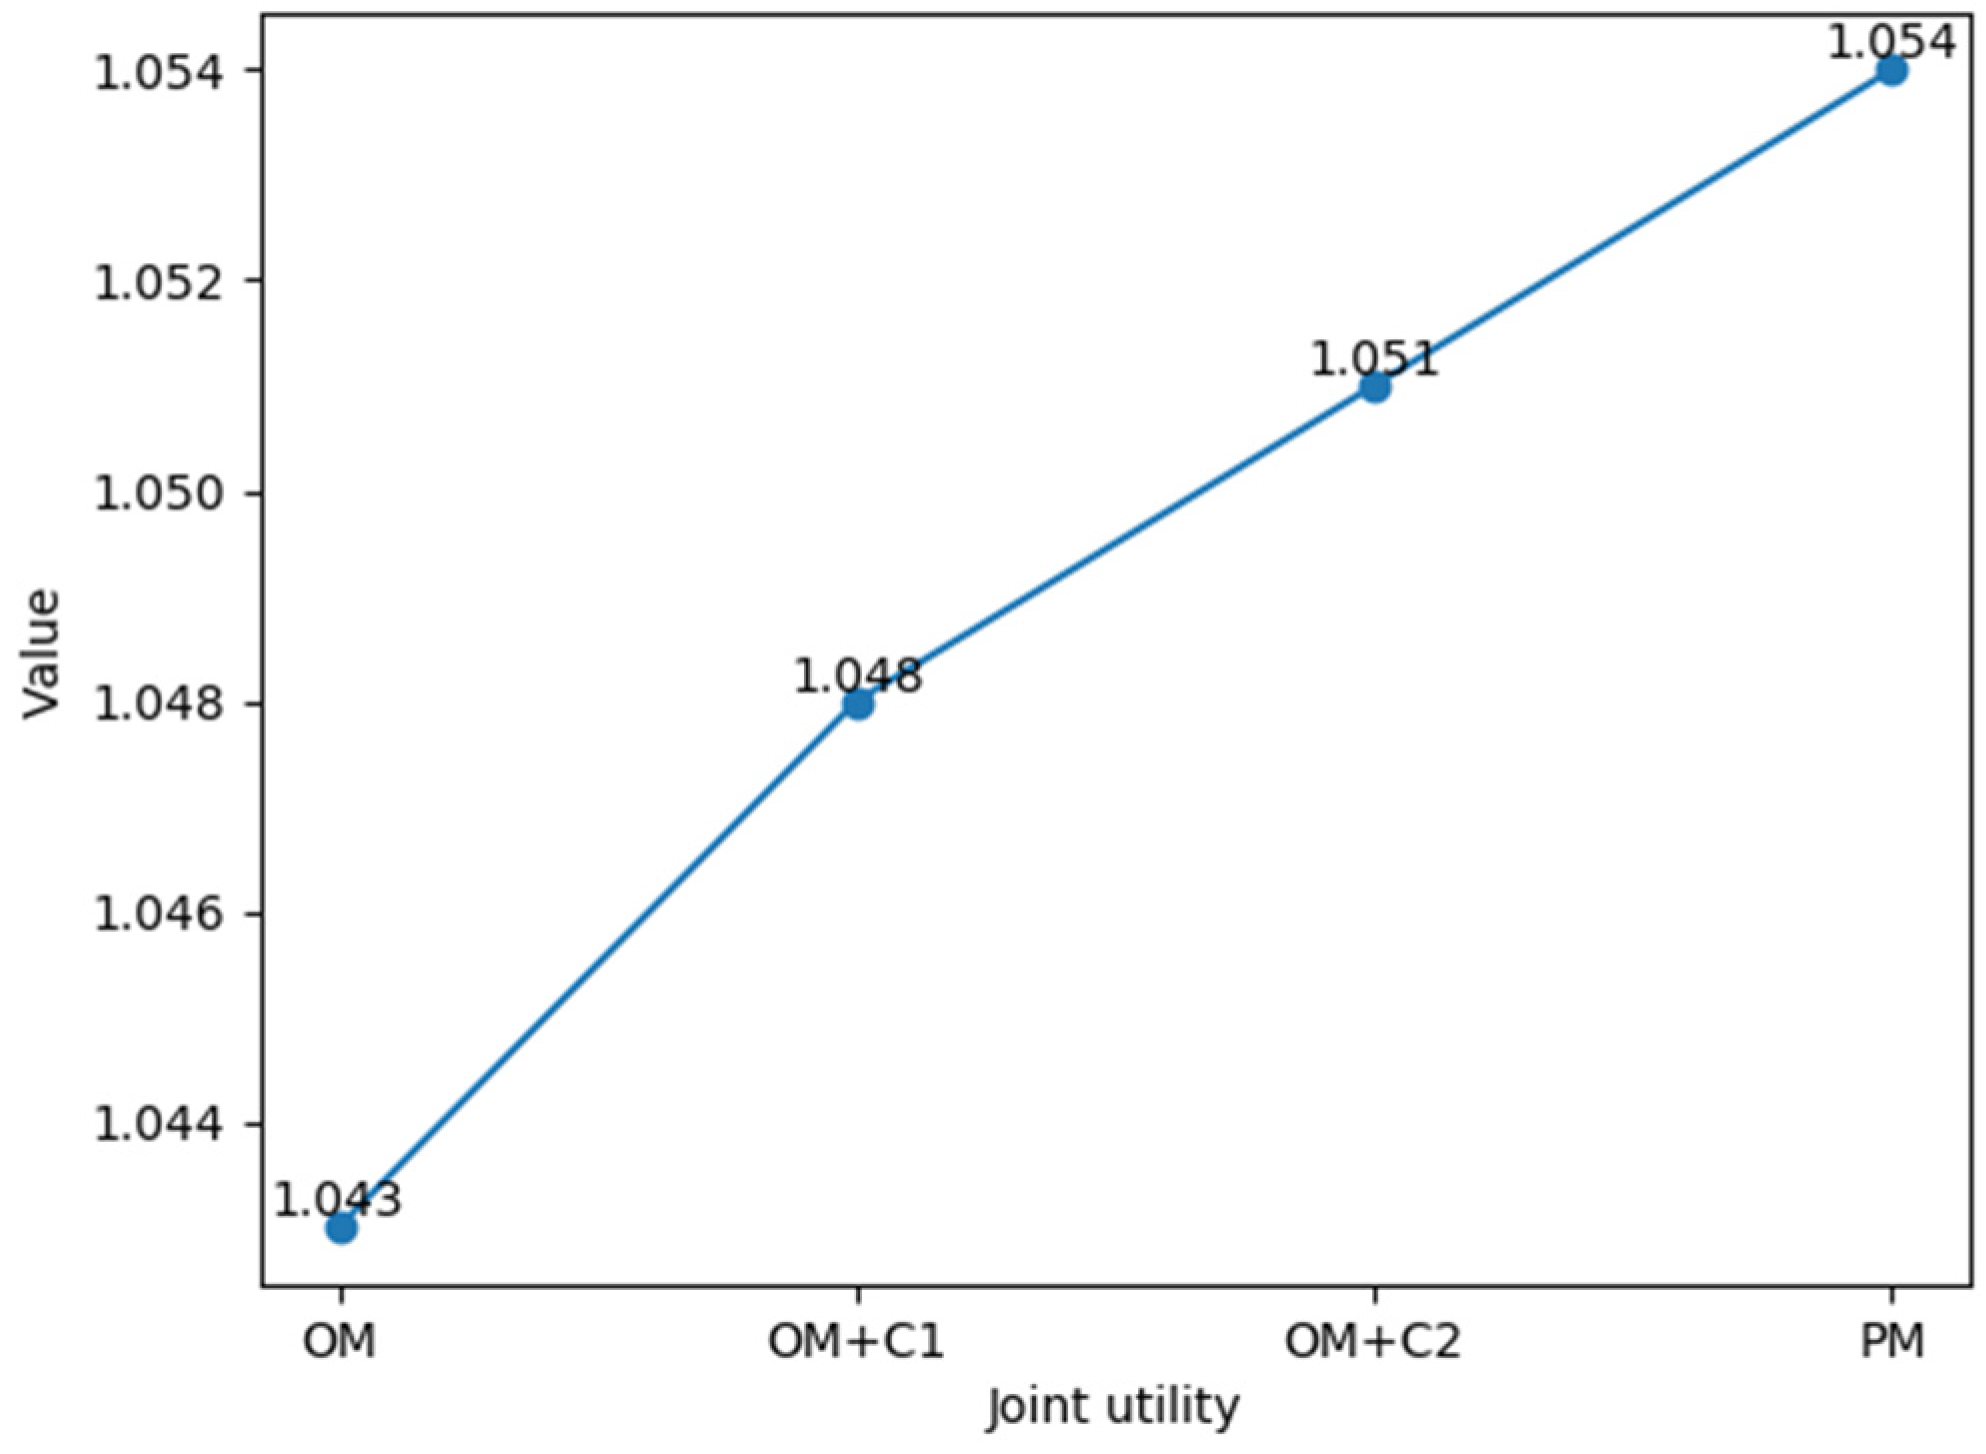

Disclaimer/Publisher’s Note: The statements, opinions and data contained in all publications are solely those of the individual author(s) and contributor(s) and not of MDPI and/or the editor(s). MDPI and/or the editor(s) disclaim responsibility for any injury to people or property resulting from any ideas, methods, instructions or products referred to in the content. |
© 2025 by the authors. Licensee MDPI, Basel, Switzerland. This article is an open access article distributed under the terms and conditions of the Creative Commons Attribution (CC BY) license (https://creativecommons.org/licenses/by/4.0/).