Article

Next Arrival and Destination Prediction via Spatiotemporal Embedding with Urban Geography and Human Mobility Data

by
Pengjiang Li
1,2,†,
Zaitian Wang
1,2,†,
Xinhao Zhang
3,
Pengfei Wang
1,2 and
Kunpeng Liu
3,*
1
Computer Network Information Center, Chinese Academy of Sciences, Beijing 100045, China
2
University of Chinese Academy of Sciences, Beijing 100049, China
3
Department of Computer Science, Portland State University, Portland, OR 97201, USA
*
Author to whom correspondence should be addressed.
These authors contributed equally to this work.
Mathematics 2025, 13(5), 746; https://doi.org/10.3390/math13050746
Submission received: 30 December 2024 / Revised: 25 January 2025 / Accepted: 19 February 2025 / Published: 25 February 2025
(This article belongs to the Special Issue Advanced Research in Data-Centric AI)

Abstract

:
With the development of transportation networks, countless trajectory data are accumulated, and understanding human mobility from traffic data could be helpful for smart cities, urban computing, and urban planning. Extracting valuable insights from traffic data, such as taxi trajectories, can significantly improve residents’ daily lives. There are many studies on spatiotemporal data mining. As we know, arrival prediction or regional function detection encompasses important tasks for traffic management and urban planning. However, trajectory data are often mutilated because of personal privacy and hardware limitations, i.e., we usually can only obtain partial trajectory information. In this paper, we develop an embedding method to predict the next arrival using the origin–destination (O-D) pair trajectory information and point of interest (POI) data. Moreover, the embedding information contains region latent features; thus, we also detect the regional function in this paper. Finally, we conduct a comprehensive experimental study on a real-world trajectory dataset. The experimental results demonstrate the benefit of predicting arrivals, and the embedding vectors can detect the regional function in a city.

1. Introduction

Innumerable numbers of GIS data are accumulated by wearable devices, handhelds and automobiles. It is possible to exploit these spatiotemporal data to understand human mobility data. Knowledge discovery from human mobility data has become a prominent research topic, particularly in areas such as next-arrival prediction and regional function detection. However, it is a non-trivial task to build a method due to the unique characteristics of spatiotemporal data, especially the dataset only with O-D pair information.
Indeed, unlike traditional trace data, such as the full path of a car collected by an automobile data recorder, the O-D pair trajectory only includes the origin and destination information. While full GPS trajectory data can provide richer information, its use is often restricted by privacy regulations, high costs, or the lack of data-sharing agreements. Additionally, commercial GPS trajectory vendors or ride-sharing companies, such as Uber, Grab, and Didi, may impose strict conditions or user agreements, making it challenging to access such data for academic research.
For example, Wall Street is a well-known area that serves as both a working place and a scenic spot. Figure 1 (Google Maps. (2025). New York. https://www.google.com/maps, accessed on 25 January 2025) illustrates the diverse POIs at Wall Street, including restaurants labeled with orange squares, working places labeled with gray circles, and shopping malls labeled with blue squares. The dynamic nature of regional functions, such as Wall Street shifting between a “Working Place” during business hours and “Generally Entertainment” during break times, directly influences the flow of human mobility. These variations in regional functions provide crucial spatiotemporal patterns that can enhance the accuracy of next-arrival predictions. Here, the term “next arrival” refers to predicting the destination of an ongoing trip given its origin, departure time, and contextual information, such as surrounding points of interest (POIs). By leveraging O-D pair data and temporal features, the prediction system can learn these dynamic regional functions to provide more effective event predictions across different time periods.
In other words, the next arrival prediction system should be able to learn the dynamic regional functions by using the O-D pair information to produce effective event prediction.
Also, unlike movie or music recommendations, geographic information also plays an important role in predicting the next arrival. Indeed, arrival tends to be located in a region with the nearby POIs. Thus, there is some intrinsic spatial property embedded in the regional function. Embedding methods have recently gained popularity. These methods assume that each region can be represented as a fixed vector, capturing its latent regional functions with varying characteristics.
There are several existing studies focused on predicting the next arrival in various contexts. These studies primarily rely on analyzing the most recent arrival data, and their approaches are largely exploratory rather than definitive. For example, a significant number of these studies have not simultaneously addressed the prediction of the next arrival and the detection of regional functions. This means that while existing studies may explore either next-arrival prediction or regional function detection, they often overlook the potential benefits of integrating these two aspects. Combining next-arrival prediction with regional function detection can provide a more holistic understanding of human mobility patterns. For example, knowing the dynamic regional functions (e.g., work-related activities during business hours or entertainment purposes in the evenings) can significantly enhance the accuracy of next-arrival predictions by embedding spatiotemporal context into the model. This integration is particularly beneficial for applications in urban planning, traffic management, and resource allocation, where accurate predictions of mobility flows are critical. By capturing the interplay between mobility patterns and functional changes in regions, this study aims to advance both theoretical understanding and practical applications in human mobility research. The motivation for this study arises from the realization that human mobility is inherently shaped by the dynamic nature of regional functions. For instance, areas such as Wall Street or Times Square exhibit distinct functional purposes at different times of the day, shifting between work, leisure, and tourism. Traditional next-arrival prediction methods often focus solely on trajectory data without accounting for these regional function dynamics, leading to limited predictive accuracy. Similarly, regional function detection methods rarely leverage mobility data to inform their results. This research bridges this gap by developing a unified framework that jointly models next-arrival prediction and regional function detection, leveraging spatiotemporal patterns to improve predictive capabilities and uncover deeper insights into urban dynamics. Additionally, the integration of geographic information with arrival prediction has not been thoroughly or effectively incorporated into the embedding methods used within an origin–destination (O-D) pair network. This lack of integration highlights the potential for improving the combination of these elements to enhance the accuracy and utility of predictions.
To this end, in this paper, we propose a systematic way to study arrival prediction and regional function detection by making an embedding vector for each region with geographic information, such as POI information. Specifically, we model the O-D pair information with a time-aware embedding method. Given a specific city, we divide the city into R regions. In addition, there are N events in the R regions, with each event being a triplet which contains the origin region, destination region, and time slot; moreover, the event could be represented with r O , r D , t . For instance, an event represented by triple 54 , 17 , 3 means that, at time slot “3”, there is an event from region “54” to region “17”. Then, an embedding vector is set to model the latent factors in each region in a specific time slot, and the embedding vectors can reflect the regional functions. Furthermore, we consider the geographical information and POI information as the additional data to make an arrival prediction. Finally, we conduct extensive experiments on a real-world dataset. The experimental results show that our methods significantly outperform the baselines. Although the absolute P r e @ K values may appear low, this should be viewed in the context of the problem’s inherent complexity. With 2000 possible regions, even small improvements in P r e @ K represent meaningful progress in accurately predicting the next destination in a large, dense urban environment. These results are particularly valuable for real-world applications, such as urban planning and traffic management, where even marginal improvements in prediction accuracy can lead to more efficient resource allocation and decision making.

2. Literature Review

In this paper, related work can be grouped into categories. The first one includes the work on next event prediction. In the second category, we present the related regional function methods.

2.1. Human Mobility Forecasting

Applications of Human Mobility have been one of the major challenges [1] for developing intelligent transportation systems [2], such as the event discovery, traffic prediction [3,4], time intervals [5], and spatiotemporal mobility modeling [6,7]. Ref. [8] used dynamic human mobility data to generate dense functional correlation matrices between zones during different times of the day. Ref. [9] focused on spatial event forecasting from microblogs and constructed a multi-task learning model to achieve efficient and effective event prediction. Ref. [10] presented a methodology for sequence classification by using spatiotemporal data. Ref. [11] aimed to discover the association between region function and resulting human mobility. In addition, they constructed a linear regression model to predict the traffic flow of Beijing based on the input referred to as a bag of POIs. Ref. [12] addressed the issue of spatiotemporal heterogeneity in human mobility forecasting by utilizing encoding context-wise interactions and optimizing learning objectives. Ref. [13] studied the website-browse and tower-visit mobile datasets and extracted some new spatiotemporal characteristics of collective human mobility. Ref. [14] focused on predicting bike flow in a bike-sharing system. In addition, they constructed multiple interstation graphs, and multiple graphs were constructed to reflect heterogeneous relationships. Ref. [15] combined the topic model with the Hawkes process to simultaneously identify and label the searching tasks. Ref. [16] constructed a spatiotemporal model by combining multiple time-series analysis and cluster analysis, which can enhance the accuracy of forecasts by using historical geophysical time-series data. Ref. [17] focused on predicting the multi-modal symptoms of AD by using activity-labeled smart home data.

2.2. Urban Functionality and Trip Purpose Discovery

With the rapid advancement of mobile and GPS technologies, large-scale footstep data have been extensively collected, enabling numerous studies on functional block discovery and trip purpose inference [18]. Various approaches have been proposed to enhance understanding in this domain. For instance, ref. [19] introduced a semantic model alongside an annotation platform to better interpret trip purposes. Ref. [20] developed a method to determine trip destinations using only speed and time data, eliminating the need for GPS traces. Similarly, ref. [21] focused on automatically annotating raw GPS trajectories with user activities. Other studies have emphasized travel purpose inference. Ref. [22] proposed a framework for modeling and predicting trip purposes in daily life scenarios, while [23] introduced a collective iterative classification algorithm that groups passengers based on mobility features to infer shared trip purposes. Machine learning techniques have also been leveraged, as seen in [24], which improved trip purpose inference by enhancing POI categorization and detecting key entry points for large-area POIs. Beyond inference methods, researchers have explored location prediction and user mobility modeling. Ref. [25] formulated the exploration prediction problem as a classification task and introduced the CEPR model to enhance future location recommendations. Ref. [26] proposed a geographic choice model that considers distance, rank, and popularity to estimate users’ location preferences. Additionally, ref. [27] incorporated social patterns and user-generated content to develop a probabilistic model for location prediction, treating GPS-tracked users as noisy sensors for estimating their friends’ locations.

2.3. Graph Embedding Techniques

Graph analysis has been attracting increasing attention in recent years due to the ubiquity of networks in the real world. Graphs have been used to denote information in various areas, including social sciences, linguistics, etc. [28]. Typically, a model defined to solve graph-based problems either operates on the original graph adjacency matrix or on a derived vector space. Recently, the methods based on representing networks in vector space, while preserving their properties, have become widely used [29,30,31,32]. Ref. [33] focuses on using graph embedding for a semantic proximity search, introducing a new concept of proximity embedding and designing a proximity embedding to support both symmetric and asymmetric proximities. Ref. [34] studied learning latent representations of vertices in a network and constructed a method, DeepWalk. The method can generalize recent advancements in language modeling and unsupervised feature learning from sequences of words to graphs. Ref. [35] proposed the TransH model, which embeds a knowledge graph into a continuous vector space. TransH addresses limitations of earlier models like TransE by better handling reflexive and complex relationships (e.g., one-to-many, many-to-one). The relevance of TransH to this study lies in its embedding strategy, which inspires the design of our time-aware embedding model. Like TransH, our method leverages embedding techniques to capture complex spatiotemporal relationships between regions and POIs in a dynamic urban mobility network.
Ref. [29] focused on embedding large information networks into low-dimensional vector spaces, proposing a method that was suitable for arbitrary types of information networks. Ref. [36] focused on the problem of embedding multi-type relational knowledge into image representations, proposing a framework to embed knowledge graphs into image representations. The model, in their work, can incorporate both symmetric and asymmetric relations. Ref. [33] introduced a new concept of proximity embedding and designed the proximity embedding to support both symmetric and asymmetric proximities. The work in [37] improved graph embedding by generating enhanced negative samples and capturing complex edge semantics. Ref. [38] presented a method to learn sparse word representations directly from raw text data, and they also evaluated their model with a new evaluation metric for removing human evaluation. Ref. [39] used an embedding method to make a recommendation about the next POI. In our paper, we adopted and adapted the idea of dynamic embedding latent vectors and explored multi-class prediction.
In summary, while there are some works on next-arrival prediction, we provide a systematic way for destination prediction by collectively exploiting O-D pair traces and geographic information.

3. Preliminary

In this section, we first introduce some important definitions and the problem statement, and then present an overview of the framework.

3.1. Definitions and Problem Statement

Definition 1 (Augmented O-D pair).
A POI-augmented O-D pair refers to an O-D pair which is augmented by various categories of POIs in the neighborhood of the origin and destination points (within a predefined radius, e.g., 200 m). The radius of 200 m was chosen empirically based on prior research on human mobility and urban geography, which suggests that most trips and interactions occur within this range. Additionally, preliminary experiments showed that a 200 m radius effectively captures relevant POI information without introducing significant noise from more distant locations.
Definition 2 (Region).
A region is defined as a square that contains a set of origin/destination points. This gridded representation is a practical simplification commonly used in spatial analysis due to its simplicity and computational efficiency. However, we acknowledge that actual city functional zones are often irregularly shaped and may not align perfectly with square grids. This discrepancy could introduce a mismatch between the gridded regions and true functional zones. Despite this limitation, the square grid approximation effectively captures the spatial distribution of human mobility for large-scale urban analyses. Future work could explore more adaptive or irregularly shaped region divisions that better reflect the actual boundaries of city functional zones.
Definition 3 (Regional Function).
The regional function refers to the mixture of POIs in the neighborhood environment of a place in the city, which is analogous to the topic of a document when the predefined neighborhood is treated as a document while the POIs in the neighborhood are treated as words.
Definition 4 (O-D Pair Event).
The n-th event is a three-element tuple: ( O n , D n , T ), where T denotes the n-th time slot of the event, and O n , D n denotes the n-th event origin and destination, respectively. In addition, we can add the POI distribution near the O-D pair points in the event. Thus, Z n denotes the POI distribution near the n-th event’s destination.
Definition 5 (Problem Definition).
In this paper, we focus on the problem of location prediction and regional function detection with human mobility data. Formally, given a specific region r and corresponding arrival events set E r in which the origins are region r, we aim to find a mapping function f : E e N + 1 r that takes the GPS traces E r as input, and outputs the upcoming arrival event e N + 1 r . Meanwhile, by embedding the origin destination into different temporal latent vectors [40,41,42], we can obtain different regional function clusters. Thus, we formulate this problem as learning the representations and predicting the next arrival event. Indeed, we first construct an embedding model, assuming that the next destination is dependent on the latest event for a specific origin region. Then, we can transfer the problem as a multi-label prediction and dynamically predict the next arrival. In addition, we can learn the regions’ latent representations from the embedding vectors.
According to the above definitions and the problem statement, in this paper, each taxi GPS trajectory is simplified as an O-D pair which has a pick-up point, a drop-off point, and corresponding time periods of the trip. Based on our analysis of the New York City taxi dataset, approximately 92% of trips have a duration of less than one hour. Therefore, we assume that the trip is inside the city and usually less than one hour, and we only retain the hour of the day for a trip. Essentially, the task of the problem can be decomposed as follows: (i) Augment the O-D pairs with the neighborhood POIs; (ii) Prediction of the next destination region according to the latest O-D pair event; (iii) Jointly model the embedding vectors and the time slots of the trip to identify different types of POI links, in order to detect the regional function in a city.

3.2. Framework Overview

Here, we first provide an overview of our proposed embedding latent factor model for event predictions. Figure 2 shows a specific city map and taxi trajectory data. By using the accurate positions of POIs on the map, we assume that the current event has an impact on the next event’s location and we construct a model to capture the temporal and spatial information in order to make event prediction and detect regional function.
Specifically, in the first step, we transform the map into multiple small regions in the city according to latitude and longitude. Secondly, we transform the independent arrival events into O-D pair tuples, which can be helpful in predicting the next traffic destination for a given region. In addition, each traffic arrival event in a specific region, each consisting of origin region ID, destination region ID, and time slots. Moreover, we supplement the POI information which is linked to the O-D points of the related trajectories. Then, in order to capture the dynamic changes of the regions to predict the next event, we construct a mixed embedding model. Using the results of the model, termed time-aware POI regional model (TPRM), we can make a prediction about the next event’s destination and detect the regional function.

4. Proposed Model

There are many studies on spatiotemporal event prediction or regional function detection. For example, ref. [43] uses the topic model to discover the regional function. Meanwhile, with the development of deep learning, the embedding method has been widely used to model the latent space of data. With data representation, we can make predictions and detect linked information between data. The temporal information in the time-aware function can be captured well through an embedding method. Thus, we briefly introduce the embedding method, and then we introduce our model which can capture the spatiotemporal properties of human mobility data in detail.

4.1. Embedding Method

The embedding method is an approach that can use the latent vectors to represent the original data without much expert knowledge. Specifically, in complicated fields or applications, the embedding method can capture invisible characters of training data. The embedding method has been applied to many prediction problems, such as image recognition and speech recognition.

4.2. Time-Aware Embedding Method Destination Prediction with Regional Function Detection

In this paper, we aim to model previously defined events in terms of the destination region with event time slots and POI distributions.
Table 1 shows the notations used in our work. We partition a city map into different regions, and let the “regions” be denoted as r = 1 , 2 , , R . For each region, there is a set of regions, and each region contains lots of drop-off points. In the POI distribution Z n , there are L categories of POIs.
Specifically, our key idea is to capture the nonlinear dependency of events in regions with trajectory information, including nearby POI distribution and related time slots. In the third step, as shown in Figure 2 (Google Maps. (2025). New York. https://www.google.com/maps, accessed on 25 January 2025), for the arrival event e n r occurring at time t n of the region r, the representation of the destinations’ POIs are Z n .
The dynamic embedding vectors can be acquired by the weight W r e g , W p o i according to the different time buckets. Then, we can use the region embedding vectors to represent the latent characteristics of the region. Equation (1) represents the conditional probability of the next event’s time ( t n + 1 ), given the details of the current event, including the origin region ( O n ), destination region ( D n ), and time slot ( T n ). This is essential for modeling the temporal dependency between consecutive events. Since the n + 1 -th destination is related to the n-th event, the conditional density for the next arrival time can be naturally represented as
f ( t n + 1 ) = f ( t n + 1 | O n , D n , T n ) ,
We can make predictions about the time t ^ n + 1 , the destination region R ^ n + 1 and the embedding vectors, which can be learned with W r e g , W p o i .
Meanwhile, given a set of events E = { e 1 , e 2 , , e N } , we design a dynamic embedding method. This model can make a destination prediction by iterating the following components:
Input Data. For each region, at the n-th arrival event, the input data first project the sparse related POI vector into a normalized vector as Z n . In addition, for the n-th input event, we can extract the exact arrival time T n as the associated temporal feature. The arrival region R n and the POI distribution Z n could also be regarded as input features.
Block Prediction. Given the learned representation weight W r e g , W p o i , we could model and predict the arrival event region with a multinomial distribution by
P ( R n = i | O n , D n , T n ) = exp ( V i , : R + b i R ) i = 1 I exp ( V i , : R + b i R )
where I is the number of blocks for a region, and V i , : R is the i-th row of matrix V R . The matrix V R represents the region embedding matrix, where each row corresponds to the latent representation of a specific region in the embedding space. These embeddings capture the spatial and temporal characteristics of regions, enabling the model to predict the most likely destination region based on the input features ( O n , D n , T n ).
Based on the hidden unit of the model, we are able to learn a unified representation of the dependency over the history of every region.
In fact, experiments on real-world datasets in the following experimental section verify the effectiveness of the model, and many applications could be implemented with these results.

4.3. Parameter Learning

For a specific region r, by obtaining the N r events { e 1 , e 2 , , e N } . where e n = O n , D n , T n , we can learn the model by minimizing the loss function
L = 1 N i I ( R n + 1 i log R ^ n + 1 i ( 1 R n + 1 i ) log ( 1 R ^ n + 1 i ) )
We exploit the Back Propagation Through Time (BPTT) to train the model. In addition, we implement the model by using Pytorch (http://pytorch.org/). In the end, we apply Adaptive Moment Estimation (Adam) [44] with mini-batch and other techniques of training neural networks.

5. Results

This section first introduces the real-world dataset (https://www.nyc.gov/site/tlc/about/tlc-trip-record-data.page, accessed on 25 January 2025), and then presents an empirical evaluation of the designed studies on the real-world dataset.

5.1. Experimental Data

We use a taxi dataset that consists of taxi trajectories and the POI information collected from January 2015 to June 2015 in New York City. There are more than 70,000,000 trajectories, about 700,000 pick-up points, and more than 1,000,000 drop-off points in the raw dataset. First, we divided the NYC map into regions, with each region consisting of a square. The width and height of each square are 0.002 degrees in longitude and latitude, respectively. We acknowledge that this fixed latitude–longitude gridding may not perfectly align with the unique grid-like layout of Manhattan, where streets and avenues are already organized into a predefined structure. This mismatch could lead to discrepancies in capturing the true spatial characteristics of the regions. Despite this limitation, this gridding approach provides a uniform spatial partitioning suitable for large-scale urban analyses. Future work could explore grid designs that are better aligned with Manhattan’s existing street and block structure to further improve the accuracy of regional analyses. We also filtered out the obviously incorrect trajectories and points. The filtering criteria include the following: (1) GPS coordinates that are missing, null, or fall outside the geographic boundaries of New York City; (2) trajectories with unrealistic travel times, such as trips lasting less than one minute or more than 24 h; and (3) trajectories with anomalous travel distances, such as excessively long distances that exceed the reasonable travel limits within the city. As a result, there are 2000 regions and more than 60,000,000 trajectories.

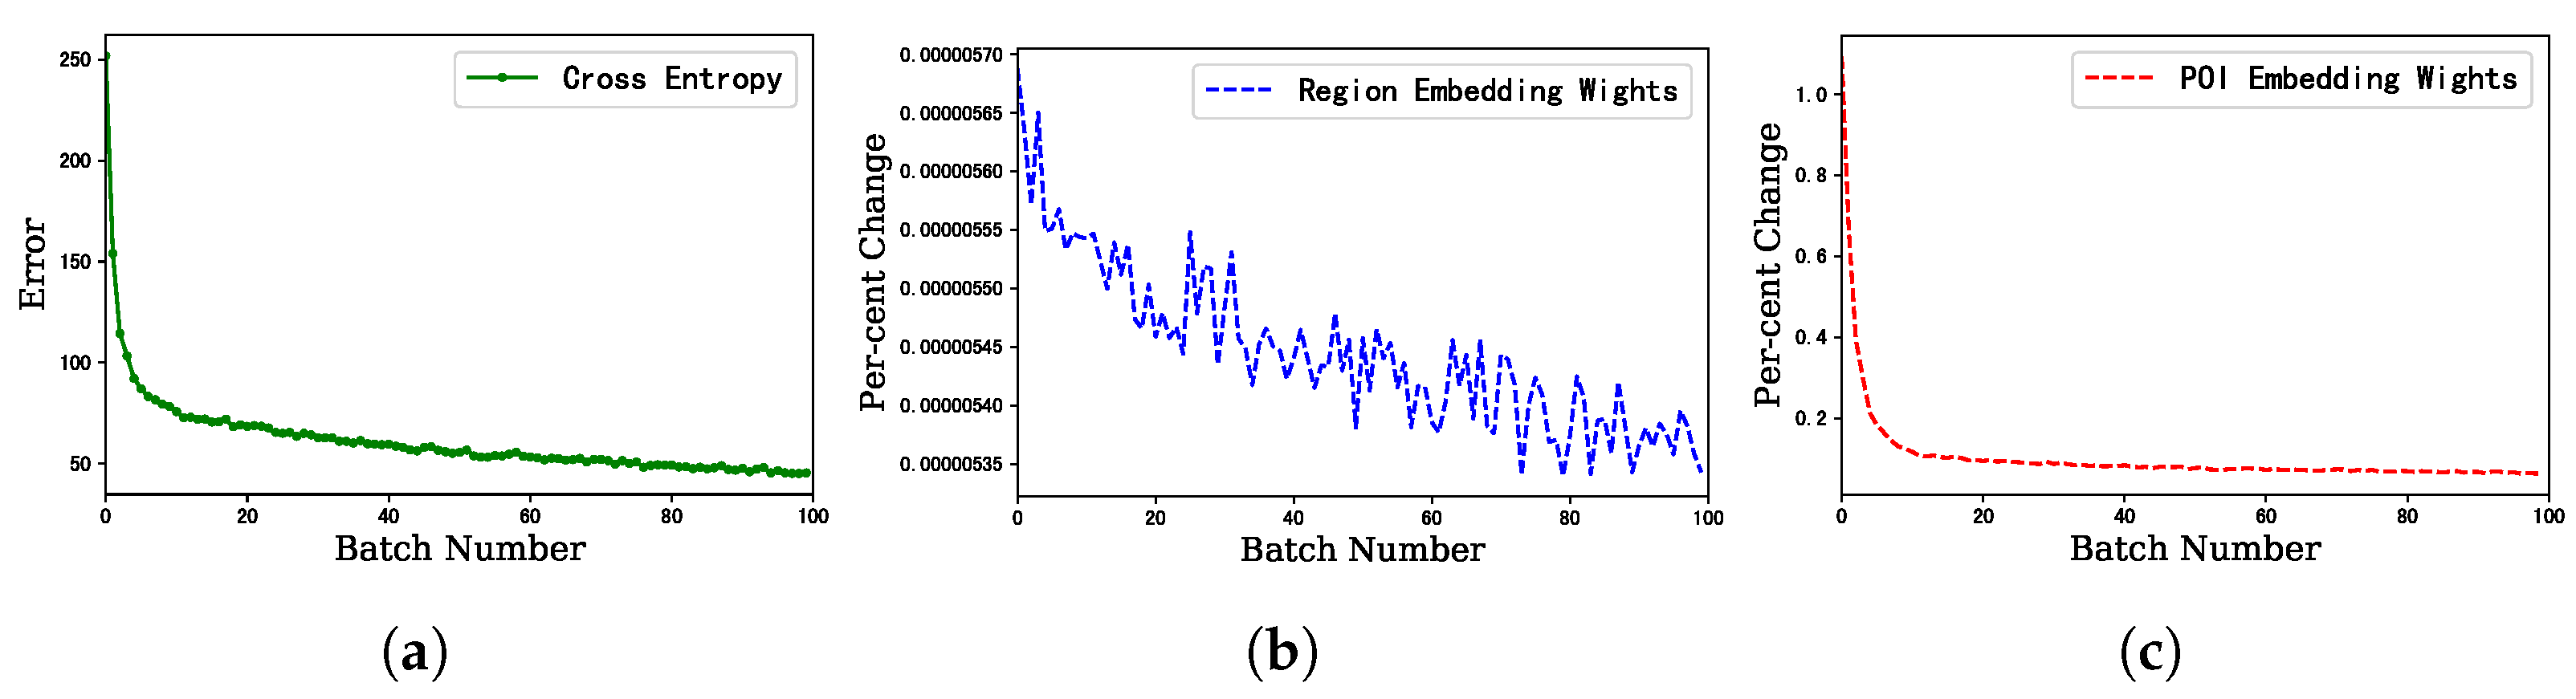
5.2. Model Setup and Model Convergence

When implementing the embedding the prediction model, we first set the number of embedding vectors to 10. Meanwhile, we divide the 24 h of each day into 12 slots, with two adjacent hours as the same time slots; we also treat the workdays and weekends differently, such that we have 24 different time slots in total. In addition, we run the method with 2,000,000 trajectories within a week, with the region number being 2000.
It is shown that the cross entropy converges to a steady value after 100 iterations. We can also see from Figure 3 that the parameters W r e g and W p o i quickly drop to a constant change rate after initial iterations.

5.3. Event Prediction

In this section, we aim to predict the next destination, given a specific region. Thus, we compared the predicted destination region with that of the real region, and we further exploited P r e c i s i o n of the Top-K predicted regions with the real regions to measure such similarity, given a specific region r.
P r e @ K = N p r e B l o c k = = t r u e B l o c k r @ K N r @ K
Baseline Methods. Table 2 shows the comparison results of our method with the following baseline methods.
  • Random: Randomly choose K regions from all the regions in the city as destinations;
  • DescisionTree: Given the origin regions, we rank the destination regions according to the probabilities learned by the DescisionTree function.
  • LinearRegression: We can construct input data with POI distribution according to the O-D pair events history. Therefore, we can apply the LinearRegression multiple classifiers to obtain the top-rank regions for origin and destination.
  • RandomForest: Using LinearRegression, we also transfer the problem into a multiple classifiers question. Then, we can use RandomForest to predict the next destination for a given region.

5.4. Regional Function Detection

In this section, to better illustrate the performance in distinguishing regional functions, we can annotate each region with mixed functions.
Table 3 shows that each extracted regional function is a mixture of several representative POIs with a similar functionality, corresponding to a similar type of activities. For example, Function 1 is represented by different kinds of outdoors, such as ‘Sculpture Garden’ and ‘Lake’, which can be explained as “Outdoor”-related functions. In the same way, we can identify other semantic meanings from the POIs, including “College” (Function 2), “Restaurant” (Functions 3 and 4), “Outdoors” (Functions 5 and 7), “Office” (Function 8), “Entertainment” (Function 9) and “Bar” (Function 10).
It is notable that, in Regional Function 9, “Tanning Salon” and “Mall” take the highest two probabilities, and the function also contains some other food-related POIs, such as “Mediterranean Rest”, “South American Rest”, etc. This exactly matches the environment of an entertainment place where people buy simple foods and coffee for lunch. We also find that Topics 1, 5, and 7 are all outdoor-related, but when taking a closer look at the composition of such functions, there appear to be many differences between them. There are different key POIs in Function 1, Function 4, and Function 5, such as “Lake” and “Hiking Trail” in Function 1, Golf Course in Function 5, and “Beach” in Function 7.

5.5. Robustness Validation

As stability is very important to a method, Figure 4 shows the robustness [45] with different settings of the model. In addition, we first set the percent of the training data range in the set 50 , 60 , 70 , 80 , 90 with the embedding vector number as 10. Then, we set the embedding vector number range in the set 10 , 20 , 30 , 40 , 50 with the training data percentage equal to 60.

5.6. Summary

Traditional event prediction methods mostly focus on the predicted efficiency without thinking about the regional function in the city, according to different time slots. However, the event destination is not only related to the previous event but also related to the mixed regional function, i.e., to the regional function cycle according to time slots. We consider the regional function in predicting the next event destination with the embedding method. TPRM takes into account both event prediction and regional function detection by dynamically embedding the region and POI distribution into latent vectors. Hence, we can observe the improvements against the baseline algorithms and the region semantic detection.

6. Conclusions

Next-event prediction and regional detection have been two key points in understanding human mobility data. By studying large-scale human mobility data, we can dynamically identify the properties of human mobility. Understanding human mobility data could benefit many applications, such as smart city, urban planning, etc. In this paper, we divide the city into many regions and build a dynamic embedding method to learn the representations of regions and forecast the next event. Finally, we present extensive experiments on a real-world human mobility dataset of NYC to demonstrate the effectiveness of the proposed model. However, it is difficult to specifically provide typical distributions that represent different topics, which also applies to the investigation carried out in this paper.
Further work can be extended in the following ways: Firstly, regions could be replaced with specific data, such as latitude and longitude, so that we could predict the arrival’s location in greater detail. Secondly, the POI distribution could be re-weighted according to the popularity of a particular region or embedded during preprocessing. Furthermore, the model could be extended to capture dynamic traffic arrival flows with different functional regions.

Author Contributions

P.L.: planning, methodology, analysis, data collection, writing—initial draft preparation, and manuscript revision; Z.W.: methodology, experiments, writing—draft preparation, and experiments; X.Z.: data collection, data argumentation, experiments, and writing—draft preparation; P.W.: planning, supervision, and writing—review and editing; K.L.: funding procurement and supervision. All authors have read and agreed to the published version of the manuscript.

Funding

This research was supported by National Natural Science Foundation of China (Grant No. 62406306) and the State Key Laboratory of Internet of Things for Smart City (University of Macau) No. SKL-IoTSC(UM)-2024-2026/ORP/GA02/2023.

Data Availability Statement

The dataset used in this study is publicly available and can be accessed from the official website of the New York City Taxi and Limousine Commission (TLC) at https://www.nyc.gov/site/tlc/about/tlc-trip-record-data.page. This dataset contains real-world trip records, including information on trip duration, distance, pick-up and drop-off locations, and fare details. Researchers interested in accessing the data may refer to the provided link for details on downloading and processing the dataset.

Conflicts of Interest

The authors declare no conflicts of interest.

References

  1. Cui, P.; Liu, H.; Aggarwal, C.; Wang, F. Uncovering and predicting human behaviors. IEEE Intell. Syst. 2016, 31, 77–88. [Google Scholar] [CrossRef]
  2. Zhao, J.; Li, J.; Cheng, Y.; Zhou, L.; Sim, T.; Yan, S.; Feng, J. Understanding Humans in Crowded Scenes: Deep Nested Adversarial Learning and A New Benchmark for Multi-Human Parsing. arXiv 2018, arXiv:1804.03287. [Google Scholar]
  3. Long, Q.; Fang, Z.; Fang, C.; Chen, C.; Wang, P.; Zhou, Y. Unveiling Delay Effects in Traffic Forecasting: A Perspective from Spatial-Temporal Delay Differential Equations. In Proceedings of the ACM on Web Conference 2024, Singapore, 13–17 May 2024; pp. 1035–1044. [Google Scholar]
  4. Zhou, Y.; Wang, P.; Dong, H.; Zhang, D.; Yang, D.; Fu, Y.; Wang, P. Make Graph Neural Networks Great Again: A Generic Integration Paradigm of Topology-Free Patterns for Traffic Speed Prediction. arXiv 2024, arXiv:2406.16992. [Google Scholar]
  5. Li, Z.; Zheng, G.; Agarwal, A.; Xue, L.; Lauvaux, T. Discovery of causal time intervals. In Proceedings of the 2017 SIAM International Conference on Data Mining, Houston, TX, USA, 27–29 April 2017; SIAM: New Delhi, India, 2017; pp. 804–812. [Google Scholar]
  6. Xu, J.; Tan, P.N.; Luo, L.; Zhou, J. Gspartan: A geospatio-temporal multi-task learning framework for multi-location prediction. In Proceedings of the 2016 SIAM International Conference on Data Mining, Miami, FL, USA, 5–7 May 2016; SIAM: New Delhi, India, 2016; pp. 657–665. [Google Scholar]
  7. Prasad, S.K.; Aghajarian, D.; McDermott, M.; Shah, D.; Mokbel, M.; Puri, S.; Rey, S.J.; Shekhar, S.; Xe, Y.; Vatsavai, R.R.; et al. Parallel Processing over Spatial-Temporal Datasets from Geo, Bio, Climate and Social Science Communities: A Research Roadmap. In Proceedings of the 2017 IEEE International Congress on Big Data (BigData Congress), Honolulu, HI, USA, 25–30 June 2017; IEEE: Piscataway, NJ, USA, 2017; pp. 232–250. [Google Scholar]
  8. Sarkar, S.; Chawla, S.; Ahmad, S.; Srivastava, J.; Hammady, H.; Filali, F.; Znaidi, W.; Borge-Holthoefer, J. Effective urban structure inference from traffic flow dynamics. IEEE Trans. Big Data 2017, 3, 181–193. [Google Scholar] [CrossRef]
  9. Zhao, L.; Sun, Q.; Ye, J.; Chen, F.; Lu, C.T.; Ramakrishnan, N. Feature constrained multi-task learning models for spatiotemporal event forecasting. IEEE Trans. Knowl. Data Eng. 2017, 29, 1059–1072. [Google Scholar] [CrossRef]
  10. Chen, H.; Tang, F.; Tino, P.; Cohn, A.G.; Yao, X. Model Metric Co-Learning for Time Series Classification. In Proceedings of the Twenty-Fourth International Joint Conference on Artificial Intelligence, Buenos Aires, Argentina, 25–31 July 2015; AAAI Press: Washington, DC, USA, 2015; pp. 3387–3394. [Google Scholar]
  11. Wang, M.; Yang, S.; Sun, Y.; Gao, J. Human mobility prediction from region functions with taxi trajectories. PLoS ONE 2017, 12, e0188735. [Google Scholar] [CrossRef]
  12. Zhou, Z.; Yang, K.; Liang, Y.; Wang, B.; Chen, H.; Wang, Y. Predicting collective human mobility via countering spatiotemporal heterogeneity. IEEE Trans. Mob. Comput. 2023, 5, 4723–4738. [Google Scholar] [CrossRef]
  13. Zhang, H.T.; Zhu, T.; Fu, D.; Xu, B.; Han, X.P.; Chen, D. Spatiotemporal property and predictability of large-scale human mobility. Phys. A Stat. Mech. Its Appl. 2018, 495, 40–48. [Google Scholar] [CrossRef]
  14. Chai, D.; Wang, L.; Yang, Q. Bike Flow Prediction with Multi-Graph Convolutional Networks. arXiv 2018, arXiv:1807.10934. [Google Scholar]
  15. Li, L.; Deng, H.; Dong, A.; Chang, Y.; Zha, H. Identifying and labeling search tasks via query-based hawkes processes. In Proceedings of the 20th ACM SIGKDD International Conference on Knowledge Discovery and Data Mining, New York, NY, USA, 24–27 August 2014; ACM: New York, NY, USA, 2014; pp. 731–740. [Google Scholar]
  16. Pravilovic, S.; Bilancia, M.; Appice, A.; Malerba, D. Using multiple time series analysis for geosensor data forecasting. Inf. Sci. 2017, 380, 31–52. [Google Scholar] [CrossRef]
  17. Aramendi, A.A.; Weakley, A.; Schmitter-Edgecombe, M.; Cook, D.J.; Goenaga, A.A.; Basarab, A.; Carrasco, M.B. Smart home-based prediction of multi-domain symptoms related to Alzheimer’s Disease. IEEE J. Biomed. Health Inform. 2018, 22, 1720–1731. [Google Scholar]
  18. Zheng, Y.; Capra, L.; Wolfson, O.; Yang, H. Urban Computing: Concepts, methodologies, and applications. ACM Trans. Intell. Syst. Technol. 2014, 5, 2157–6904. [Google Scholar] [CrossRef]
  19. Yan, Z.; Chakraborty, D.; Parent, C.; Spaccapietra, S.; Aberer, K. Semantic trajectories: Mobility data computation and annotation. ACM Trans. Intell. Syst. Technol. (TIST) 2013, 4, 49. [Google Scholar] [CrossRef]
  20. Dewri, R.; Annadata, P.; Eltarjaman, W.; Thurimella, R. Inferring trip destinations from driving habits data. In Proceedings of the 12th ACM Workshop on Workshop on Privacy in the Electronic Society, Berlin, Germany, 4 November 2013; ACM: New York, NY, USA, 2013; pp. 267–272. [Google Scholar]
  21. Furletti, B.; Cintia, P.; Renso, C.; Spinsanti, L. Inferring human activities from GPS tracks. In Proceedings of the 2nd ACM SIGKDD International Workshop on Urban Computing, Chicago, IL, USA, 11 August 2013. [Google Scholar]
  22. Zhu, Z.; Blanke, U.; Tröster, G. Inferring travel purpose from crowd-augmented human mobility data. In Proceedings of the First International Conference on IoT in Urban Space. ICST (Institute for Computer Sciences, Social-Informatics and Telecommunications Engineering), Rome, Italy, 27–28 October 2014; pp. 44–49. [Google Scholar]
  23. Lin, Y.; Wan, H.; Jiang, R.; Wu, Z.; Jia, X. Inferring the travel purposes of passenger groups for better understanding of passengers. IEEE Trans. Intell. Transp. Syst. 2015, 16, 235–243. [Google Scholar] [CrossRef]
  24. Dhananjaya, D.; Sivakumar, T. Enhancing the POI data for trip purpose inference using machine learning techniques. In Proceedings of the 2022 IEEE 25th International Conference on Intelligent Transportation Systems (ITSC), Macau, China, 8–12 October 2022; IEEE: Piscataway, NJ, USA, 2022; pp. 3496–3501. [Google Scholar]
  25. Lian, D.; Xie, X.; Zheng, V.W.; Yuan, N.J.; Zhang, F.; Chen, E. CEPR: A collaborative exploration and periodically returning model for location prediction. ACM Trans. Intell. Syst. Technol. (TIST) 2015, 6, 8. [Google Scholar] [CrossRef]
  26. Kumar, R.; Mahdian, M.; Pang, B.; Tomkins, A.; Vassilvitskii, S. Driven by food: Modeling geographic choice. In Proceedings of the Eighth ACM International Conference on Web Search and Data Mining, Shanghai, China, 2–6 February 2015; ACM: New York, NY, USA, 2015; pp. 213–222. [Google Scholar]
  27. Sadilek, A.; Kautz, H.; Bigham, J.P. Finding your friends and following them to where you are. In Proceedings of the Fifth ACM International Conference on Web Search and Data Mining, Seattle, DC, USA, 8–12 February 2012; ACM: New York, NY, USA, 2012; pp. 723–732. [Google Scholar]
  28. Goyal, P.; Ferrara, E. Graph embedding techniques, applications, and performance: A survey. Knowl.-Based Syst. 2018, 151, 78–94. [Google Scholar] [CrossRef]
  29. Tang, J.; Qu, M.; Wang, M.; Zhang, M.; Yan, J.; Mei, Q. LINE: Large-scale Information Network Embedding. In Proceedings of the 24th International Conference on World Wide Web, Florence, Italy, 18–22 May 2015; Volume 2, pp. 1067–1077. [Google Scholar]
  30. Wang, D.; Cui, P.; Zhu, W. Structural Deep Network Embedding. In Proceedings of the ACM SIGKDD International Conference on Knowledge Discovery and Data Mining, San Francisco, CA, USA, 13–17 August 2016; pp. 1225–1234. [Google Scholar]
  31. Xu, L.; Wei, X.; Cao, J.; Yu, P.S. On Exploring Semantic Meanings of Links for Embedding Social Networks. In Proceedings of the 2018 World Wide Web Conference on World Wide Web. International World Wide Web Conferences Steering Committee, Lyon, France, 23–27 April 2018; pp. 479–488. [Google Scholar]
  32. Guo, J.; Xu, L.; Huang, X.; Chen, E. Enhancing Network Embedding with Auxiliary Information: An Explicit Matrix Factorization Perspective. In Proceedings of the International Conference on Database Systems for Advanced Applications, Gold Coast, QLD, Australia, 21–24 May 2018; Springer: Berlin/Heidelberg, Germany, 2018; pp. 3–19. [Google Scholar]
  33. Liu, Z.; Zheng, V.W.; Zhao, Z.; Zhu, F.; Chang, K.C.C.; Wu, M.; Ying, J. Semantic Proximity Search on Heterogeneous Graph by Proximity Embedding. In Proceedings of the AAAI, San Francisco, CA, USA, 4–9 February 2017; pp. 154–160. [Google Scholar]
  34. Perozzi, B.; Al-Rfou, R.; Skiena, S. Deepwalk: Online learning of social representations. In Proceedings of the 20th ACM SIGKDD International Conference on Knowledge Discovery and Data Mining, New York, NY, USA, 24–27 August 2014; ACM: New York, NY, USA, 2014; pp. 701–710. [Google Scholar]
  35. Wang, Z.; Zhang, J.; Feng, J.; Chen, Z. Knowledge Graph Embedding by Translating on Hyperplanes. In Proceedings of the AAAI, Québec City, QC, Canada, 27–31 July 2014; Volume 14, pp. 1112–1119. [Google Scholar]
  36. Cui, P.; Liu, S.; Zhu, W. General Knowledge Embedded Image Representation Learning. IEEE Trans. Multimed. 2018, 20, 198–207. [Google Scholar] [CrossRef]
  37. Li, J.; Fu, X.; Zhu, S.; Peng, H.; Wang, S.; Sun, Q.; Philip, S.Y.; He, L. A robust and generalized framework for adversarial graph embedding. IEEE Trans. Knowl. Data Eng. 2023, 35, 11004–11018. [Google Scholar] [CrossRef]
  38. Sun, F.; Guo, J.; Lan, Y.; Xu, J.; Cheng, X. Sparse word embeddings using l1 regularized online learning. In Proceedings of the Twenty-Fifth International Joint Conference on Artificial Intelligence, New York, NY, USA, 9–15 July 2016; AAAI Press: Washington, DC, USA, 2016; pp. 2915–2921. [Google Scholar]
  39. Xie, M.; Yin, H.; Xu, F.; Wang, H.; Zhou, X. Graph-Based Metric Embedding for Next POI Recommendation. In Web Information Systems Engineering–WISE 2016: 17th International Conference, Shanghai, China, 8–10 November 2016, Proceedings, Part II 17; Springer International Publishing: Berlin/Heidelberg, Germany, 2016. [Google Scholar]
  40. Huang, K.; Gardner, M.; Papalexakis, E.; Faloutsos, C.; Sidiropoulos, N.; Mitchell, T.; Talukdar, P.P.; Fu, X. Translation invariant word embeddings. In Proceedings of the 2015 Conference on Empirical Methods in Natural Language Processing, Lisbon, Portugal, 17–21 September 2015; pp. 1084–1088. [Google Scholar]
  41. Tang, J.; Hall, W. Cross-Domain Ranking via Latent Space Learning. In Proceedings of the AAAI, San Francisco, CA, USA, 4–9 February 2017; pp. 2618–2624. [Google Scholar]
  42. Ye, H.J.; Zhan, D.C.; Jiang, Y.; Zhou, Z.H. Rectify Heterogeneous Models with Semantic Mapping. In Proceedings of the International Conference on Machine Learning, Stockholm, Sweden, 10–15 July 2018; pp. 5630–5639. [Google Scholar]
  43. Yuan, N.J.; Zheng, Y.; Xie, X.; Wang, Y.; Zheng, K.; Xiong, H. Discovering urban functional zones using latent activity trajectories. IEEE Trans. Knowl. Data Eng. 2015, 27, 712–725. [Google Scholar] [CrossRef]
  44. Kingma, D.P.; Ba, J. Adam: A method for stochastic optimization. arXiv 2014, arXiv:1412.6980. [Google Scholar]
  45. Hendrycks, D.; Dietterich, T.G. Benchmarking Neural Network Robustness to Common Corruptions and Surface Variations. arXiv 2018, arXiv:1807.01697. [Google Scholar]
Figure 1. Mixed POIs near Wall Street.
Mathematics 13 00746 g001
Figure 2. Framework overview of the proposed model. We first transform the map into multiple small regions in the city according to latitude and longitude. Then, after putting the O-D pair traces into a mixed embedding model, we can capture the dynamic changes in the regions. Finally, we can apply the embedding service for the downstream tasks related to regional functions.
Mathematics 13 00746 g002
Figure 3. Cross entropy and percentage of changes in the parameters. (a) The cross-entropy loss decreases as the Batch Number increases, indicating improved model convergence. (b) The total percent change in Region Embedding Weights shows a decreasing trend with the increase in Batch Number, suggesting stabilization in regional representations. (c) The percent change in POI Embedding Weights also exhibits a downward trend as the Batch Number increases, reflecting a gradual stabilization of POI representations.
Mathematics 13 00746 g003
Figure 4. Robustness validation.
Mathematics 13 00746 g004
Table 1. Symbol Notations.
SymbolDefinition
ZThe overall POI distribution across the entire city
Z n The POI distribution associated with the n-th event’s destination
Δ ( q ) A simplex of dimension ( q 1 )
N o Number of POIs near the origin point o
N d Number of POIs near the destination point d
RTotal number of regions in the city
LTotal number of POI categories
KNumber of POI topics
NTotal number of trajectories
EA sequence of arrivals
e n A specific event represented by a three-element tuple, ( R n O , R n D , T n )
TTime slot of the event
W r e g Weight matrix of region embedding
W p o i Weight matrix of POI embedding
Table 2. Next arrival prediction precision value @TopK.
Method@1@5@10@15@20@25@30@35@40@45@50
Random0.0004850.002440.0050.0075750.0100150.012420.0150.0175750.0200350.022380.02483
DescisionTree0.0024250.0068750.011590.0117950.012110.01630.019190.0268650.031010.034190.034
LinearRegression0.002450.00690.0116150.011820.0121350.0163250.0192150.026890.0310350.0342150.03459
RandomForest0.002460.00690.0116150.011820.0121350.0163250.0192150.026890.0310350.0342150.03459
TPRM0.0020.00710.01020.0120.01240.01660.02080.02720.0320.03480.0358
Table 3. Representative POIs for POI topics extracted by TPRM.
Function 1ValueFunction 2ValueFunction 3ValueFunction 4ValueFunction 5Value
Highway or Road2.828Religious Center2.0133Beer Garden2.111Moroccan Rest.2.702Garden2.053
Sculpture Garden2.409College Dorm1.516Candy Store1.848Fraternity House2.470Golf Course1.770
Cupcake Shop1.965College Quad1.419College Cafeteria1.788Ethiopian Rest.2.296Steakhouse1.727
Lake1.842Bookstore1.292Medical Center1.759Caribbean Rest.1.944Hot Spring1.620
Basketball Court1.761Salon or Barbershop1.092Stadium1.752Cuban Rest.1.881Ski Area1.493
Ski Area1.758Hotel1.057Design Studio1.662Subway1.653Asian Rest.1.450
Library1.747Airport1.011Molecular Rest.1.642Pool Hall1.465Comedy Club1.432
Field1.709Light Rail0.990Religious Center1.573Karaoke Bar1.442College Admin.1.424
Racetrack1.651Bus Station0.944Dog Run1.474German Rest.1.395General College1.409
Hiking Trail1.623Embassy/Consulate0.938New American Rest.1.322Gift Shop1.354College Library1.318
Function 6ValueFunction 7ValueFunction 8ValueFunction 9ValueFunction 10Value
Argentinian Rest.2.954Wings Joint2.258Music Store2.898Tanning Salon2.082Juice Bar2.181
Antique Shop2.022Casino1.966Australian Rest.2.650Mall1.913Paper/Office Store2.164
Brewery1.871Resort1.910Flea Market2.114Apartment Build.1.871Taco Place1.806
Water Park1.867Gastropub1.672Argentinian Rest.2.043Bowling Alley1.861Gaming Cafe1.738
Video Store1.851Convenience Store1.612South American Rest.1.716Mediterranean Rest.1.778Lighthouse1.629
Bowling Alley1.835Beer Garden1.566Tapas Rest.1.565Fried Chicken Joint1.748Moroccan Rest.1.499
Comedy Club1.774Design Studio1.497Molecular Rest.1.544South American Rest.1.703Malaysian Rest.1.478
Fast Food Rest.1.764Beach1.446Bank1.303Skate Park1.633Nightclub1.358
Bookstore1.661Hostel1.351Taco Place1.216Internet Cafe1.508Swiss Rest.1.344
Resort1.628Sports Bar1.342Dessert Shop1.111Toy or Game Store1.435Burrito Place1.309
Disclaimer/Publisher’s Note: The statements, opinions and data contained in all publications are solely those of the individual author(s) and contributor(s) and not of MDPI and/or the editor(s). MDPI and/or the editor(s) disclaim responsibility for any injury to people or property resulting from any ideas, methods, instructions or products referred to in the content.

