Article

RMT: Real-Time Multi-Level Transformer for Detecting Downgrades of User Experience in Live Streams

1
School of Computer Science and Engineering, University of Electronic Science and Technology of China, Chengdu 611731, China
2
China Telecom Group Co., Ltd. Sichuan Branch, Chengdu 610015, China
3
School of Mechanical and Electrical, Quanzhou University of Information Engineering, Quanzhou 362000, China
*
Author to whom correspondence should be addressed.
Mathematics 2025, 13(5), 834; https://doi.org/10.3390/math13050834
Submission received: 31 January 2025 / Revised: 18 February 2025 / Accepted: 26 February 2025 / Published: 2 March 2025
(This article belongs to the Special Issue Optimization Models and Algorithms in Data Science)

Abstract

:
Live-streaming platforms such as TikTok have been recently experiencing exponential growth, attracting millions of daily viewers. This surge in network traffic often results in increased latency, even on resource-rich nodes during peak times, leading to the downgrade of Quality of Experience (QoE) for users. This study aims to predict QoE downgrade events by leveraging cross-layer device data through real-time predictions and monitoring. We propose a Real-time Multi-level Transformer (RMT) model to predict the QoE of live streaming by integrating time-series data from multiple network layers. Unlike existing approaches, which primarily assess the immediate impact of network conditions on video quality, our method introduces a device-mask pretraining (DMP) technique that applies pretraining on cross-layer device data to capture the correlations among devices, thereby improving the accuracy of QoE predictions. To facilitate the training of RMT, we further built a Live Stream Quality of Experience (LSQE) dataset by collecting 5,000,000 records from over 300,000 users in a 7-day period. By analyzing the temporal evolution of network conditions in real-time, the RMT model provides more accurate predictions of user experience. The experimental results demonstrate that the proposed pretraining task significantly enhances the model’s prediction accuracy, and the overall method outperforms baseline approaches.

1. Introduction

The exponential expansion of live-streaming platforms like TikTok has underscored the indispensable role of robust network infrastructure in supporting this rapidly evolving ecosystem. However, the accompanying surge in network traffic often leads to increased latency, even on resource-rich nodes during peak times, resulting in Quality of Experience (QoE) downgrade events for users. Accurately detecting these QoE downgrade events is crucial for enhancing service quality and reducing operational costs.
Recent user experience downgrade event detection methods can be divided into the following two categories: QoS (Quality of Service)-based methods and QoE-based methods. QoS-based methods generally use software-defined networking (SDN) technologies [1,2,3,4] and Service Function Chains (SFC) [5] to assess QoE by utilizing network-centric metrics such as bandwidth, latency, jitter, and packet loss. For example, research on QoS has focused on optimizing SDN-IoT network management [6,7], satisfying multiple QoS constraints in SDN [8], and improving network QoS by extending OpenFlow and OF-Config protocols for autonomous configuration in OpenFlow switches [9], while these studies effectively measure QoS, they fall short in evaluating QoE [10]. QoE-based methods QoE is a user-focused metric that can be modeled in relation to QoS using a linear model [11]. However, a simple linear relationship does not accurately capture the metric between QoE and QoS. Telecom operators are actually concerned with the actual user experience, such as the video buffering event (QoE downgrade event), rather than a single numerical value. Therefore an increasing number of methods based on deep learning are being applied to QoE-based methods. For example, Lopez-Martin et al. use a deep learning model to extract information from network packets to predict QoE (good or bad quality) [12]. Kiani et al. proposed moving QoE models for real-time QoE measurement during DASH video streaming, demonstrating their accuracy and suitability for content service providers [13]. Hoßfeld et al. [14] propose an approach using Convolutional Neural Networks, measuring fine-grained video QoE in real-time from encrypted traffic. Canovas et al. [15] utilize Bayesian-regularized neural networks to estimate QoE, classify traffic patterns, and dynamically adjust video characteristics based on QoS parameters to optimize QoE during critical transmission moments. Huang et al. [16] propose a Deep Reinforcement Learning (DRL)-based approach for adaptive multimedia traffic control in SDN to optimize QoE. Lopez-Martin et al. [15] developed a multimedia traffic management system using Bayesian-regularized neural networks (BRNN) to estimate QoE.
In summary, current QoS and QoE evaluation methods utilize network status information, such as transmission delay, bandwidth, and packet loss rate at each port, which is then applied to linear or nonlinear models for prediction. However, network operators face certain challenges when implementing these methods on metropolitan area networks (MANs), limiting their effectiveness. As depicted in Figure 1, a MAN typically follows a three-tier architecture consisting of a Broadband Remote Access Server (BRAS) [17] or Virtual Broadband Remote Access Server (vBRAS), an Optical Line Terminal (OLT) [18,19] layer, and an Optical Network Unit (ONU) [20] layer. Current prediction models primarily evaluate the quality of individual ONUs by analyzing their performance alongside that of upstream BRAS and OLT layers. However, they fail to account for the impact of bypass devices, which significantly influence QoE. For instance, a single BRAS can connect to multiple OLTs, and vice versa, resulting in interactions between OLTs that share the same BRAS. This omission underscores the need for a more comprehensive approach to fully capture the network’s dynamic behavior.
To address these limitations, this study proposes a real-time multi-layer Transformer for detecting QoE downgrade events in live streams. The proposed method constructs a multi-layer Transformer model for an optical fiber network. First, to ensure consistency across different devices, we define a unified data representation for each layer’s devices. The multi-layer Transformer then collects the status information from the BRAS, OLT, and ONU layers, incorporating the bypass device status to predict the QoE for each user node. Experimental results demonstrate that our method achieves over a 10% improvement in prediction accuracy compared to existing approaches.
To train and evaluate our proposed method, we further created a Live Stream Quality of Experience (LSQE) dataset, comprising five million records from over 300,000 users over a period of 7 days. Experimental results on the LSQE dataset demonstrate that the proposed method achieves higher accuracy and F1 scores than existing approaches. The contributions of this study are as follows:
  • We developed the Live Stream Quality of Experience (LSQE) dataset, which includes five million records from over 300,000 users in a 7-day period.
  • We introduced a device-mask pretraining (DMP) method that applies a pretraining technique to cross-layer network device data, enabling a better understanding of cross-layer device correlations.
  • We proposed a real-time QoE downgrade event prediction model based on a multi-layer Transformer. Experimental results show that the DMP task significantly improves the model’s prediction accuracy, and the proposed method outperforms baseline approaches.
The rest of this paper is organized as follows: Section 2 reviews the related work; Section 3 introduces the LSQE dataset; Section 4 presents the proposed Real-time Multi-level Transformer model; Section 5 details the experimental design and results; and Section 6 discusses the findings and concludes the paper.

2. Related Works

2.1. QoE/QoS Prediction for Live Video Quality Prediction

Predicting QoE and QoS allows network operators to accurately assess the quality of various services, including the Internet of Things (IoT) [6,7], streaming video [13], and Internet Protocol Television (IPTV) [11]. In recent years, research has increasingly shifted from focusing on network-level parameters to emphasizing subjective user perception. This shift highlights the evolution of QoS assessments from traditional network performance metrics to user-perceived quality. Although QoE and QoS are not mutually exclusive, QoE extends the concept of QoS by incorporating the user’s subjective perception of service performance.
QoS evaluates network quality using metrics such as bandwidth, packet loss, and delay jitter. QoE, being a superset of QoS, incorporates the user perspective and is influenced by factors across multiple levels such as the following: system level (including bandwidth variation, packet loss, delay, jitter, end-user device configuration, and browser), context level (such as user location and the purpose of streaming, whether for education or gaming), user level (expectations), and content level (bitrate, resolution, and video quality) [14].
Recent works on QoE prediction can be categorized into the following two main approaches: legacy machine learning methods [7,21] and neural network-based methods [15,16,22,23]. Legacy machine learning methods: Said et al. proposed a QoE evaluation scheme for IoT data across different optical network layers [7]. Ibarrolar et al. developed a customer satisfaction model to collect QoE labels and employed a regression model to estimate the impact of various network parameters [21]. Neural network methods: Lopez et al. introduced a model that combines Convolutional Neural Networks (CNNs), Recurrent Neural Networks (RNNs), and a Gaussian classifier to predict the QoE (good or bad experience) for live videos [12]. Canovas et al. applied Bayesian Regularized Neural Networks (BRNNs) to classify different types of traffic based on user-perceived quality [15]. Madanapalli et al. [12] utilized a single Long Short-Term Memory (LSTM) neural network along with a multi-layer perceptron (MLP) to predict QoE. Huang et al. proposed an adaptive multimedia traffic control mechanism using Deep Reinforcement Learning (DRL), which combines deep learning with reinforcement learning and learns through trial-and-error-based rewards [16].

2.2. Transformer

To clarify our proposed methods, we begin with a review of the multi-layer perceptron (MLP), often referred to as the feed-forward neural network (FNN). This is the simplest and most widely recognized form of a multi-layer neural network. Subsequent hidden layers within the MLP are responsible for extracting an abstract representation through nonlinear transformations.
y l = h W l , b l l = f ( W l x l 1 + b l ) ,
where l denotes the l-th layer; f can be a sigmoid, tanh, or ReLU function [24]; and W and b represent the weights and bias of this layer, respectively. Although a single-layer perceptron network is theoretically capable of capturing any nonlinear function, it is challenging to train, and its performance on various tasks remains unsatisfactory. Consequently, numerous neural network models have been developed, such as Convolutional Neural Networks (CNNs) [25], Long Short-Term Memory Networks (LSTMs) [26], Multi-Layer Perceptrons (MLPs), and Recurrent Neural Networks (RNNs) [27]. Following the introduction of the Transformer model [28], the architecture of neural network models began to stabilize.
The Transformer is a neural network model based on the self-attention mechanism, proposed by Google for natural language processing. Soon after its introduction, components of this model were widely adopted in large language models such as BERT [29,30,31,32] and GPTs [33,34,35]. Models utilizing the self-attention layer have shown superior performance compared to CNNs, LSTMs, MLPs, and RNNs on both Natural Language Processing (NLP) [32,36] and Computer Vision (CV) tasks [37,38,39]. Given an input matrix X R N × H , where N represents the length of the input sequence and H represents the dimension of each element in the sequence, the output of the self-attention layer can be expressed as follows:
Att ( X ) = softmax X W Q W K T X T d X W V ,
where W Q , W K , W V R H × d denote the trainable parameters for the query, key, and value matrices, respectively, and d denotes the dimension of the input nodes. Attention networks construct an attention map using the query and key matrices to find the relationships between different nodes in the network, and they output a weighted value matrix Att R N × d . It is worth noting that the multiplication of W Q and W K creates a d × d dimensional matrix, which can also be interpreted as a graph neural network [40,41].
The matrix X is processed through multiple attention blocks, each consisting of a multi-head self-attention layer, a dense layer, and two normalization layers. The self-attention layer with input matrix X is defined by Equation (2). Multiple self-attention layers are then concatenated into a single vector and reshaped via a trainable parameter W o as follows:
M u l t i H e a d ( X ) = Concat ( A t t 1 , , A t t h ) W o ,
where W o R h d × H is a trainable parameter, h is the number of self-attention heads, and M u l t i H e a d represents the multi-head attention operation. To prevent gradient vanishing, the Transformer employs a residual connection by adding the input and output of the multi-head attention layer, followed by batch normalization (BN) to ensure a more stable gradient, as follows:
M a t t = B N ( M u l t i H e a d ( X ) ) + X ,
where B N represents the batch normalization layer, and M a t t R N × H denotes the normalized output of the multi-head attention layer. Similarly, the dense layer is also designed with a residual connection followed by batch normalization, as follows:
M d e n s e = B N ( D e n s e ( M a t t ) ) + M a t t ,
where D e n s e represents the dense layer, and M d e n s e R N × H represents the output matrix.

3. Live Stream Quality of Experience Dataset

The Live Stream Quality of Experience Dataset is a comprehensive collection of data that captures key metrics related to the quality of experience for live streaming services. This dataset includes various parameters such as video resolution, frame rate, latency, packet loss, and user engagement. Its purpose is to provide insights into the factors that influence user satisfaction and to support improvements in live streaming service quality. To efficiently collect user experience data for live stream videos, we developed a network monitoring tool designed to track the network traffic of Optical Network Unit (ONU) devices.
We collected optical data from 300,000 users within a Metropolitan Area Network (MAN) over a seven-day period, resulting in 12 million data records totaling 500 GB. This dataset comprises data from the following three network layers: BRAS, OLT, and ONU. The original dataset is organized into 15 tables. Specifically, we collected 8.93 million records (287.5 GB) from the ONU layer, 780,000 records (95 GB) from the OLT layer, and 420,000 records (31.8 GB) from the BRAS layer.
The attributes of the BRAS, OLT, and ONU layer data collected from the Metropolitan Area Network (MAN) are presented in Table 1, Table 2 and Table 3, providing a comprehensive overview of network monitoring and QoE management as follows:
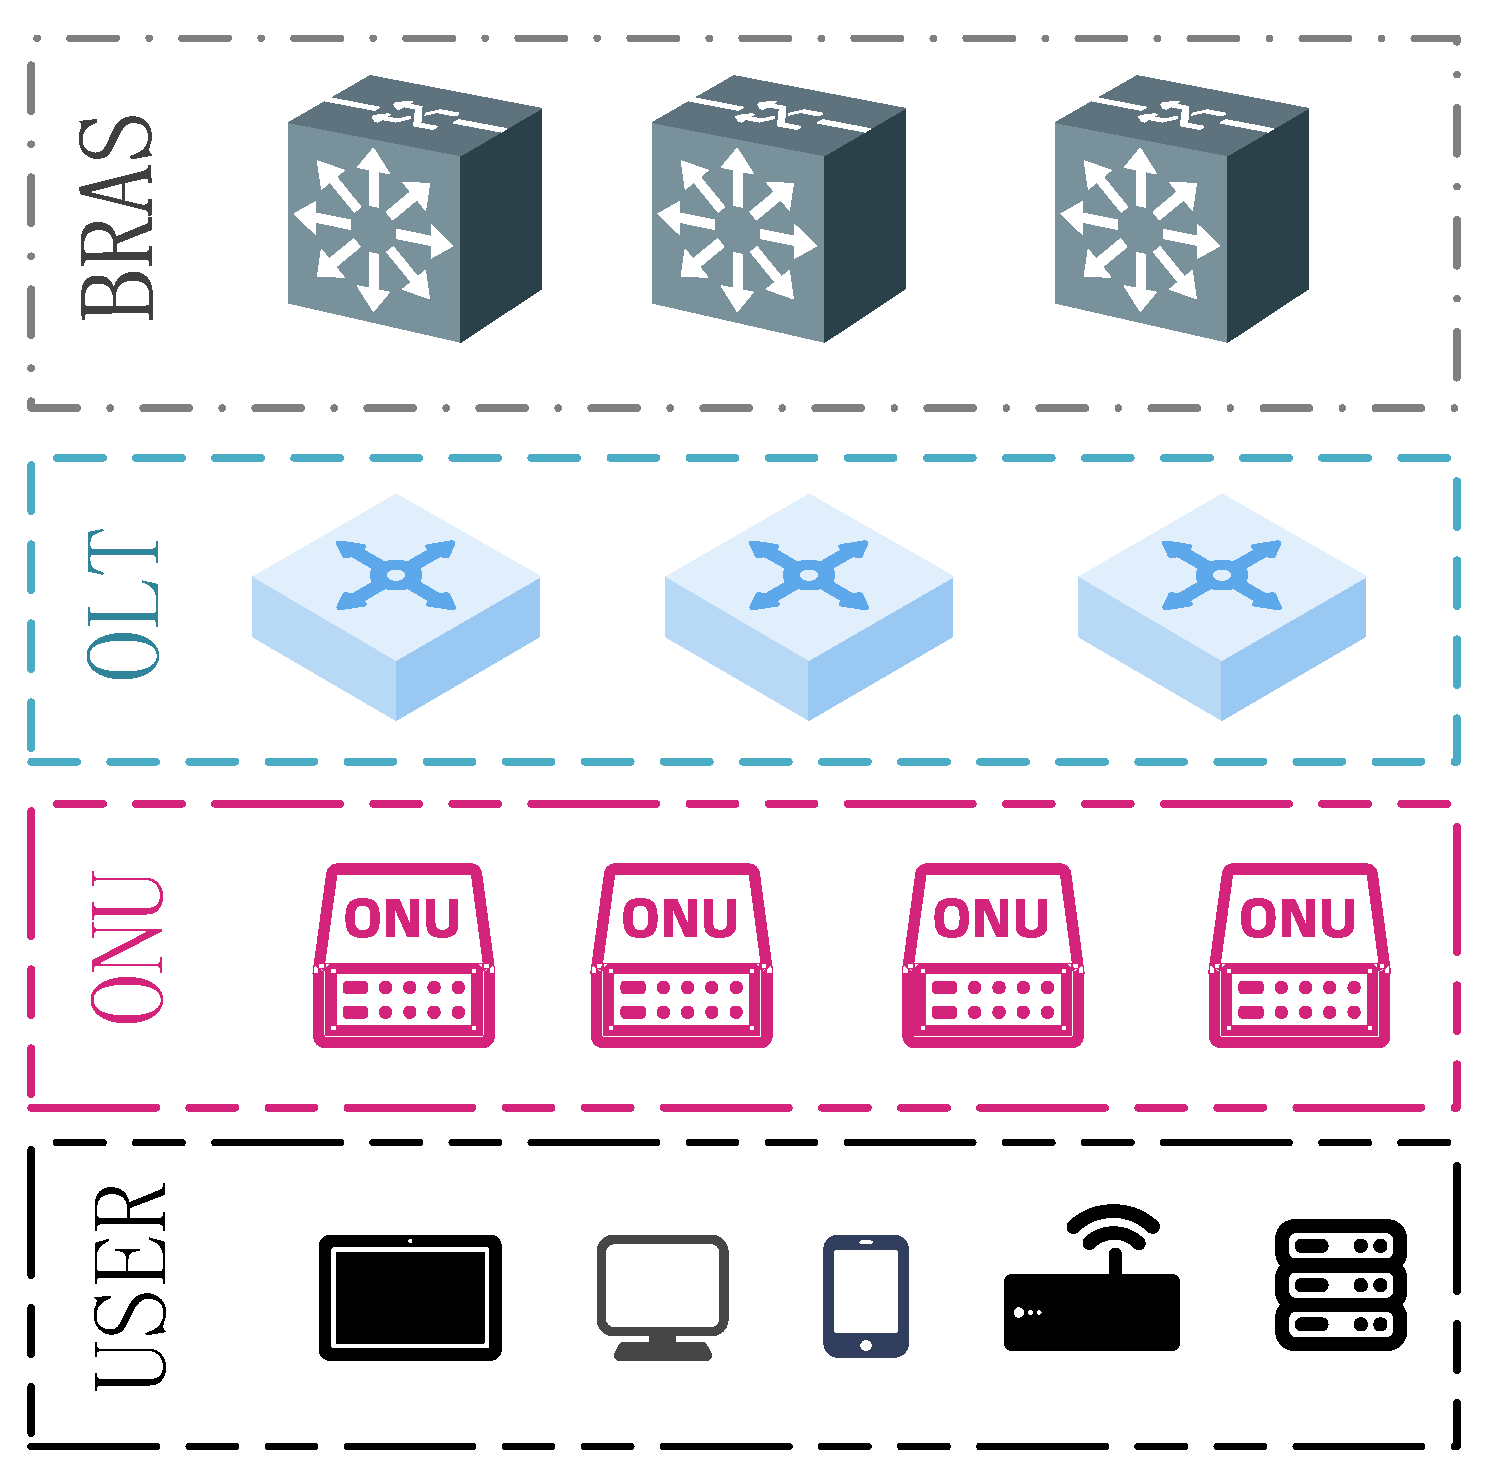
  • Table 1: BRAS layer—the BRAS (Broadband Remote Access Server) layer attributes encompass device-specific information (IP, model number, port/slot), traffic data (inbound/outbound rate differences, CRC error counts), and bandwidth metrics (inbound/outbound rates, utilization percentages). Additionally, it includes received optical power details (with maximum, minimum, and average power levels) to monitor the optical signal and a “QoE downgrade event Flag” to identify instances of degraded service quality.
  • Table 2: OLT layer—attributes of the OLT (Optical Line Terminal) layer are categorized into device info and transmission details. Device info includes port IP, location city, device ID, and board performance. Transmission metrics cover inbound/outbound traffic rates, port bandwidth, and bandwidth utilization. It also provides optical power levels for both received and transmitted signals, contributing to assessing network performance, with a “QoE downgrade Flag” to denote QoE downgrade events.
  • Table 3: ONU layer—the ONU (Optical Network Unit) layer attributes are broken down into device info (device ID, local identifier, city code, CPU, and memory usage) and transmission metrics, similar to the OLT layer. The transmission data include received and transmitted optical power levels, port bandwidth, bandwidth utilization, and the maximum number of user devices supported. Like the other layers, the table features a “QoE downgrade Flag” to denote QoE downgrade events.
Table 1. Attributes of the BRAS layer device.
BRAS Layer
No.AttributesDescription
1BRAS IPBRAS device data
2BRAS Device IP
3BRAS Model Number
4BRAS Port/slot
5Inbound Rate Difference (%)BRAS traffic, error rate, utilization data
6Outbound Rate Difference (%)
7CRC Inbound Error Count
8CRC Outbound Error Count
9Inbound Rate (Gb/s)
10Outbound Rate (Gb/s)
11Bandwidth Utilization (%)
12Received Optical Power (dBm)BRAS received optical power
13Maximum Received Optical Power (dBm)
14Minimum Received Optical Power (dBm)
15Average Received Optical Power (dBm)
16QoE Downgrade Event FlagLabel
Table 2. Attributes of the OLT layer device.
OLT Layer
No.AttributesDescription
1Port IPDevice info
2Location City
3Device Id
4OLT Single Board Performance
5Port IDOLT transmission info, including received and transmitted optical power
6Inbound Rate (Gb/s)
7Outbound Rate (Gb/s)
8Port Bandwidth (Gb/s)
9Bandwidth Utilization (%)
10Received Optical Power (dBm)
11Transmitted Optical Power (dBm)
12QoE Downgrade Event FlagLabel
Table 3. Attributes of the ONU layer device.
ONU Layer
No.AttributesDescription
1Device IdDevice info
2Local Identifier
3City Code
4CPU Usage (%)
5Memory Usage (%)
6Received Optical Power (dBm)ONU transmission info, including input and output.
7Transmitted Optical Power (dBm)
8Port Bandwidth (Gb/s)
9Bandwidth Utilization (%)
10Max User Device Count
11QoE Downgrade Event FlagLabel

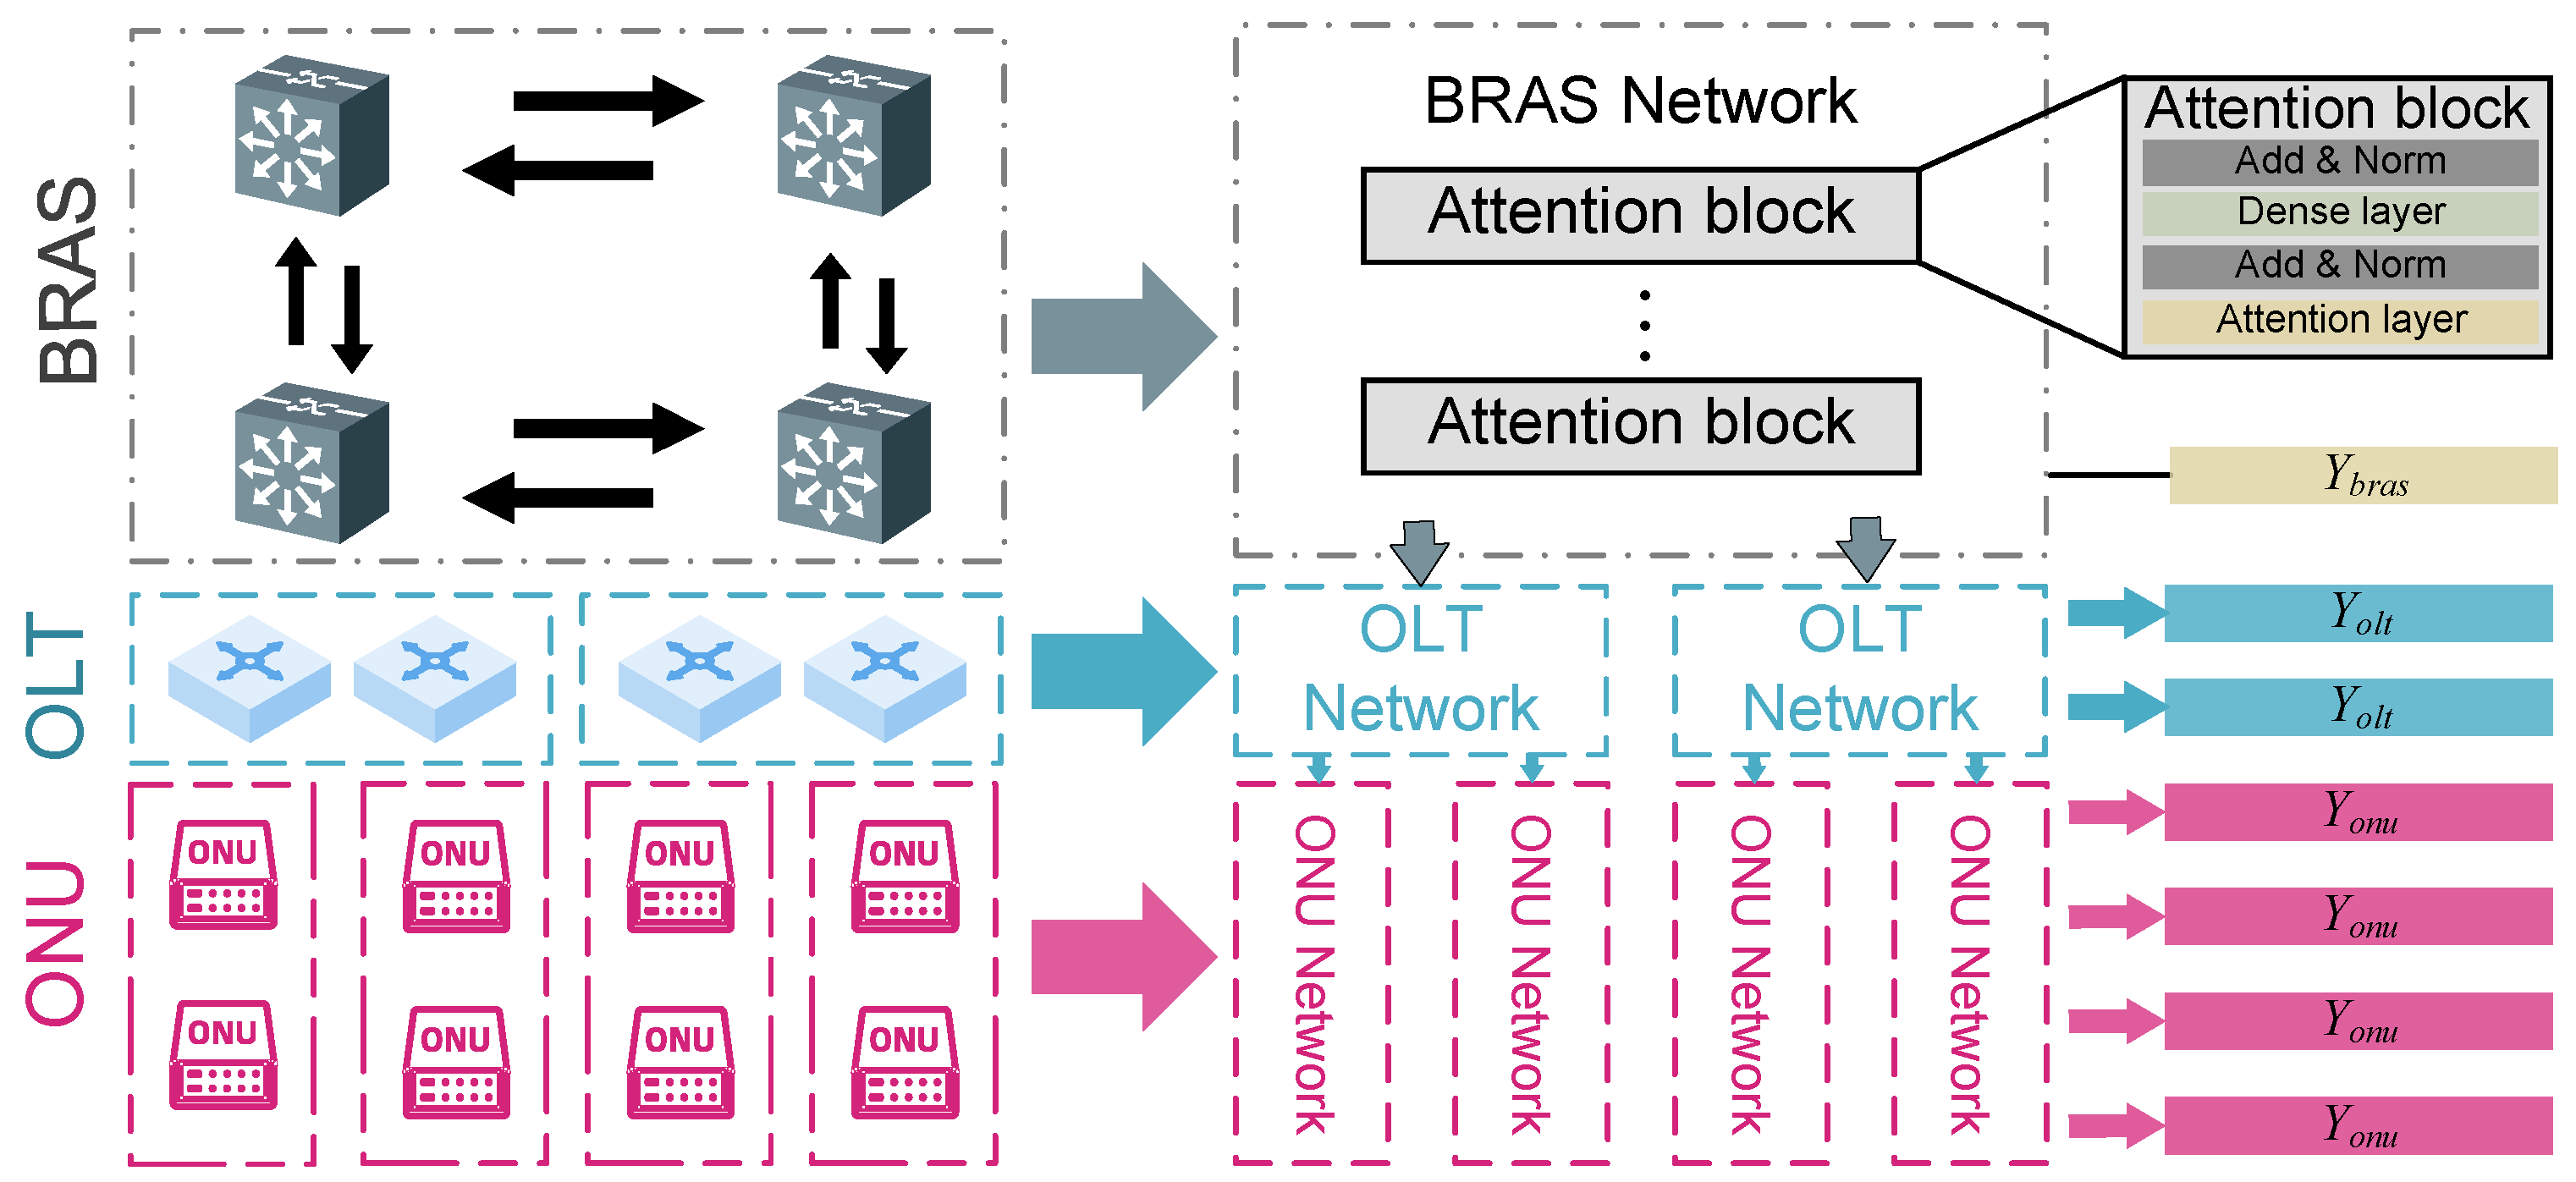
4. Multi-Level Transformer

In this section, we introduce the Real-time Multi-level Transformer (RMT) for predicting the Quality of Experience (QoE) in live video streaming. The RMT model integrates real-time data from multiple network layers, overcoming the limitations of previous methods that required synchronized data collection across network devices. Due to varying data collection frequencies among multi-level devices, traditional approaches often incurred delays while waiting for data from all layers. To address this, the RMT updates prediction results from each layer in real-time.
As illustrated in Figure 2, the proposed model consists of the following three layers: the BRAS, OLT, and ONU. Each layer predicts its corresponding QoE label and simultaneously provides cross-layer information to the other layers. During training, we first pretrain each model using a device-masked approach, followed by fine-tuning for the QoE prediction task. To mitigate prediction delays caused by varying data collection frequencies, we introduce a caching mechanism that leverages the output cache from higher network layers to provide real-time forecasts.

4.1. BRAS, OLT, and ONU Network

To address the inconsistent numbers of nodes and attributes across different layers, we structured the input data for each layer in a standardized format. Specifically, the input data for the BRAS, OLT, and ONU layers are represented as N nodes, each having H attributes. Consequently, the input data are organized into an N × H matrix, denoted as X. If the number of nodes is less than N, the matrices are padded with zero vectors. Similarly, nodes with fewer than H attributes are also padded with zeros to ensure uniformity.
The BRAS layer comprises n multi-head attention blocks, each containing an attention layer, a dense layer, and an Add&Norm layer. As noted in the related works section, given an input X, the attention block is formulated as follows:
A B ( X ) = B N ( D e n s e ( M a t t ( X ) ) ) + M a t t ( X ) ,
where A B represents the attention block. The input and output dimensions of the attention block are R N × H , which allows the blocks to be stacked end to end. Therefore, we employ the attention block as the fundamental model for the BRAS, OLT, and ONU layers. To enhance the accuracy of QoE prediction, the OLT and ONU networks incorporate information from their upper-layer networks, represented as follows:
L ˜ i n p u t = Concat ( B out , L i n p u t ) W L ,
U ˜ i n p u t = Concat ( L o u t , U i n p u t ) W U ,
where L input and U input represent the input device information for the OLT and ONU layers, respectively, and L out represents the output of the OLT layer.

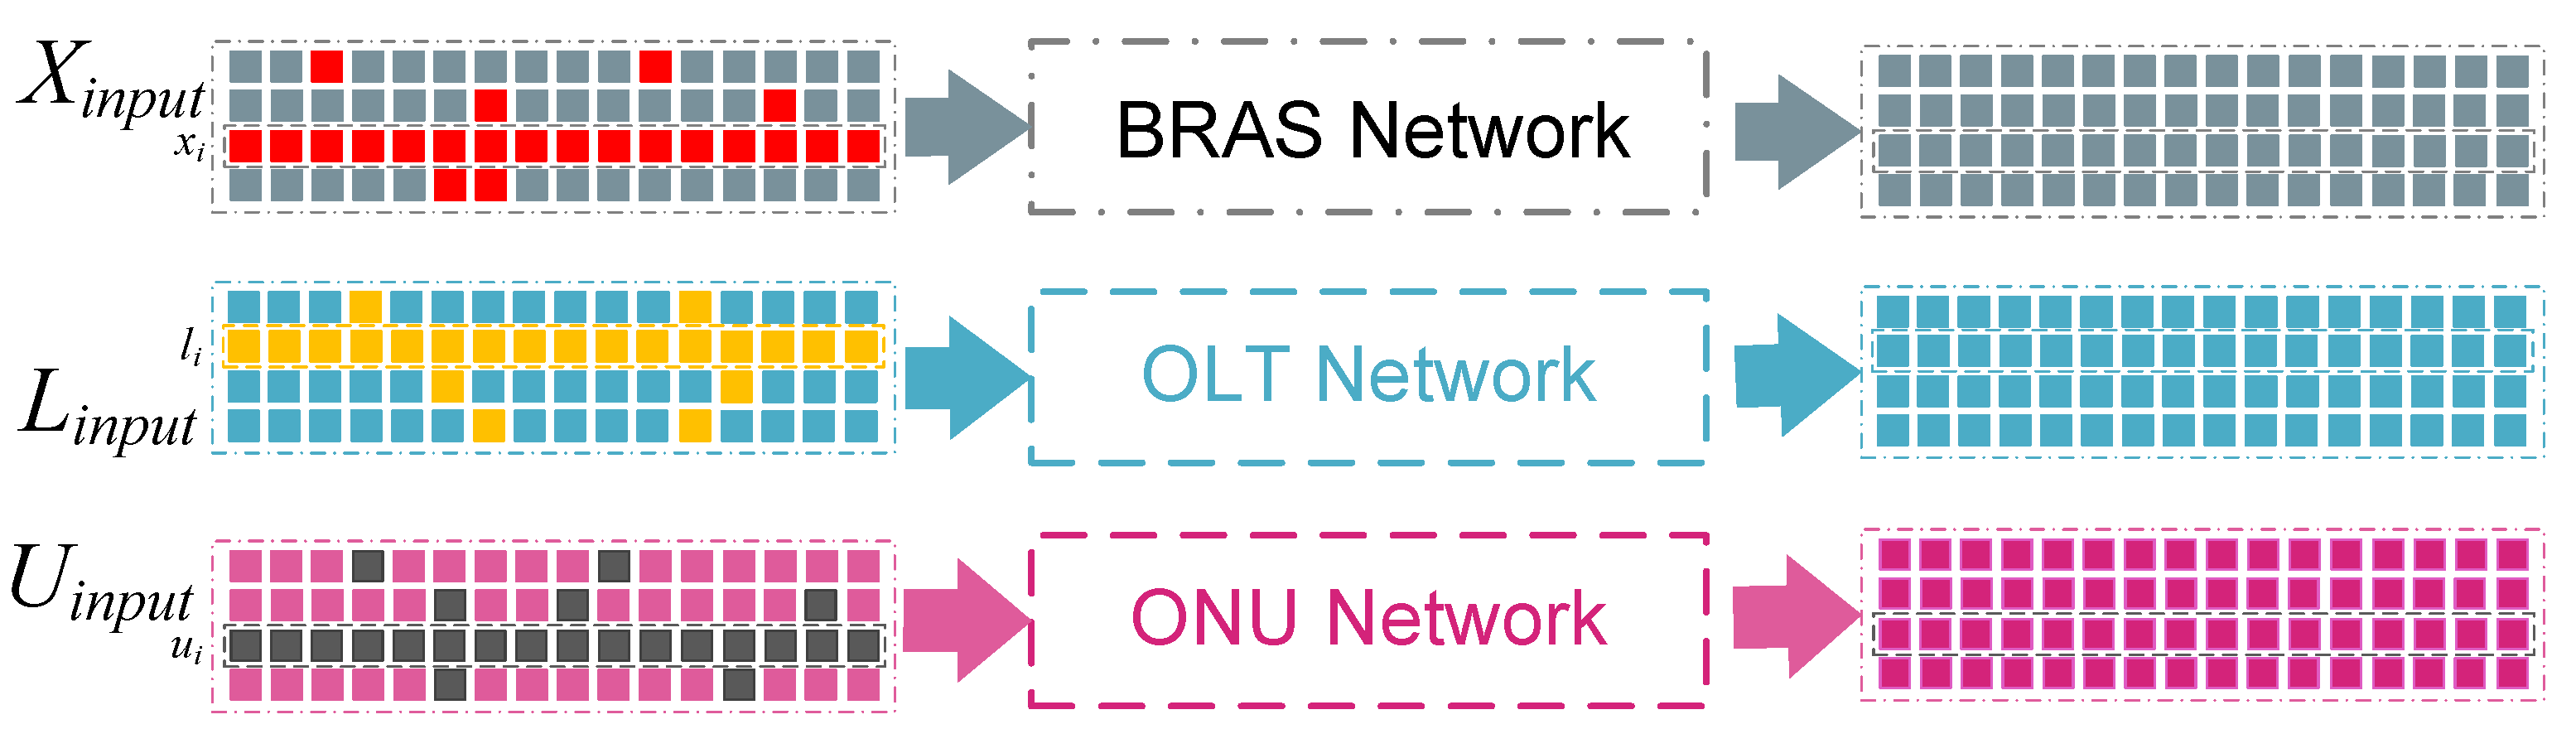
4.2. Device-Masked Pretraining

Pretraining is a semi-supervised learning method that creates training tasks using unlabeled data without human intervention, allowing the model to learn intrinsic patterns from the data. Originally proposed to develop Large Language Models (LLMs), pretraining has been successfully applied in models such as BERT and GPT. This paper introduces a device-mask pretraining (DMP) method designed to learn correlations among devices across different optical network layers, thereby enhancing prediction accuracy in the context of quality prediction.
Device-masked pretraining enables the model to predict masked values based on unmasked values. As illustrated in Figure 3, given inputs X, L, and U, the loss function of the device-masked pretraining method for the BRAS, OLT, and ONU layers is defined as follows:
L o s s d m p θ = 1 2 N H i = 1 N j = 1 H h θ i , j X y i j 2 ,
where h θ i , j ( X ) represents the predicted attribute of the i th device’s j th value, and y i j represents its actual value. We mask not only all devices but also specific values within each device. This approach enables the model to learn both the correlations between devices and the patterns within each individual device.

4.3. Time-Delayed Fine-Tuning

After pretraining, we fine-tune the pretrained model for the QoE prediction task. As mentioned in the first section, there is a time misalignment issue among the different layers of network devices. To address this, we employ a time-delay method to synchronize the timing. During fine-tuning, we use previous values as inputs to train the BRAS, OLT, and ONU layers. For instance, if the ONU layer updates its data at time t, the inputs X i n p u t and L i n p u t will be the delayed data from the previous time point, represented as X i n p u t t 1 and L i n p u t t 1 as follows:
Y ^ b r a s = B R A S ( L i n p u t t 1 ) ,
Y ^ o l t t = O L T ( B out t 1 , L i n p u t t ) ,
Y ^ o n u t = O N U ( L o u t p u t t , U i n p u t t ) ,
where Y ^ o l t t represents the binary classification prediction label of the OLT layer at time t. We use the binary cross-entropy loss function for fine-tuning the models, which is defined as:
Loss = i = 1 n y i log y ^ i .
During the testing phase, we do not repeatedly generate X input and L input ; instead, we reuse the output vectors from the corresponding layers to save computational resources.

5. Experiments

5.1. Experiments Settings and Details

Dataset: Experiments are conducted using the database mentioned in Section 3. In our experiments, we aligned the timestamps of the OLT, ONU, and BRAS information, integrating them into a dataset containing 42,000 entries with a total data volume of 31.8 GB to evaluate our method.
Training and testing partition: To simulate rich and scarce data conditions, we used standard k-fold and reverse k-fold cross-validation for evaluation. The standard k-fold cross-validation uses k-1 folds for training and the remaining fold for testing, whereas the reverse k-fold cross-validation uses one-fold validation for training and the remaining k-1 folds for testing.
Evaluation metric: Performance is evaluated using accuracy, precision, recall, and F1 Score. The definitions are as follows:
A c c u r a c y = T P + T N T P + T N + F P + F N ,
P r e c i s i o n = T P T P + F P ,
R e c a l l = T P T P + F N ,
F 1 = 2 × Precision × Recall Precision + Recall ,
where True Positive ( T P ) represents the number of positive samples that the model correctly predicts as positive. False Positive ( F P ) represents negative examples that are incorrectly predicted to be positive, also known as a “false alarm”. Similarly, True Negative ( T N ) represents negative samples that are correctly predicted, and False Negative ( F N ) represents positive samples that are incorrectly predicted.
Implementation details: We use the Transformer architecture to implement the proposed multi-level Transformer model. Models across different layers are pretrained and fine-tuned on a server with four Nvidia GeForce RTX 3090 GPUs. The server is rented from the AutoDL platform, and the specific manufacturer, city and country of the equipment cannot be identified. In the deployment phase, because data must be collected from the BRAS, OLT, and ONU layers, a single server’s general computing power is insufficient. Therefore, we deploy the models for each layer on separate machines and use PyTorch’s RPC framework to facilitate message communication between different servers.
Baseline methods: Although deep learning has been widely applied in fields such as computer vision (CV) and natural language processing (NLP), its application in Quality of Experience (QoE) assessment remains relatively limited. Currently, available research is based on simpler network models.
  • BRNN [15]: Bayesian-regularized neural networks for predicting QoE status, using patterns derived from objective QoE measurements and network statistics collected by the SDN controller to classify multimedia traffic.
  • DRL [16]: An adaptive multimedia traffic control mechanism based on Deep Reinforcement Learning (DRL), which integrates deep learning and reinforcement learning to learn from rewards through trial and error.
  • CNN [12]: A hybrid model combining a Convolutional Neural Network (CNN), a recurrent neural network, and a Gaussian process classifier.
  • LSTM [12]: An LSTM-based binary classifier that differentiates between live and on-demand streams in real-time with an accuracy exceeding 95%.

5.2. Experimental Results

5.2.1. Comparison with Other Methods

Table 4 presents the evaluation results of different methods applied to the ONU, OLT, and BRAS layers. The results indicate that the proposed method outperforms all other methods across every optical network layer. Notably, the accuracy of all methods is relatively lower in the OLT layer, whereas performance at the BRAS layer is slightly better. This discrepancy can be attributed to the functional nature of the OLT layer. Despite its crucial role, the OLT layer primarily acts as a distribution device. Provided there are no intrinsic issues within the OLT layer, its parameters have minimal impact on the Quality of Experience (QoE). Consequently, this results in observed prediction deviations for most methods in the OLT layer.

5.2.2. Ablation Study

To evaluate our proposed device-masked pretraining (DMP) method, we conducted assessments using both pretrained and non-pretrained models. The results, presented in Table 5, demonstrate that the MT model with DMP outperforms models without DMP pretraining across various network layers. Notably, the performance improvement is more significant in the BRAS layer than in the other layers, indicating that the DMP method enhances model performance by enabling it to learn both explicit and implicit connections between network devices. The improvement in the BRAS layer is particularly pronounced, while the OLT layer exhibits the least improvement. This disparity can be attributed to the more complex topology of devices in the BRAS layer compared to those in the OLT layer. Additionally, our analysis suggests that the intricate relationships and dependencies in the BRAS layer provide more opportunities for the DMP method to capture valuable patterns, resulting in greater performance gains. In contrast, the simpler and more straightforward topology of the OLT layer limits the extent to which the DMP can improve prediction accuracy.

6. Discussion and Conclusions

In this paper, we define the standard data representation for metropolitan optical networks in each device layer and created a Live Stream Quality of Experience (LSQE) dataset, containing 5 million records from over 300,000 users over a 7-day period. The LSQE database is utilized to evaluate both previous works and our proposed method. We introduce a multi-layer Transformer model for real-time video quality prediction, pretrained with a device-masked pretraining task, and fine-tuned to predict the QoE of real-time video. The experimental results demonstrate that the proposed RTM model outperforms other methods, and the DMP approach effectively captures valuable patterns among devices, leading to significant performance gains. Future work will focus on refining the DMP method to further enhance its effectiveness across all network layers and exploring its application to other types of network infrastructures.
Future work will focus on refining the DMP method to further enhance its effectiveness across all network layers and exploring its application to other types of network infrastructures. In addition, considering the real-world network conditions, we realize that there is still room for potential improvement during the implementation process. On the one hand, although the current model implementation shows great promise, its complexity is relatively high, especially in the implementation stage of higher network layers where computational resource requirements are large. Subsequently, the algorithm complexity can be optimized to reduce resource consumption, so as to better adapt to actual networks with limited resources, such as small network environments. On the other hand, most of the experiments were carried out under controlled conditions, and insufficient consideration was given to the real-time changes in actual networks. Future studies should further investigate the adaptability of the model when facing real-time situations, such as dynamic network changes, attacks, and failures, to improve its stability and reliability in actual complex network environments.

Author Contributions

Conceptualization, J.-P.L. and X.-Q.L.; methodology, W.J.; software, W.J.; validation, W.J., J.-P.L. and X.-Y.L.; formal analysis, J.-P.L.; investigation, W.J.; resources, X.-Q.L.; data curation, J.-P.L.; writing—original draft preparation, W.J.; writing—review and editing, X.-Q.L.; visualization, W.J.; supervision, X.-Q.L.; project administration, X.-Q.L. All authors have read and agreed to the published version of the manuscript.

Funding

This work was supported by the National Natural Science Foundation of China (Grant No. 61370073); the National High Technology Research and Development Program of China (Grant No. 2007AA01Z423); the project of the Science and Technology Department of Sichuan Province (Grant No. 2021YFG0322); the Science and Technology Department of Chongqing Municipality (Grant No. CSTC2022JXJL00017); the Science and Technology Research Program of Chongqing Municipal Education Commission (Grant No. KJZD-K202114401); Chongqing Qinchengxing Technology Co., Ltd.; Chengdu Haitian Digital Technology Co., Ltd.; Chengdu Chengdian Network Technology Co., Ltd.; Chengdu Civil-Military Integration Project Management Co., Ltd.; and Sichuan Yin Ten Gu Technology Co., Ltd.

Data Availability Statement

The data presented in this study are available on request from the corresponding author. Our data includes information about actual operating network devices and their status. Making this data public would provide potential targets for cyber-attackers. Therefore, we provide processed data to avoid privacy leakage.

Conflicts of Interest

Author Xin-Yan Li was employed by the company China Telecom Group Co., Ltd. The remaining authors declare that the research was conducted in the absence of any commercial or financial relationships that could be construed as a potential conflict of interest.

References

  1. Farhady, H.; Lee, H.; Nakao, A. Software-Defined Networking: A survey. Comput. Netw. 2015, 81, 79–95. [Google Scholar] [CrossRef]
  2. Xia, W.; Wen, Y.; Foh, C.H.; Niyato, D.; Xie, H. A Survey on Software-Defined Networking. IEEE Commun. Surv. Tutor. 2015, 17, 27–51. [Google Scholar] [CrossRef]
  3. Tadros, C.N.; Rizk, M.R.; Mokhtar, B.M. Software defined network-based management for enhanced 5G network services. IEEE Access 2020, 8, 53997–54008. [Google Scholar] [CrossRef]
  4. Li, Y.; Chen, M. Software-defined network function virtualization: A survey. IEEE Access 2015, 3, 2542–2553. [Google Scholar] [CrossRef]
  5. Eramo, V.; Miucci, E.; Ammar, M.; Lavacca, F.G. An approach for service function chain routing and virtual function network instance migration in network function virtualization architectures. IEEE/ACM Trans. Netw. 2017, 25, 2008–2025. [Google Scholar] [CrossRef]
  6. Begović, M.; Čaušević, S.; Avdagić-Golub, E. QoS Management in Software Defined Networks for IoT Environment: An Overview. Int. J. Qual. Res. 2021, 15, 171–188. [Google Scholar] [CrossRef]
  7. Said, O. Design and performance evaluation of QoE/QoS-oriented scheme for reliable data transmission in Internet of Things environments. Comput. Commun. 2022, 189, 158–174. [Google Scholar] [CrossRef]
  8. Varyani, N.; Zhang, Z.L.; Dai, D. QROUTE: An Efficient Quality of Service (QoS) Routing Scheme for Software-Defined Overlay Networks. IEEE Access 2020, 8, 104109–104126. [Google Scholar] [CrossRef]
  9. Wang, J.; Lin, C.; Siahaan, E.; Chen, B.; Chuang, H. Mixed Sound Event Verification on Wireless Sensor Network for Home Automation. IEEE Trans. Ind. Inform. 2014, 10, 803–812. [Google Scholar] [CrossRef]
  10. Tsolkas, D.; Liotou, E.; Passas, N.; Merakos, L. A survey on parametric QoE estimation for popular services. J. Netw. Comput. Appl. 2017, 77, 1–17. [Google Scholar] [CrossRef]
  11. Kim, H.J.; Choi, S.G. A study on a QoS/QoE correlation model for QoE evaluation on IPTV service. In Proceedings of the The 12th International Conference on Advanced Communication Technology (ICACT), Gangwon-Do, Republic of Korea, 7–10 February 2010; Volume 2, pp. 1377–1382. [Google Scholar]
  12. Lopez-Martin, M.; Carro, B.; Lloret, J.; Egea, S.; Sanchez-Esguevillas, A. Deep Learning Model for Multimedia Quality of Experience Prediction Based on Network Flow Packets. IEEE Commun. Mag. 2018, 56, 110–117. [Google Scholar] [CrossRef]
  13. Mehr, S.K.; Jogalekar, P.; Medhi, D. Moving QoE for monitoring DASH video streaming: Models and a study of multiple mobile clients. J. Internet Serv. Appl. 2021, 12, 1. [Google Scholar] [CrossRef]
  14. Hoßfeld, T.; Schatz, R.; Biersack, E.; Plissonneau, L. Internet video delivery in youtube: From traffic measurements to quality of experience. In Lecture Notes in Computer Science (Including Subseries Lecture Notes in Artificial Intelligence and Lecture Notes in 396 Bioinformatics); Springer: Berlin/Heidelberg, Germany, 2013; Volume 7754. [Google Scholar] [CrossRef]
  15. Canovas, A.; Rego, A.; Romero, O.; Lloret, J. A robust multimedia traffic SDN-Based management system using patterns and models of QoE estimation with BRNN. J. Netw. Comput. Appl. 2020, 150, 102498. [Google Scholar] [CrossRef]
  16. Huang, X.; Yuan, T.; Qiao, G.; Ren, Y. Deep Reinforcement Learning for Multimedia Traffic Control in Software Defined Networking. IEEE Netw. 2018, 32, 35–41. [Google Scholar] [CrossRef]
  17. Moreolo, M.S.; Fabrega, J.M.; Martín, L.; Christodoulopoulos, K.; Varvarigos, E.; Fernández-Palacios, J.P. Flexgrid technologies enabling BRAS centralization in MANs. J. Opt. Commun. Netw. 2016, 8, A64–A75. [Google Scholar] [CrossRef]
  18. Kumar, L.; Singh, A.; Sharma, V. Analysis on multiple optical line terminal passive optical network based open access network. Front. Optoelectron. 2019, 12, 208–214. [Google Scholar] [CrossRef]
  19. Hamza, B.J.; Saad, W.K.; Shayea, I.; Ahmad, N.; Mohamed, N.; Nandi, D.; Gholampour, G. Performance enhancement of SCM/WDM-RoF-XGPON system for bidirectional transmission with square root module. IEEE Access 2021, 9, 49487–49503. [Google Scholar] [CrossRef]
  20. Ahmed, S.; Butt, R.A.; Aslam, M.I. Simultaneous Upstream and Inter Optical Network Unit Communication for Next Generation PON. Eng. Proc. 2023, 32, 20. [Google Scholar] [CrossRef]
  21. Ibarrola, E.; Davis, M.; Voisin, C.; Close, C.; Cristobo, L. A Machine Learning Management Model for QoE Enhancement in Next-Generation Wireless Ecosystems. In Proceedings of the 2018 ITU Kaleidoscope: Machine Learning for a 5G Future (ITU K), Santa Fe, Argentina, 26–28 November 2018; pp. 1–8. [Google Scholar] [CrossRef]
  22. Shen, M.; Zhang, J.; Xu, K.; Zhu, L.; Liu, J.; Du, X. DeepQoE: Real-time Measurement of Video QoE from Encrypted Traffic with Deep Learning. In Proceedings of the 2020 IEEE/ACM 28th International Symposium on Quality of Service (IWQoS), Hangzhou, China, 15–17 June 2020; pp. 1–10. [Google Scholar] [CrossRef]
  23. Seshadrinathan, K.; Soundararajan, R.; Bovik, A.C.; Cormack, L.K. Study of subjective and objective quality assessment of video. IEEE Trans. Image Process. 2010, 19, 1427–1441. [Google Scholar] [CrossRef]
  24. Phuong, M.; Lampert, C.H. The inductive bias of ReLU networks on orthogonally separable data. In Proceedings of the 9th International Conference on Learning Representations, ICLR 2021, Virtual Event, 3–7 May 2021. [Google Scholar]
  25. Wang, J.; Yu, L.C.; Lai, K.R.; Zhang, X. Dimensional sentiment analysis using a regional CNN-LSTM model. In Proceedings of the 54th Annual Meeting of the Association for Computational Linguistics, ACL 2016—Short Papers, Berlin, Germany, 7–12 August 2016; pp. 225–230. [Google Scholar]
  26. Wang, J.; Yu, L.C.; Lai, K.R.; Zhang, X. Investigating dynamic routing in tree-structured LSTM for sentiment analysis. In Proceedings of the 2019 Conference on Empirical Methods in Natural Language Processing and the 9th International Joint Conference on Natural Language Processing (EMNLP-IJCNLP); Association for Computational Linguistics: Hongkong, China, 2019; pp. 3432–3437. [Google Scholar] [CrossRef]
  27. Bai, L.; Abe, H.; Lee, C. RNN-based approach to TCP throughput prediction. In Proceedings of the 2020 Eighth International Symposium on Computing and Networking Workshops (CANDARW), Naha, Japan, 24–27 November 2020; IEEE: Piscataway, NJ, USA, 2020; pp. 391–395. [Google Scholar]
  28. Vaswani, A.; Shazeer, N.; Parmar, N.; Uszkoreit, J.; Jones, L.; Gomez, A.N.; Kaiser, Ł.; Polosukhin, I. Attention is all you need. In Proceedings of the 31st Conference on Neural Information Processing Systems (NIPS 2017), Long Beach, CA, USA, 4–9 December 2017; pp. 5998–6009. [Google Scholar] [CrossRef]
  29. Devlin, J.; Chang, M.W.W.; Lee, K.; Toutanova, K. BERT: Pre-training of deep bidirectional transformers for language understanding. In Proceedings of the 2019 Conference of the North American Chapter of the Association for Computational Linguistics: Human Language Technologies (NAACL-HLT 2019); Association for Computational Linguistics: Kerrville, TX, USA, 2019; Volume 1, pp. 4171–4186. [Google Scholar] [CrossRef]
  30. Liu, W.; Zhou, P.; Zhao, Z.; Wang, Z.; Ju, Q.; Deng, H.; Wang, P. K-BERT: Enabling Language Representation with Knowledge Graph. In Proceedings of the AAAI Conference on Artificial Intelligence (AAAI-2020), New York, NY, USA, 7–12 February 2020; pp. 2901–2908. [Google Scholar] [CrossRef]
  31. Reimers, N.; Gurevych, I. Sentence-BERT: Sentence Embeddings using Siamese BERT-Networks. In Proceedings of the 2019 Conference on Empirical Methods in Natural Language Processing and the 9th International Joint Conference on Natural Language Processing, EMNLP-IJCNLP 2019, Hong Kong, China, 3–7 November 2019; Inui, K., Jiang, J., Ng, V., Wan, X., Eds.; Association for Computational Linguistics: Kerrville, TX, USA, 2019; pp. 3980–3990. [Google Scholar] [CrossRef]
  32. Lin, W.; Liao, L.C. Lexicon-based prompt for financial dimensional sentiment analysis. Expert Syst. Appl. 2024, 244, 122936. [Google Scholar] [CrossRef]
  33. Achiam, J.; Adler, S.; Agarwal, S.; Ahmad, L.; Akkaya, I.; Aleman, F.L.; Almeida, D.; Altenschmidt, J.; Altman, S.; Anadkat, S.; et al. Gpt-4 technical report. arXiv 2023, arXiv:2303.08774. [Google Scholar]
  34. Brown, T.B.; Mann, B.; Ryder, N.; Subbiah, M.; Kaplan, J.D.; Dhariwal, P.; Neelakantan, A.; Shyam, P.; Sastry, G.; Askell, A.; et al. Language models are few-shot learners. Adv. Neural Inf. Process. Syst. 2020, 33, 1877–1901. [Google Scholar] [CrossRef]
  35. Ouyang, L.; Wu, J.; Jiang, X.; Almeida, D.; Wainwright, C.; Mishkin, P.; Zhang, C.; Agarwal, S.; Slama, K.; Ray, A.; et al. Training language models to follow instructions with human feedback. In Proceedings of the Advances in Neural Information Processing Systems; Koyejo, S., Mohamed, S., Agarwal, A., Belgrave, D., Cho, K., Oh, A., Eds.; Curran Associates, Inc.: Red Hook, NY, USA, 2022; Volume 35, pp. 27730–27744. [Google Scholar] [CrossRef]
  36. Xie, H.; Lin, W.; Lin, S.; Wang, J.; Yu, L.-C. A Multi-dimensional Relation Model for Dimensional Sentiment Analysis. Inform. Sci. 2021, 579, 832–844. [Google Scholar] [CrossRef]
  37. He, K.; Chen, X.; Xie, S.; Li, Y.; Dollar, P.; Girshick, R. Masked Autoencoders Are Scalable Vision Learners. In Proceedings of the IEEE Computer Society Conference on Computer Vision and Pattern Recognition(CVPR 2022), New Orleans, LA, USA, 18–24 June 2022; IEEE Computer Society: Piscataway, NJ, USA, 2022; pp. 15979–15988. [Google Scholar] [CrossRef]
  38. Zhang, C.C.; Zhang, C.C.; Song, J.; Seon, J.; Yi, K.; Zhang, K.; Kweon, I.S.; Yi, J.S.K.; Zhang, K.; Kweon, I.S. A Survey on Masked Autoencoder for Self-supervised Learning in Vision and Beyond. arXiv 2022, arXiv:2208.00173. [Google Scholar] [CrossRef]
  39. Zhu, W.; Yin, J.L.; Chen, B.H.; Liu, X. SRoUDA: Meta Self-Training for Robust Unsupervised Domain Adaptation. Proc. AAAI Conf. Artif. Intell. 2023, 37, 3852–3860. [Google Scholar] [CrossRef]
  40. Ying, C.; Cai, T.; Luo, S.; Zheng, S.; Ke, G.; He, D.; Shen, Y.; Liu, T.Y. Do Transformers Really Perform Badly for Graph Representation? In Proceedings of the Thirty-Fifth Conference on Neural Information Processing Systems, New Orleans, LA, USA, 28 November–9 December 2021. [Google Scholar] [CrossRef]
  41. Shi, Y.; Zheng, S.; Ke, G.; Shen, Y.; You, J.; He, J.; Luo, S.; Liu, C.; He, D.; Liu, T.Y. Benchmarking Graphormer on Large-Scale Molecular Modeling Datasets. arXiv 2022, arXiv:2203.04810. [Google Scholar]
Figure 1. Illustration of the main components in a metropolitan optical network.
Mathematics 13 00834 g001
Figure 2. Overview of the proposed Real-time Multi-level Transformer (RMT) for detecting the downgrade events of QoE in live streams.
Mathematics 13 00834 g002
Figure 3. Device-masked pretraining method, x i , l i , and u i denote the attributes of the i th device.
Mathematics 13 00834 g003
Table 4. The evaluation results of different methods on the ONU, OLT, and BRAS layers were obtained using 5-fold cross-validation.
LayerMethodAccPreRecF1
ONUCNN0.7150.6410.7670.699
LSTM0.7620.6870.8220.749
BRNN0.7480.6640.8190.734
DRL0.7760.7120.8320.768
MT(Ours)0.8060.7250.8720.792
OLTCNN0.6650.6110.7270.659
LSTM0.6920.6270.7620.684
BRNN0.7080.6340.7680.694
DRL0.7160.6820.8020.718
MT(Ours)0.7660.6950.8420.732
BRASCNN0.7450.6710.8170.739
LSTM0.8220.7470.8720.809
BRNN0.8080.6940.8790.774
DRL0.8360.7620.8720.798
MT(Ours)0.8560.7650.9120.822
Table 5. Evaluation results of proposed methods with or without device-masked pretraining on the ONU, OLT, and BRAS layers. (5-fold cross validation).
LayerMethodAccPreRecF1
ONUMT w/o DMP0.7880.7120.8550.778
MT w/ DMP0.8060.7250.8720.792
OLTMT w/o DMP0.7560.6820.8320.725
MT w/ DMP0.7660.6950.8420.732
BRASMT w/o DMP0.8360.7620.8720.798
MT w/ DMP0.8560.7650.9120.822
Disclaimer/Publisher’s Note: The statements, opinions and data contained in all publications are solely those of the individual author(s) and contributor(s) and not of MDPI and/or the editor(s). MDPI and/or the editor(s) disclaim responsibility for any injury to people or property resulting from any ideas, methods, instructions or products referred to in the content.

