Article

Modeling Information Diffusion on Social Media: The Role of the Saturation Effect

by
Julia Atienza-Barthelemy
,
Juan C. Losada
* and
Rosa M. Benito
Grupo de Sistemas Complejos, Escuela Técnica Superior de Ingeniería Agronómica, Alimentaria y de Biosistemas, Universidad Politécnica de Madrid, Av. Puerta de Hierro, 2, 28040 Madrid, Spain
*
Author to whom correspondence should be addressed.
Mathematics 2025, 13(6), 963; https://doi.org/10.3390/math13060963
Submission received: 14 January 2025 / Revised: 5 March 2025 / Accepted: 9 March 2025 / Published: 14 March 2025
(This article belongs to the Special Issue Computational Intelligence for Complex Systems)

Abstract

:
In an era where social media shapes public opinion, understanding information spreading is key to grasping its broader impact. This paper explores the intricacies of information diffusion on Twitter, emphasizing the significant influence of content saturation on user engagement and retweet behaviors. We introduce a diffusion model that quantifies the likelihood of retweeting relative to the number of accounts a user follows. Our findings reveal a significant negative correlation where users following many accounts are less likely to retweet, suggesting a saturation effect in which exposure to information overload reduces engagement. We validate our model through simulations, demonstrating its ability to replicate real-world retweet network characteristics, including diffusion size and structural properties. Additionally, we explore this saturation effect on the temporal behavior of retweets, revealing that retweet intervals follow a stretched exponential distribution, which better captures the gradual decline in engagement over time. Our results underscore the competitive nature of information diffusion in social networks, where tweets have short lifespans and are quickly replaced by new information. This study contributes to a deeper understanding of content propagation mechanisms, offering a model with broad applicability across contexts, and highlights the importance of information overload in structural and temporal social media dynamics.

1. Introduction

In the contemporary landscape of online social networks, information has undergone significant transformations in its sources, characteristics, volume, and methods of dissemination, with these attributes being intricately interconnected [1]. Anyone with Internet access can generate and consume information immediately in real time. This ability to amplify voices and encourage global debate has radically transformed the distribution of influence [2]. People no longer rely exclusively on traditional media or intermediaries to keep informed, although this does not guarantee that the same hierarchies of the offline world are reproduced [3]. In addition, social networks make visible underrepresented issues that do not always receive coverage in the conventional media [4] and encourage the active participation of people in public debate [5]. It is also important to note that these platforms make it easier for people to find and connect with communities that share similar interests and experiences. This is especially valuable for those who seek support or wish to share hobbies and a specific type of humor [6,7].
As the creation of news, opinions, and other content is now available to significantly broader audiences, and these platforms allow the massive transmission of such content, the volume of information to which people are exposed has increased dramatically. One critical effect of this amount of content is the so-called saturation effect. Saturation in social networks refers to the overabundance of content generated by users, brands, and platforms that exceeds the cognitive processing capacity of individuals [8,9,10]. This phenomenon occurs when the volume of information available on platforms such as Facebook, Instagram, or Twitter becomes so large that users experience an overload [8,11].
Information overload on social networks contributes to issues such as techno-stress [9,11,12], distraction, and errors, which affect decision making and cognitive processing. Prolonged exposure to information generates mental exhaustion, causing users to lose interest and feel overwhelmed [10,11,12], which often results in temporary or permanent abandonment of the platforms [11,12]. In addition, the rapid and superficial consumption of content diminishes users’ ability to engage, which makes it difficult to deepen and leads to fragmented understanding [9,11]. It also reduces user engagement in their interaction with the content, resulting in an increased competition by brands and content creators to capture the user’s attention [9,11]. Moreover, saturation facilitates the spread of fake news and misinformation, as users do not have enough time to verify information [11,12]. Exposure to sensationalist content further dulls emotional responses [10,11,12], and many users feel pressure to stay connected because of the fear of missing out [12,13].
Taking these factors into account, it is clear that the saturation effect in social networks plays a critical role in shaping the dissemination of information on these platforms. The aim of this work is to assess the extent to which this phenomenon affects the diffusion process. Online networks, with their decentralized structures, have revolutionized communication patterns and the way information spreads. The dissemination process is governed by intricate mechanisms that depend not only on the topological structure of social networks but also on the dynamic behavior of individual users and their real-time interactions [14]. At the same time, information spread on social networks is a complex phenomenon, where saturation can significantly affect the outcome [15]. The way information is shared and consumed over time carries profound implications for sociopolitical and cultural contexts. For instance, the speed of response to crises (such as natural disasters or political scandals) can affect the capacity to mobilize public opinion [16]. Similarly, the duration of interest in a particular issue, whether it be a social movement or cultural event, influences how long it remains in the media spotlight and sustains public support [17]. Therefore, this study concentrates on analyzing the dissemination of content within a decentralized social network environment, where user interaction is key in determining which information gets amplified and how it circulates. Moreover, by examining its temporal dimension, we aim to understand how information dissemination evolves over time. This analysis seeks to unveil and quantify the extent to which the saturation effect influences users’ behavior in sharing and consuming content.
For this purpose, we explore content diffusion on Twitter, now called X, where messages spread in a complex, decentralized, and dynamic environment. Within this social network, users can follow each other in a non-reciprocal way. When a user posts a tweet, it is visible to all their followers, who have the option to retweet it and make the content visible to their followers. This is why the network of followers is called the substrate in which the diffusion process takes place [18]. To study this diffusion process, we analyze three case studies involving discussions of globally relevant events: the Fridays for Future protests in September 2019, the general elections in Spain in November 2019, and the U.S. presidential election in November 2020. These events offer us a unique opportunity to observe information dissemination in diverse political and geographic backgrounds.
In the first part of this paper, we studied the spatial dimension of content diffusion. A fundamental aspect of this area of study is the search for a predictive model of the structural diffusion pattern that can be applied in a general way to different contexts. Several approaches have been used to model information propagation, from contagion models, such as the SIR (susceptible-infected-recovered) model, which simulates diffusion in an epidemic-like manner [19,20], to models based on information cascades, which consider the activation of various layers in the network as content in the previous layer is retweeted [21,22,23]. Similarly, threshold dynamics models, which emphasize the role of social pressure in users’ decisions to retweet [24,25], have been explored. Each of these approaches has contributed to our understanding of how information is disseminated within social networks, but also has limitations in their generalized applicability, as many of them are designed for specific contexts and may not adequately capture the complexity of interactions on diverse platforms. In this context, the search for a broadly applicable model in our research is based on the need to develop an approach that integrates individual user behavior with the dynamics of diffusion. Our goal is not only to identify patterns in content dissemination and study the effect of saturation but also to create a model that can accurately predict how information propagates in different situations. Thus, after obtaining the data using the Twitter API, we decided to study the possible presence of the saturation effect on the likelihood that a user retweets. To do so, we explore the dependence of this likelihood on the amount of information a user receives, which will be proportional to the number of users they follows. Based on our findings, we propose a model that fits the experimental data accurately. This model uses the approximation that the diffusion mechanism depends on users’ attributes without taking into account the content or sentiment of the message. We perform simulations on real networks to confirm that our model can effectively predict both the size and structure of the retweet networks.
The saturation of information on the Internet directly impacts the temporal dynamics of tweet diffusion. As users are exposed to an ever increasing volume of content, their attention and processing capacity decrease, a phenomenon examined in recent studies on “information overload” and its effects on social networks [26]. This scenario shortens the visibility window for each tweet, with content that does not receive rapid interaction quickly pushed aside by new posts [27]. Consequently, the lifespan of tweets is reduced, meaning that a message’s initial diffusion is brief, and its visibility largely depends on the precise timing of its publication. Finally, we analyze the temporal dimension of the diffusion processes and we discuss again the presence of the saturation effect. The temporal dynamics of information diffusion on social media platforms have been the subject of extensive research, examining how the time intervals between original tweets and their corresponding retweets can be statistically modeled. Traditionally, power-law distributions have been a common tool for characterizing these processes, suggesting that a small number of messages receive a disproportionately high volume of retweets, while the majority accumulate interactions more slowly [28,29,30]. However, recent studies suggest that the temporal dynamics of diffusion might be better modeled using alternative functions such as the stretched exponential function and the Weibull distribution. These models provide a more nuanced understanding of the diffusion process, effectively capturing both the initial rapid dissemination phase and the subsequent decay in retweet activity over time [22,31,32]. In this study, we focus on the temporal diffusion of tweets across the three distinct conversations considered. Through analyzing the time intervals between original tweets and their retweets, we find that the stretched exponential function provides an excellent fit for our data, accurately describing the distribution of these temporal intervals. A key finding is that the change in the decay rate of diffusion occurs at similar time points across the three conversations, suggesting the presence of underlying patterns in how information propagates and eventually saturates within the platform. Furthermore, the results explain the saturation effect in the spreading of information, in which, as time goes by, content is quickly replaced by new content.

2. Datasets

The dataset employed for the diffusion model consists of three case studies of information diffusion on the social media platform Twitter, now renamed as X. These case studies encompass discussions on topics from different geographic regions, thereby ensuring broader universality of the findings.
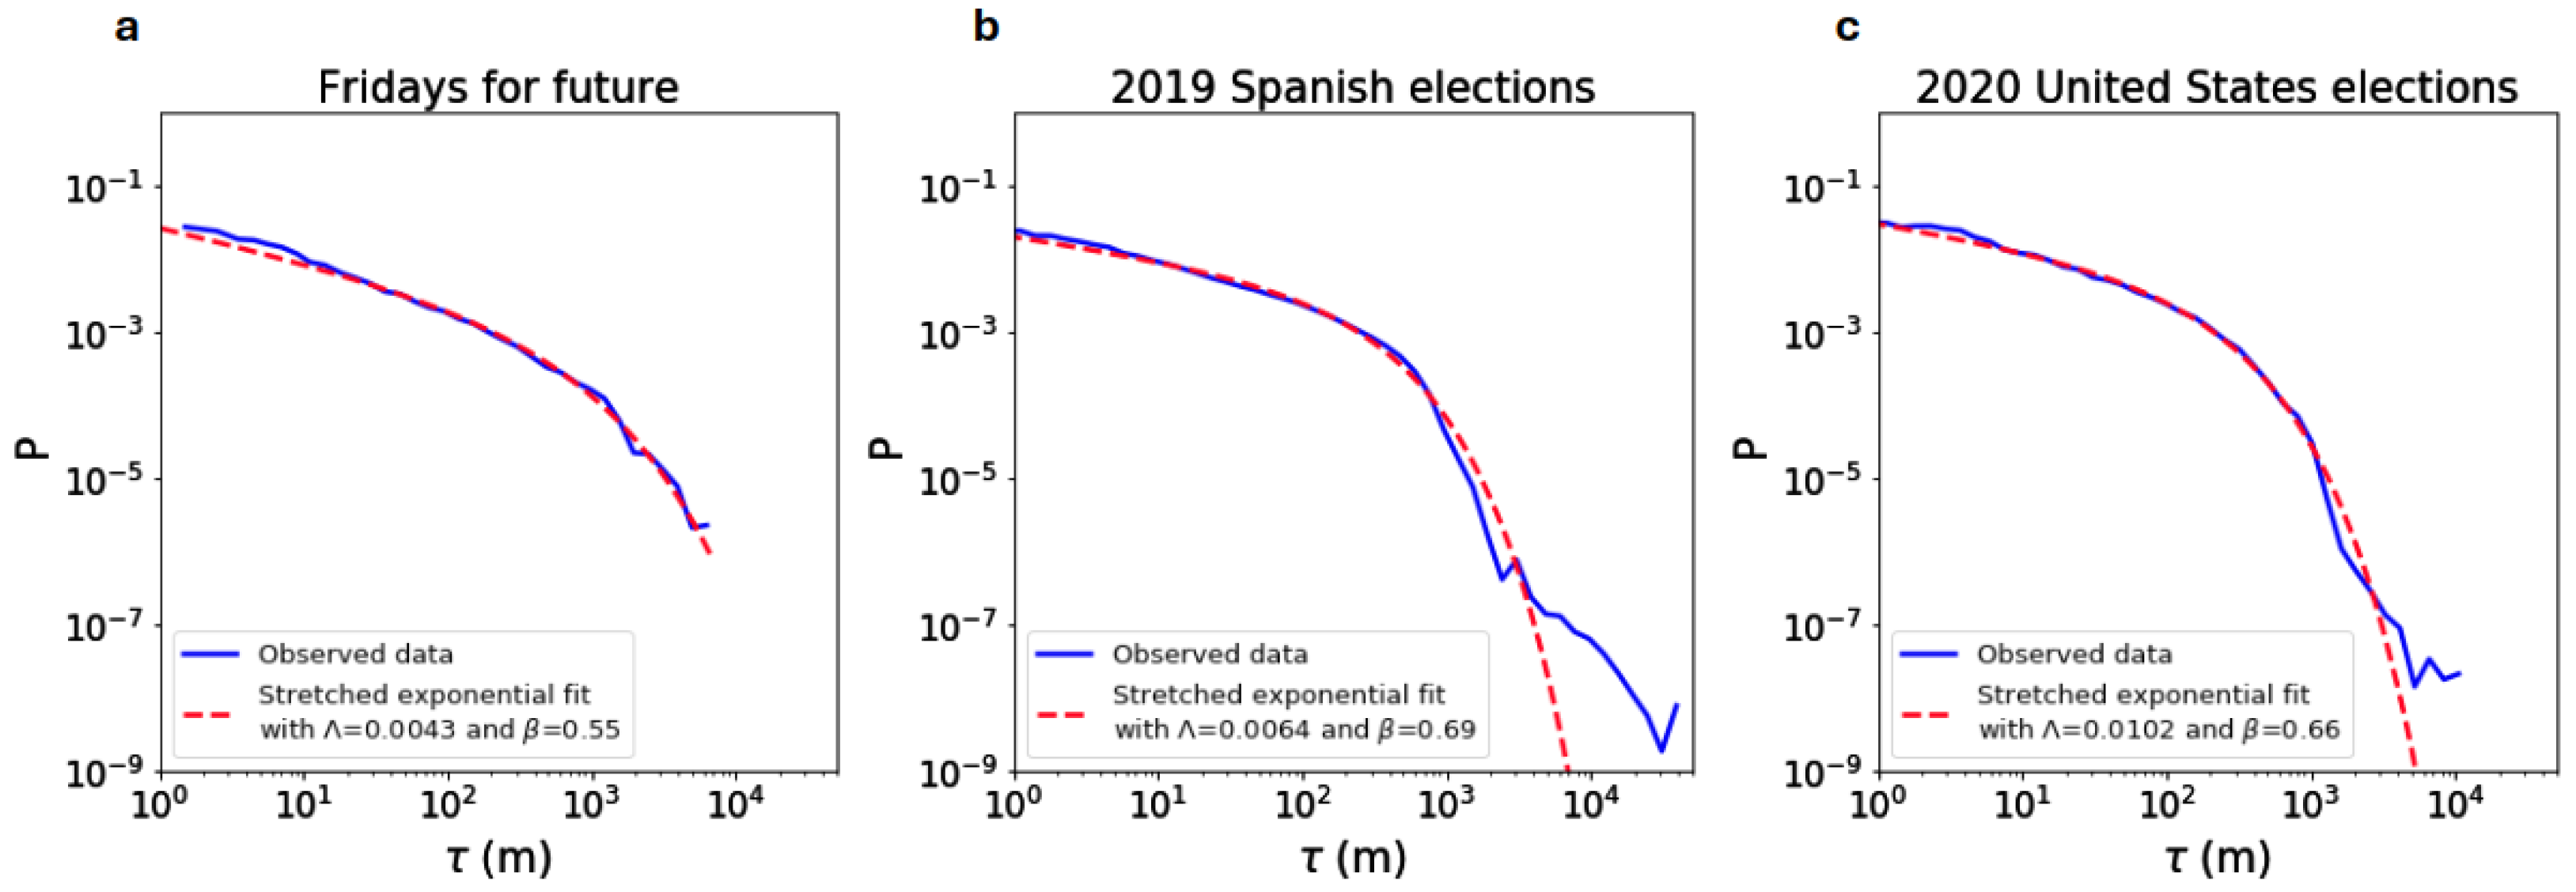
  • Fridays for future: An international student-led movement advocating for urgent measures to combat global warming and climate change. The collected data are temporarily situated in the week of September 2019, when this movement prompted several global climate strikes.
  • 2019 Spanish general elections: These elections took place on 10 November, the second time that year due to the failure to establish a government. The data comprise the discussion on this topic that occurred two days prior, on 8 November.
  • 2020 United States elections: This case study is based on a conversation that took place two days before the elections held on 3 November 2020.
The tweets for these three case studies were acquired using the Twitter Streaming API, which filters and retrieves tweets in real time based on specific keywords. For each case study, a set of keywords was selected to download tweets only related to the topic, trying to obtain the largest possible collection of tweets. For example, for the 2019 Spanish elections case study, the keywords considered include terms in Spanish related to political parties (e.g., PSOE, PP, Vox, Unidas Podemos), political leaders (Pedro Sánchez, Pablo Casado, Pablo Iglesias, Santiago Abascal, etc.), campaign slogans (e.g., PorTodoLoQueNosUne, UnGobiernoContigo), general election-related terms (10N, elecciones, votar), and specific references to topics such as debates.

2.1. Model Diffusion Data

The metadata provided makes it possible to link retweets to their original tweets (i.e., the tweet that has been reposted). This enables the construction of a retweet network of the conversation, establishing connections between users who have retweeted one another. It is important to clarify that this network captures who has retweeted an original tweet, establishing a link between the two users. However, it does not account for retweet chains, which connect users who retweet to the source from which they saw the tweet, whether it is the original author or another user who retweeted it.
Besides the retweet network, we retrieved the follower connections between the users involved in each case study using the REST API. We checked if there was a following relationship between each pair of users of all users of the downloaded tweets, thereby creating a follower network, which is crucial for the diffusion model. Figure 1 shows a scheme of these two directed networks, the retweet and the follower networks. There may be some users involved in the conversation because they have written a tweet, so they appear in the followers network, but whose tweets have not received any retweet. If, in addition to that, they did not retweet any tweet from another user, they will not appear in the retweet network.
To summarize, Table 1 shows the most relevant global information related to the size of the networks built from the datasets employed in our study. It is shown here that we have a sufficiently large retweet network that allows us to study and model the diffusion of these tweets. In addition, we have a large network of followers that will constitute the substrate on which the diffusion process under study takes place [18].

2.2. Data for the Temporal Analysis

To build the dataset to explore temporal behavior, we use the retweets that took place within the previously mentioned time window (see Table 2). While we limit our selection to retweets from this period, they still can be considered as a random sample in terms of time intervals since their corresponding original tweets do not necessarily fall within the same time frame. In other words, we capture retweets occurring in this time window, but their original tweets may have been posted at any previous time. When retrieving the retweets metadata, the original tweet’s information is always included, regardless of when it was posted, including its timestamp. This ensures that we have the original tweets for all the retweets considered, allowing us to calculate the time interval between events. Since we are doing a study of time intervals, and not cascade length, this way of sampling the data does not affect the results. In summary, the general information of the datasets considered for the temporal study is summarized in Table 2.

3. Results and Discussion

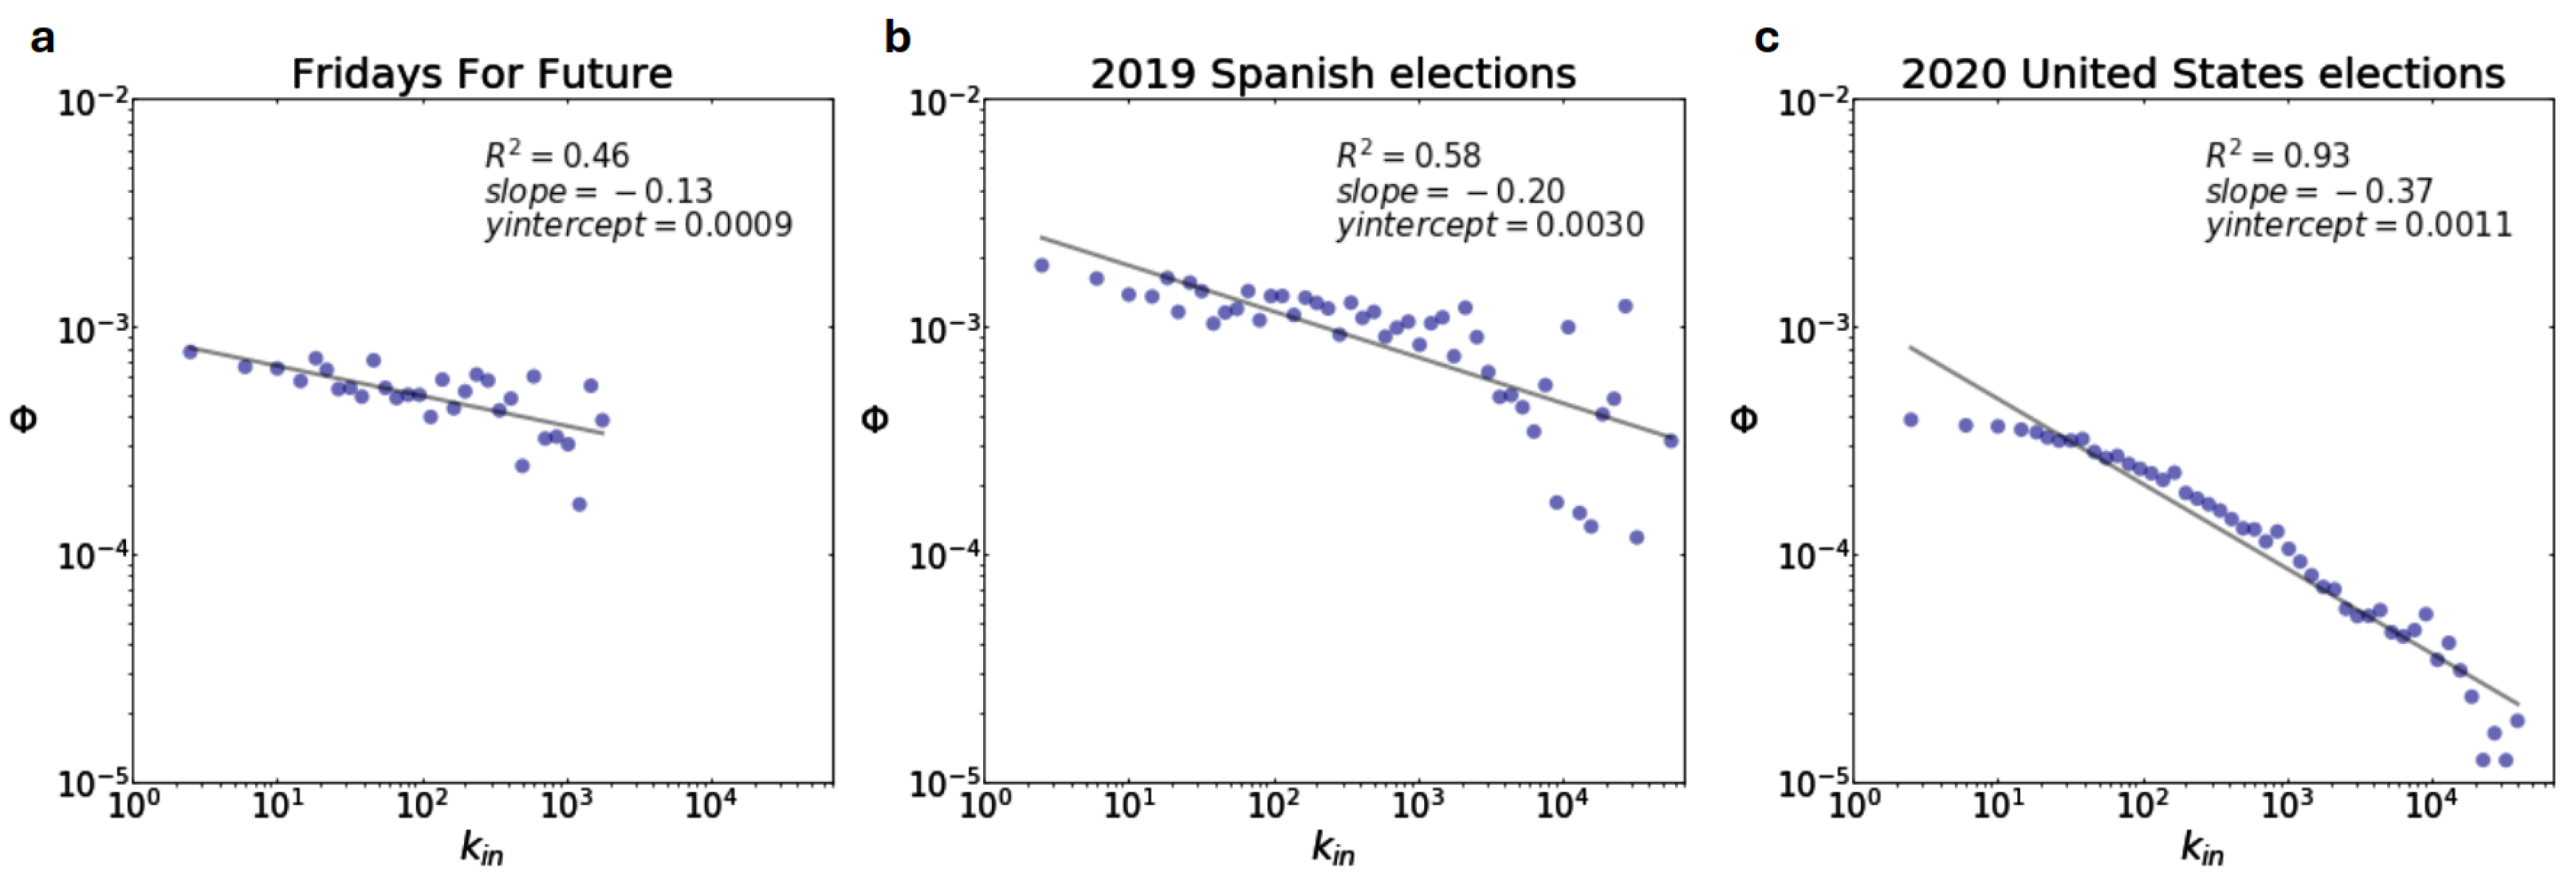
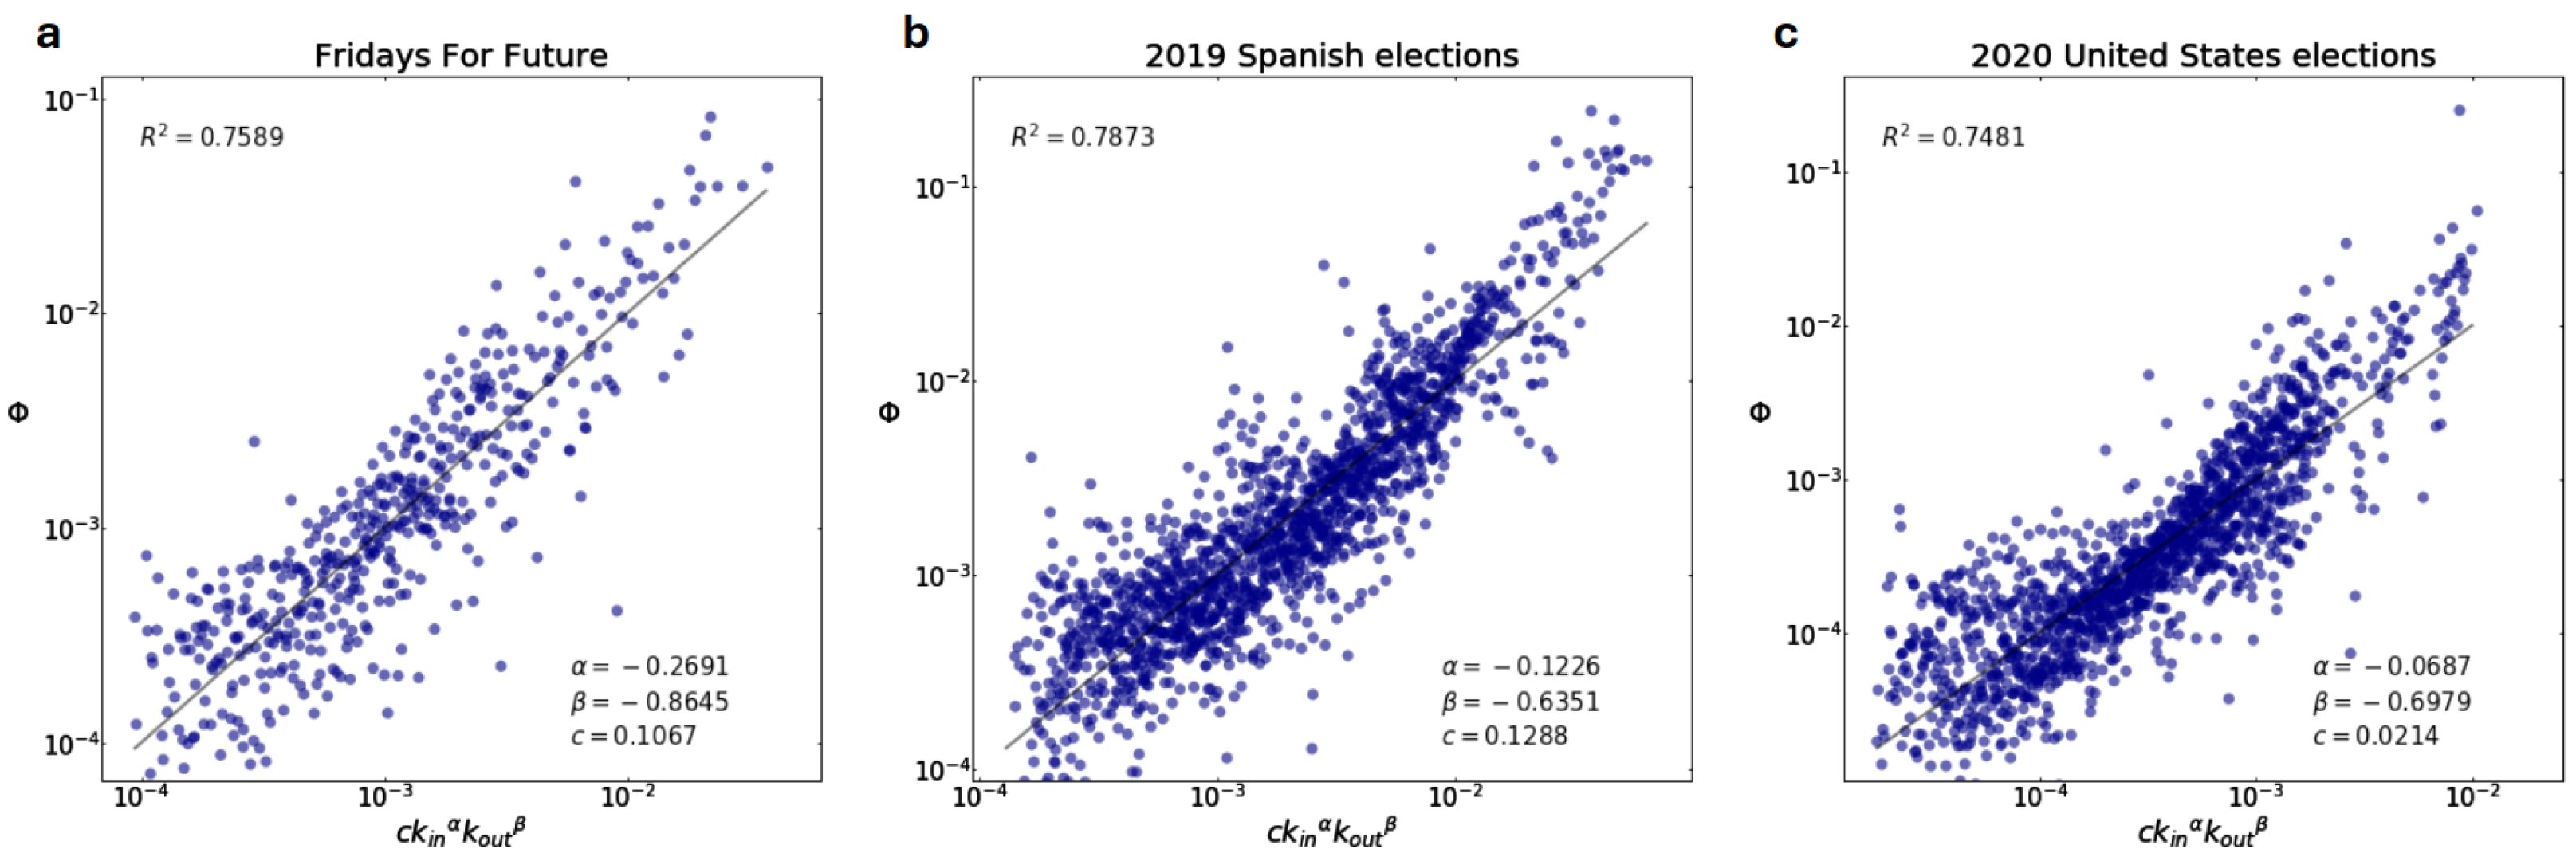
3.1. Diffusion Model
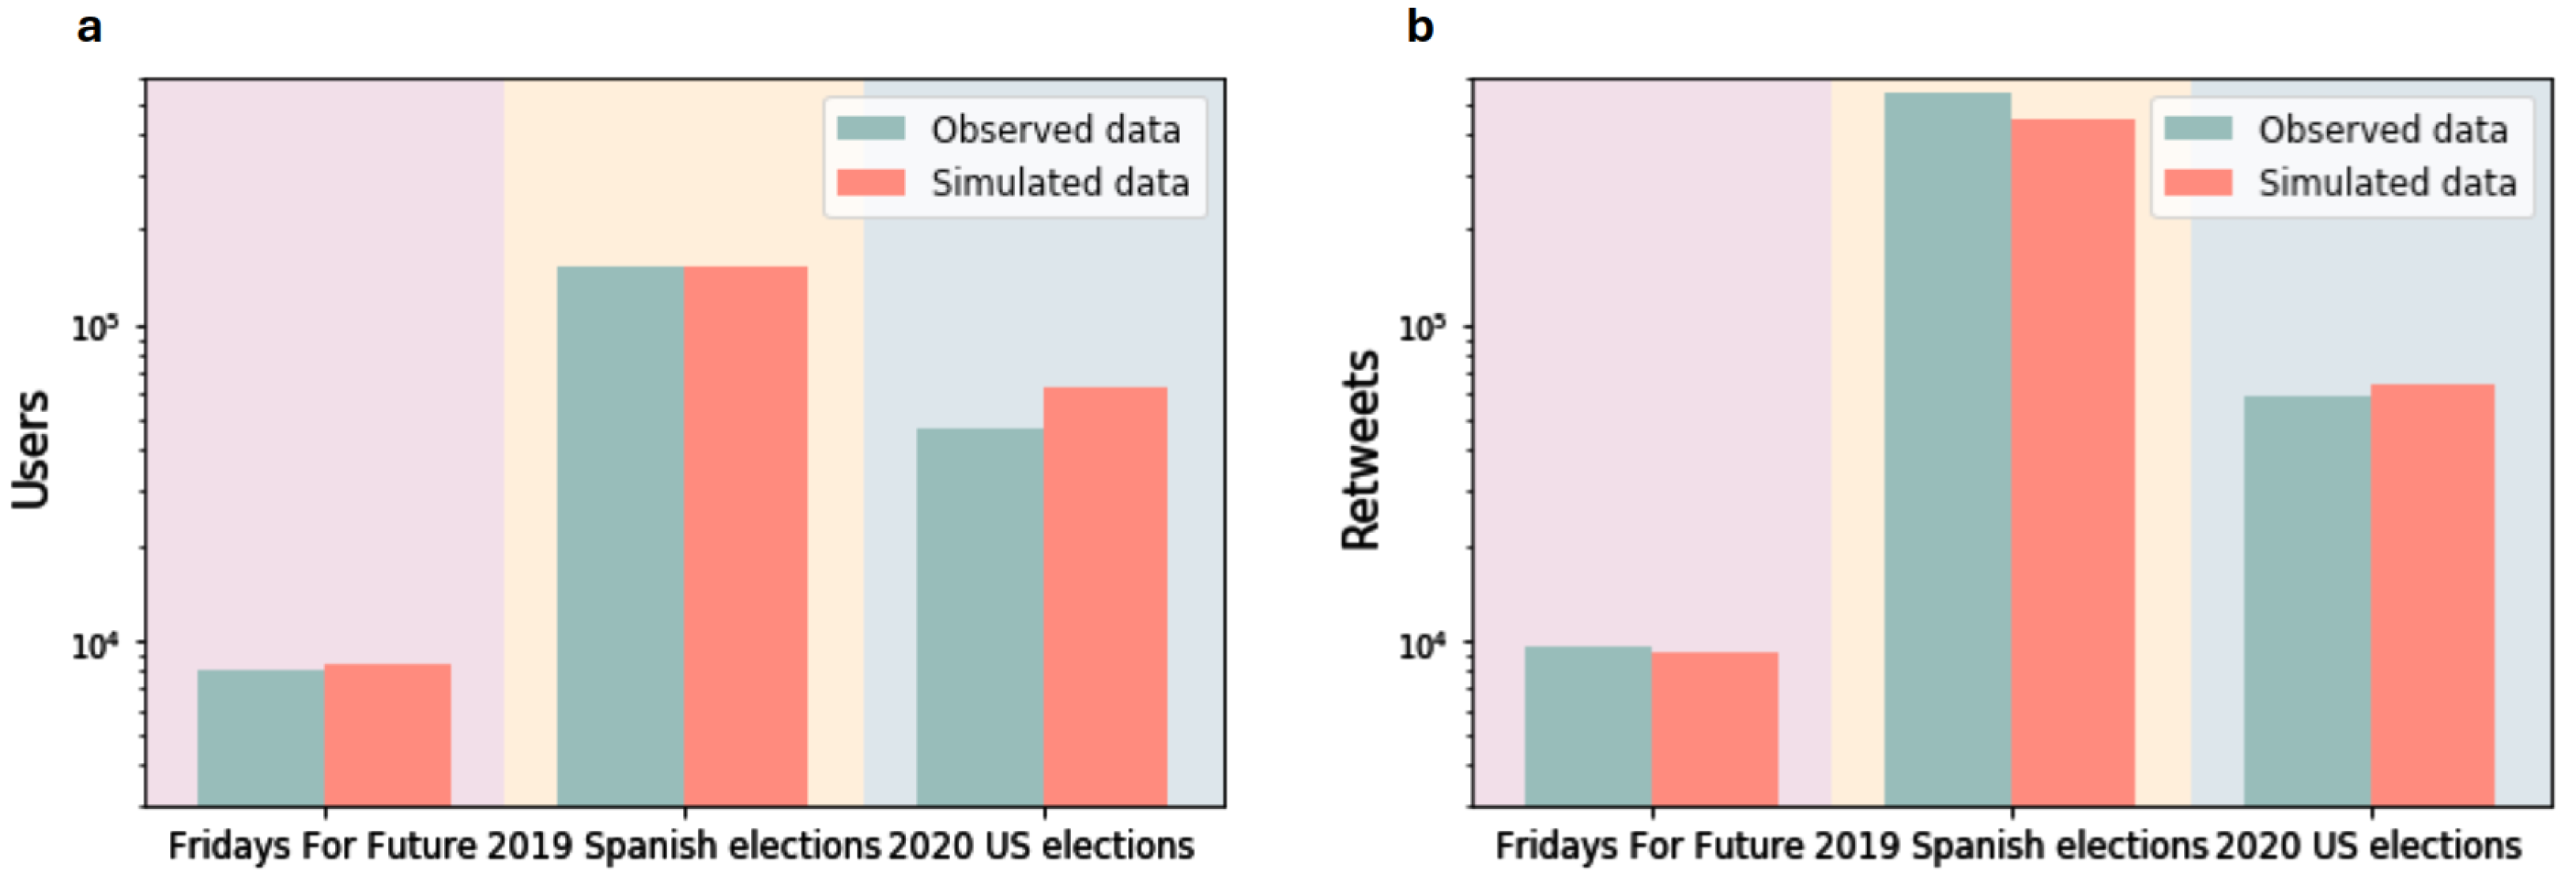
In the context of Twitter’s information diffusion process, it is essential to understand the mechanisms that facilitate content propagation. Users can follow other users in a relationship that does not have to be reciprocal. This mechanism allows a user’s followers to see the tweets posted or reposted by the person they follow on their personal feed. Only the users who see the tweet can decide to retweet it, spreading its content to their followers. In other words, the follower network, a network where users are the nodes and the directed links are these follower connections, forms the foundation through which messages are transmitted [18]. As we have just stated, when a user posts a tweet (we will call those users Creators), it becomes visible to their entire follower base, who then have the option to either share the message or ignore it. We call these potential viewers Observers (O). Those who see the tweet and choose to share it, called Spreaders (S), become amplifiers of the content. The remaining Observers who are not Spreaders may be due to the fact that they may either miss the tweet or opt against engaging with it due to different factors, one of which can be content saturation. In Figure 2, we can see a scheme of the Twitter networks in which we define these three types of users. On the one hand, we have the followers network (bottom, in pink), the underlying net on which the dissemination of information takes place. In it, some users create content, the Creators (users 1, 7, and 11, in purple). Accordingly, all their followers have the potential to see their tweets in their timeline, so all of them will become Observers (users 4, 5, 6, 8, and 9), and we mark them in maroon in the followers network. Some of these Observers will then decide to retweet, becoming part of the retweet network (top, in blue), together with the Creators. Consequently, the followers of all users who have become Spreaders (users 4, 5, 6, and 8, in green) can potentially see the tweet, becoming Observers (as is the case of user 3), and so are tagged in the follower network (as is the case for node 3 in Figure 2). These Observers can then become Spreaders, and this process will continue iteratively until there are no new Spreaders.
We seek to gain insights into the likelihood of information spread and the dynamics of retweet cascades. This prediction will enhance our understanding of how information disseminates through the followers network and the underlying factors influencing content propagation on social media platforms. To address this, our model aims to predict the retweet rate, Φ , a crucial variable that measures the probability that a user who potentially encounters a tweet (an Observer) will decide to retweet it and become a Spreader. To estimate this variable in our Twitter context, we can measure Φ as the proportion of Spreaders to Observers.
Φ = S O
Estimating this variable would enable the simulation of a diffusion process in the followers network. As we have argued in the Introduction, the current information saturation within social networks causes great effects on users’ behavior, affecting both their cognitive capacities and their emotional well-being. This saturation occurs when there is information overload, i.e., when the volume of content an individual receives is so high that they cannot process it efficiently. Saturation will depend mainly on the amount of content that reaches a user, which is determined, to a large extent, by the number of people or accounts that they follows. Thus, the greater the number of accounts followed, the greater the flow of information received, increasing the possibility of overload. In terms of the followers network, this number of connections is known as the user’s out degree. We will call this variable k o u t , and we can also find it represented in Figure 2. For all these reasons, in order to analyze how important the saturation effect is and whether or not it can be a sufficient measure for predicting information dissemination, we decided to experimentally explore the connection between k o u t and the retweet rate Φ .
In order to analyze the relationship between Φ and k o u t , we segment the range of possible k o u t into several intervals on a logarithmic scale. Then, we compute the retweet ratio for each subset of users of those k o u t intervals, Φ k o u t . As we argued above, we can estimate Φ as the proportion of S vs. O, so we can calculate Φ k o u t with the S and O of each k o u t subset (i.e., S k o u t and O k o u t ) as follows:
Φ k o u t = S k o u t O k o u t
Just as previously discussed, Spreaders are users who see a tweet and decide to retweet it. Consequently, the total number of Spreaders is the sum of all retweets made by users with a given k o u t , a metric we derive from both the retweet network and the follower network. The calculation of Observers is less direct. Observers are all users who have the potential to read the tweet, regardless of whether or not they decide to retweet it. This is determined by summing the followers with the given k o u t of users who have posted an original tweet or have retweeted any of those tweets. We also have this information available as it can be calculated based on the network of followers. Once we have the Φ k o u t for every k o u t bin, we represent the relationship between these two variables for the three experimental case scenarios described in the Data section.
The results are shown as blue dots in Figure 3. In this figure, we find that, in all three case studies, we can see a clear power-law dependency between the retweet rate, Φ , and the out-degree in the followers network, k o u t , shown as an approximately straight line when plotting on a logarithmic scale. Therefore, based on these experimental results, we propose a model where the retweet rate follows a power-law of k o u t with the following form:
Φ = c k o u t γ
The proposed model establishes that, in the dissemination process that takes place over the followers’ network, in which some of the followers decide whether or not to share the content of the tweets generated by the users they follow, the probability that these users will retweet depends on the number of people they follows.
The unknown variables c and γ can be obtained from a linear regression to the experimental data. This fit is plotted in Figure 3, along with the observed data it fits, showing a strong correlation that indicates that the data adhere to the behavior specified by function (3). The γ values are the slope of the fitted line, and are all around −0.5. These results suggest that users with higher out-degrees are less inclined to retweet a given message, as indicated by the negative gamma values. In other words, as the number of people a user is following increases, the effectiveness of that user in spreading tweets decreases. These findings imply that, as users are exposed to more information, their likelihood of sharing additional content decreases; they become more selective in becoming Spreaders. This phenomenon could be attributed to a saturation effect, where the abundance of messages overwhelms users, reducing the probability of engaging with any individual tweet. On the other hand, the c constant is the y-intercept values, ranging from 0.0036 to 0.0256. The variation in the constant c across the different case studies indicates differences in baseline retweet rates, likely influenced by the specific nature of the content and the level of user engagement in each network.

Model Verification

Conducting simulations based on the proposed model is essential to verify its predictive capability under real-world conditions. These simulations allow for an evaluation of how the system behaves under different initial conditions and model parameters, providing a deeper understanding of retweet dynamics in complex environments. To achieve this, the key characteristics of real-world diffusion were emulated. For each experimental case, we used its actual followers’ networks, built as explained in the Data section. These networks differ in both size and connectivity. Additionally, the simulations were conducted using the initial conditions from each experimental case, meaning that the diffusion starts with the original, real tweets from their corresponding users. This approach enables a direct and consistent comparison between the simulated results and the experimental data and facilitates the execution of multiple simulations for each case, ensuring that the results are robust and reproducible. A detailed explanation of the simulation algorithm is provided in Appendix A.
In order to evaluate the outcomes, we compare the retweet network produced by the model simulation with the retweet network of the experimental data. As explained in the Data section, the users that appear in the retweet network are those who have made or received a retweet, which means that those users who write a tweet and neither receive a retweet nor make one will not appear in this network. To begin with, two key variables were measured in each scenario: the total number of users involved in the simulated retweet network and the total number of retweets generated. These results, shown in Figure 4, were compared with the corresponding experimental data, allowing for an assessment of the model’s accuracy across different scenarios.
Figure 4 shows that the model fairly accurately replicates the size of retweet networks across all three datasets. Simulated user counts closely match observed values, demonstrating the model’s effectiveness in capturing network scale. In the Fridays for Future case study, 103% of the users of the retweet network (Creators and Spreaders) were predicted (i.e., the percentage of users of the simulated network vs. users of the real network). For the 2019 Spanish elections case study, 100% were predicted, while in the 2020 United States election conversation, 130% were predicted. Additionally, the simulated retweet counts align well with the observed data, confirming the model’s reliability in reflecting retweet dynamics. In the Fridays for Future case study, the model predicted 93% of retweets (the percentage of retweets in the simulated network vs. retweets in the real network). In the 2019 Spanish elections case study, it predicted 82%, while for the 2020 United States election conversation, it predicted 109%. Overall, these results support the model’s robustness in predicting both network size and engagement.
We have found that the proposed model shows the highly significant effect of the number of people a user follows, k o u t , on the retweet rate, Φ . In other words, we are proving that not only is the saturation effect a phenomenon that affects the behavior of users in a social network but also that it can be used as a measure to predict a diffusion process. We could have considered other possible dependencies for the model, such as the perceived relevance of the Creators, which can be estimated as the audience they have. The audience depends on the number of followers they have, that is, their in-degree in the followers’ network, which we will call k i n . To provide reinforcement for our proposed model, we performed the simulation using two alternative models: Φ = c k i n γ and Φ = c k i n α k o u t β (inspired by [33]). The results, which can be found in Appendix B, show that our model provides the best prediction of the experimental results.
In addition to the initial validation based on the size and activity of the retweet network, we added an additional validation focused on the in-degree distribution of the retweet network. This variable measures how many retweets each user receives and is crucial to understanding the structure of the network, as it reflects how influence and reach are distributed within the system. We chose to analyze the in degree because it not only shows how many users participate in the dissemination but also how this participation is distributed. In social networks, this distribution typically follows a “long tail”, where most users receive few retweets and only a few concentrate a large amount [34,35,36,37]. Replicating this pattern in the simulation is essential, as it indicates that the model correctly captures the uneven distribution of attention and influence in the network.
The results are shown in Figure 5, where we can see the comparison of both distributions, corresponding to the real one versus the model’s prediction. As can be seen, both networks present the typical long-tail distribution. It is of interest to note that this property emerges naturally in our model, since the retweet network is constructed entirely in the simulation process and could have any other type of structure. Overall, the good correspondence between the distributions shows that the model not only correctly predicts the global characteristics of the network but also more specific and structural aspects, such as the distribution of influence among users. This reinforces the robustness of the model in simulating information diffusion within social networks.
In summary, our study delves into the dynamics of information diffusion on Twitter, particularly under the influence of content saturation, by showing how the follower network, user engagement, and retweet behaviors contribute to the spread of information. By developing a model that integrates the saturation effect—highlighting how users with a higher volume of incoming information (measured by k o u t ) are less likely to share additional content—we reveal a significant predictive relationship. Our model closely aligns with observed data across multiple case studies, accurately capturing both network scale and engagement patterns. Furthermore, the model reproduces the in-degree distribution typical of real-world networks, demonstrating its robustness in representing the uneven distribution of influence in online spaces. These findings not only provide a deeper understanding of the structural aspects of diffusion in social networks but also highlight how saturation-driven selectivity shapes user interactions.

3.2. Temporal Behavior

In social networks, the volume of information constantly circulating is so large that, if users stop watching for a brief period of time, they are likely to miss a large part of the content and therefore cannot contribute to its dissemination. In other words, saturation also works on a temporal level, as content is generated so frequently that it quickly replaces old content. Our purpose here is to explore this aspect by examining the lifetime of tweets in their temporal diffusion. To unravel this process, we have examined how quickly retweets are emerging. By analyzing the intervals between an original tweet and each of its subsequent retweets, we can gain insights into the underlying mechanisms that drive the dynamic component of content propagation. We define a time interval as the subtraction between the exact time of each retweet and the exact time of the original tweet.
Then, we visualize the distribution of time intervals in blue in Figure 6. By plotting these intervals, we observe a pattern that deviates from the simple power-law decay, often expected in information diffusion models [28,29,30]. Instead, the data reveal a distribution that is better described by a stretched exponential function [38] (shown in red in Figure 6).
To compare how well the two distributions fit the data, we use a measure called the log-likelihood ratio (LLR) [39], which, in this particular case, quantifies how well the stretched exponential distribution fits the experimental data in comparison to the power-law distribution. If the log-likelihood ratio is positive and large, it indicates that the stretched exponential provides a better fit to the data than the power-law. If it is negative, the opposite is true (i.e., the power-law fits better). If it is close to zero, both distributions fit the data equally well.
The log-likelihood ratio results for each case study are as follows: LLR = 103.58 for Fridays For Future, LLR = 691.42 for the 2019 Spanish elections, and LLR = 251.44 for the 2020 US elections. That is, in all cases, we find positive and large values, with an associated p-value of the LLR of p 0.001 , indicating a significantly better fit for the stretched exponential model. This result has been corroborated by the Akaike Information Criterion (AIC) [40] and the Bayesian Information Criterion (BIC) [40].
The stretched exponential model is characterized by a slower decay and a longer tail compared to a standard exponential, suggesting that the likelihood of retweeting decreases more gradually over time. These results are in line with recent studies that emphasize the importance of better capturing the initial diffusion, faster than the decay that follows [22,31,32]. The stretched exponential distribution, also known as the Kohlrausch–Williams–Watts (KWW) function, can be expressed mathematically as:
P ( τ ) = Λ e τ β
where τ represents the time interval between the original tweet and a retweet, β ( 0 < β 1 ) is a parameter that describes the “stretching” of the exponential, and Λ is a normalization constant. This type of distribution is particularly useful in describing processes where the probability of an event (such as a retweet) decreases over time, but at a slower rate than predicted by a simple exponential model.
In analyzing the temporal diffusion patterns across the three case studies, we found that the stretched exponential distribution provided a robust fit for the retweet time intervals in each scenario, as clearly shown in Figure 6. Regarding the parameters of the model, Λ and β , we observed differences that give us hints about the diffusion dynamics. The relatively small values of Λ , corresponding to the range of 0.0043 to 0.0102 in all case studies, indicate that retweeting is not a uniformly intense process but rather one that diminishes gradually, highlighting the extended tail in the distribution. The β parameter, which controls the degree of “stretching” in the distribution, ranged from 0.55 to 0.69 across the three cases. This indicates that, in all three instances, the retweeting behavior exhibited a significant departure from simple exponential decay, with a slower, more prolonged decline in activity. It appears that after 10 3 minutes, i.e., around 16 h from the time the original tweet was posted, there is an inflection change in the curve observed in the three case studies. That is, after 16 h there is a decrease in the rate at which retweets occur, and this model captures this behavior. The observed decline in retweet activity around the 16-hour mark can be explained by a combination of content visibility decay and user behavioral patterns. A key factor is the natural cycle of daily activity: most users are awake for approximately 16 h per day, meaning that a tweet posted at a given time will have passed through an entire cycle of user attention before engagement drops significantly.
This result means that the half-life of tweets is extremely short, not lasting a day in most cases. With a constant influx of new posts, users are exposed to a steady stream of fresh content that competes for attention. In other words, as the Twitter algorithm sorts tweets by novelty, the saturation effect contributes to diminishing tweet life time, with only very few tweets being present on the social network for several days. This dynamic reflects the broader attention economy at play, where social media platforms prioritize novelty and immediacy, leaving limited space for older content to retain visibility. Consequently, only a select few tweets—often those with exceptional relevance or association with high-profile accounts—manage to challenge this trend, continuing to circulate over several days despite the relentless flow of new information.
In conclusion, our analysis underscores the fast-paced and competitive nature of information diffusion on social networks, where the lifespan of content is markedly short. The stretched exponential model we employed offers a more nuanced understanding of how retweets decay over time, revealing a slower, yet still rapid, decline in engagement. This behavior aligns with the saturation of content on these platforms, which limits the lifespan of any given tweet as new information continuously replaces older posts. Such dynamics suggest that, for content to sustain visibility, it must either capture exceptional user interest or benefit from high-profile endorsements. Overall, this study emphasizes the critical influence of both novelty and network dynamics in the transient visibility of content on social media. Understanding these mechanisms offers valuable insights into the patterns of information spread and decay, contributing to a deeper comprehension of content lifespan within highly saturated digital environments.

4. Conclusions

This paper presents a comprehensive insight into the dynamics of information diffusion on Twitter, focusing on the pivotal role of content saturation in influencing user behavior. Our investigation reveals that the amount of information a user receives, estimated by the user’s out-degree ( k o u t ), significantly impacts the likelihood of retweeting content (which we call retweet rate, Φ ). We found an inverse relationship between Φ and k o u t in the form of a power-law with a negative exponent in our three experimental case studies of different Western geopolitical contexts. Thus, we propose a model in the form of Φ = c k o u t γ . This model means that users who follow a large number of accounts are less inclined to engage in retweeting due to the saturation effect—demonstrating that, as exposure to content increases, selectivity also rises [24,41]. After verifying that the inverse proportionality between Φ and k o u t also holds for low k o u t values—where users can be assumed to have an equal likelihood of reading all tweets of their personal page—it is suggested that this effect goes beyond a time constrain. The power-law relationship uncovered between Φ and k o u t validates our hypothesis that higher connectivity contributes to information overload. This finding aligns with cognitive theories of information processing, which suggest that, as individuals encounter more content, their ability to effectively engage with it diminishes [42,43].
Our model’s predictive strength is validated through simulations across three case studies with very different geopolitical backgrounds. This validation demonstrates the model’s applicability in capturing real-world information diffusion. By accurately mirroring the size and structure of retweet networks, the model provides insights into the scalability of information spreading across different scenarios. The close fit of our model to observed data supports its robustness as a predictive tool for gauging engagement within complex network structures, highlighting the intricate balance between information overload and retweet probability. A significant insight from this work is the potential for using saturation metrics as a predictor of content diffusion. Currently, numerous models in information theory generally highlight message content or user influence as the primary drivers of propagation [44,45,46,47]. However, our findings reveal that saturation—a structural factor rather than solely content-based—plays a crucial role in shaping amplification patterns within the network. This perspective aligns with prior research indicating that cognitive overload can lead to selective engagement behaviors [26]. Furthermore, it opens new directions for research on how platforms might account for saturation-induced behavioral shifts, potentially informing the development of tools to balance content flow and alleviate cognitive overload in highly interconnected digital spaces.
Following our study of the impact of online saturation, we explored the temporal aspect of information diffusion, discovering that Twitter’s rapid content turnover shortens tweet lifespans significantly. Through our analysis of retweet time intervals, we observed that the distribution aligns with a stretched exponential model rather than a simple exponential decay, indicating that the probability of retweeting diminishes more gradually than previously modeled [28,29,30]. This extended tail in the temporal distribution highlights how engagement decays but does so at a non-linear rate, suggesting that, even under conditions of saturation, content can retain visibility for limited periods, particularly if it resonates strongly within its initial audience. Notably, after approximately 16 h, the rate of retweeting declines more steeply. This suggests that, after a full wakeful period, users have already been exposed to the content they are most likely to interact with, reducing the probability of further retweets. It also highlights the transient nature of content visibility on Twitter, where only tweets with high relevance or association with influential accounts survive beyond the immediate surge of interest.
The broader implications of our findings suggest that, while Twitter facilitates rapid information dissemination, it also inherently constrains the longevity and reach of content due to the saturation effect. This insight has important implications for how we understand online behavior. As users are exposed to an overwhelming amount of information, they tend to become more discerning. Looking ahead, future research could build on these findings by examining other factors, such as user attention cycles or engagement patterns over different times of day, which could help improve the accuracy of diffusion models even further.
In conclusion, our study highlights the dual role of structural and temporal saturation in shaping how information spreads on Twitter. The findings illustrate that users, despite being closely connected within their follower networks, engage selectively and adapt their content consumption behaviors to manage the overwhelming influx of information. This research offers a nuanced understanding of the interplay between network connectivity, saturation, and content lifespan, contributing valuable insights for future academic investigations into information diffusion and user behavior in social media environments.

Author Contributions

Conceptualization, J.A.-B., J.C.L. and R.M.B.; methodology, J.A.-B.; software, J.A.-B.; validation, J.A.-B.; formal analysis, J.A.-B.; investigation, J.A.-B., J.C.L. and R.M.B.; resources, J.A.-B., J.C.L. and R.M.B.; data curation, J.A.-B.; writing—original draft preparation, J.A.-B.; writing—review and editing, J.A.-B., J.C.L. and R.M.B.; visualization, J.A.-B.; supervision, J.C.L. and R.M.B.; project administration, J.C.L. and R.M.B.; funding acquisition, J.C.L. and R.M.B. All authors have read and agreed to the published version of the manuscript.

Funding

This research was funded by the Spanish Ministry of Science and Innovation (Contract No. PID2021-122711NB-C21).

Data Availability Statement

The raw data and code supporting the conclusions of this article will be made available by the authors on reasonable request.

Acknowledgments

This work was supported by the Spanish Ministry of Science and Innovation (Contract No. PID2021-122711NB-C21). Additionally, we thank Rafael Caballero Roldán for providing the 2020 United States election dataset.

Conflicts of Interest

The authors declare no conflicts of interest.

Appendix A. Simulation Algorithm

The aim is to replicate the information diffusion process from the experimental data using the model detailed in Equation (3) and the parameters obtained in Figure 2. The simulation of tweet diffusion is conducted through a step-by-step process designed to build the final retweet network incrementally. The methodology is outlined as follows:
  • Initialization: Each tweet is simulated individually, starting from the real original tweets author’s. The process involves simulating the diffusion trees of these tweets separately to construct the complete retweet network.
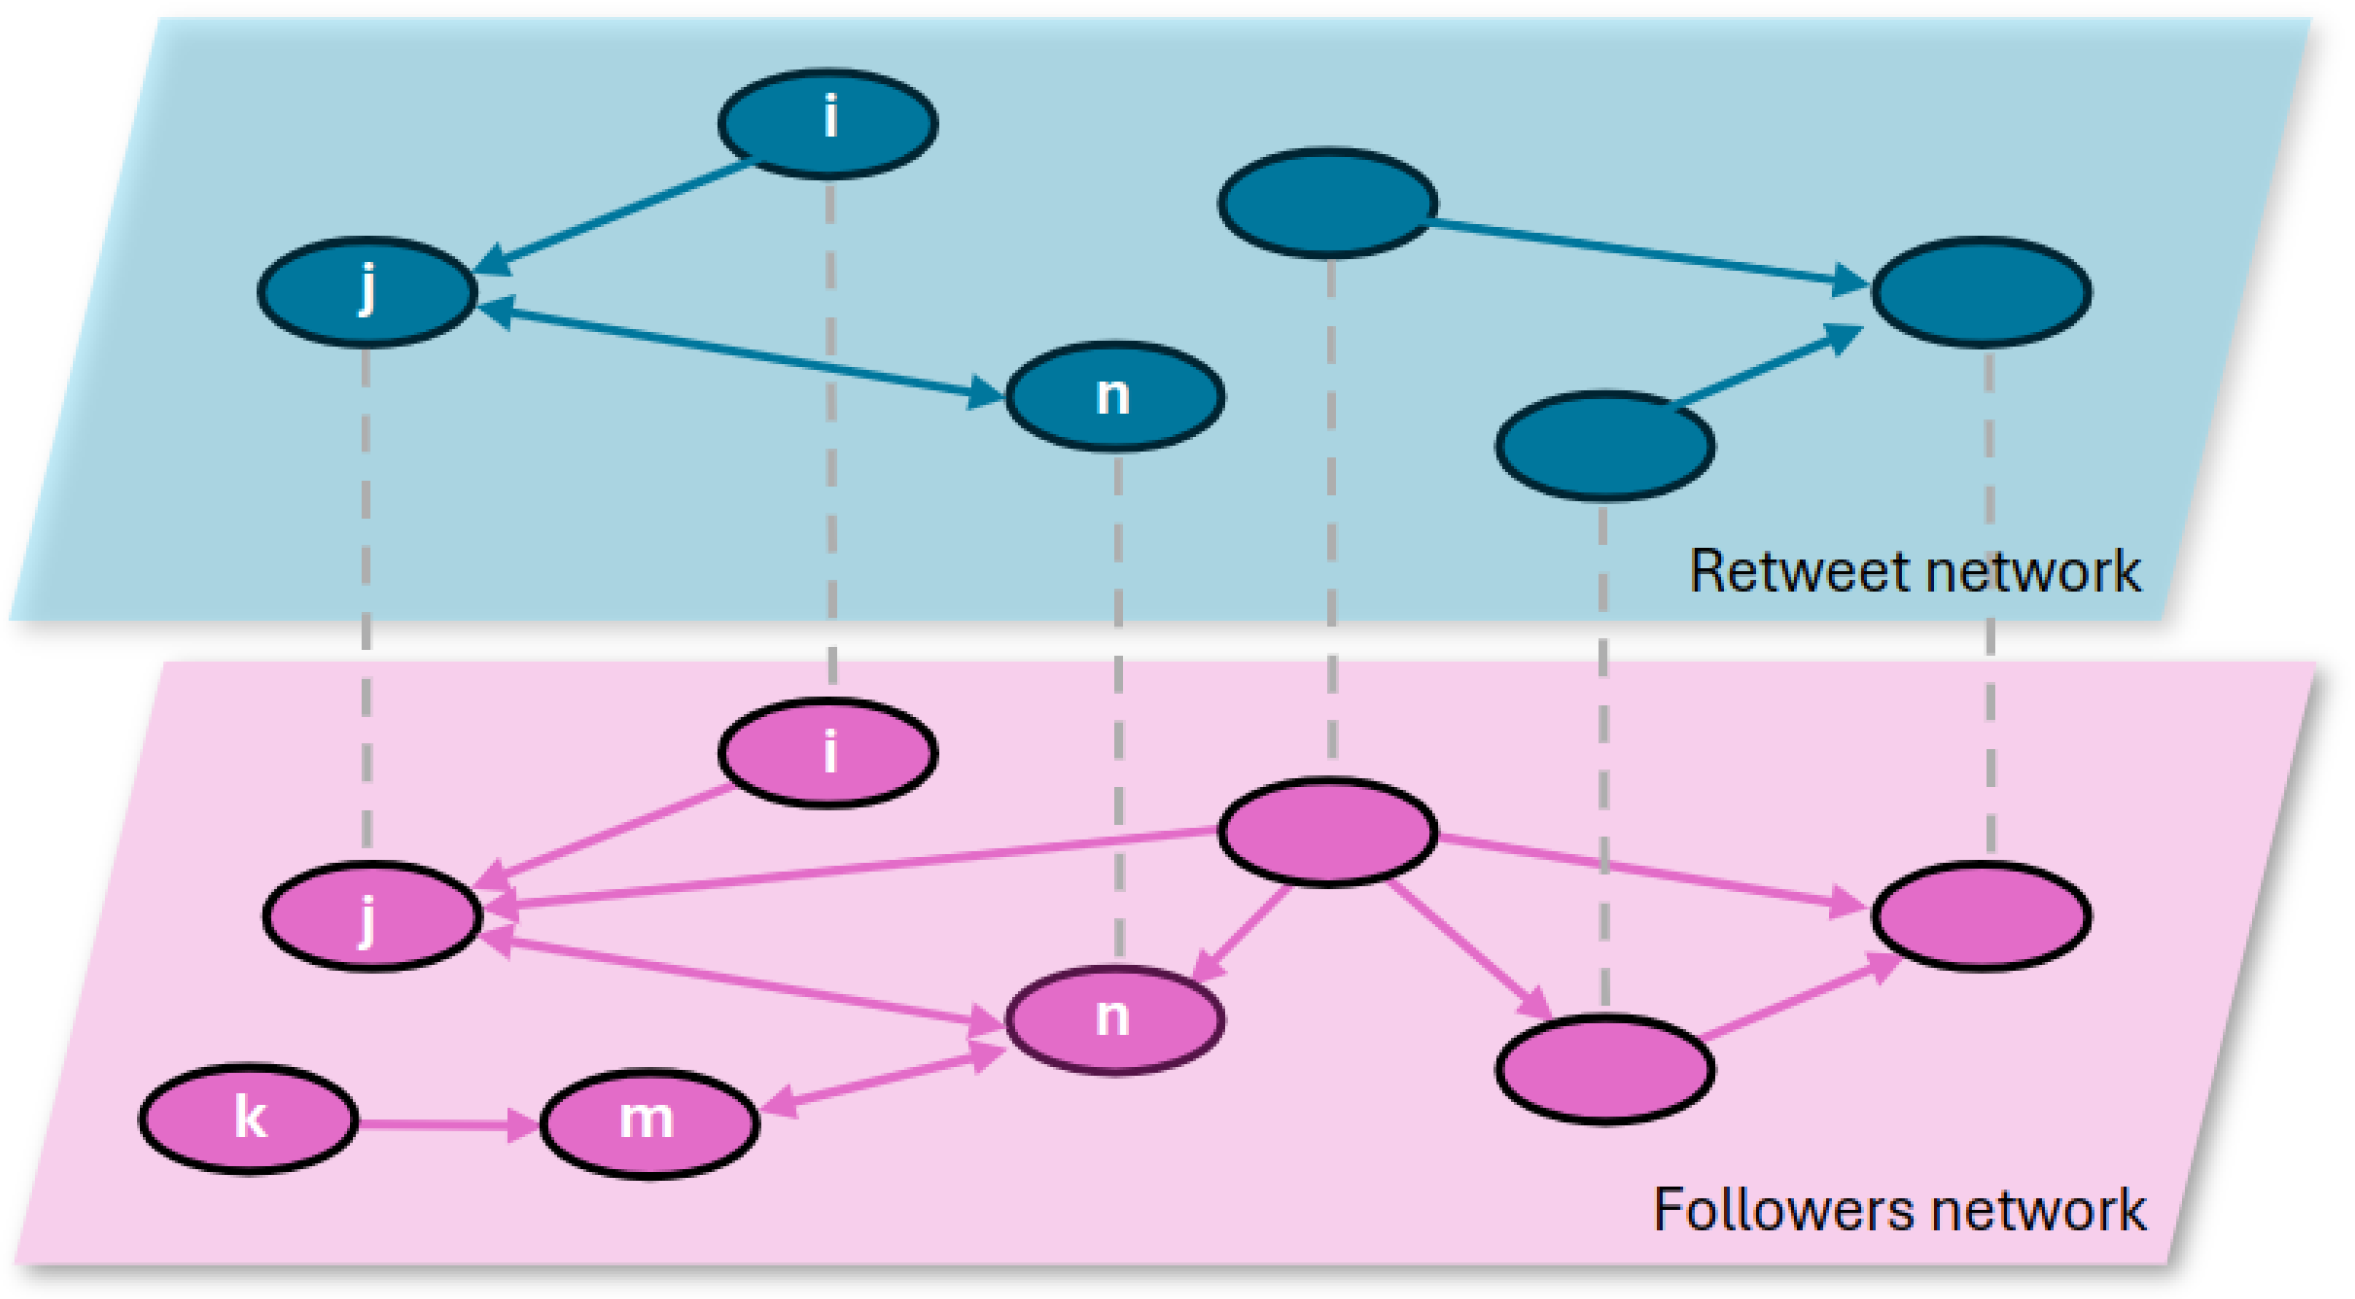
  • Diffusion Process: To simulate the diffusion tree of a tweet, it is necessary to determine its Observers, i.e., those who can potentially see it. To begin with, all followers of the tweet’s author are considered Observers. For each Observer, a random probability value between 0 and 1 is generated. This probability is compared to the retweet ratio defined by the model parameter, which depends on the Observer’s k o u t , as well as on the parameters c and γ for each experimental case. k o u t is the number of users the Observer follows, so we calculate it with their out-degree in the follower network. If the generated random probability is less than the retweet ratio, the Observer retweets the tweet, becoming a Spreader.
  • Iterative Expansion: After going through all the followers of the original author, the diffusion process is extended to the followers of the newly designated Spreaders. This iterative procedure continues, with each new set of Spreaders contributing to the expansion of the retweet network, until no additional Spreaders are identified.
  • Completion: This simulation process is repeated for each original tweet, progressively constructing the entire simulated retweet network. By aggregating the results from all individual tweet simulations, the final network is assembled.

Appendix B. Predictive Ability of Different Diffusion Models

Similarly to the way that we have considered the effect of saturation in the diffusion process studying the relationship between the number of people a user follows and the probability of retweeting, it would also be an option to consider the influence of the perceived relevance of the creator of the tweet. This perceived relevance, estimated as the audience of the users, can be calculated as the number of followers they have. The number of followers of a user is measured as his degree in the followers network, which we will call k i n . It is for this reason that we decided to explore the relationship of Φ with k i n , and we did it considering two possible models.
The first one explores the simple influence of k i n on the retweet rate of the users with that k i n , i.e., Φ = S k i n O k i n . It is important to note that, in this case, k i n is the number of followers of the Creators, so this variable is associated with the users that create the tweets, not the Spreaders or the Observers. The results can be seen in Figure A1. Based on those results, we propose a model in the form of Φ = c k i n γ and then performed the fitting of the data to obtain the constants of that model.
Figure A1. Retweet rate Φ as a function of k i n for the three case studies (panels ac). The horizontal axis represents the in-degree k i n of the users of a retweet network. The vertical axis represents the retweet rate Φ k i n , calculated as a fraction of the Spreaders vs. Observers users for each k i n interval ( S k i n O k i n ). The fitted line corresponds to the fit of the observed data (blue dots).
Mathematics 13 00963 g0a1
The second model explores the possibility that both k i n and k o u t have significant relevance in the retweet rate, Φ , that can be calculated for each pair of users. To explore this possibility, we use a model inspired by [33]: Φ = c k i n α k o u t β , where Φ is calculated for each pair of users with every combination of k i n (of the Creator) and k o u t (of the Observers and Spreaders). However, we implemented important revisions about the treatment of the data, the most important being the use of k i n and k o u t intervals according to their distributions, where most users have a small in or out degree. The results are shown in Figure A2, where we directly represent the function c k i n α k o u t β with the constants obtained when fitting the real data to the function.
Figure A2. Retweet rate Φ as a function of c k i n α k o u t β for the three case studies (panels ac). The horizontal axis represents the values of c k i n α k o u t β of the users of a retweet network, with the constants c, α , and β calculated in the fitted line. The vertical axis represents the retweet rate Φ k i n k o u t , calculated as a fraction of the Spreaders vs. Observers users for each pair of values k i n k o u t of each users ( S k i n k o u t O k i n k o u t ).
Mathematics 13 00963 g0a2
In these two figures, we can see that the model Φ = c k i n γ does not fit the experimental data as well as our proposed model Φ = c k o u t γ . However, a direct comparison of the goodness between the fit of Φ = c k i n α k o u t β and Φ = c k o u t γ is not possible since the model Φ = c k i n α k o u t β has a different number of data points. Accordingly, in order to compare the three models, we use the results of the simulations.
The results of the simulated network size, compared with the results of our proposed model Φ = c k o u t γ , can be seen in Figure A3. In it, we can verify that the exclusive dependence with k i n does not generate good results. In addition, the result of the model Φ = c k i n α k o u t β does not improve the results of our model despite being more complex, and even worsens them in most cases.
Figure A3. Simulated results of the three different models for the three case studies.The two panels presents the number of users (panel a) and retweets (panel b) of four retweet networks: three of them from the simulated diffusion process using three different models and the experimental one.
Mathematics 13 00963 g0a3

References

  1. Castells, M. Networks of Outrage And Hope: Social Movements in the Internet Age; John Wiley & Sons: London, UK, 2015. [Google Scholar]
  2. Shirky, C. Here Comes Everybody: The Power of Organizing Without Organizations; Alien Lane: New York, NY, USA, 2008. [Google Scholar]
  3. Bennett, W.L.; Segerberg, A. The Logic of Connective Action: Digital Media and the Personalization of Contentious Politics. Inf. Commun. Soc. 2012, 15, 739–768. [Google Scholar] [CrossRef]
  4. Meraz, S.; Papacharissi, Z. Networked Gatekeeping and Networked Framing on #Egypt. Int. J. Press. 2013, 18, 138–166. [Google Scholar]
  5. Lupia, A.; Sin, G. Which Public Goods Are Endangered? How Evolving Communication Technologies Affect the Logic of Collective Action. Public Choice 2003, 117, 315–331. [Google Scholar] [CrossRef]
  6. Duguay, S. “He has a way gayer Facebook than I do”: Investigating Sexual Identity Disclosure and Context Collapse on a Social Networking Site. New Media Soc. 2016, 18, 891–907. [Google Scholar] [CrossRef]
  7. Dynel, M. “I has seen image macros!” Advice Animals Memes as Visual-Verbal Jokes. Int. J. Commun. 2016, 10, 29. [Google Scholar]
  8. Eppler, M.J.; Mengis, J. The Concept of Information Overload: A Review of Literature from Organization Science, Accounting, Marketing, MIS, and Related Disciplines. In Kommunikationsmanagement im Wandel: Beiträge aus 10 Jahren Mcminstitute; Springer: Berlin, Germany, 2008; pp. 271–305. [Google Scholar]
  9. Chua, A.Y.K.; Chang, V. Information Overload: How it Affects Social Media Engagement and Well-Being. Comput. Hum. Behav. 2016, 65, 356–363. [Google Scholar]
  10. Dhir, A.; Kaur, P.; Chen, S. Social Media Fatigue and Information Overload: Understanding the Effects on User Behavior and Mental Health. Int. J. Inf. Manag. 2018, 40, 101–110. [Google Scholar]
  11. Arnold, M.; Goldschmitt, M.; Rigotti, T. Dealing with Information Overload: A Comprehensive Review. Front. Psychol. 2023, 14, 1122200. [Google Scholar] [CrossRef]
  12. Alfasi, Y. Attachment Style and Social Media Fatigue: The Role of Usage-Related Stressors, Self-Esteem, and Self-Concept Clarity. Cyberpsychology J. Psychosoc. Res. Cyberspace 2022, 16, 2. [Google Scholar] [CrossRef]
  13. Przybylski, A.K.; Murayama, K.; DeHaan, C.R.; Gladwell, V. Fear of Missing Out: A Cognitive and Emotional Analysis of Social Media Use. Comput. Hum. Behav. 2013, 29, 1841–1848. [Google Scholar] [CrossRef]
  14. Liu, Y.; Zhang, P.; Shi, L.; Gong, J. A Survey of Information Dissemination Model, Datasets, and Insight. Mathematics 2023, 11, 3707. [Google Scholar] [CrossRef]
  15. Zhang, X.; Akhter, S.; Nassani, A.A.; Haffar, M. Impact of News Overload on Social Media News Curation: Mediating Role of News Avoidance. Front. Psychol. 2022, 13, 865246. [Google Scholar] [CrossRef] [PubMed]
  16. Earle, M.; Hodson, G. News Media Impact on Sociopolitical Attitudes. PLoS ONE 2022, 17, e0264031. [Google Scholar] [CrossRef]
  17. Harlow, S.; Brown, D.K.; Salaverría, R.; García-Perdomo, V. Is the Whole World Watching? Building a Typology of Protest Coverage on Social Media from Around the World. Journal. Stud. 2020, 21, 1590–1608. [Google Scholar] [CrossRef]
  18. Borondo, J.; Morales, A.J.; Benito, R.M.; Losada, J.C. Multiple Leaders on a Multilayer Social Media. Chaos Solitons Fractals 2015, 72, 90–98. [Google Scholar] [CrossRef]
  19. Wang, Y.-Q.; Yang, X.-Y.; Han, Y.-L.; Wang, X.-A. Rumor Spreading Model with Trust Mechanism in Complex Social Networks. Commun. Theor. Phys. 2013, 59, 510. [Google Scholar] [CrossRef]
  20. Jin, F.; Dougherty, E.; Saraf, P.; Cao, Y.; Ramakrishnan, N. Epidemiological Modeling of News and Rumors on Twitter. In Proceedings of the 2013 International Conference on Advances in Social Networks Analysis and Mining, Niagara Falls, ON, Canada, 25–28 August 2013; pp. 739–744. [Google Scholar]
  21. Morales, A.J.; Borondo, J.; Losada, J.C.; Benito, R.M. Efficiency of Human Activity on Information Spreading on Twitter. Soc. Netw. 2014, 39, 1–11. [Google Scholar] [CrossRef]
  22. Goel, S.; Anderson, A.; Hofman, J.; Watts, D.J. The Structural Virality of Online Diffusion. Manag. Sci. 2016, 62, 180–196. [Google Scholar] [CrossRef]
  23. Weng, L.; Menczer, F.; Ahn, Y.-Y. Virality Prediction and Community Structure in Social Networks. Sci. Rep. 2013, 3, 1–6. [Google Scholar] [CrossRef]
  24. Bakshy, E.; Hofman, J.M.; Mason, W.A.; Watts, D.J. Everyone’s an Influencer: Quantifying Influence on Twitter. In Proceedings of the Fourth ACM International Conference on Web Search and Data Mining, Hong Kong, China, 9–12 February 2011; pp. 65–74. [Google Scholar]
  25. Centola, D. The Spread of Behavior in an Online Social Network Experiment. Science 2010, 329, 1194–1197. [Google Scholar] [CrossRef]
  26. Bawden, D.; Robinson, L. The Dark Side of Information: Overload, Anxiety and Other Paradoxes and Pathologies. J. Inf. Sci. 2009, 35, 180–191. [Google Scholar] [CrossRef]
  27. Roetzel, P.G. Information Overload in the Information Age: A Review of the Literature from Business Administration, Business Psychology, and Related Disciplines with a Bibliometric Approach and Framework Development. Bus. Res. 2019, 12, 479–522. [Google Scholar] [CrossRef]
  28. Barabási, A.-L. The Origin of Bursts and Heavy Tails in Human Dynamics. Nature 2005, 435, 207–211. [Google Scholar] [CrossRef]
  29. Iribarren, J.L.; Moro, E. Impact of Human Activity Patterns on the Dynamics of Information Diffusion. Phys. Rev. Lett. 2009, 103, 038702. [Google Scholar] [CrossRef]
  30. Akbarpour, M.; Jackson, M.O. Diffusion in Networks and the Virtue of Burstiness. Proc. Natl. Acad. Sci. USA 2018, 115, E6996–E7004. [Google Scholar] [CrossRef]
  31. Karsai, M.; Kivelä, M.; Pan, R.K.; Kaski, K.; Kertész, J.; Barabási, A.L.; Saramäki, J. Small but Slow World: How Network Topology and Burstiness Slow Down Spreading. Phys. Rev. E 2011, 83, 025102. [Google Scholar] [CrossRef]
  32. Pei, S.; Muchnik, L.; Tang, S.; Zheng, Z.; Makse, H.A. Exploring the Complex Pattern of Information Spreading in Online Blog Communities. PLoS ONE 2015, 10, e0126894. [Google Scholar] [CrossRef]
  33. Zhou, B.; Pei, S.; Muchnik, L.; Meng, X.; Xu, X.; Sela, A.; Havlin, S.; Stanley, H.E. Realistic Modelling of Information Spread Using Peer-to-Peer Diffusion Patterns. Nat. Hum. Behav. 2020, 4, 1198–1207. [Google Scholar]
  34. Barabási, A.-L.; Albert, R. Emergence of Scaling in Random Networks. Science 1999, 286, 509–512. [Google Scholar]
  35. Newman, M.E.J. Power Laws, Pareto Distributions and Zipf’s Law. Contemp. Phys. 2005, 46, 323–351. [Google Scholar]
  36. Cha, M.; Haddadi, H.; Benevenuto, F.; Gummadi, K. Measuring User Influence in Twitter: The Million Follower Fallacy. In Proceedings of the International AAAI Conference on Web and Social Media, Washington, DC, USA, 23–26 May 2010; Volume 4, pp. 10–17. [Google Scholar]
  37. Kwak, H.; Lee, C.; Park, H.; Moon, S. What Is Twitter, a Social Network or a News Media? In Proceedings of the 19th International Conference on World Wide Web, Raleigh, NC, USA, 26–30 April 2010; pp. 591–600. [Google Scholar]
  38. Alstott, J.; Bullmore, E.; Plenz, D. Powerlaw: A Python Package for Analysis of Heavy-Tailed Distributions. PLoS ONE 2014, 9, e85777. [Google Scholar] [CrossRef] [PubMed]
  39. Vuong, Q.H. Likelihood Ratio Tests for Model Selection and Non-Nested Hypotheses. Econom. J. Econom. Soc. 1989, 57, 307–333. [Google Scholar] [CrossRef]
  40. Anderson, D.; Burnham, K. Model Selection and Multi-Model Inference, 2nd ed.; Springer: New York, NY, USA, 2004; Volume 63, p. 10. [Google Scholar]
  41. Bollen, J.; Gonçalves, B.; Ruan, G.; Mao, H. Happiness Is Assortative in Online Social Networks. Artif. Life 2011, 17, 237–251. [Google Scholar] [CrossRef] [PubMed]
  42. Sweller, J. Cognitive Load During Problem Solving: Effects on Learning. Cogn. Sci. 1988, 12, 257–285. [Google Scholar] [CrossRef]
  43. Hargittai, E.; Hsieh, Y.P. Succinct Survey Measures of Web-Use Skills. Soc. Sci. Comput. Rev. 2012, 30, 95–107. [Google Scholar] [CrossRef]
  44. Vosoughi, S.; Roy, D.; Aral, S. The Spread of True and False News Online. Science 2018, 359, 1146–1151. [Google Scholar] [CrossRef]
  45. Colleoni, E.; Rozza, A.; Arvidsson, A. Echo Chamber or Public Sphere? Predicting Political Orientation and Measuring Political Homophily in Twitter Using Big Data. J. Commun. 2014, 64, 317–332. [Google Scholar] [CrossRef]
  46. Friggeri, A.; Adamic, L.; Eckles, D.; Cheng, J. Rumor Cascades. In Proceedings of the International AAAI Conference on Web and Social Media, Ann Arbor, MI, USA, 1–4 June 2014; Volume 8, pp. 101–110. [Google Scholar]
  47. Cinelli, M.; Quattrociocchi, W.; Galeazzi, A.; Valensise, C.M.; Brugnoli, E.; Schmidt, A.L.; Zola, P.; Zollo, F.; Scala, A. The COVID-19 Social Media Infodemic. Sci. Rep. 2020, 10, 16598. [Google Scholar] [CrossRef]
Figure 1. Scheme of the retweet network (top, in blue) and the follower network (bottom, in pink). Both networks share the same users, but the links differ. In the retweet network, the link (i, j) indicates that user i has retweeted user j, whereas in the follower network, the link (i, j) means that user i follows user j. The head of the arrow shows the direction of the link. Furthermore, if the connections are reciprocal, the link has two arrows. That happens when both users retweeted each other, as in the case of j and n, or if they follow each other, as in the case of j and n or m and n. Note that some users (k and m) may appear in the followers network because they wrote a tweet but they do not appear in the retweet network because they did not received or did any retweet.
Mathematics 13 00963 g001
Figure 2. Explanatory scheme of the Creators, Observers, and Spreaders. In the followers network (bottom, in pink), we can see the follower relationships of the users, where their out degree, k o u t , is the number of people they follow. In this scheme, we have three users who create an original tweet (Creators). The Spreaders will be the users who retweet those tweets, shown in the retweet network (top, in blue). The Observers, shown in the followers network (bottom) are those users who can potentially see the tweet, i.e., not only the followers of the users of the original tweet but also the followers of the Spreaders.
Mathematics 13 00963 g002
Figure 3. Results of the retweet rate, Φ , as a function of the number of people a user follows, k o u t , for the experimental retweet network (blue dots) and the simulated retweet network (red x’s). Then, the straight line corresponds to the fit of the observed blue dots. Each panel (a,b, or c) presents the results of a case study. The horizontal axis represents the out-degree, k o u t , of the users in the follower’s network. The vertical axis represents the retweet rate, Φ k o u t , calculated as a fraction of the Spreaders vs. Observers users for each k o u t interval, ( S k o u t O k o u t ).
Mathematics 13 00963 g003
Figure 4. Comparison of simulated and observed users and retweet counts for three case studies. The two panels presents the number of users (panel a) and retweets (panel b) of two retweet networks: the one from the simulated diffusion process (in orange) and the experimental one (in green).
Mathematics 13 00963 g004
Figure 5. Results of the simulated and observed retweet network in-degree distribution for the three experimental case studies, corresponding to panel (a,b, or c). The y-axis shows the normalized frequency of every in-degree value (x-axis) in the retweet network. Both the simulated results (red x’s) and experimental data (blue dots) show a power-law with a long-tail distribution. The straight lines show the fitted functions of the data, with their values and error (residuals) in the legend.
Mathematics 13 00963 g005
Figure 6. Distribution of time intervals in minutes between original tweets and their retweets across three case studies. Each panel (a,b, or c) displays the empirical data (blue) of the experimental case study, fitted with a stretched exponential distribution model (red) that is characterized by the parameters Λ and β (see Equation (4)).
Mathematics 13 00963 g006
Table 1. Description of the follower and retweet networks corresponding to the three experimental datasets used in the diffusion model analysis. This table shows the size of the retweet and followers networks. Additionally, it provides the time intervals of the data downloads for each case study, which, in the two election cases, correspond to two days before the election day.
Case Study# Links in the
Followers Network
# Users in the
Followers Network
# Weighted Links in
the Retweet Network
# Users in the
Retweet Network
Time
Interval
Fridays for future2,041,08344,5419580795824/09/20 09:00–
28/09/20 09:00
2019 Spanish elections48,928,270233,503537,715152,17008/11/19 00:00–
08/11/19 23:59
2020 United States elections93,892,405358,00159,10146,83801/11/20 00:00–
01/11/20 23:59
Table 2. Description of the three experimental datasets used in the temporal behavior analysis. The table shows the number of original tweets, the number of their corresponding retweets, and the time window of the retweets considered. Note that this time window refers to the timestamp of the retweets, but their original tweets could happened before that time.
Case Study# Original Tweets# RetweetsTime Interval of the Retweets Considered
Fridays for future3071958024/09/20 09:00–28/09/20 09:00
2019 Spanish elections46,625537,71508/11/19 00:00–08/11/19 23:59
2020 United States elections10,97459,10101/11/20 00:00–01/11/20 23:59
Disclaimer/Publisher’s Note: The statements, opinions and data contained in all publications are solely those of the individual author(s) and contributor(s) and not of MDPI and/or the editor(s). MDPI and/or the editor(s) disclaim responsibility for any injury to people or property resulting from any ideas, methods, instructions or products referred to in the content.

