Abstract
Despite the growing popularity of organic foods, research on their effects on human health, particularly regarding cancer and diabetes, remains limited. While some studies suggest potential health benefits, others yield conflicting results or lack sufficient evidence to draw conclusions. Understanding the causal relationship between organic food consumption and health outcomes is challenging, especially with limited datasets. Our study examines the correlation between organic food consumption and the prevalence of cancer and diabetes in European nations over time. We compared these findings with data from 100 Italian citizens regarding their perceptions of organic food’s health benefits collected through a novel questionnaire. To identify patterns, we applied Affinity Propagation clustering to group countries based on organic food consumption and disease prevalence. We also created an animated map to visualize cluster progression over time and used the Global Multiplexity Index to evaluate consistency. Our analysis revealed two subgroups of European countries exhibiting significant similarities in organic food consumption and health outcomes. The clustering analysis performed year-by-year on three variables across European nations using the Affinity Propagation algorithm revealed that two clusters consistently maximized the Global Multiplexity Index over time. The first cluster included Belgium, Finland, Ireland, Italy, and Spain, while the second comprised Bulgaria, Turkey, Romania, Ukraine, Czech Republic, Hungary, Poland, Greece, and Russia. These clusters displayed distinct trends concerning sustainable development goals (SDGs) related to organic farming and non-communicable diseases. Additionally, mapping SDG indicators along with geographic and socio-economic factors supported our findings. Moreover, we introduced a novel dataset and offered insights into both the European context and the Italian scenario, contributing to further research on organic food’s impact on public health.
MSC:
62R07
1. Introduction
Organic farming represents an alternative approach to conventional agriculture, emphasizing both farm management and production methods. Known as “bio” in Italy, organic agriculture prioritizes maintaining and enhancing soil organic matter levels, thus reducing or eliminating the use of synthetic fertilizers, herbicides for weed control, and pesticides for pest and pathogen management. Instead, manual, mechanical, and thermal techniques are employed for weed control, while biotechnological measures and natural insecticides are utilized to manage pest species. This method has a dual purpose, meeting consumer demand for healthy, safe food and fibers while also providing public benefits such as environmental protection, animal welfare, and rural development [1].
In Europe, organic production is regulated by EC Regulation No. 834/2007 and its subsequent Implementing Regulation No. 889/2008. These regulations outline common provisions regarding production methods, labeling, control systems, financial support for organic and integrated farming, and measures for environmental protection and biodiversity conservation. Regulation No. 834/2007 mandates the use of the organic label, which includes a numeric code indicating the country, production method type, and control body. The organic logo, called ‘Euroleaf’, may be used on a voluntary basis in the case of un-packaged organic products or other organic products imported from third countries. For processed products, at least 95% of the ingredients must be organic.
In Italy, it is possible to refer to the Biological Information System (SIB), which is a system used for the notification of activities with organic methods and to manage the new categories of operators introduced by the legislation on organic products. An overview of the biological situation at both the international and European level will be presented in the following paragraphs. The data used were extracted from the latest publication of BioReport [2], annual publications carried out under the National Rural Network Program.
1.1. Countries and Organic Consumptions
The expansion of organic farming on a global scale continues, although it is still limited in terms of the extent of cultivated areas. According to the FiBL (Source: https://statistics.fibl.org/world.html (accessed on 1 October 2023) data for 2021, both the area dedicated to organic farming and the market itself are recording increases compared to the previous year in several countries. This increase translates to an overall growth of 1.7% for the area (equivalent to an increase of 1.3 million hectares), while the market shows a more consistent growth, with an increase of 5%. However, situations vary considerably geographically, as we can see from Figure 1. In particular, regions such as Africa and Asia, while starting from low levels of organic farming land, are recording significant increases, with increases of 7.3% and 5.8%, respectively, only during 2021. On the contrary, regions such as Oceania and Europe are experiencing a stabilization or even a reduction of the biological surface, despite the fact that, traditionally, Oceania has represented a significant part of the agricultural area dedicated to organic farming (9.7%).
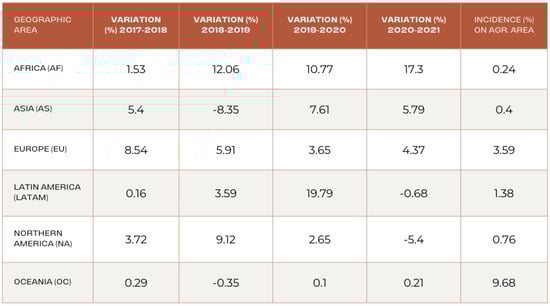
Figure 1.
Organic farming in the world, 2021. Data elaboration from FiBL Statistics.
The growth of organic farming is supported by a series of initiatives undertaken in the context of extensive sustainable development programs, which have regained momentum in the post-pandemic period. In Africa, the initiative for ecological and organic farming involves more and more small farmers across the continent. In Asia, both China and Japan are implementing specific programs to promote organic and high-quality farming. For example, Japan has a target to increase its share of the biological surface to 25% by 2035. Moreover, in several Asian countries, including India, there is growing recognition of participatory guarantee schemes, which facilitate many producers. In contrast, there was a significant reduction in the area devoted to organic farming in 2021 in North America (−1.8%), mainly in Canada, where the adverse climatic conditions, the decertification, and the problems linked to the pandemic have led to the abandonment of the sector by many producers. However, a considerable number of companies are in the pre-registration phase, suggesting a possible recovery in the coming years. In North America, initiatives have been launched to support organic farming, with the United States announcing a major investment aimed at providing technical assistance, financial support, and market development. Most of the 76 million hectares of land dedicated to organic farming in 2021 is located in Oceania, mainly concentrated in Australia. Followed by Europe, which holds 23.4% of the total biological area, and Latin America, with 13%, where Argentina represents almost half of the South American land dedicated to organic farming, with over 4 million hectares.
As stated in the beginning, the consumption of organic foods has received increasing interest in recent years, paralleling a growing awareness of human health and well-being. Following the most acute phase of the pandemic, the global market for organic products and beverages experienced a significant slowdown in growth in 2021. Unlike the substantial rise of 13.4% observed in 2020, the increase in revenue was merely 3.5% compared to the previous year. This brought the market value from EUR 120.6 billion in 2020 to EUR 124.8 billion in 2021. In 2020, factors such as health concerns and consumer well-being, together with savings generated during lockdown periods, drove purchases of organic products.
However, in 2021, as the spread of the pandemic decreased significantly, together with rising food prices and a general economic slowdown, the growth in organic consumption decelerated. This resulted in an annual growth rate lower than the pre-pandemic period. Specifically, the North American market saw a minimal 0.3% growth, driven by consumption declines in the United States (−1.7%). Europe, on the other hand, surpassed North America as the leading consumer bloc for organic products, representing 43.7% of the global market. The rest of the world also exhibited a trend of slowed sales growth, transitioning from a 12.9% increase in 2020 to 10.1% in 2021, compared to nearly 17% in 2019.
1.2. The European Situation
The European organic agriculture sector continued its growth trend in 2021, as indicated by various metrics, despite a slowdown in market growth compared to previous years. The increase in organic agricultural land was consistent with previous values, reaching nearly 18 million hectares, approximately 3.6% of the total agricultural land. France, Spain, Italy, and Germany hosted the largest shares of organic land. However, while organic farming is expanding, it remains below the 25% target set by European strategies for 2030. The European Union (EU) saw notable growth in both the number of organic farms and processors in 2021, particularly in member states. Italy, France, and Spain housed the majority of organic producers and processors. Policies like the new EU framework regulation Regulation (EU) 2018/848 of the European Parliament and of the Council of 30 May 2018 on organic production and the labeling of organic products, repealing Council Regulation (EC) No. 834/2007.) aim to support the organic sector, aligning with the European Green Deal’s goal of allocating 25% of agricultural land to organic farming by 2030.
The European organic market experienced slight growth in 2021, with the European Union (EU) representing the majority of consumption at 85.6%.
Despite this, the growth rate was lower compared to 2020, when consumption increased by over 15%. France experienced a levelling off of consumption growth due to inflation, particularly affecting retail channels like supermarkets and specialized stores. However, collective distribution saw a 30% increase due to governmental mandates promoting sustainability in public catering.
Italy, on the other hand, focuses its efforts on organic products in school canteens, with a yearly fund of EUR 5 million. In Sweden, similar efforts in public catering resulted in a 26% growth in organic consumption. The United Kingdom also saw significant growth, particularly in online sales and home deliveries, attributed to pandemic-induced consumer habits. Germany remains a major consumer of organic products, with a market value of nearly EUR 16 billion, accounting for 29% of the European organic market. However, consumption growth slowed to 5.9% in 2021 compared to 25.2% in the previous year, influenced by pandemic-related factors. Despite this, supermarkets and other retail outlets saw an increase in organic sales.
Overall, organic consumption is widespread across Europe, with some countries like Denmark, Austria, and Switzerland exceeding 10% of total food sales. Therefore, efforts are needed to achieve the EU’s goal of 25% organic agricultural land by enhancing support for public catering and promoting organic products. Organic farming prioritizes ecological balance, biodiversity conservation, and the reduction of synthetic inputs such as pesticides and fertilizers [3]. Despite its benefits, organic agriculture faces challenges such as lower yields, susceptibility to pests, and soil nutrient management [4]. To address these issues, machine learning (ML) has emerged as a promising solution, enabling data-driven decision-making in several fields [5,6,7]. To further enhance the robustness of these statistical results, we also computed the Spearman rank correlation test and obtained a rank–Spearman correlation between organic and prevalence of cancer of −1.398 with a significant p-value of 0.032 and a Spearman rank correlation coefficient of −1.394 with a significant of p-value of 0.034 for the case of the correlation computed between diabetes and the consumption of organic food. Recent advancements in ML, particularly deep learning and ensemble methods, have been employed in precision agriculture to analyze soil quality, predict crop yields, and optimize irrigation schedules [8]. By leveraging large datasets, including satellite imagery, sensor data, and climatic variables, ML models can provide real-time insights and recommendations, thereby improving organic farming sustainability and productivity. This paper explores the intersection of organic farming and ML, highlighting key applications, challenges, and future directions.
1.3. Background and Study Motivation
It is reasonable to think that this increase in the consumption of organic products might be due to a growing awareness of its health effects and concerns about conventional farming practices. Often, organic foods are labelled as healthier alternatives, free of synthetic pesticides, hormones, and genetic modifications. However this is not entirely a true vision of such products. Organic products are, in fact, generally not completely pesticide-free, but several studies agree that they contain a much lower amount of such compounds. According to an extensive meta-analysis published in 2014 by the British Journal Of Nutrition [9], organic products contain, on average, 75% fewer pesticides than conventional agricultural foods. Pesticides are considered to be responsible for many diseases. For instance many scientific studies show an increased risk of cancer in those most exposed to pesticides [10,11]. On the basis of these assumptions, we would, therefore, expect an inverse correlation between cancer and organic consumption: some studies suggest a significant reduction in health risks among consumers of organic products. However, the literature is full of inconsistencies and conflicting findings in this sense: many other studies, in fact, establish no association between these factors [12]. However, it is important to highlight that research on the health effects of organic food is limited, primarily due to the lack of long-term studies, which are costly. While some clinical studies suggest no significant differences in health biomarkers between organic and conventional food consumers, these studies are often small-scale and short-term, limiting their ability to detect long-term effects. Thus, the quest to draw definitive conclusions regarding the causal relationship between organic food consumption and human health outcomes remains a big challenge.
This is the reason why—focusing primarily on European nations—our study aims to examine the evolving patterns of organic food consumption and its implications for public health. Since we had to make a choice on the number of diseases we wanted to analyze, we decided to focus on cancer and diabetes. The role of food quality in these two diseases is most frequently highlighted and analyzed in the literature, and this is the motivation for the choice. Our research employs both quantitative and qualitative analysis to uncover the complexities of this relationship and identify the factors that determine similarities and differences across different countries. We analyze how the consumption of organic foods relates to cancer and diabetes rates in different European countries and how this connection changes over time. Additionally, we explore individual views on the health benefits of organic foods through a detailed survey of two hundred Italian citizens. This additional part of the analysis will provide deeper insights into people’s perspectives and attitudes towards organic food consumption. We further applied an unsupervised machine learning approach to the European nations over time, aiming to answer the following research questions: Why do nations regroup in a certain way? Do clusters remain more or less constant over time or do they differ?
By understanding such relationships between organic food consumption and health, our findings could inform public health policies, agricultural practices, and consumer behavior. In our work, we made use of an unsupervised clustering approach, not knowing the initial number of clusters we could find. In this way, and performing an unsupervised analysis, we could, therefore, analyze the presence of countries clusters to be considered and to be used in the final analysis. The novelty of our work is manifold. In a first instance, to the best of our knowledge, no previous studies on the field are present in the literature. Furthermore, we designed a novel survey and collected a completely new dataset, in which the assessment of a sample of the Italian population’s knowledge on organic food is analyzed. In this context, the application of unsupervised machine learning techniques allowed us to further highlight the position of Italy and the presence of a trend characterizing different European countries. The paper is organized as follows: in Section 2, we describe the dataset collected and its structure. In Section 4, we describe the methodologies proposed. In Section 6 and Section 8, discussions and conclusions are drawn and described.
2. Materials
We performed a comprehensive data-gathering process in order to select the most suitable databases to conduct our research. It involved extensive search efforts across various data repositories and sources, spanning from November 2023 to January 2024. The complexity of the task was aggravated by the specific nature of the data requested, both with regards to the per capita organic consumption across European nations and for the choice of datasets regarding health data, for which we had to make a compromise. More specifically, we had to choose the years included in our analysis, as well the diseases. All of this was put together with an extensive dataset selection and preprocessing, which we describe later in the paper.
The primary dataset utilized in this study was sourced from Fibl-Statistics (Source: https://statistics.fibl.org/europe/retail-sales-europe.html (accessed on 1 October 2023)), a reputable provider of organic food consumption data, which provided a comprehensive dataset, albeit with some missing values. Despite the challenges encountered, this dataset was the best solution to obtain the information required in our research. The other two datasets regarding the prevalence of cancer and the prevalence of diabetes were downloaded, respectively, from Our World In Data (Source: https://ourworldindata.org/cancer (accessed on 15 October 2023)) and IDF Diabetes Atlas (Source: https://diabetesatlas.org (accessed on 15 October 2023)). The dataset gathering involved aggregating and merging data from these disparate sources to form a cohesive dataset for analysis. We structured the data collection phase to yield three distinct datasets:
- Dataset A: merging the organic food consumption trends across European countries with both cancer prevalence and diabetes prevalence.
- Dataset B: merging the organic food consumption trends across European countries with only the cancer dataset.
- Dataset C: merging the organic food consumption trends across European countries with the cancer dataset but including only cancers related to the digestive system.
The reason we decided to use these three datasets was to compare the situation of the European countries regarding cancer and diabetes prevalence. This was possible thanks to the use of Dataset A. Secondly, we also wanted to consider the two separate cases of the incidence of only diabetes or only a specific type of cancer. This was the rationale for obtaining Dataset B and Dataset C. This approach, in fact, facilitated a comparative analysis, allowing us to discern the impact of different variables on consumption patterns. The restriction of our investigation field to cancers related to the digestive system allowed us to evaluate how much they affect the totality of cancers. Furthermore, a fourth dataset was constructed using original survey data designed specifically for this study. This novel dataset provided unique insights into organic food consumption behaviors, enhancing the depth of our analysis and enabling additional considerations.
In the following sections, we report the description of the datasets, including trends of variables across European countries and several data preprocessing steps. In the last part, the structure of the questionnaire is described. The dataset collected is publicly available in the repository https://github.com/GiulioAngiolini/organic-and-disease (Created in 2024).
3. Dataset Description
3.1. Organic per Capita Consumption
The first dataset comprises information on the per capita consumption of organic foods across multiple European countries spanning the years 2000 to 2021. We formatted it in a tabular form, in which each row corresponds to a specific country, while the columns represent individual years. The consumption values are measured in [EUR/person] units, indicating the per capita consumption levels for organic foods.
Upon initial inspection, it is evident that the dataset contains some missing values, particularly for certain countries and years (Figure 2).

Figure 2.
Missing values of the per capita organic consumption dataset.
Therefore, we applied missing data imputation, more specifically, we employed a refined form of data elimination, specifically targeting records with excessive missing values beyond the year 2009. This approach was deemed necessary to preserve data integrity, as the complete elimination of records with missing values over the entire time span would lead to a significant loss of information given the relatively small size of the dataset. The reason for focusing on data from 2009 onwards was purely statistical and for data availability purposes. In this way, we mitigated the loss of information while ensuring the removal of records with substantial missing data. Interpolation, another common method for handling missing data, was considered less suitable in this scenario. This decision was based on the observation that missing values often occurred consecutively for multiple years within the same records. Interpolating such data would introduce potentially misleading trends and inaccuracies, given the non-linear nature of organic food consumption patterns.
A descriptive analysis of the dataset reveals interesting trends as shown in Figure 3. Globally, there appears to be an increasing trend in the consumption of organic foods over the years. This trend is observable across various European countries, albeit with some variations in the pace and magnitude of growth. Switzerland and Denmark have significantly outpaced the organic food consumption levels of all other countries since 2015, highlighting their strong preference for organic products.
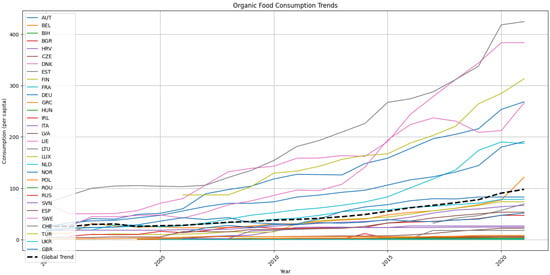
Figure 3.
Organic food consumption trends for European countries and global trend.
Such insights, obtained through the elaboration of Fibl-Statistics’ data, lead the way for further exploration into the relationship between organic food consumption and its potential impact on health outcomes, particularly concerning cancer and diabetes prevalence.
3.2. Cancer and Diabetes Prevalence
The dataset concerning cancer prevalence among European nations is robust and complete, lacking any missing values and ensuring data availability for all countries across all years. This dataset released by Our World In Datan represents the share of the total population with any form of cancer, measured as the age-standardized percentage. This share has been age-standardized assuming a constant age structure to compare prevalence between countries and through time. Similarly, the subset focusing specifically on digestive system cancers maintains this comprehensive nature, providing a detailed overview of cancer incidences within this domain. The only downside to this dataset is that only data up to 2019 are available.
However, when considering the dataset related to diabetes prevalence, a more time-consuming approach was necessary due to data availability issues. While the World Health Organization (WHO) dataset offered comprehensive coverage in terms of years, it suffered from significant missing values, posing challenges for analysis. In contrast, the IDF Diabetes Atlas dataset presented a viable alternative, providing complete data for all nations until 2021, albeit at a biennial frequency (e.g., 2001, 2003, 2005, etc.). Despite this temporal gap, the dataset’s completeness for each included year outweighed the limitations imposed by the two-year intervals, leading to its selection for analysis.
In Figure 4 and Figure 5, we present an overview of the incidence of cancer and diabetes in European countries. Notably, among all nations, Turkey exhibited the most significant deviation in diabetes prevalence values, reaching a peak in 2013 before gradually decreasing until 2019, while consistently maintaining higher rates compared to other countries.
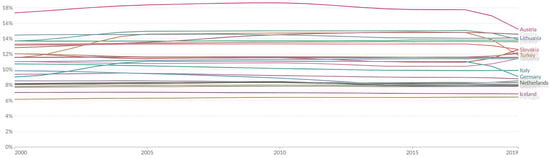
Figure 4.
Cancer prevalence trends for European countries.
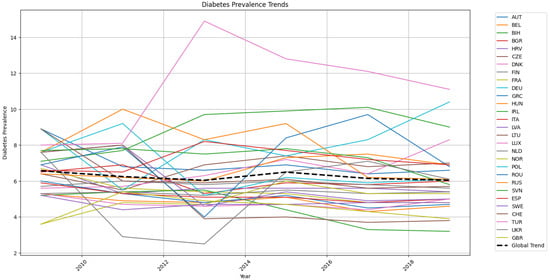
Figure 5.
Diabetes prevalence trends for European countries and global trend.
3.3. Data Preprocessing
In this section, we describe the steps undertaken to preprocess the dataset for further clustering analysis.
- The primary challenge encountered in our analysis is related to the absence of complete data on organic consumption per capita for several nations across Europe. Notably, countries such as Albania, Andorra, Armenia, Azerbaijan, Belarus, Cyprus, the Vatican City, Georgia, Iceland, Kazakhstan, Malta, Moldova, the Principality of Monaco, Montenegro, Portugal, San Marino, Serbia, and Slovakia were entirely lacking in the organic dataset. Despite the apparent loss of data, it is essential to note that many of the excluded nations are relatively small in size and population. Thus, while acknowledging the potential for bias introduced by their exclusion, the analysis will be more limited, but its overall integrity remains. The missing data would have added further information for stakeholders and policy makers. However, due to the relatively small size of the nations, we believe that our paper already offers quite a nice overview of the datasets and descriptions provided by the data availability nowadays.
- We further performed standardization of the country names to merge the various datasets. In particular, the ISO 3166-1 alpha-3 (ISO 3166-1 alpha-3 is a three-letter country code standard set by the International Organization for Standardization (ISO).)
- We further standardized numeric features in every dataset using the Python verson 3.1 function StandardScaler(). This function in Python is a data preprocessing technique used to transform the characteristics of a dataset to have a zero mean and unit standard deviation, known also as Z-score normalization. The z-score value is calculated as follows:where is the value to be standardized and and are, respectively, the average and standard deviation of the samples. According to this criterion, therefore, the characteristics will have the properties of a standardized normal distribution.
- In addition to the nations excluded due to the complete absence of data, it was also necessary to exclude Estonia and Liechtenstein from the analysis. These countries were omitted due to a significant number of missing values on organic consumption, as seen in Figure 2, which would have introduced substantial gaps in the analysis, thereby compromising its accuracy and reliability.
Therefore, taking into account both the restriction of the temporal range to the years after 2009 due to the excessive lack of data on organic consumption and the biennial frequency of data on diabetes prevalence, the final dataset, including all three features (organic, cancer, and diabetes) will have data from 2009 to 2019 every two years. Instead, for the other two datasets concerning only organic consumption and prevalence of cancer (total or only related to the digestive system), we will have all the years from 2009 onwards. All the final datasets have a time horizon that stops at 2019, and this is due, as mentioned above, to the ‘obsolescence’ of the cancer dataset. Figure 6 shows a general overview of the above: rows correspond to the three datasets created, which differ depending on the variables considered; columns show the years available or not for each dataset.
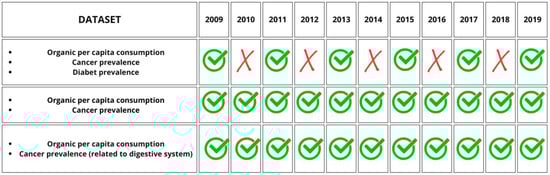
Figure 6.
Overview of the three final datasets obtained.
3.4. Questionnaire
The questionnaire was administered to gather data for the investigation of the consumption of organic products and its impact on health. It was created in Italian using Google Forms and then exported to Excel to extract further insights with Python. The questionnaire was distributed through several channels, including messaging applications, social media platforms, and survey exchange sites from 23 January 2024 to 28 Feburary 2024. A total of 202 responses were collected from the survey. The relatively small number of respondents was the maximum we could reach in the given time-frame available to keep the survey opened. We believe that this size, even if not a huge size, could still give initial indications of the knowledge concerning organic food and health, which is diffused within the Italian population. A limitation of this cohort is the fact that the participants are in the age-range of 18–24 years old. However, considering this, the survey can still be used as an interesting prototypical survey to detect and investigate the knowledge toward organic food consumption and health within the population nowadays.
The primary objective of this research is to examine the correlation between the consumption of organic products and perceived health benefits. Therefore, the questionnaire investigated the knowledge, attitudes, and behaviors of individuals within the Italian population regarding the topic of organic product consumption and its perceived health implications. It aimed to provide insights into various aspects, including respondents’ understanding of organic products, their perceptions of the health benefits associated with organic consumption, and the motivations driving their choices in purchasing organic products. Additionally, the questionnaire collects demographic information to segment the sample and identify any correlations between respondents’ demographics and their responses. It further employed a combination of question types to achieve its objectives. Firstly, questions were designed to assess respondents’ knowledge and awareness of organic products, both to screen the sample and to gain insight into their real knowledge of it. The second part includes questions exploring respondents’ beliefs and perceptions regarding the health benefits associated with consuming organic products and questions examining the factors that drive respondents to choose organic products over conventional ones. Lastly, demographic questions were included to understand the characteristics of the sample population and identify any variations or correlations in responses based on demographic factors such as age, gender, education level, income, and household information. The overall structure could be summarized as follows:
- Cover Letter: This introductory section provides an overview of the survey, including its purpose and assurance of respondent privacy in accordance with European Regulation 2016/679.
- Screening Questions: Designed to filter out respondents who may not provide relevant information.
- Model Questions: These questions pertain to constructs identified at the survey’s outset, focusing on consumer preferences and beliefs regarding organic product consumption and health.
- Classification Questions: Aimed at gathering socio-cultural data from respondents.
4. Methods
4.1. Clustering and Affinity Propagation
The clustering algorithm partitions the data into groups or clusters based on similarity or distance metrics. The goal of clustering is to group together data points that are similar to each other while being dissimilar to points in other clusters. This enables the algorithm to discover natural groupings or clusters within the data, which can then be used for various purposes such as customer segmentation, anomaly detection, or data compression [13,14,15,16]. In our work, we employed Affinity Propagation (AP), which can be collocated into the Exemplar-based clustering class and has been widely applied to several fields [17,18]. The Affinity Propagation algorithm, proposed by Frey and Dueck, is based on the concept of “message-passing” between data points to identify cluster centres and assign data points to these centres automatically. Data points exchange between them two messages, one of responsibility and one of availability , which indicates how well-suited a data point is to be a potential exemplar. After iterative message passing, exemplars can be identified by calculating the maximum of for point i. If , point i is selected as an exemplar, or point k is the exemplar of point i [19]. In our experimental settings, we performed a grid search over the hyper-parameters of the Affinity Propagation algorithms, choosing the best configuration that would maximize clustering similarity. We selected AP over hierarchical and spectral clustering due to its ability to automatically determine the number of clusters without requiring a predefined value, which is particularly advantageous given the inherent complexity and variability in our dataset. Additionally, AP identifies representative exemplars within each cluster, providing enhanced interpretability—an essential factor for our application. Unlike spectral clustering, which relies on eigenvalue decomposition and may struggle with scalability for large datasets, AP efficiently handles complex cluster structures without assuming convexity. Moreover, compared to hierarchical clustering, AP avoids the need to define a linkage criterion, which can be challenging in high-dimensional spaces. These are the main reasons we decided to choose AP over other possible valid choices, such as HDBSCAN or further unsupervised non-partition-based clustering solutions.
4.2. Global Multiplexity Index
The multiplex network model offers a versatile framework for studying interconnected systems where entities interact across multiple layers. This model allows for the representation of complex relationships by considering different types of connections or interactions between the same entities. In a multiplex network, each layer represents a distinct set of connections, and nodes can have different neighbors in each layer [20]. A multiplex network can be defined as a collection of graphs, where each graph represents a layer of interaction with its own set of nodes and edges. The total number of graphs in the multiplex model is denoted as m, and each one contains a set of edges E and nodes V [21].
By analyzing multiplex networks, researchers can gain a deeper understanding of how entities are connected through diverse relationships and interactions across multiple layers. The advantage of a multiplex model is that the presence of several different network layers has been consistently shown to be more informative than a single layer [22,23,24,25].
The global multiplexity index (also called community multiplexity index) serves as a valuable metric for assessing the interconnectedness between pairs of nodes across multiple network layers. It offers a comprehensive measure of the level of connectivity and community overlap between nodes in different network contexts, reflecting a deeper understanding of their relationships beyond individual networks. By examining the shared community memberships of nodes across various network layers, the index provides a perspective on the degree of similarity between some characteristics of nodes.
This index captures the essence of how nodes are linked through common communities across diverse networks, shedding light on the underlying patterns of connectivity and potential similarities. By aggregating the differences in community memberships across multiple network layers, the global multiplexity index reveals the intricate web of relationships and shared characteristics among nodes that transcend individual network boundaries.
In essence, the global multiplexity index underscores the significance of exploring the collective community memberships across different network layers to uncover hidden connections and similarities between nodes. We formalized this idea as the global multiplexity index of a pair of countries [21] (i, j):
where is a discrete variable indexing the cluster of which node i is a member. If the two are equivalent for a given network G, the level of global multiplexity increases by one, according to the Kronecker delta function.
5. Experiments and Results
This manuscript undertook a comprehensive investigation into the potential correlations between organic consumption rates and the prevalence of cancer and diabetes across multiple European nations. The main focus was to find out how European nations group on the basis of the three variables in different time scenarios and then try to look for the reasons for why they group together in that way. Initially, the analysis focused on identifying linear relationships among the three variables using the Pearson correlation coefficient. This involved aggregating data from the years 2009, 2011, 2013, 2015, 2017, and 2019 to calculate both the overall mean values for each variable and their respective Pearson correlation coefficients. Additionally, correlations were examined on a yearly basis to capture any temporal trend.
Subsequently, an unsupervised analysis was conducted to uncover underlying patterns among European nations, employing the Affinity Propagation clustering algorithm. Clustering was performed in several ways:
- On the cumulative values of all years to produce a single clustering outcome;
- On a yearly basis, producing as many clusterings as years;
- On the delta values between different years, such as the differences between 2017 and 2009, across all possible combinations of years.
This approach yielded several clustering outcomes, each providing insights into potential groupings or associations among the nations based on their organic consumption, cancer prevalence, and diabetes rates.
The Python code (version 3.1) used to obtain the results of the next sections is available at the following GitHub repository: https://github.com/GiulioAngiolini/organic-and-disease (accessed on April 2025).
5.1. Preliminary Statistical Analysis
From the results of Pearson’s correlation analysis between organic consumption and the prevalence of cancer and diabetes, an interesting scenario emerges.
First, considering the average of the variables in the period analyzed (from 2009 to 2019), a moderate negative correlation was observed between organic consumption and both the prevalence of cancer (−0.2) and diabetes (−0.17) indicating an inverse association between the consumption of organic food and the incidence of these diseases. However, the positive correlation between the prevalence of cancer and diabetes (+0.38) suggests that these two conditions could be related in some way, regardless of organic consumption (Figure 7).
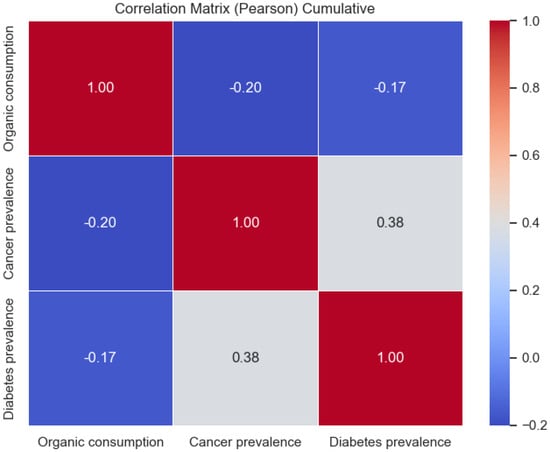
Figure 7.
Representation of the correlation matrix obtained using the Pearson correlation coefficient on average values among all the European nations.
Looking at the year-by-year correlations, there are variations in the ratio of variables over time. For example, in 2009, there was a slight negative correlation between organic consumption and cancer (−0.11), while there was a positive correlation with diabetes (+0.10). These results indicate that in 2009, organic consumption may be associated with a lower incidence of cancer, but not necessarily diabetes. In general it can be noted that over the years, the correlation between organic consumption and the prevalence of cancer tends to increase, reaching −1.2, while that between organic consumption and the prevalence of diabetes oscillates randomly between −1.2 and 0. We found the greatest negative correlation between organic consumption and prevalence of cancer (−0.30) in 2019, while the correlation with prevalence of diabetes is close to zero (+0.03), indicating a possible reduction in the association between organic consumption and diabetes. Overall, the results suggest that there is an inverse association between organic consumption and the prevalence of cancer and diabetes, although the exact nature of this relationship may vary over time and may be influenced by other factors. The correlation matrices are released in the github folder https://github.com/GiulioAngiolini/organic-and-disease (accessed on April 2025). To further explore the correlation statistics, we also report the results for each year independently in Figure 8. The patterns of the various years results to be similar, witnessing a similar behavior happening across the various years analyzed in the study.
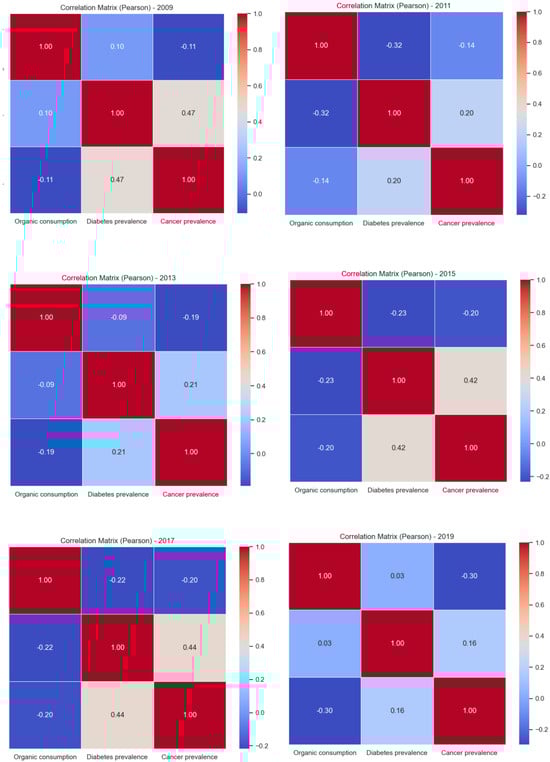
Figure 8.
Correlation plots year by year from 2009 to 2019.
It is important to underline that the Pearson correlation coefficient only measures the strength and direction of a linear relationship between variables. It does not imply causation or determine whether one variable causes changes in the other. In any case, a negative correlation is a starting point for further investigation and analysis.
5.2. Clustering on the Average Dataset (Dataset A)
The clustering analysis on the European countries based on average values of organic consumption, cancer prevalence, and diabetes prevalence reveals interesting insights. Two scenarios are examined: one depicting organic consumption against cancer prevalence and another displaying organic consumption against diabetes prevalence. Ideally, the distribution of points across these plots should follow a decreasing pattern, reflecting the popular belief that an increase on organic consumption correlates with a decrease in cancer and diabetes prevalence.
In Figure 9, we compared organic consumption and cancer prevalence. We can, therefore, observe a distribution that roughly aligns with a hypothetical exponential decay curve, indicating a potential negative relationship between organic consumption and cancer prevalence. However, in Figure 10, comparing organic consumption and diabetes prevalence, the distribution appears slightly more random, suggesting a weaker association between organic consumption and diabetes prevalence. This observation aligns with the correlation matrix (Figure 7), where organic consumption exhibits weak negative correlations with both cancer (−1.20) and diabetes (−1.17).

Figure 9.
Cumulative clustering: organic food consumption and cancer prevalence.
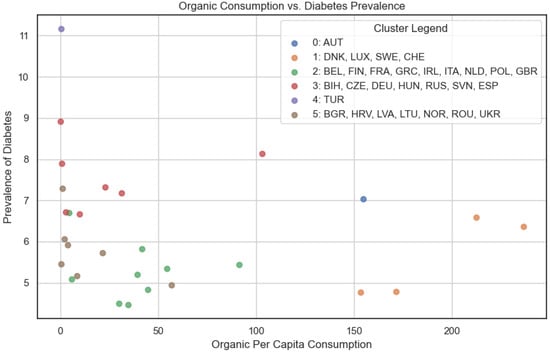
Figure 10.
Cumulative clustering: organic food consumption and diabetes rates.
Upon checking the resulting clusters, it becomes evident that Austria and Turkey stand out by forming their own distinct clusters, possibly owing to unique socio-economic or cultural factors influencing organic consumption and disease prevalence in these nations. The other clusters consist of the following countries:
- Cluster 1: Denmark (DNK), Luxembourg (LUX), Sweden (SWE), Switzerland (CHE).
- Cluster 2: Belgium (BEL), Finland (FIN), France (FRA), Greece (GRC), Ireland (IRL), Italy (ITA), Netherlands (NLD), Poland (POL), United Kingdom (GBR).
- Cluster 3: Bosnia and Herzegovina (BIH), Czech Republic (CZE), Germany (DEU), Hungary (HUN), Russia (RUS), Slovenia (SVN), Spain (ESP).
- Cluster 4: Bulgaria (BGR), Croatia (HRV), Latvia (LVA), Lithuania (LTU), Norway (NOR), Romania (ROU), Ukraine (UKR).
The average silhouette score related to this clustering is 0.32. This evaluation of the clustering goodness may initially appear modest, but it likely reflects the inherent characteristics or structure of the data under analysis. To thoroughly explore the clustering outcomes, we employed the Affinity Propagation algorithm with various input parameter configurations, e.g., varying the preferences. The clustering results were then sorted based on silhouette scores. As we can see in Figure 11, the highest silhouette score (0.376) was achieved when setting preferences to −1, resulting in 10 clusters.
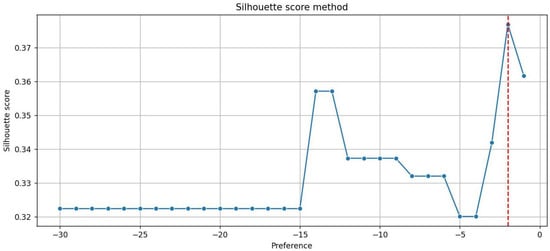
Figure 11.
Silhouette score with different input parameters: the dashed red line indicates the highest one.
It is important to note that, in our case, having 10 clusters is not so appropriate given the limited number of data points available. Therefore, it is clear that a silhouette score of 0.32, obtained using the default preference (the median), is reasonable within this context. This observation underscores the necessity of interpreting silhouette scores in conjunction with the nature of the dataset and the clustering algorithm’s parameters to derive meaningful insights.
Additionally, to gain a comprehensive understanding of the clustering among the three variables simultaneously, we present a 3D plot (Figure 12). This visualization offers a more comprehensive perspective, allowing for the exploration of how organic consumption, cancer prevalence, and diabetes prevalence interact within the clustered European nations. By incorporating the third dimension, we can better discern any complex relationships or patterns that may not be fully captured in the individual scatter plots.

Figure 12.
A 3D view of clustering: the various colors represent the clusters obtained.
5.3. Clustering Year-by-Year (Dataset A)
In this case, clustering analysis was conducted on European nations on a year-by-year basis to uncover any potential trends among the clusters. To facilitate visualization and comprehension of these trends, an animated plot was adopted as the primary data visualization tool available in our public repository, where each animation frame corresponds to a specific year and each color is associated with a specific cluster. Non-colored (grey) nations are those that presented incomplete data and, therefore, were not included in the study.
By initiating the animation with the play button, observers can see how clusters evolve over time. This dynamic visualization method provides immediate insights into which nations frequently or consistently cluster together.
This initial graphical exploration is further supported by a more analytical approach using the Global Multiplexity Index.
This index calculates the frequency with which two nations appear together in the same cluster within the given time frame, considering all pairs of nations. In particular, the animated map reveals that Eastern European nations consistently form a cohesive cluster over time. This observation is confirmed by numerical analysis using the Global Multiplexity Index. Specifically, all pairs of Eastern European nations exhibit a multiplexity index value of six, indicating they are clustered together in each of the six years under consideration. Together with these, there is another subgroup with an index equal to six, consisting of Italy, Spain, Belgium, Ireland, and Finland. So we have two groups of nations that maximize the Global Multiplexity Index:
- Bulgaria (BGR), Turkey (TUR), Romania (ROU), Ukraine (UKR), Czech Republic (CZE), Hungary (HUN), Poland (POL), Greece (GRC), Russia (RUS).
- Belgium (BEL), Finland (FIN), Italy (ITA), Spain (ESP), Ireland (IRL).
Thus, both visual and analytical methods converge to underscore the robust clustering of these two subgroups of European nations throughout the analyzed period (Figure 13, Figure 14, Figure 15, Figure 16, Figure 17, Figure 18 and Figure 19).
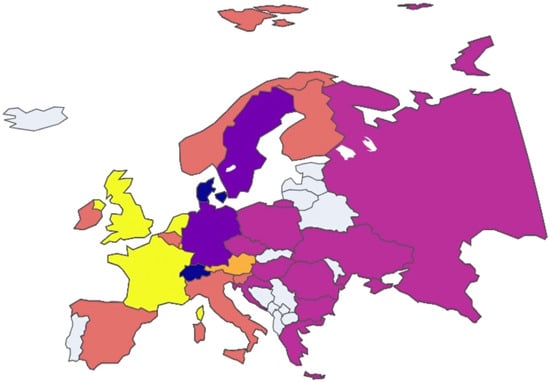
Figure 13.
European nation clustering: Year 2009.

Figure 14.
European nation clustering: Year 2011.
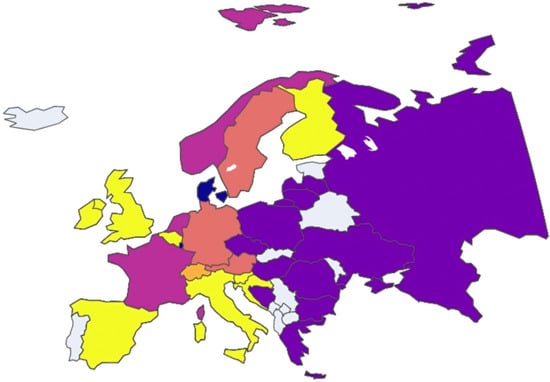
Figure 15.
European nation clustering: Year 2013.
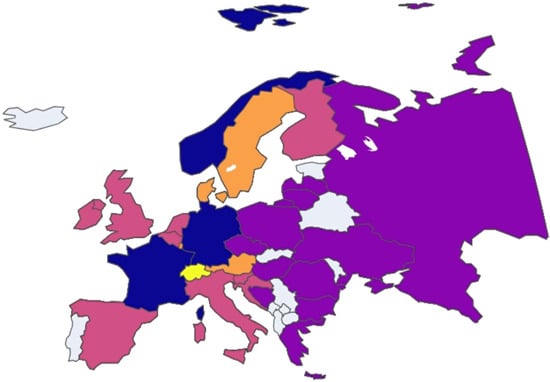
Figure 16.
European nation clustering: Year 2015.

Figure 17.
European nation clustering: Year 2017.

Figure 18.
European nation clustering: Year 2019.
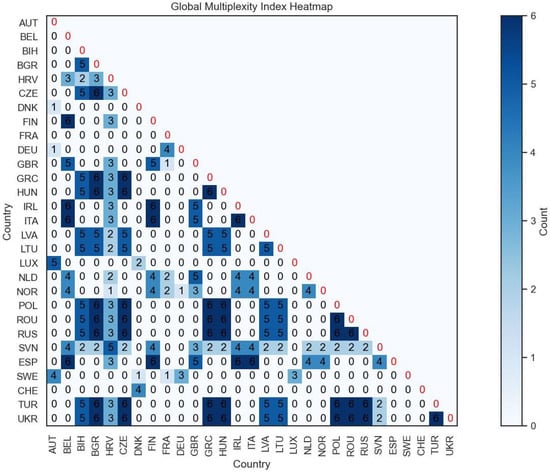
Figure 19.
Global Multiplexity Index for each pair of European countries related to year-by-year clustering on Dataset A.
5.4. Clustering on Delta Values (Dataset A)
In this paragraph, clustering on European nations has been conducted based on the delta values for each combination of years, focusing on the years 2019–2009 and 2019–2017. Clustering on delta values between years involves examining the changes in variables over time rather than absolute values. The same three variables (organic consumption, cancer prevalence, and diabetes prevalence) were utilized for clustering. By focusing attention on the largest time gap (2019–2009) (Figure 20) and the smallest (2019–2017) (Figure 21), we can collect insights into the evolution of clusters over time. Referring to the two clusters highlighted in the previous section, consisting of Italy (ITA), Spain (ESP), Belgium (BEL), Finland (FIN), and Ireland (IRL) in the first, and Russia (RUS), Ukraine (UKR), Romania (ROU), Bulgaria (BGR), Greece (GRC), Poland (POL), Czech Republic (CZE), Turkey (TUR), and Hungary (HUN) in the second, we observe distinct patterns. Concerning the 2019–2009 interval, ESP, BEL, and FIN are grouped together again, as are ITA and IRL, while RUS, UKR, POL, GRC, and BGR form another group, along with CZE and HUN. Regarding the 2019–2017 interval, the first cluster remains intact (ITA, ESP, FIN, BEL, IRL), while RUS, POL, BGR, and GRC form a separate grouping, alongside HUN and UKR. These results suggest both consistency and change in cluster composition over time. The persistence of certain groupings indicates stable trends or shared developmental trajectories among certain nations, while shifts in cluster composition suggest evolving dynamics or diverging trends within the countries.
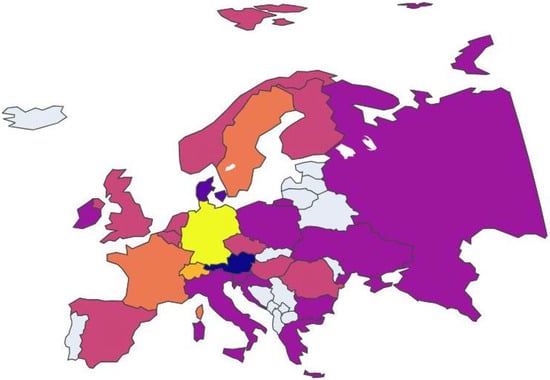
Figure 20.
European nation clustering on delta values between 2019 and 2009.
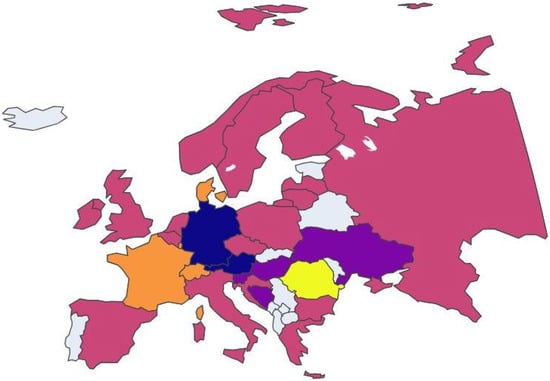
Figure 21.
European nation clustering on delta values between 2019 and 2017.
5.5. Year-by-Year Clustering (Dataset B)
In this section, clustering analysis was conducted on European nations using Dataset B, comprising only two variables: organic consumption and cancer prevalence. The clustering was performed year-by-year, and for the visualization of the results, as before, we used both the animated plot and the Global Multiplexity Index. The analysis of the Global Multiplexity Index revealed three clusters of countries which grouped together across all the years considered.
- Belgium (BEL), Ireland (IRL), Finland (FIN), Spain (ESP), United Kingdom (GBR), Greece (GRC), and Netherlands (NLD).
- Russia (RUS), Ukraine (UKR), Turkey (TUR), Romania (ROU), and Croatia (HRV).
- Czech Republic (CZE), Hungary (HUN), Bulgaria (BGR), and Slovenia (SVN).
Comparing the results of clustering from Dataset A, which includes diabetes prevalence alongside organic consumption and cancer prevalence, with those from Dataset B, which only considers organic consumption and cancer prevalence, we can see the potential influence of this factor. Notably, in Dataset A, the first cluster included nations like BEL, IRL, FIN, ESP, and ITA, while the second cluster comprised BGR, TUR, ROU, UKR, CZE, HUN, POL, GRC, and RUS. The inclusion of the diabetes prevalence variable impacts the clustering patterns observed among European nations, leading to distinct groups. For instance, nations like Bulgaria (BGR), Turkey (TUR), Romania (ROU), and Ukraine (UKR) are consistently grouped together in Dataset A but not in Dataset B. This discrepancy suggests that diabetes prevalence plays an important role in shaping these clusters. The correlation coefficients further support this notion. The moderate positive correlation between diabetes and cancer (0.38) implies that nations with higher diabetes prevalence may also exhibit higher cancer rates. Conversely, the slight negative correlation between diabetes and organic consumption (−1.17) suggests that nations with higher organic consumption tend to have lower diabetes prevalence. Therefore, when diabetes prevalence is factored into the clustering analysis, it introduces a dimension related to lifestyle factors that influences the groupings of nations. On the other side, we can notice how the subgroup of countries composed of Belgium (BEL), Ireland (IRL), Finland (FIN), and Spain (ESP) remain untouched in performing clustering on Dataset B (Figure 22).
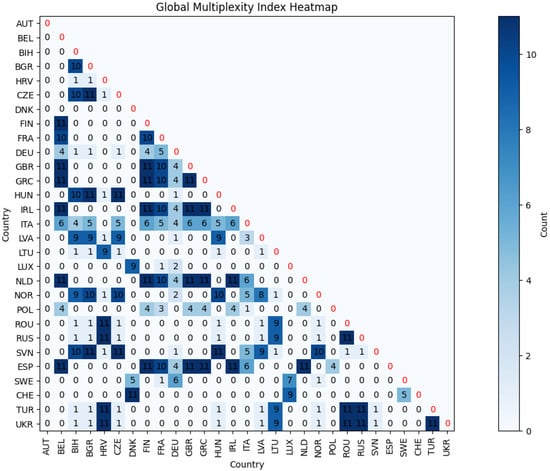
Figure 22.
Global Multiplexity Index for each pair of European countries related to year-by-year clustering on Dataset B.
5.6. Year-by-Year Clustering (Dataset C)
The latest clustering analysis was always conducted on European nations on an annual basis, but this time, it included organic consumption and the prevalence of cancers related only to the digestive system (Dataset C) as variables. In particular, the cancers taken into account are: liver, stomach, pancreatic, esophageal, colon and rectum, and gallbladder. Also in this case, between all the groups of nations formed over the years, only those that maximized the Global Multiplexity Index (e.g. the nations that have always been together in all years) were considered. The last two clusterings (on Dataset B and Dataset C) were carried out in order to compare their results: if the same groups of nations that maximize the Global Multiplexity Index were obtained in both clustering cases, this could mean that, of all existing cancers, organic consumption is mainly related to cancers inherent to the digestive system. Based on clustering results and comparisons between organic consumption and total cancer prevalence versus organic consumption and cancers only related to the digestive system, different groups of European nations emerge. In the case of organic consumption and total cancer prevalence, we observed three main clusters:
- Belgium (BEL), Ireland (IRL), Finland (FIN), Spain (ESP), United Kingdom (GBR), Greece (GRC), and Netherlands (NLD).
- Russia (RUS), Ukraine (UKR), Turkey (TUR), Romania (ROU), and Croatia (HRV).
- Czech Republic (CZE), Hungary (HUN), Bulgaria (BGR), and Slovenia (SVN).
On the other hand, when focusing on organic consumption and cancers related only to the digestive system, different clusters emerge that maximize the Global Multiplexity Index (Figure 23).
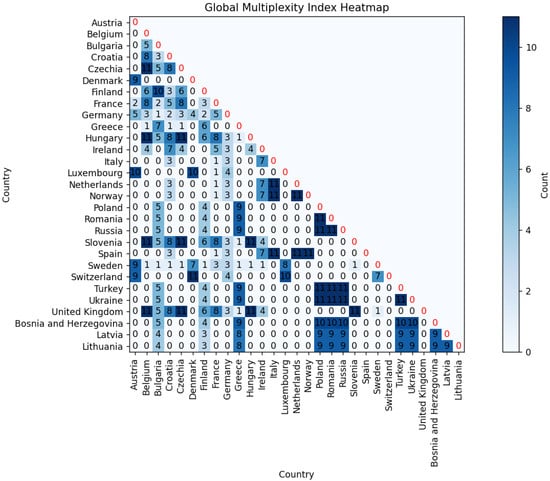
Figure 23.
Global Multiplexity Index for each pair of European countries related to year-by-year clustering on Dataset C.
- Czech Republic (CZE), Belgium (BEL), Hungary (HUN), Slovenia (SVN), and United Kingdom (GBR).
- Netherlands (NLD), Italy (ITA), Norway (NOR), and Spain (ESP).
- Poland (POL), Romania (ROU), Russia (RUS), Turkey (TUR), and Ukraine (UKR).
- Switzerland (CHE) and Denmark (DNK).
At first glance, we can notice a partial overlap between the clusters. Belgium, Czech Republic, Hungary, Slovenia, and United Kingdom appear in both cases, even if with different nations. However, there are other notable differences as well. In the case of cancers related to the digestive system, we see additional clusters that do not appear in the total cancer prevalence clustering.
This disparity in clustering suggests that the influence of organic consumption on cancer risk may not be directly correlated with digestive system cancers.
6. Discussion of Results
In the previous sections, an extensive analysis was conducted to cluster European nations based on three core variables: organic consumption, cancer prevalence, and diabetes prevalence. This comprehensive analysis employed various methodologies, including cumulative data (averaging values for each variable across the years), annual data, and the calculation of delta values between different combinations of years. As seen above, among the various European countries, two distinct clusters consistently emerged across all analytical approaches. The first cluster, characterized by Belgium (BEL), Finland (FIN), Ireland (IRL), Italy (ITA), and Spain (ESP), remained cohesive throughout, contrasting with the predominantly Eastern European nations forming the second cluster: Bulgaria (BGR), Turkey (TUR), Romania (ROU), Ukraine (UKR), Czech Republic (CZE), Hungary (HUN), Poland (POL), Greece (GRC), and Russia (RUS). Both of these groups of European nations maximize the year-by-year Global Multiplexity Index.
6.1. SDGs
To fully comprehend these findings, it is crucial to contextualize them within the framework of specific Sustainable Development Goals (Source: https://sdgs.un.org/goals (accessed on April 2023).) (SDGs), as defined by the United Nations. The SDGs are a universal call to action to end poverty, protect the planet, and ensure that all people enjoy peace and prosperity by 2030.
The key SDGs relevant to this analysis are the following:
- Goal 2: “End hunger, achieve food security and improved nutrition and promote sustainable agriculture”.
- –
- Target 2.4:“By 2030, ensure sustainable food production systems and implement resilient agricultural practices that increase productivity and production, that help maintain ecosystems, that strengthen capacity for adaptation to climate change, extreme weather, drought, flooding and other disasters and that progressively improve land and soil quality”.
- Goal 3: “Ensure healthy lives and promote well-being for all at all ages”.
- –
- Target 3.4:“By 2030, reduce by one third premature mortality from non-communicable diseases through prevention and treatment and promote mental health and well-being”.
While the second goal primarily focuses on ending hunger, achieving food security, improving nutrition, and promoting sustainable agriculture, its fourth target point specifically emphasizes promoting sustainable food production systems and implementing resilient agricultural practices, including through the encouragement of organic farming [26]. The third goal aims to ensure healthy lives and promote well-being for all ages. It included targets related to reducing mortality rates, preventing diseases, ensuring access to healthcare services, and promoting mental health and well-being. Target 3.4 directly addresses the importance of reducing premature mortality from non-communicable diseases, such as cancer and diabetes, through preventive measures and improved healthcare access. It emphasizes the significance of promoting overall well-being and addressing key risk factors associated with chronic diseases. In the context of the analysis, which focuses on clustering European nations based on disease prevalence, including cancer and diabetes, this target underscores the relevance of understanding and addressing these health challenges within the broader framework of sustainable development goals. Before looking at the plots illustrating the progress of each European country within the first cluster concerning Sustainable Development Goals (SDGs), it is important to understand how to interpret these plots. The status and progress of each country are assessed using specific methodologies. The status of a particular SDG is determined by an aggregate score derived from all relevant indicators, utilizing the most recent data available (primarily referring to 2021 and 2022). For each indicator, a country’s status score is calculated relative to the range of values from the worst to the best performing country, excluding outliers. To produce the status score calculation, we used a Min-Max normalization method, with country-level scores aggregated at the SDG level using the arithmetic mean. This goal-level score is afterwards compared to the EU aggregate status score for the same goal, showcasing how much a country’s SDG status deviates from the EU average.
Progress, on the other hand, is assessed through an aggregate score of short-term (five-year) growth rates for all indicators relevant to each goal. This methodology utilizes a scoring function similar to the calculation of progress at the EU level. Progress scores are based on data mainly spanning from 2016 to 2021 or 2017 to 2022, with adjustments made for data availability issues or cases where countries have already achieved maximum values for certain indicators.
Interpreting the graphs, the vertical axis illustrates the status of SDGs within each depicted country relative to the distribution of Member States and the EU average. SDGs positioned higher on the graph indicate a status above the EU average, while those lower depict a status below the EU average. The horizontal axis indicates progress, with SDGs on the right representing progress and those on the left indicating regression. These axes create four quadrants characterizing the country’s trajectory toward SDGs.
- The country is progressing towards these SDGs, and, on average, the indicator values are above the EU average.
- The country is progressing towards these SDGs, but, on average, the indicator values are below the EU average.
- The country is moving away from these SDGs, but, on average, the indicator values are above the EU average.
- The country is moving away from these SDGs, and, on average, the indicator values are below the EU average.
Overall, while a country’s status score offers a relative measure of its position compared to other Member States and the EU average, its progress score provides an absolute measure based on indicator trends over the past five years, independent of the progress made by other Member States. These interpretations provide valuable insights into each country’s efforts towards achieving SDGs and inform potential areas for improvement and policy interventions. The graphs shown in the SDG website illustrate the SDG situation for each country belonging to the first cluster. Our goal was in fact to analyze similarities between countries belonging to the same clusters, and understand if the SDG scores were also similar for countries belonging to the same clusters, considering clusters formed for organic food consumptions. Aligning the findings of the clustering analysis with these SDGs, a deeper understanding of the collective direction and coherence among certain European nations actually and interestingly emerges. More specifically, after a careful examination of the plots illustrating the progress of each European country within the first cluster regarding Sustainable Development Goals (SDGs), it becomes evident that these nations show quite similar behavior concerning the two key SDGs. More specifically, with the exception of Finland’s SDG 2 progress score that is moving away, all other countries’ progress scores for SDGs 2 and 3 predominantly remain positioned to the right of the x-axis. This positioning signifies progress towards these SDGs, as indicators associated with sustainable agriculture (SDG 2) and health and well-being (SDG 3) have a positively oriented trend.
Furthermore, the vertical position (status) of these countries oscillates consistently within a relatively close range, typically between −1% and 20%. This range indicates that the countries’ SDG statuses are generally close to, or slightly deviating from, the EU average. A status falling within this range implies that these nations are relatively aligned with the EU’s progress towards the respective SDGs.
This observation underscores a convergence among these European countries within the first cluster, indicating collective efforts and alignment towards advancing specific sustainable development objectives. Despite potential variations in national policies and contexts, the overall trajectory towards sustainable agriculture, improved health outcomes, and well-being demonstrates a cohesive regional approach. Such coherence suggests potential synergies for collaborative initiatives and policy frameworks aimed at furthering progress towards these critical SDGs within the European context.
6.2. Internal Cluster Correlation
On the other hand, the distinctive feature observed within the second cluster lies in the strengthened negative correlation among the variables. While examining the broader correlation patterns across all nations, the Pearson correlation coefficients between organic consumption and the prevalence of diabetes, as well as between organic consumption and cancer prevalence, yielded relatively modest values of −1.17 and −1.20 (Figure 7), respectively.
However, focusing on the second subset of nations consistently clustered together (i.e., the nations of Eastern Europe), a notable shift occurs. Within this subgroup, the correlations become notably stronger (Figure 24), with values of −1.37 for organic consumption and diabetes prevalence, and −1.50 for organic consumption and cancer prevalence. This suggests that while the overall correlation may be weak, within this specific subset of nations, there exists a stronger negative correlation between organic consumption and both diabetes and cancer prevalence. This observation underscores the potential influence of organic consumption patterns on health outcomes within this group of nations, requiring further investigation into potential mechanisms underlying these associations.
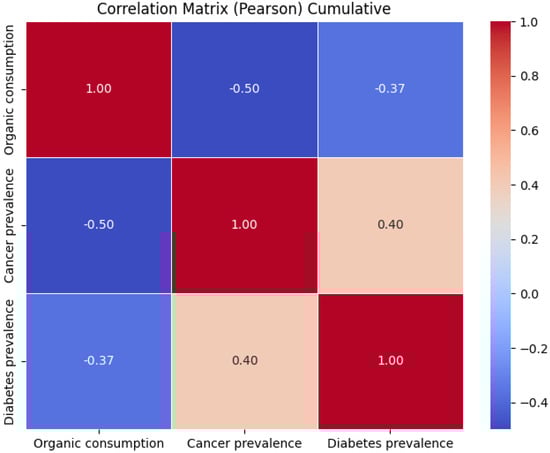
Figure 24.
Pearson correlation of average values among nations of Eastern Europe.
7. Questionnaire Results
We further proceeded with the distribution of a questionnaire to a sample of the Italian population in order to understand the knowledge regarding organic food among the population.
The whole questionnaire and the relative answers are reported in github with the additional material https://github.com/GiulioAngiolini/organic-and-disease (accessed on April 2025). The questionnaire was distributed through a Google Survey. A total of more than 200 responses were collected. Informed consent of respondents was obtained by an agreement to a privacy statement included at the beginning of the survey, whose original text is reported in github. In some cases, when requested by the respondent, it was additionally obtained verbally by the distributor of the survey. No minors were included in the survey study. For this reason, no additional ethics approval was needed [27]. The survey was kept opened for responses for a period of 2 months at the beginning of the year 2024. The findings from the questionnaire, which we designed and distributed, concerned organic consumption and its perceived impact on human health among Italian respondents reveal several key insights. First of all, an observation must be made regarding the imbalance in the respondent demographics with 39.8% male and 58.2% female respondents and more than 39.6% of respondents between 18 and 24 years old.
7.1. Knowledge of Organic Products
One of the initial question “Have you ever heard of organic?” served as a screening measure to ensure that participants had a minimum knowledge of organic products before proceeding with the survey. This step was crucial to ensure the relevance and validity of subsequent responses, as individuals unfamiliar with the concept of organic would likely be unable to provide meaningful insights on related topics. A significant portion of participants declared a moderate/high level of awareness regarding organic products, with 64.2% falling into levels 3, 4, and 5 in terms of knowledge. This understanding was further validated by their identification of the correct attributes of organic food, including its natural composition (52.7%), the absence of added substances (60.7%), and the presence of the term ‘organic’ on product labels (61.2%). These associations claim a fairly good awareness among respondents regarding the distinctive features of organic products.
7.2. Reasons for Choosing Organic Products
The factors guiding the purchase of organic produce among Italian consumers underscore a demand for high-quality standards and a preference for products perceived to offer superior health and environmental benefits compared to conventional options. Notably, the absence of chemical waste emerge as primary concerns for over 60% of respondents, reflecting a strong aversion to potentially harmful substances in their food. Moreover, organic food is perceived as guaranteeing environmental protection by 59.7% of participants, highlighting a significant emphasis on sustainability in consumer choices. Additionally, 61.2% prioritize food safety, indicating a widespread concern for the potential health risks associated with conventional farming practices. Interestingly, taste ranks lower in priority compared to other factors, with only 31.7% of respondents considering it a significant factor in their purchasing decisions.
7.3. Salary and Organic Purchase
The unexpected downward-parabolic trend observed in the plot depicting the relationship between salary brackets and the average percentage of organic purchases reveals an interesting scenario of consumer behavior that contradicts conventional assumptions. Typically, one might anticipate a positive correlation between income levels and the propensity to purchase organic products due to the presumed higher affordability among wealthier demographics. To get an answer to this hypothesis, we analyzed our sample of respondents.
In particular, to analyze responses regarding the proportion of organic purchases, a mapping dictionary was constructed. This dictionary translates textual responses into corresponding numerical values: for instance, the response ‘80% organic–20% non-organic’ is given a value of 80. Then, the average of the values associated with each income bracket is calculated.
However, the pattern shown in Figure 25 does not confirm the hypothesis, with the mid-range salary bracket of USD 20,000–24,999 exhibiting the highest average percentage of organic purchases, around 36%.
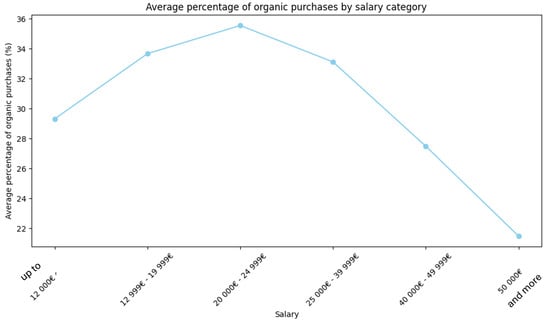
Figure 25.
Relationship between respondents’ annual income and organic purchase.
It could be assumed that individuals in this income bracket may have a greater knowledge of organic products resulting in an awareness of the health and environmental concerns associated with conventional farming practices. Despite the higher cost of organic products, they can give priority to these perceived benefits over monetary considerations. To verify this, we calculated scores for each respondent based on their answers regarding the characteristics indicating an organic product. Taking into consideration the multiple choice question ‘Tra le seguenti caratteristiche, quali sono quelle che indicano che un prodotto è biologico? (Si può selezionare più di una risposta)’ in which the right answers were ‘È naturale’, ‘Non ha alcuna sostanza aggiuntiva’, ‘Il termine ‘biologico’ è riportato nell’etichetta del prodotto’, we associated with each respondent a score of 1 if they got only one right, 3 if they guessed two, and 5 if they guessed all three. Then, we averaged the scores for each income bracket.
As can be seen from Figure 26, this assumption is not confirmed by our sample. Many other reasons can justify this finding. For example, consumers in this income bracket can represent a segment of the population that values organic products for reasons beyond mere affordability, such as lifestyle choices, food preferences, or ethical considerations.
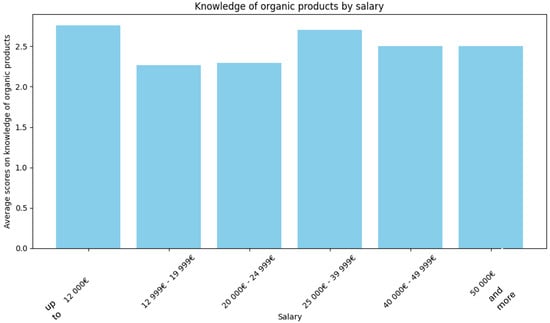
Figure 26.
Relationship between respondents’ annual income and organic knowledge.
7.4. Italian Respondents’ Perceptions and European Data
The key factor of this survey lies in the questions that explore individuals’ perceptions regarding the impact of consuming organic foods on the risk of developing cancer and diabetes. In examining the Italian respondents’ views, 58.9% believe that regularly consuming organic foods would slightly reduce the risk of developing cancer, while 21.8% think it would significantly reduce this risk. Similarly, regarding the risk of developing diabetes, 45.5% believe that regular consumption of organic foods would slightly reduce the risk, with 14.9% expressing a belief in a significant reduction.
Comparing these findings with European data on the correlation between organic consumption and the incidence of cancer and diabetes, which revealed correlations of −1.20 between organic consumption and cancer and −1.17 between organic consumption and diabetes, we can discern notable analogies. The Italian respondents’ perceptions closely align with these correlations, indicating a widespread belief in the potential health benefits of consuming organic foods in mitigating the risk of chronic diseases such as cancer and diabetes. This convergence of perceptions suggests a consistent trend across European countries regarding the perceived relationship between organic consumption and reduced risk of cancer and diabetes.
Moreover, the results from our questionnaire match up well with what other studies have found. Several papers show that people often choose organic food because they think it is better for their health [28]. This lines up with the general idea that people worry about their health, for example, they fear getting sick from conventional food. Thus, our results support what is already known about why people pick organic food, especially when it comes to health concerns. These findings certainly do not prove a cause–effect relationship but stress the importance of continuing public research and education efforts to promote informed decision-making on food choices and their potential impact on health.
8. Conclusions
All the investigations at the European level have focused on three variables: biological consumption, cancer prevalence, and diabetes prevalence. Initially, we examined the correlation between organic consumption and the prevalence of cancer and diabetes using the Pearson correlation coefficient. It was found that the average organic consumption, calculated as the mean for each European nation across the years 2009, 2011, 2013, 2015, 2017, and 2019, exhibited a weak negative Pearson correlation coefficient both with cancer prevalence (−1.20) and diabetes prevalence (−1.17), suggesting a potential protective influence of organic diets against these prevalent health concerns. To further enhance the robustness of these statistical results, we also computed the Spearman rank correlation test, obtained the rank–Spearman correlation between organic and prevalence of cancer of −1.398 with a significant p-value of 0.032 and a Spearman rank correlation coefficient of −1.394 with a significance of p-value = 0.034 for the correlation between diabetes and the consumption of organic food.
The correlation values show a low Pearson correlation coefficient between the prevalence of cancer and diabetes but still existing. Moreover despite this, the goal of our study was to further investigate the presence clusters of countries and how to organize their evaluation. Despite the relatively low Pearson correlation coefficients, our results show meaningful and reproducible patterns. Through unsupervised clustering methods, particularly Affinity Propagation, we observe the emergence of distinct, temporally stable subgroups of nations. This suggests that while linear correlations may not fully capture the complexity of the relationship between organic consumption and health outcomes, the underlying data structure reveals non-trivial associations.
Regarding the clustering analysis conducted year-by-year on these three variables among European nations using the Affinity Propagation algorithm, it was observed that two clusters consistently maximized the Global Multiplexity Index over the years. The first cluster comprised Belgium, Finland, Ireland, Italy, and Spain, while the second included Bulgaria, Turkey, Romania, Ukraine, Czech Republic, Hungary, Poland, Greece, and Russia. Regarding these two clusters, we found very interesting discussions. In fact, we have seen that all the nations contained in the first cluster progress in the same way compared to the two SDGs related to organic farming and non-communicable diseases; while with regard to the second cluster, by calculating the Pearson coefficient between cluster nations, it can be noted that there is a stronger negative correlation than the global one between organic consumption and both prevalences of cancer and diabetes.
We then reduced the field of investigation: first, between organic consumption and prevalence of cancer (all types of cancer) and then between organic consumption and prevalence only of cancers related to the digestive system. Distinct clustering emerged in each case, leading to the conclusion that, contrary to expectations, organic consumption does not significantly impact the prevalence of digestive system cancers.
Regarding the questionnaire carried out on a sample of 200 Italian citizens, it can be concluded that the perceptions of the sample confirmed the results obtained by correlating the variables at the European level. In fact, the vast majority of respondents say that the consumption of organic food slightly reduces the risk of cancer and diabetes, which aligns with the weak correlation between the variables in the European context. A limitation of this sample of respondents is their young age (between 18 and 24 years old) and being mainly located in central Italy. We are aware that further studies enlarging the age range and the sample of the respondents dataset would be needed. On the other hand, this also allows us to check how this young age cohort reasons and approach the relationship existing between food consumption and health. Furthermore, the results did not support the hypotheses that salary or knowledge of organic products influence their purchases. Instead, they reaffirmed that health impact remains the primary motivation for purchasing organic products, consistent with previous studies. In conclusion, our paper provided the following important novel points:
- A thorough review of the current studies in the field of organic food consumption.
- An in depth web crawling to retrieve data and information about cancer, diabetes, and food consumption in European countries. We further released a novel dataset, which we made publicly available.
- An in depth clustering analysis of the European country habits with respect to cancer, diabetes, and health, together with a study of the SDGs related to food in these countries.
- We designed, distributed, and collected data through a survey distributed to over 200 respondents in Italy, providing novel insights from a cohort of young participants towards knowledge and understanding of these topics.
Further studies might include the administration of the questionnaire to a larger sample of the population. Moreover, further public repositories could be crawled and explored in order to understand the interaction between different types of diseases and the consumptions of organic food in the population.
Author Contributions
Conceptualization, G.A.; Software, G.A.; Validation, G.M.D.; Data curation, G.A.; Writing—original draft, G.M.D.; Supervision, G.M.D. All authors have read and agreed to the published version of the manuscript.
Funding
This research received no external funding.
Data Availability Statement
All of the data and code is available at https://github.com/GiulioAngiolini/organic-and-disease (accessed on April 2025).
Conflicts of Interest
The authors declare no conflicts of interest.
References
- Ciccarese, L.; Silli, V. Agricoltura Biologica, Una Scelta Giusta per l’Ambiente, la Sicurezza Alimentare e la Salute? Available online: https://www.isprambiente.gov.it/files/biodiversita/8Agricolturabiologica.pdf (accessed on 1 October 2024).
- PB, R.C. Bioreport 2021–2022. Agricoltura Biologica in Italia. 2023. Available online: https://www.reterurale.it/Bioreport2021_22 (accessed on 1 October 2024).
- Reganold, J.P.; Wachter, J.M. Organic agriculture in the twenty-first century. Nat. Plants 2016, 2, 15221. [Google Scholar] [CrossRef]
- Ponisio, L.C.; M’Gonigle, L.K.; Mace, K. Diversification practices reduce organic to conventional yield gap. Proc. R. Soc. B 2015, 282, 20141396. [Google Scholar] [CrossRef]
- Kamilaris, A.; Prenafeta-Boldú, F.X. Deep learning in agriculture: A survey. Comput. Electron. Agric. 2018, 147, 70–90. [Google Scholar] [CrossRef]
- Kumarappan, J.; Rajasekar, E.; Vairavasundaram, S.; Kotecha, K.; Kulkarni, A. Federated Learning Enhanced MLP–LSTM Modeling in an Integrated Deep Learning Pipeline for Stock Market Prediction. Int. J. Comput. Intell. Syst. 2024, 17, 267. [Google Scholar] [CrossRef]
- Kumarappan, J.; Rajasekar, E.; Vairavasundaram, S.; Kotecha, K.; Kulkarni, A. Siamese Graph Convolutional Split-Attention Network with NLP based Social Sentimental Data for enhanced stock price predictions. J. Big Data 2024, 11, 154. [Google Scholar] [CrossRef]
- Rajasekaran, S.; Kumar, A. Role of machine learning in organic agriculture: Challenges and opportunities. J. Agric. Sci. Technol. 2022, 24, 15–29. [Google Scholar]
- Barański, M.; Srednicka-Tober, D.; Volakakis, N.; Seal, C.; Sanderson, R.; Stewart, G.B.; Benbrook, C.; Biavati, B.; Markellou, E.; Giotis, C.; et al. Higher Antioxidant and Lower Cadmium Concentrations and Lower Incidence of Pesticide Residues in Organically Grown Crops: A Systematic Literature Review and Meta-Analyses. Br. J. Nutr. 2014, 112, 794–811. [Google Scholar] [CrossRef] [PubMed]
- Reynolds, P.; Hurley, S.E.; Goldberg, D.E.; Yerabati, S.; Gunier, R.B.; Hertz, A.; Anton-Culver, H.; Bernstein, L.; Deapen, D.; Horn-Ross, P.L.; et al. Residential Proximity to Agricultural Pesticide Use and Incidence of Breast Cancer in the California Teachers Study Cohort. Environ. Res. 2004, 113, 993–1000. [Google Scholar] [CrossRef]
- Provost, D.; Cantagrel, A.; Lebailly, P.; Jaffré, A.; Loyant, V.; Loiseau, H.; Vital, A.; Brochard, P.; Baldi, I. Brain Tumours and Exposure to Pesticides: A Case-Control Study in Southwestern France. Occup. Environ. Med. 2007, 64, 509–514. [Google Scholar] [CrossRef]
- Bradbury, K.E.; Balkwill, A.; Spencer, E.A.; Roddam, A.W.; Reeves, G.K.; Green, J.; Key, T.J.; Beral, V.; Pirie, K. Organic food consumption and the incidence of cancer in a large prospective study of women in the United Kingdom. Br. J. Cancer 2014, 110, 2321–2326. [Google Scholar] [CrossRef]
- Dimitri, G.M.; Spasov, S.; Duggento, A.; Passamonti, L.; Lió, P.; Toschi, N. Multimodal and multicontrast image fusion via deep generative models. Inf. Fusion 2022, 88, 146–160. [Google Scholar] [CrossRef]
- Li, J.; Izakian, H.; Pedrycz, W.; Jamal, I. Clustering-based anomaly detection in multivariate time series data. Appl. Soft Comput. 2021, 100, 106919. [Google Scholar] [CrossRef]
- Jain, A.K.; Murty, M.N.; Flynn, P.J. Data clustering: A review. ACM Comput. Surv. 1999, 31, 264–323. [Google Scholar] [CrossRef]
- Rajasekar, E.; Chandra, H.; Pears, N.; Vairavasundaram, S.; Kotecha, K. Lung image quality assessment and diagnosis using generative autoencoders in unsupervised ensemble learning. Biomed. Signal Process. Control 2025, 102, 107268. [Google Scholar] [CrossRef]
- Vitanza, E.; Dimitri, G.M.; Mocenni, C. A multi-modal machine learning approach to detect extreme rainfall events in Sicily. Sci. Rep. 2023, 13, 6196. [Google Scholar] [CrossRef]
- Hametner, M.; Kostetckaia, M.; Patki, P.; Best, A.; Bueb, B.; Knoblauch, D.; Landgrebe, R.; Scholl, L.; Stein, U.; Velten, E.K.; et al. Sustainable Development in the European Union: Monitoring Report on Progress Towards the SDGs in an EU Context; WU Vienna and Ecologic Institute: Vienna, Austria, 2023. [Google Scholar]
- Zhang, K.; Gu, X. An Affinity Propagation Clustering Algorithm for Mixed Numeric and Categorical Datasets. Math. Probl. Eng. 2014, 2014, 486075. [Google Scholar] [CrossRef]
- Azevedo, T.; Dimitri, G.M.; Liò, P.; Gamazon, E.R. Multilayer modelling of the human transcriptome and biological mechanisms of complex diseases and traits. NPJ Syst. Biol. Appl. 2021, 7, 24. [Google Scholar] [CrossRef] [PubMed]
- Hristova, D.; Rutherford, A.; Anson, J.; Luengo-Oroz, M.; Mascolo, C. The International Postal Network and Other Global Flows as Proxies for National Wellbeing. PLoS ONE 2016, 11, e0155976. [Google Scholar] [CrossRef]
- Menichetti, G.; Remondini, D.; Bianconi, G. Correlations between weights and overlap in ensembles of weighted multiplex networks. Phys. Rev. E 2014, 90, 062817. [Google Scholar] [CrossRef]
- De Domenico, M.; Nicosia, V.; Arenas, A.; Latora, V. Structural reducibility of multilayer networks. Nat. Commun. 2015, 6, 6864. [Google Scholar] [CrossRef]
- De Domenico, M.; Solé-Ribalta, A.; Omodei, E.; Gómez, S.; Arenas, A. Ranking in interconnected multilayer networks reveals versatile nodes. Nat. Commun. 2015, 6, 6868. [Google Scholar] [CrossRef]
- Nicosia, V.; Latora, V. Measuring and modeling correlations in multiplex networks. Phys. Rev. E 2015, 92, 032805. [Google Scholar] [CrossRef] [PubMed]
- Dimitri, G.M.; Trambusti, A. Precision agriculture for wine production: A machine learning approach to link weather conditions and wine quality. Heliyon 2024, 10, e31648. [Google Scholar] [CrossRef] [PubMed]
- Miconi, F.; Dimitri, G.M. A machine learning approach to analyse and predict the electric cars scenario: The Italian case. PLoS ONE 2023, 18, e0279040. [Google Scholar] [CrossRef] [PubMed]
- Jose, H.; Kuriakose, V. Emotional or Logical: Reason for Consumers to Buy Organic Food Products. Br. Food J. 2021, 123, 3999–4016. [Google Scholar] [CrossRef]
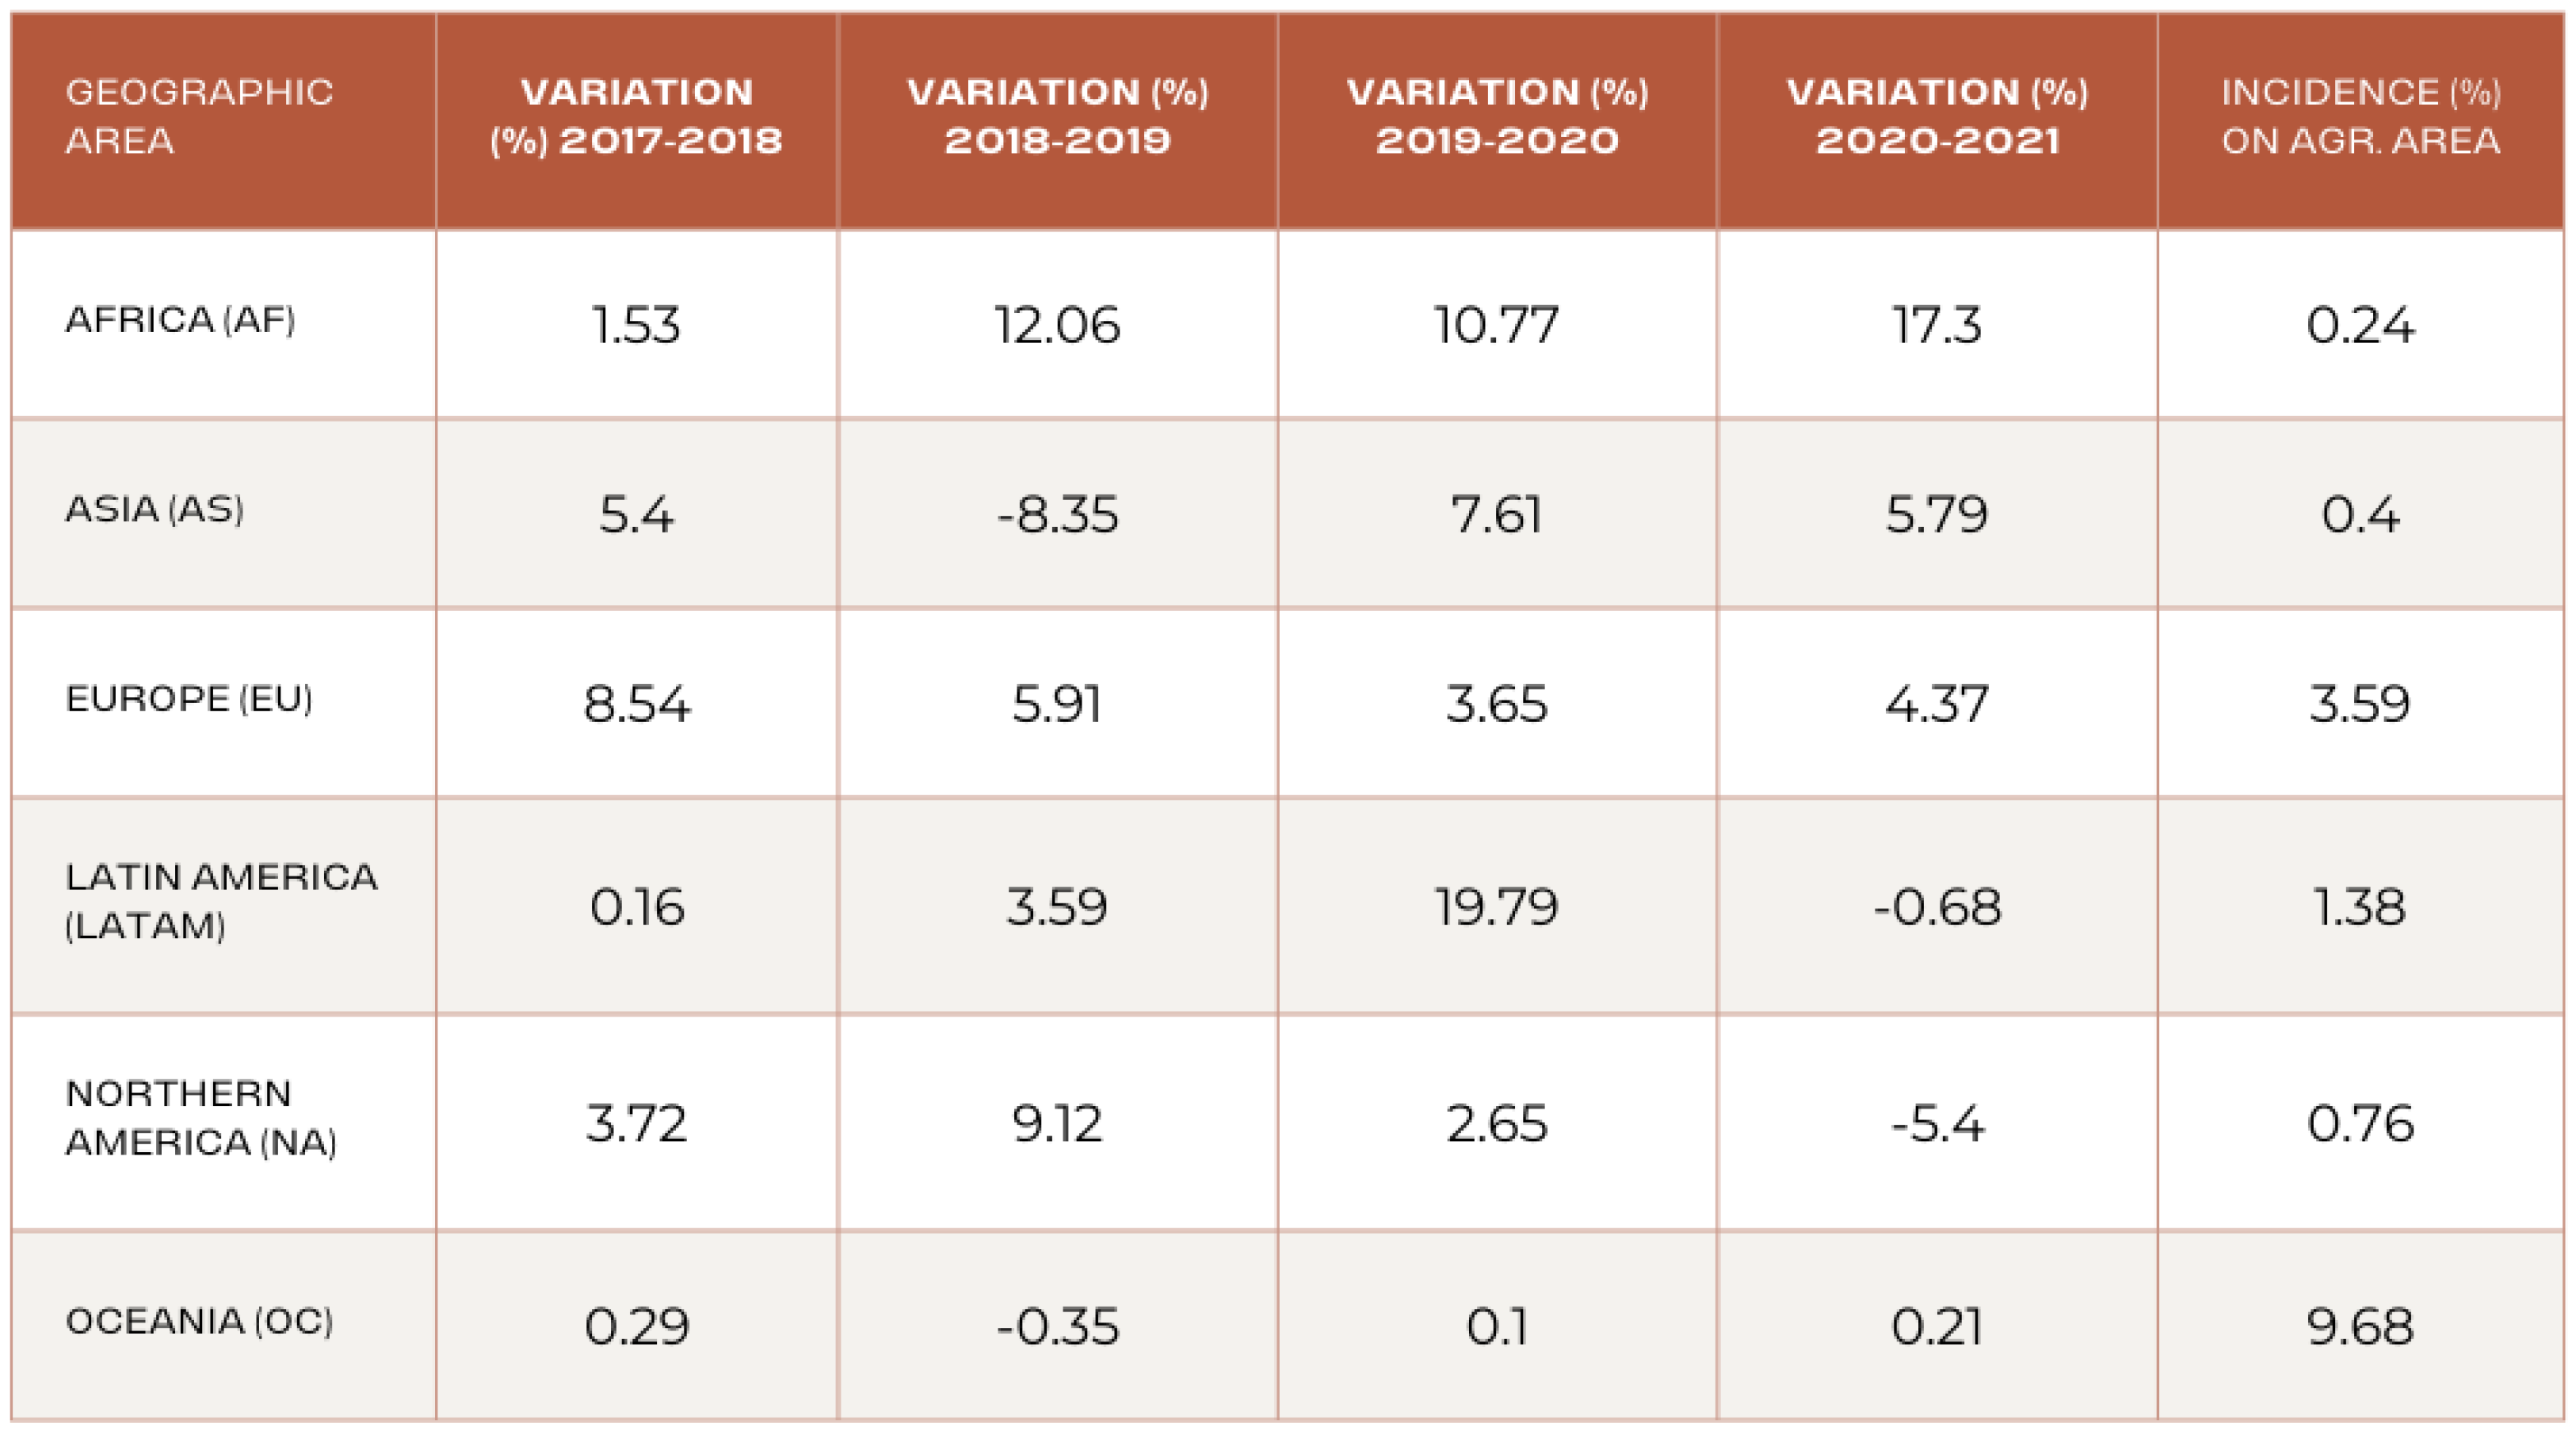
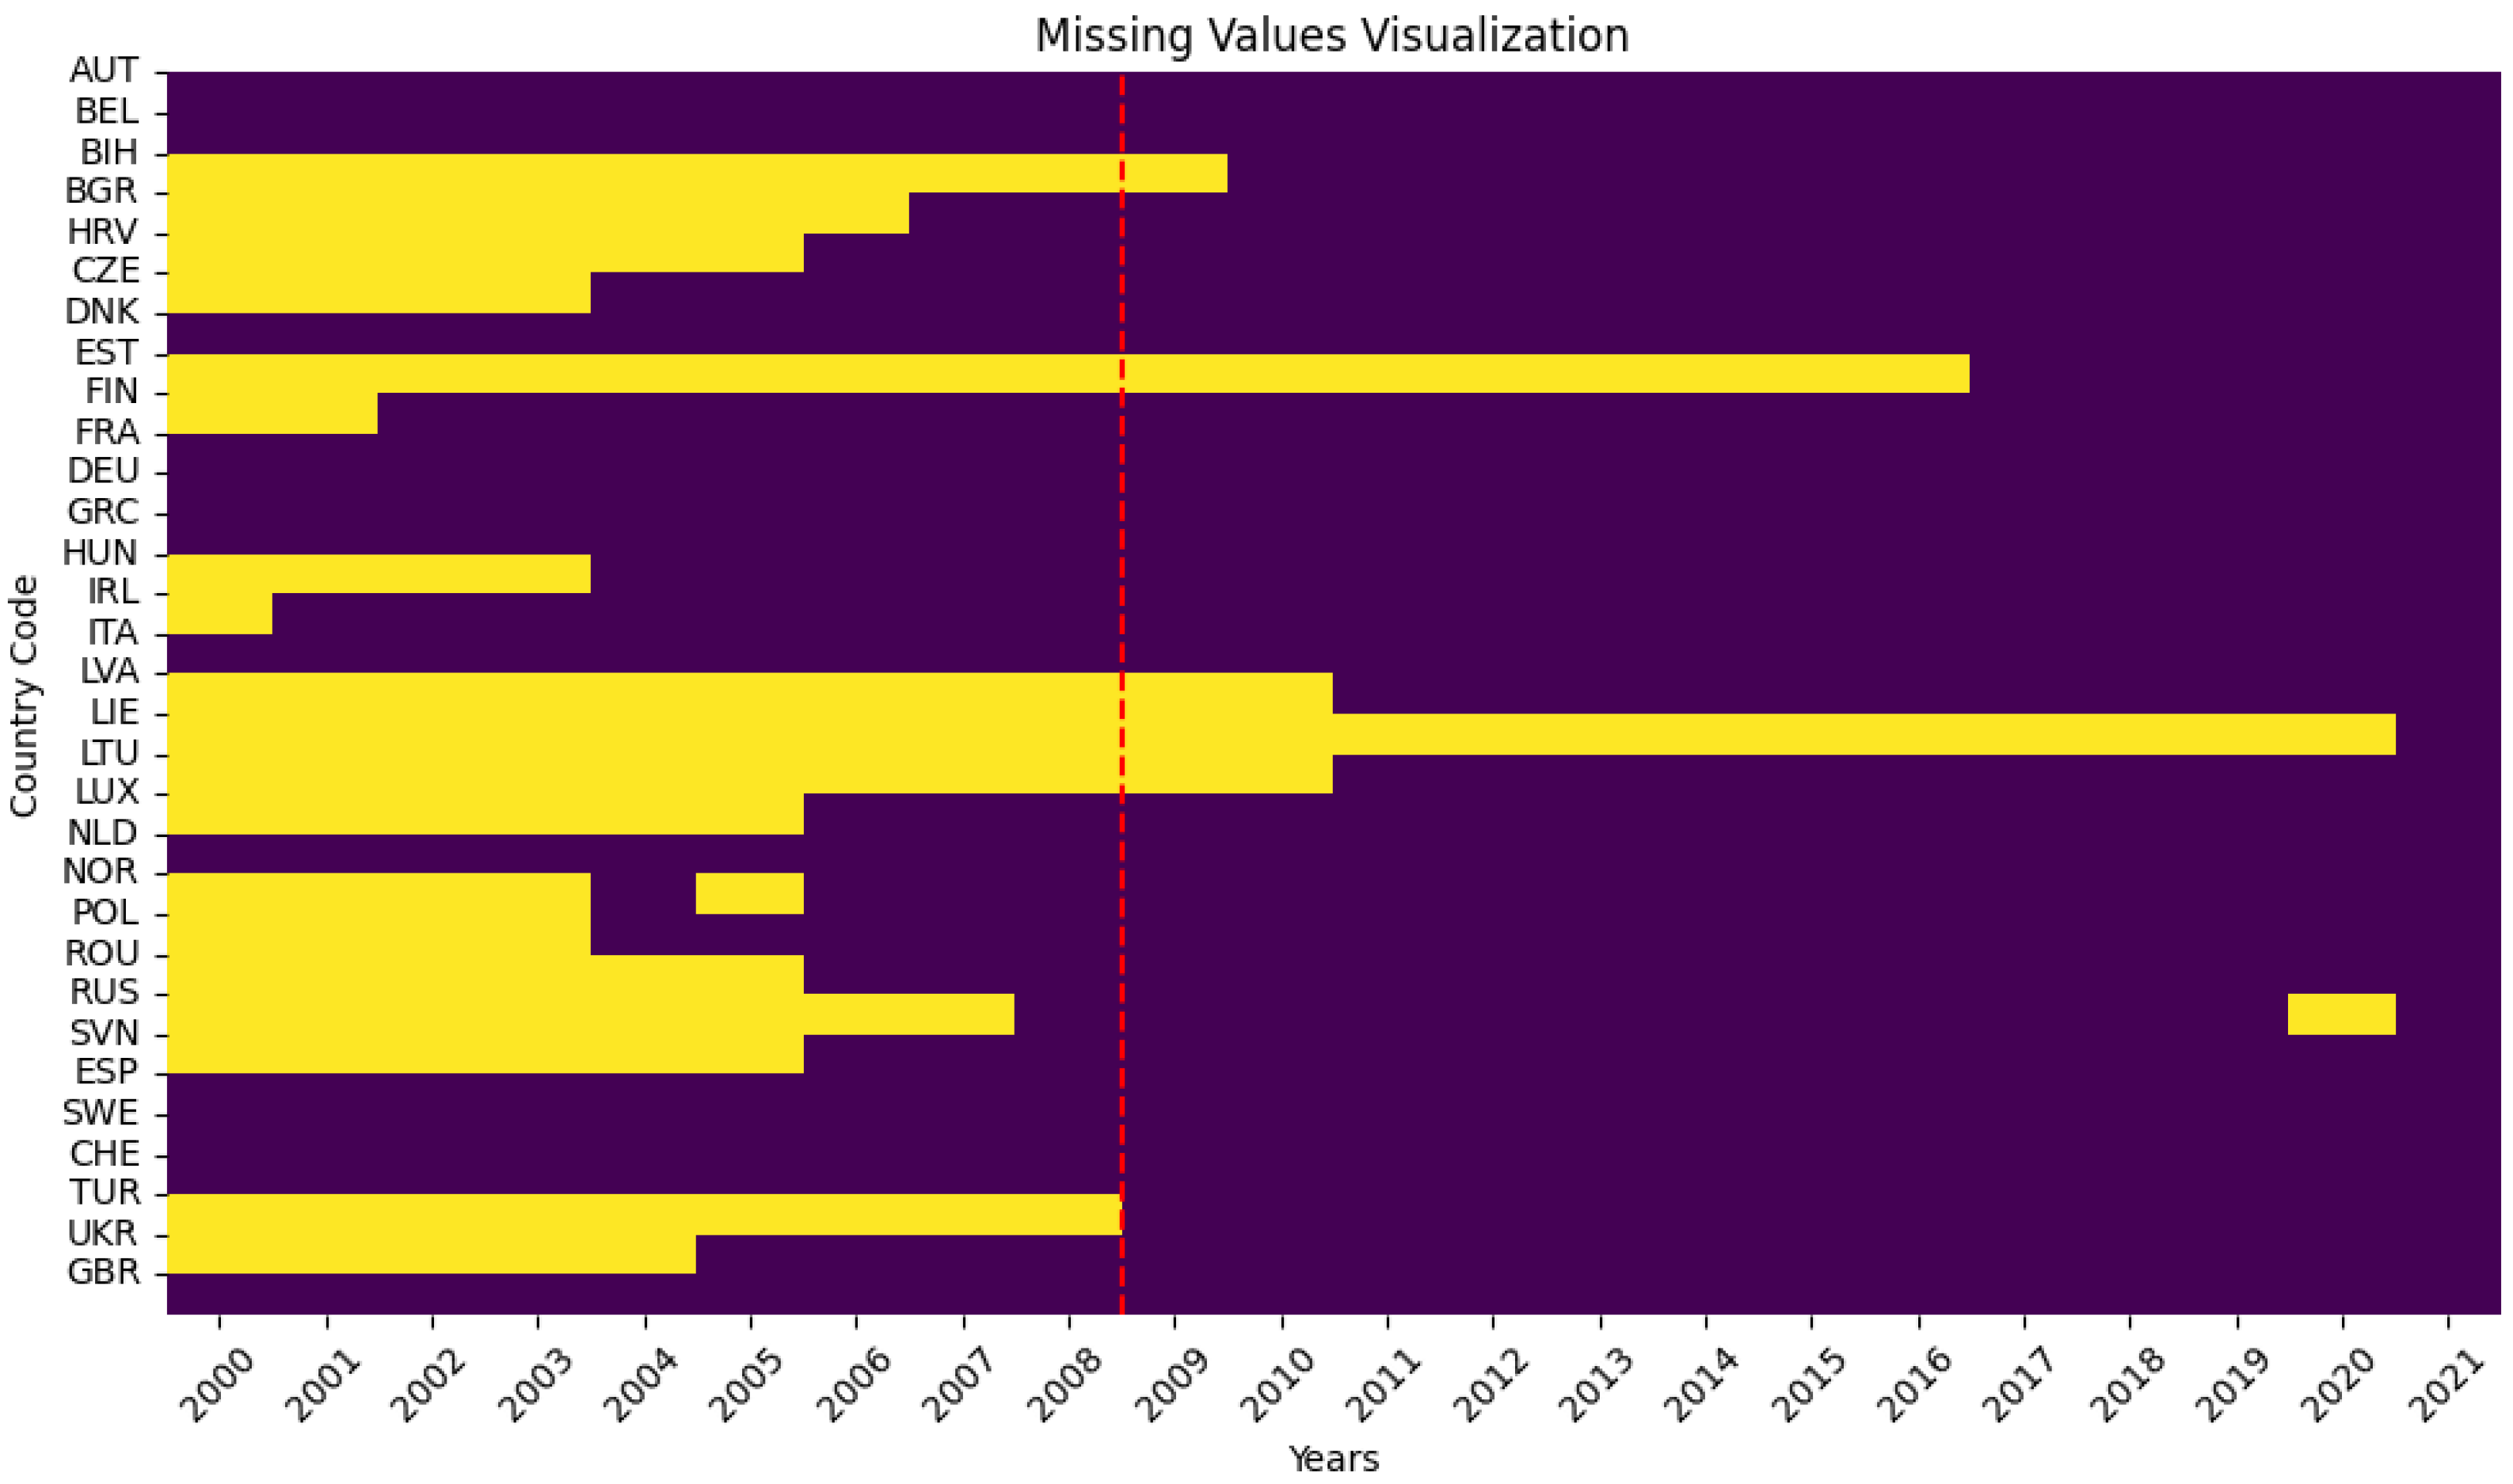
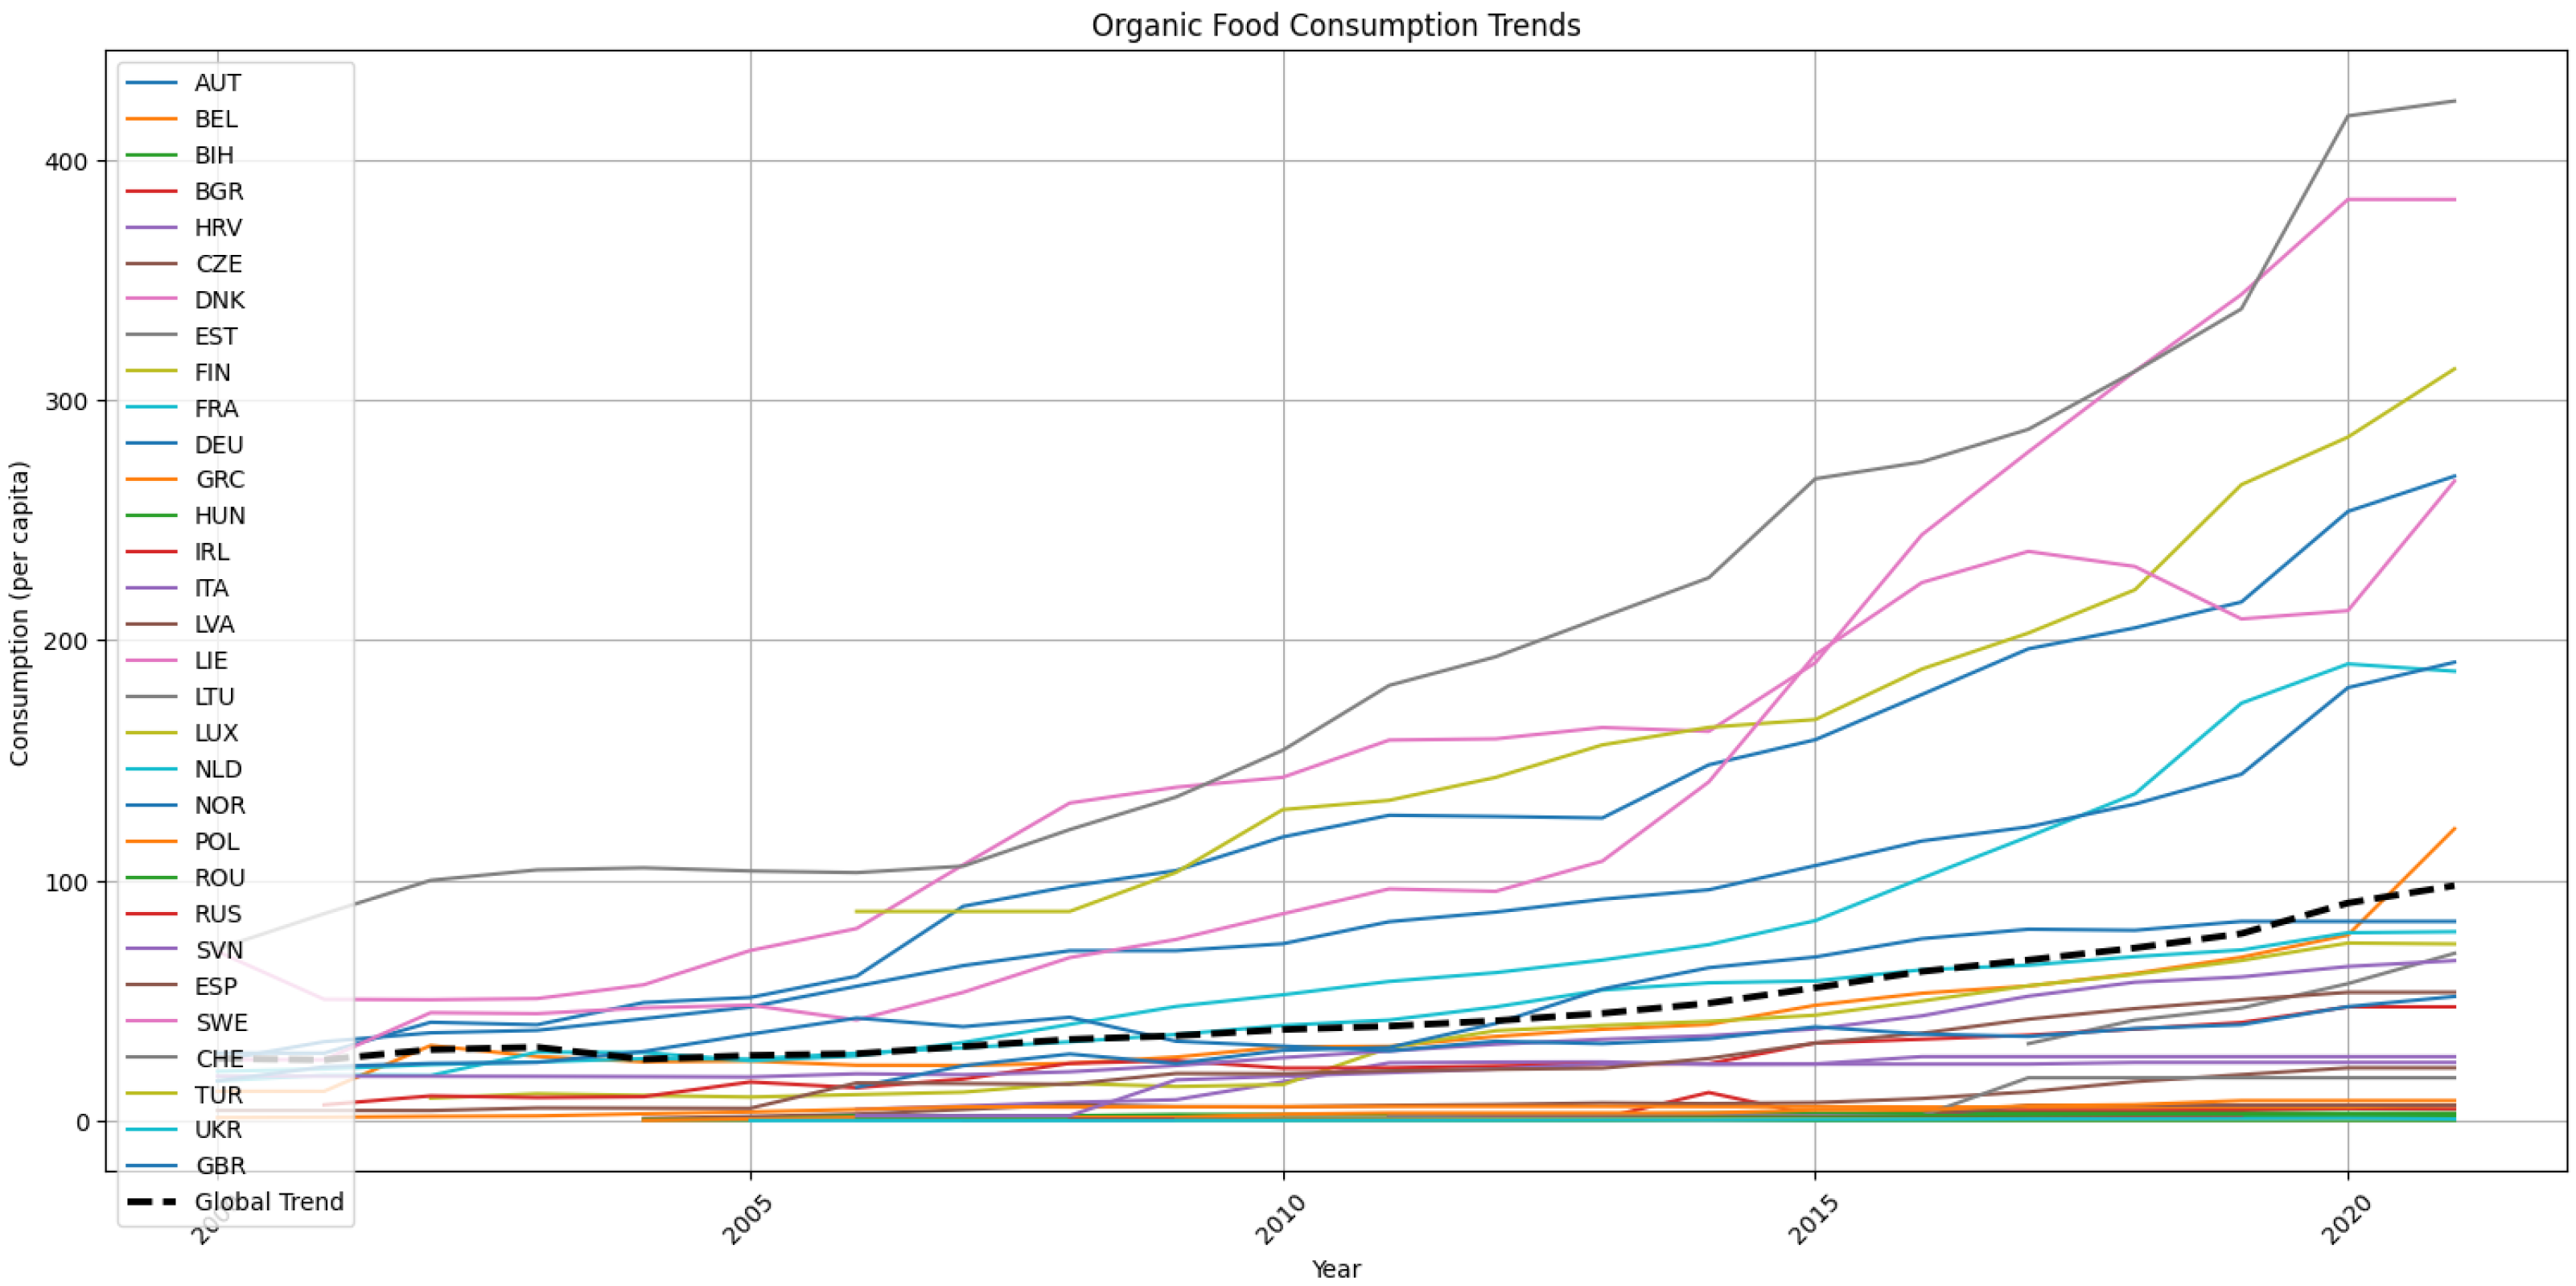
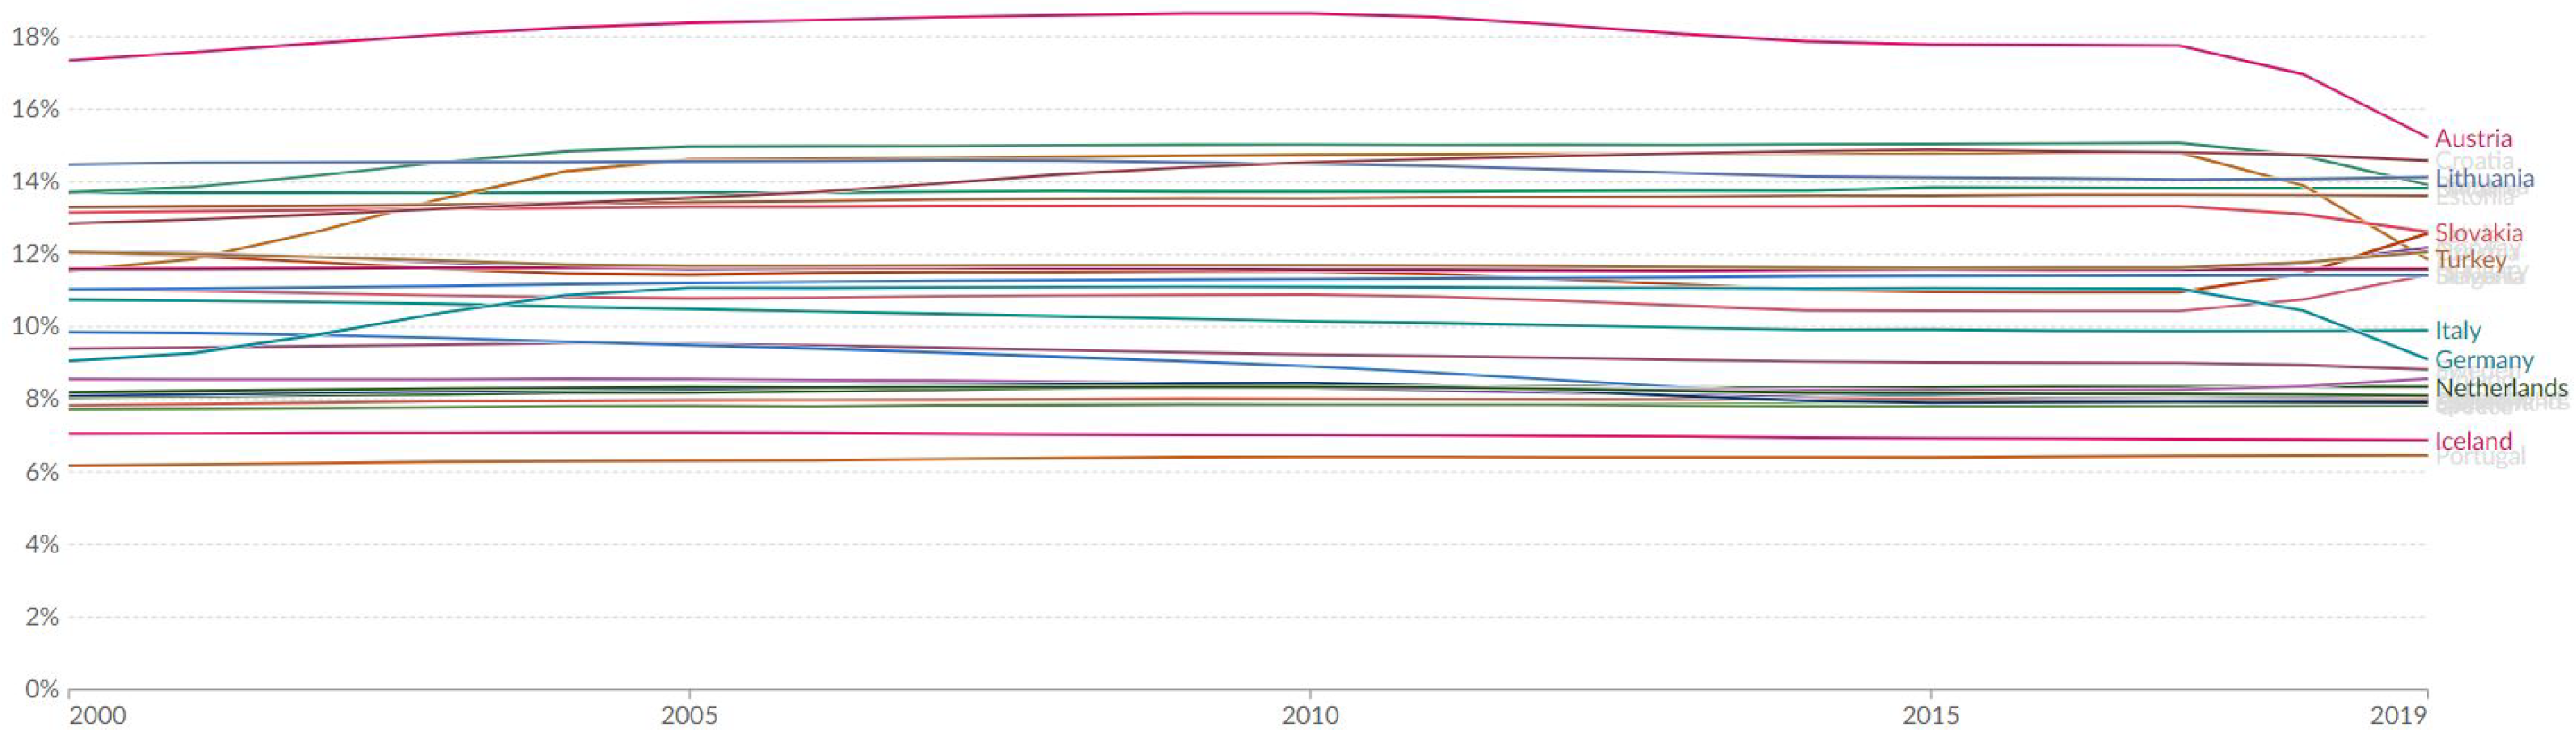
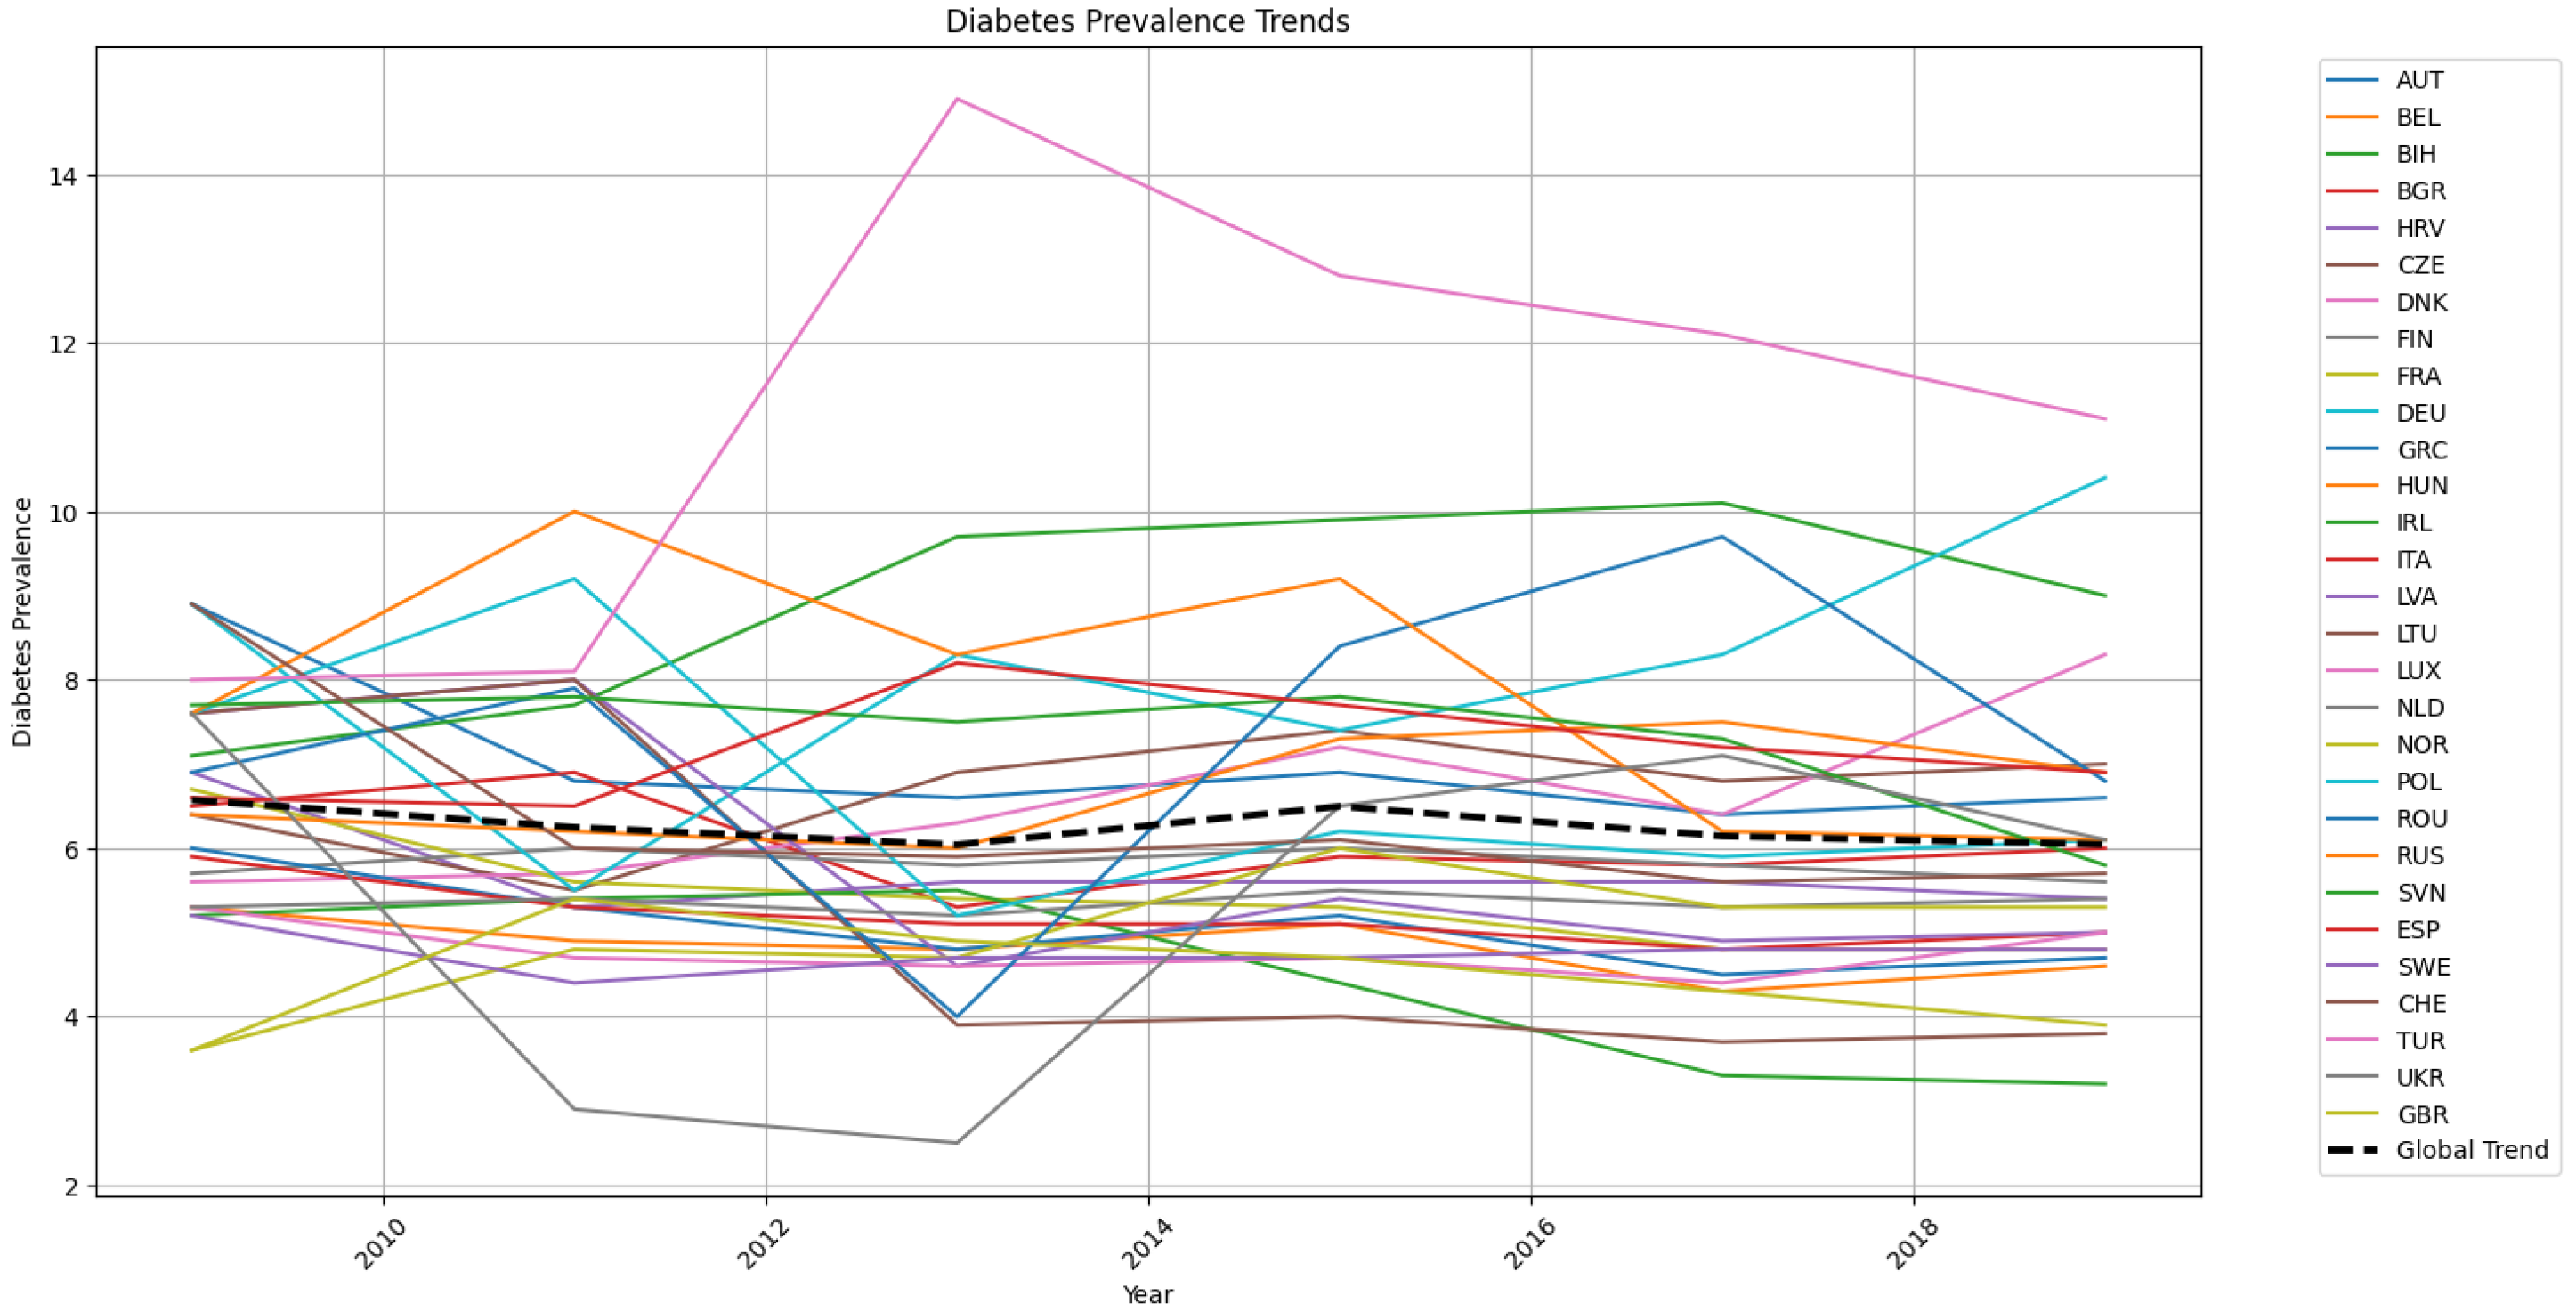
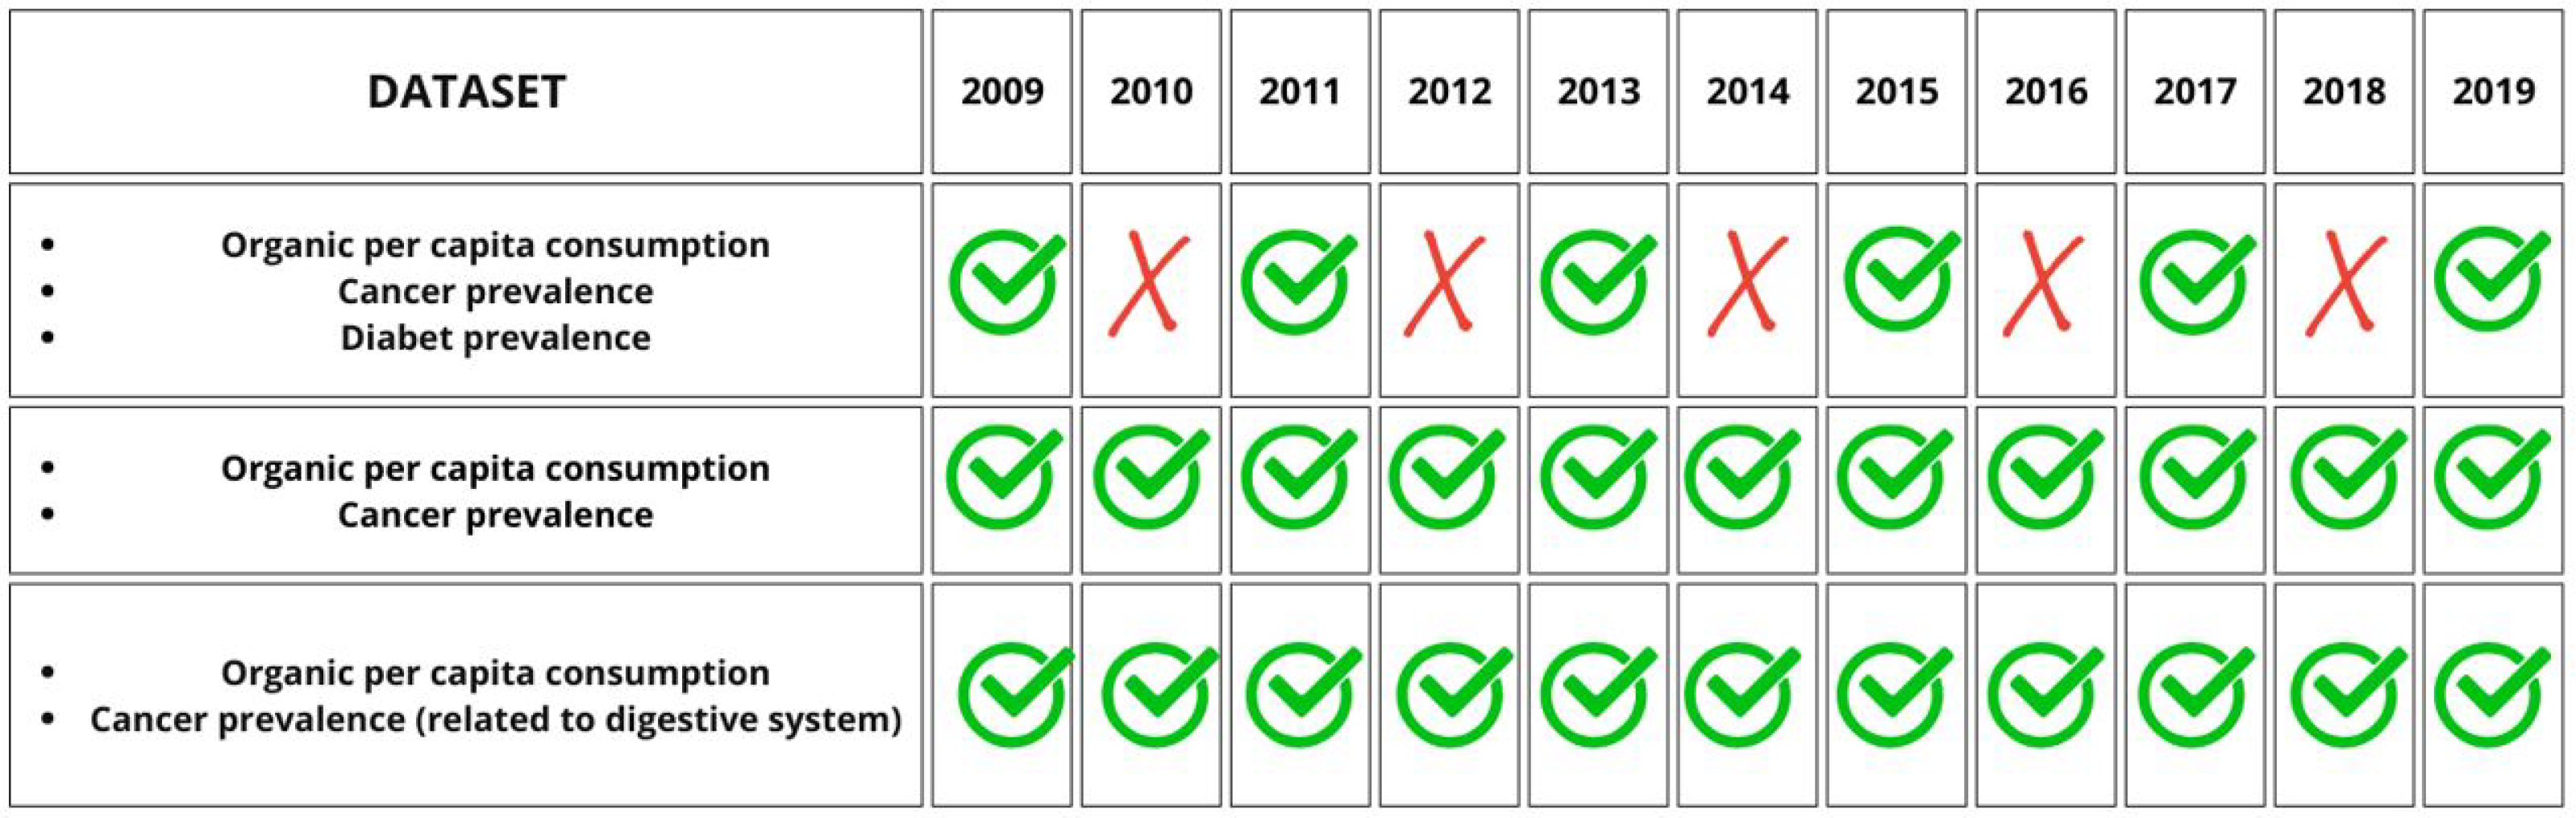
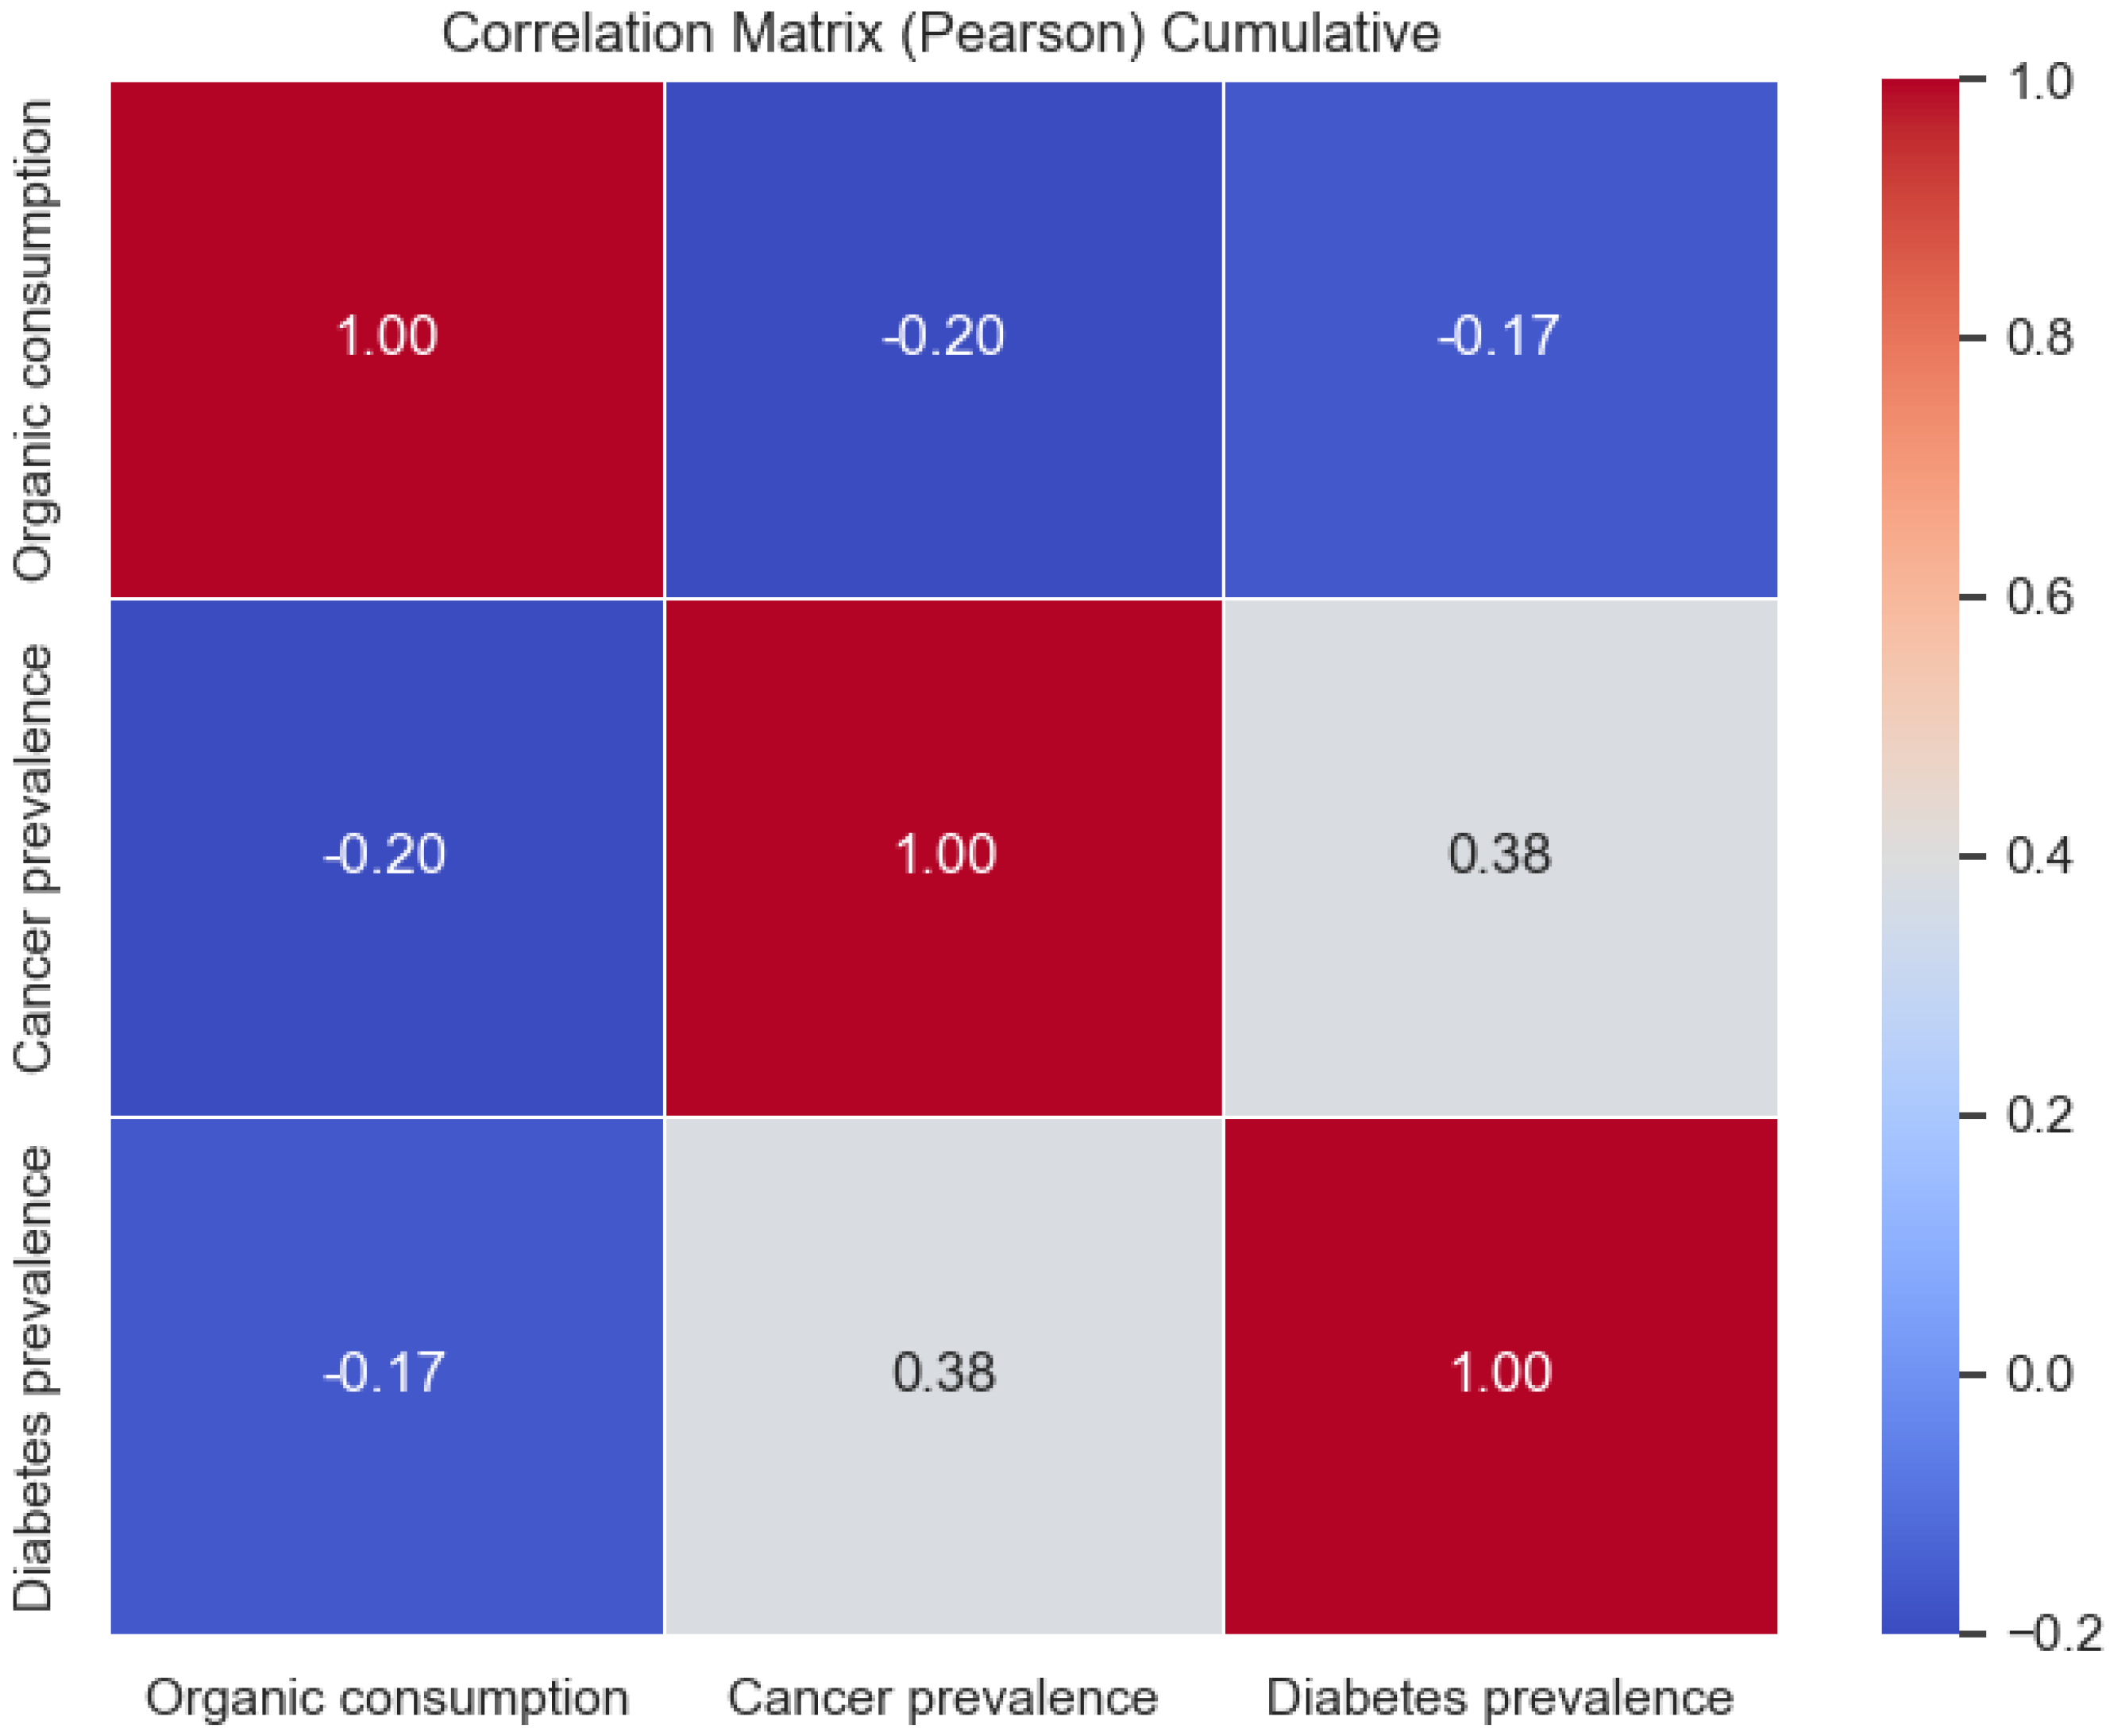

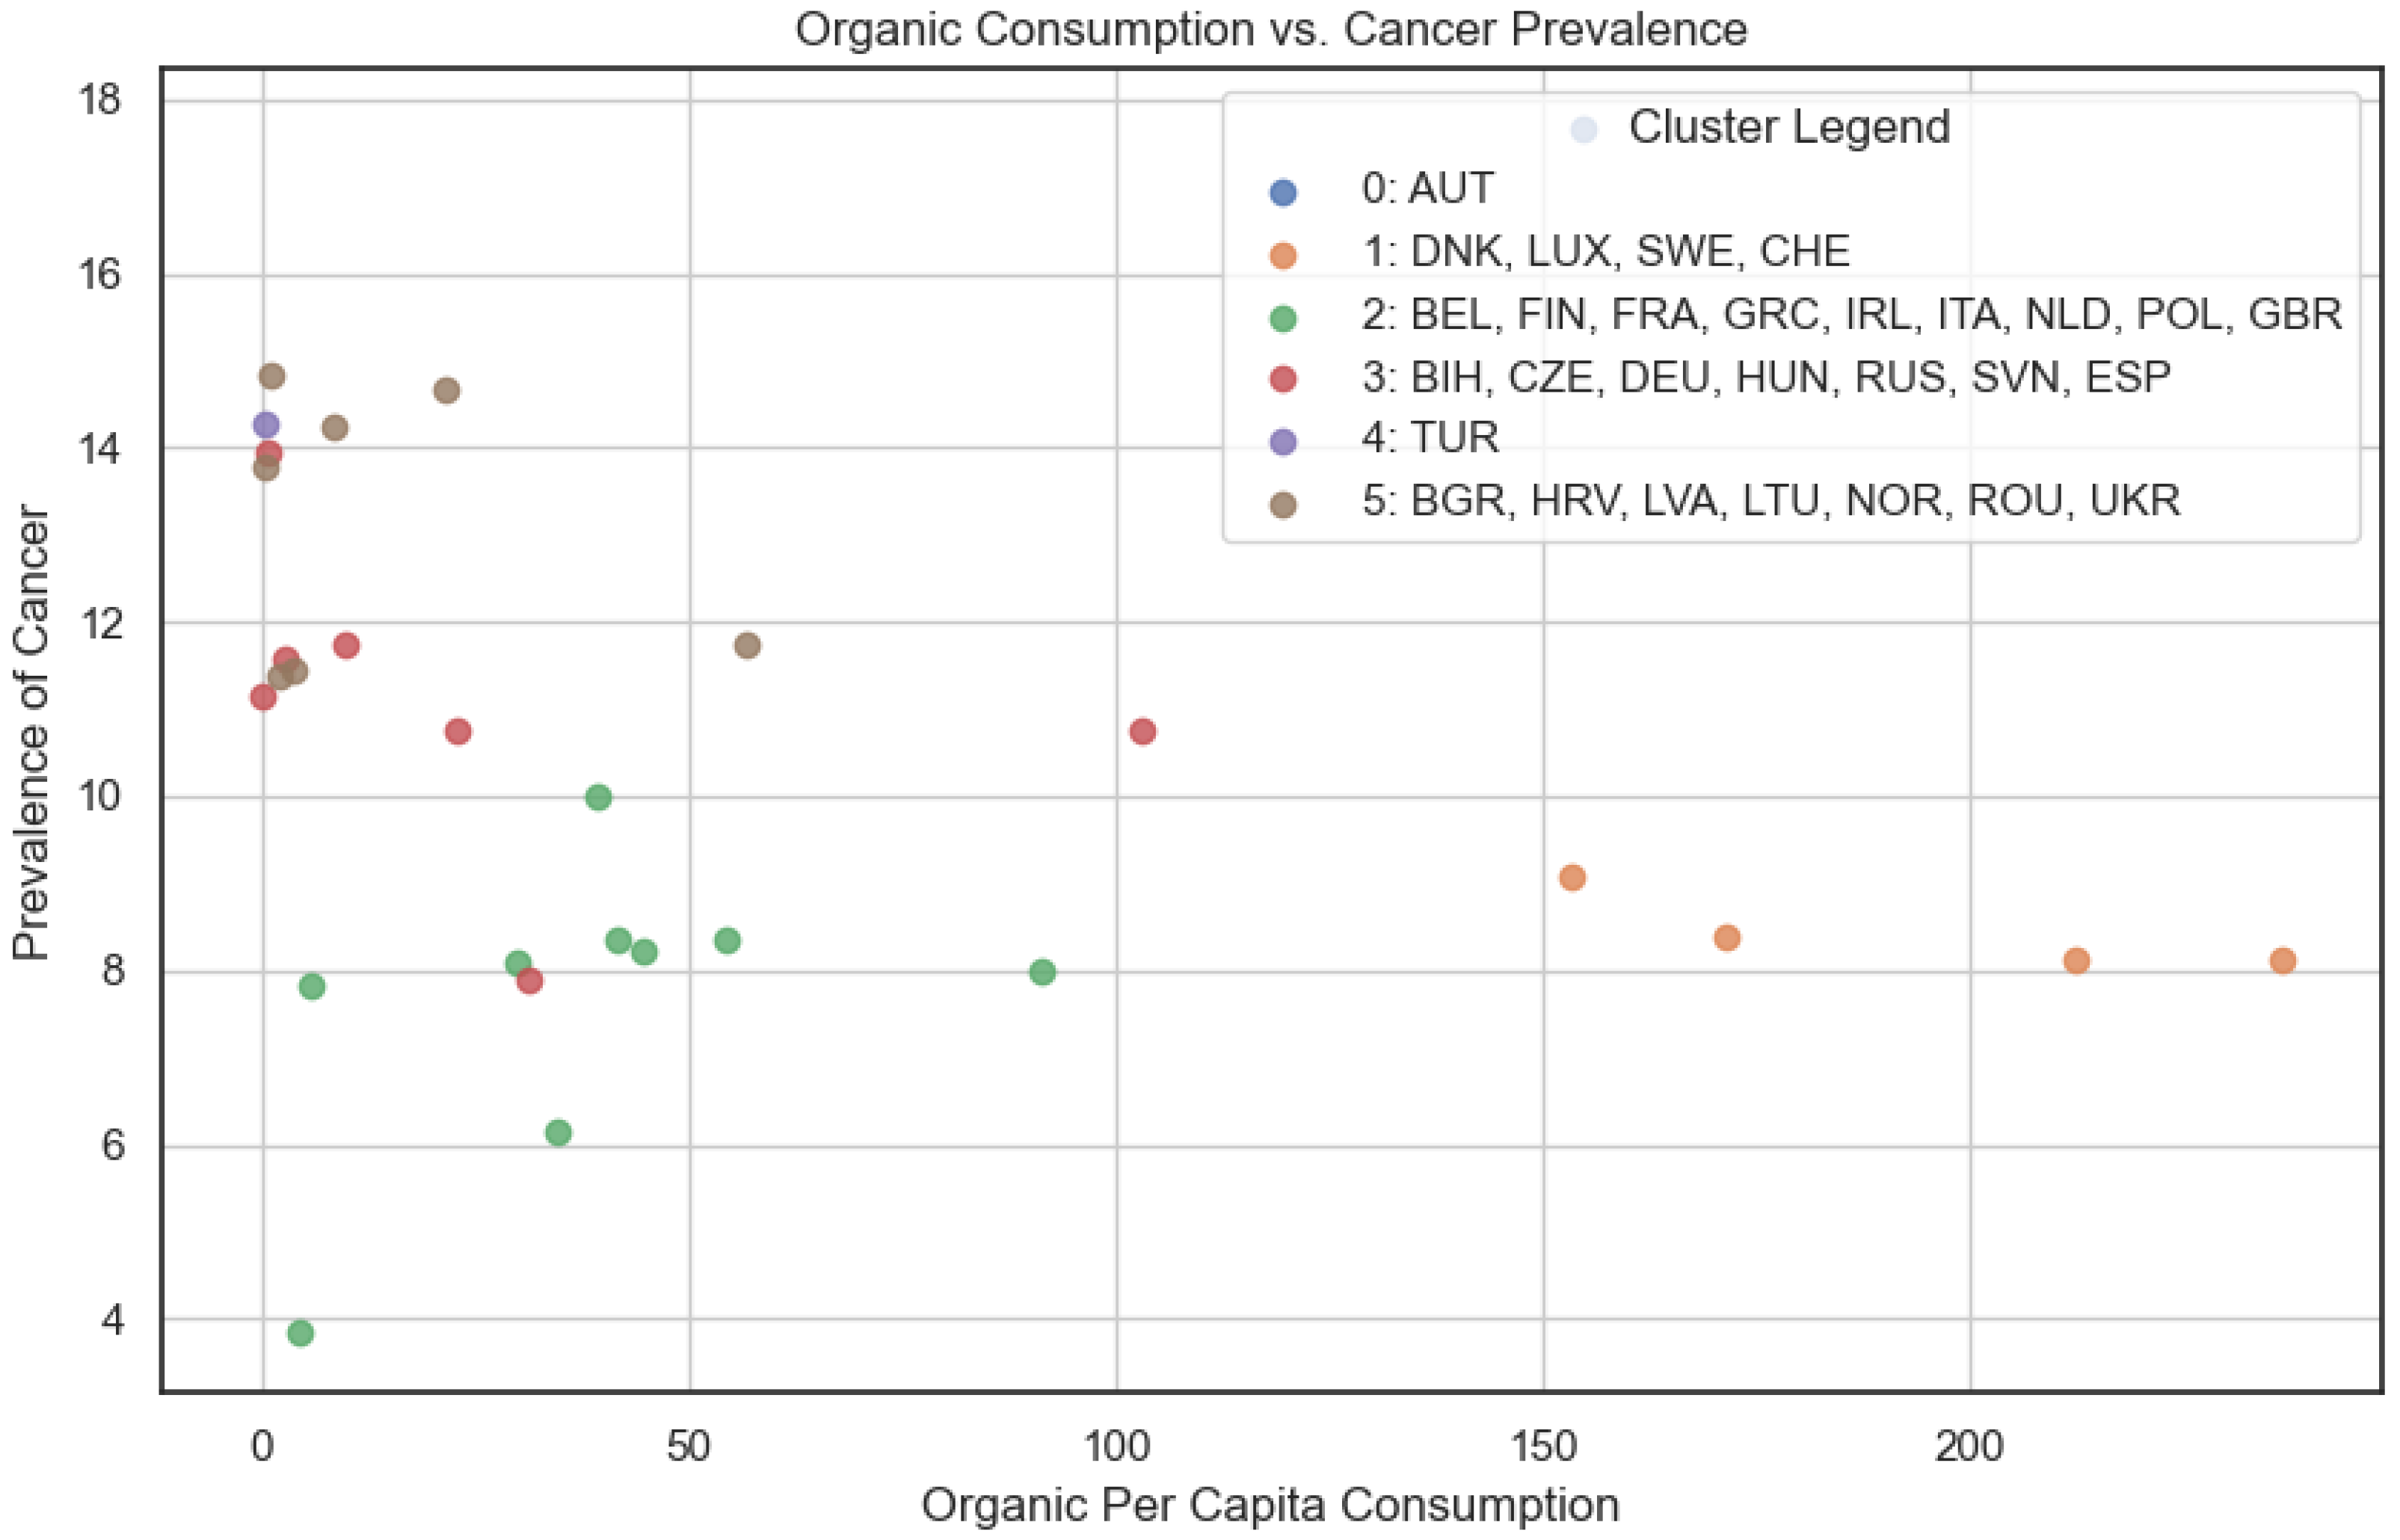
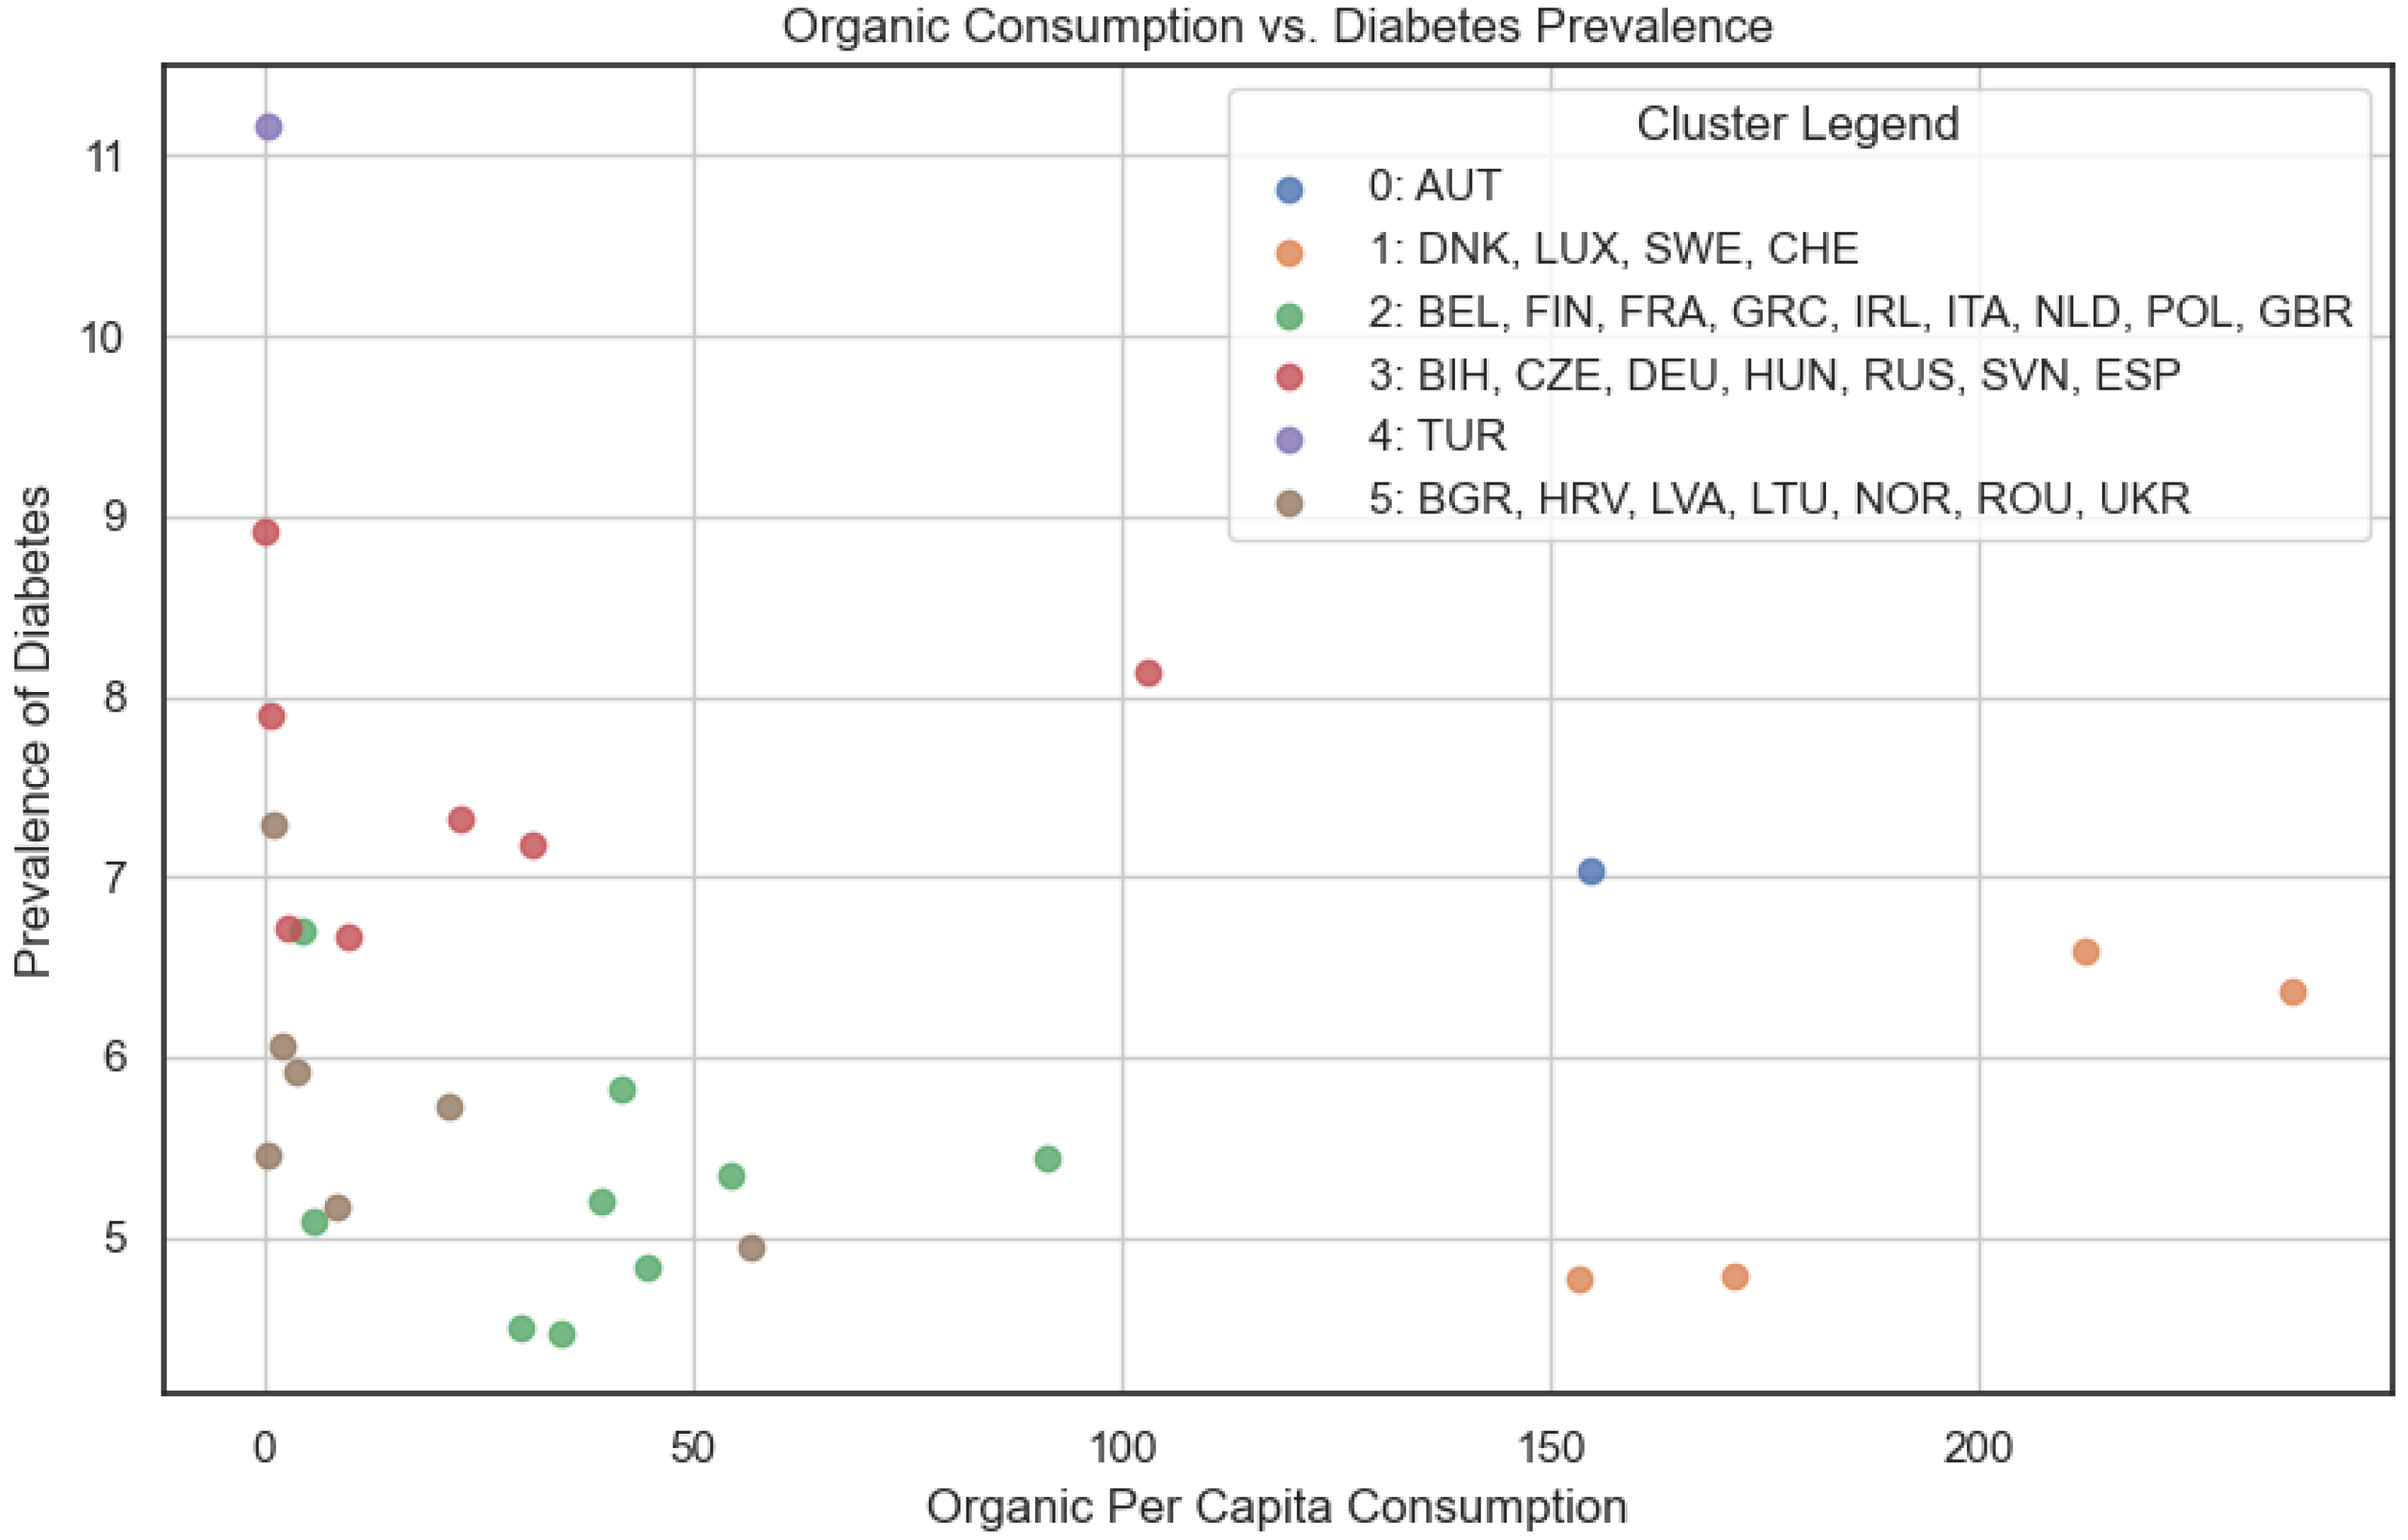
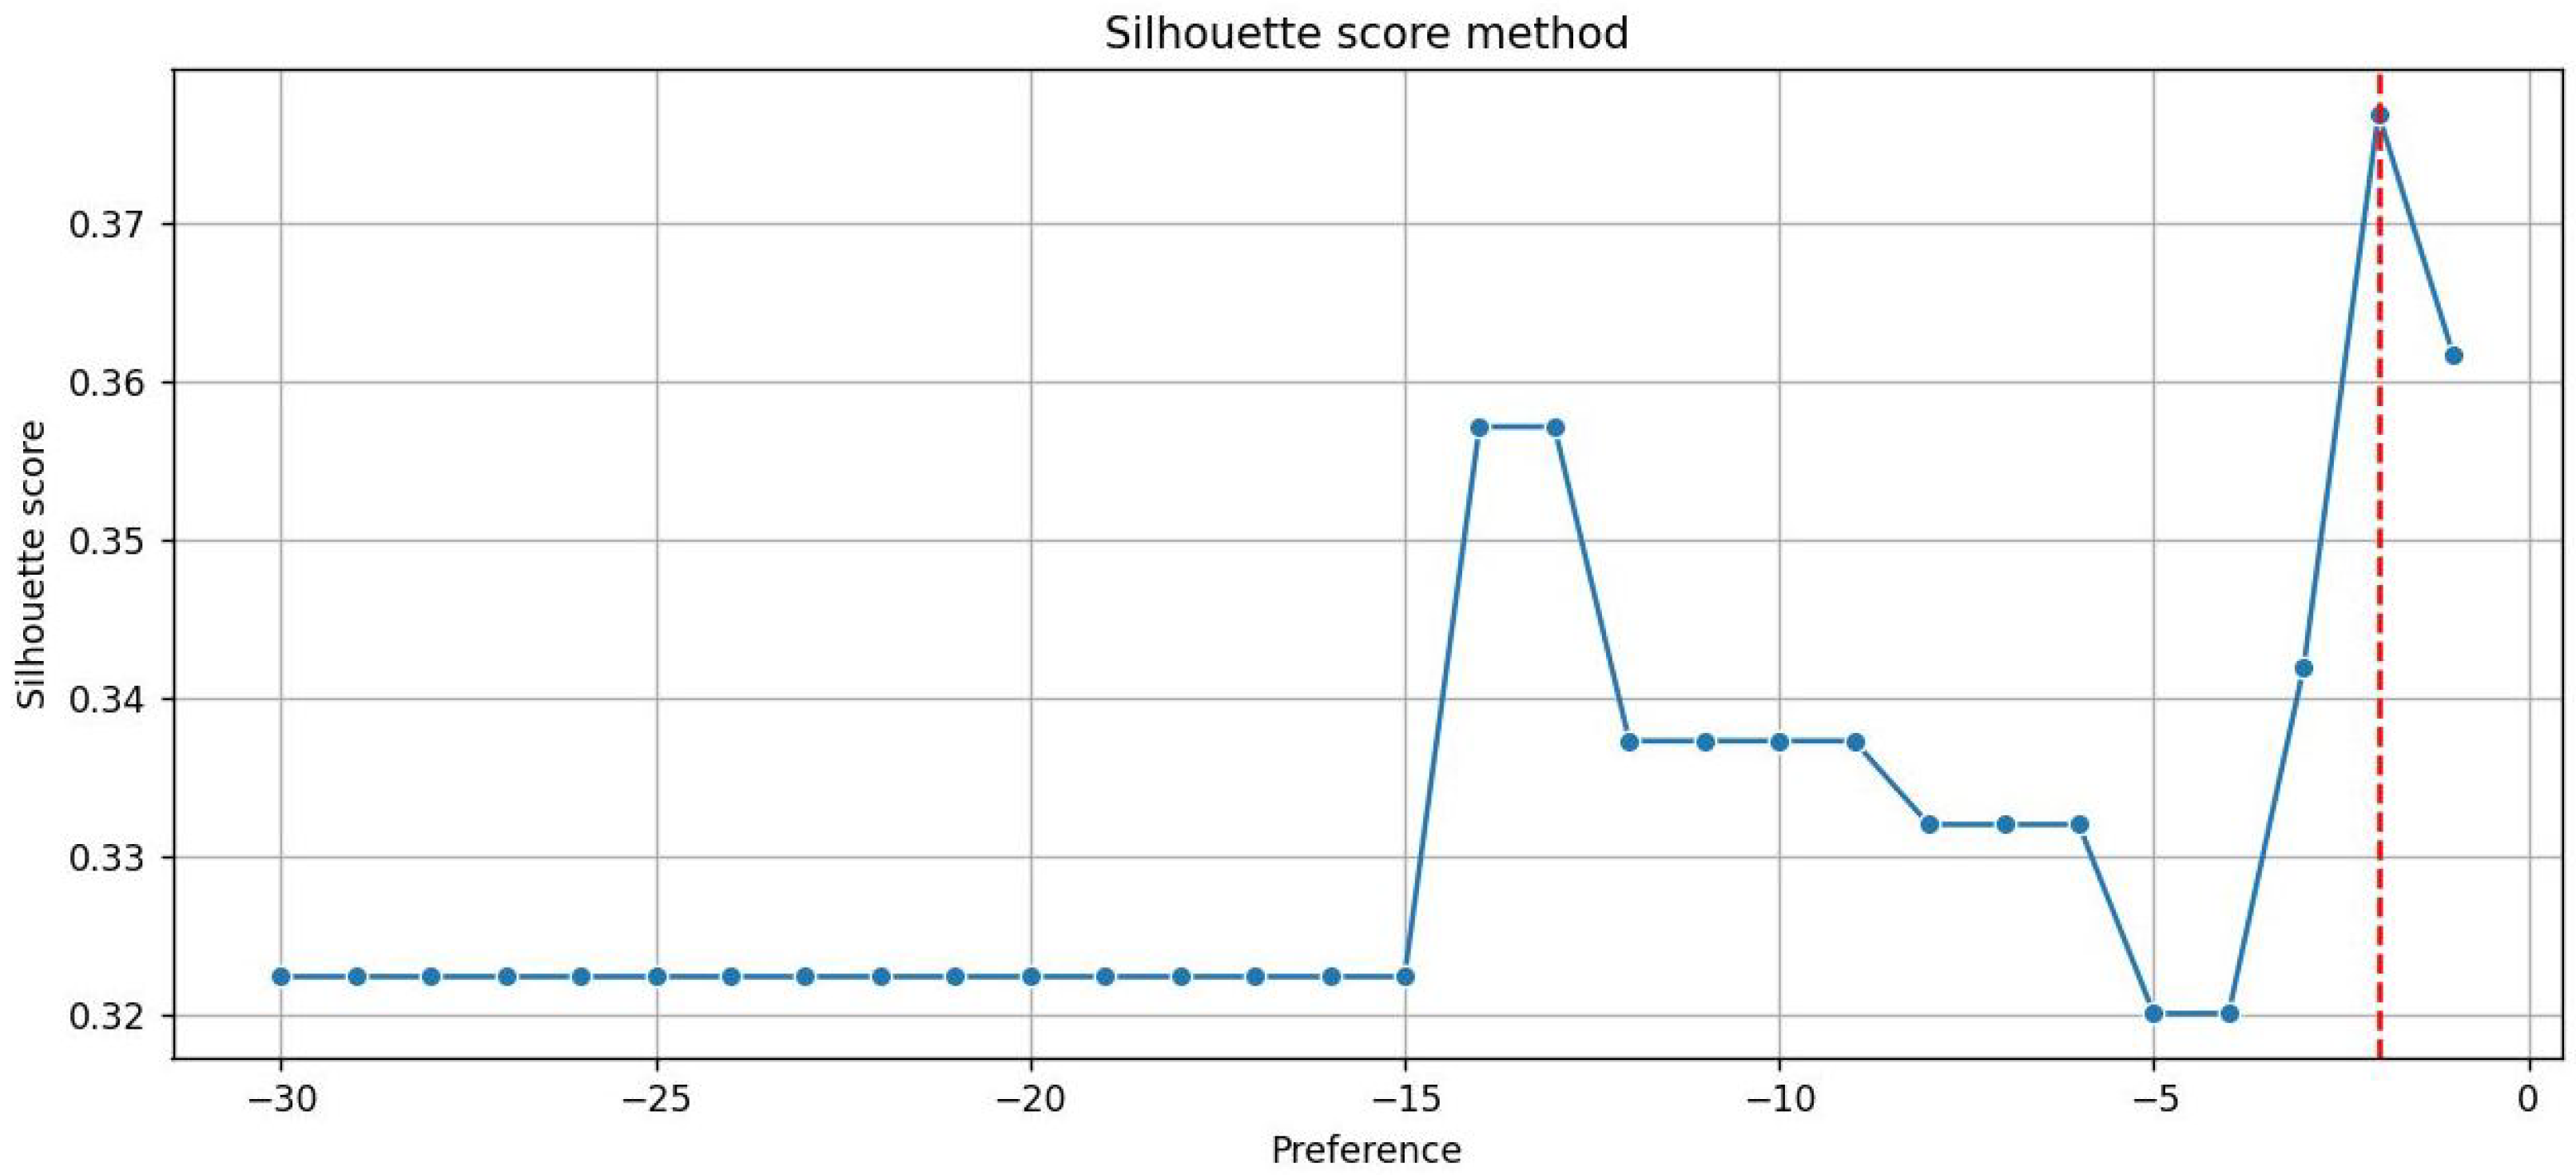
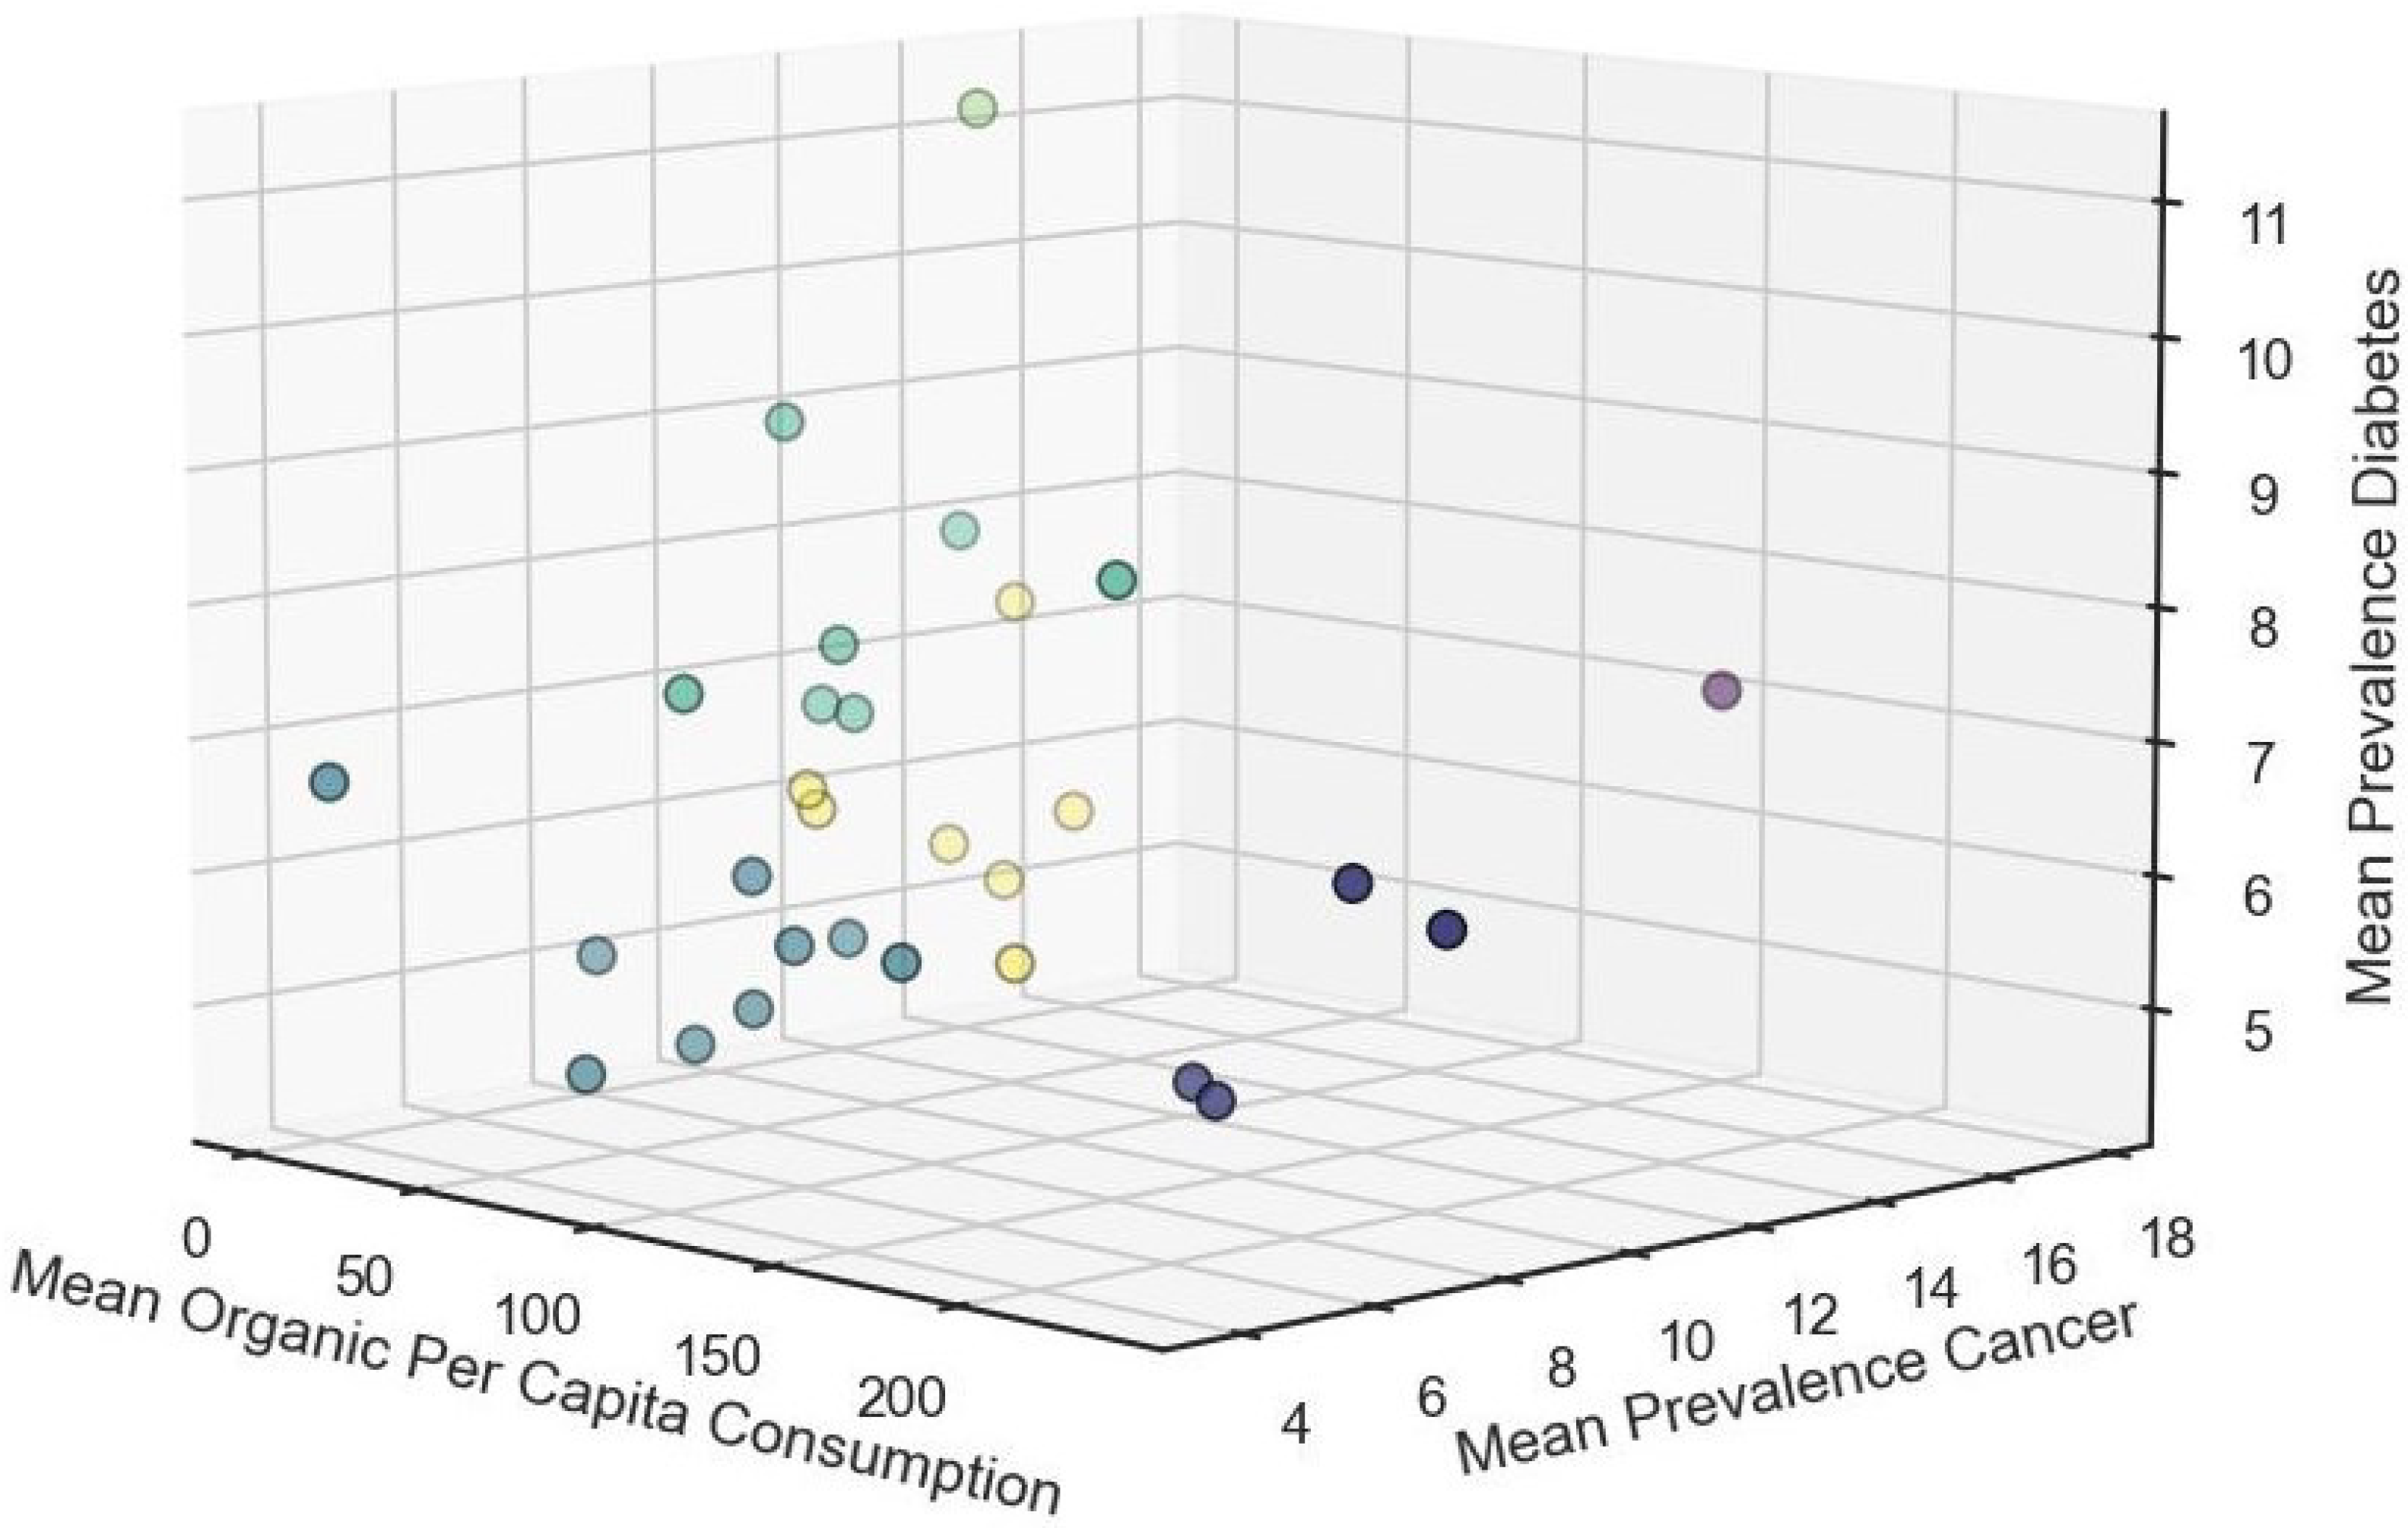

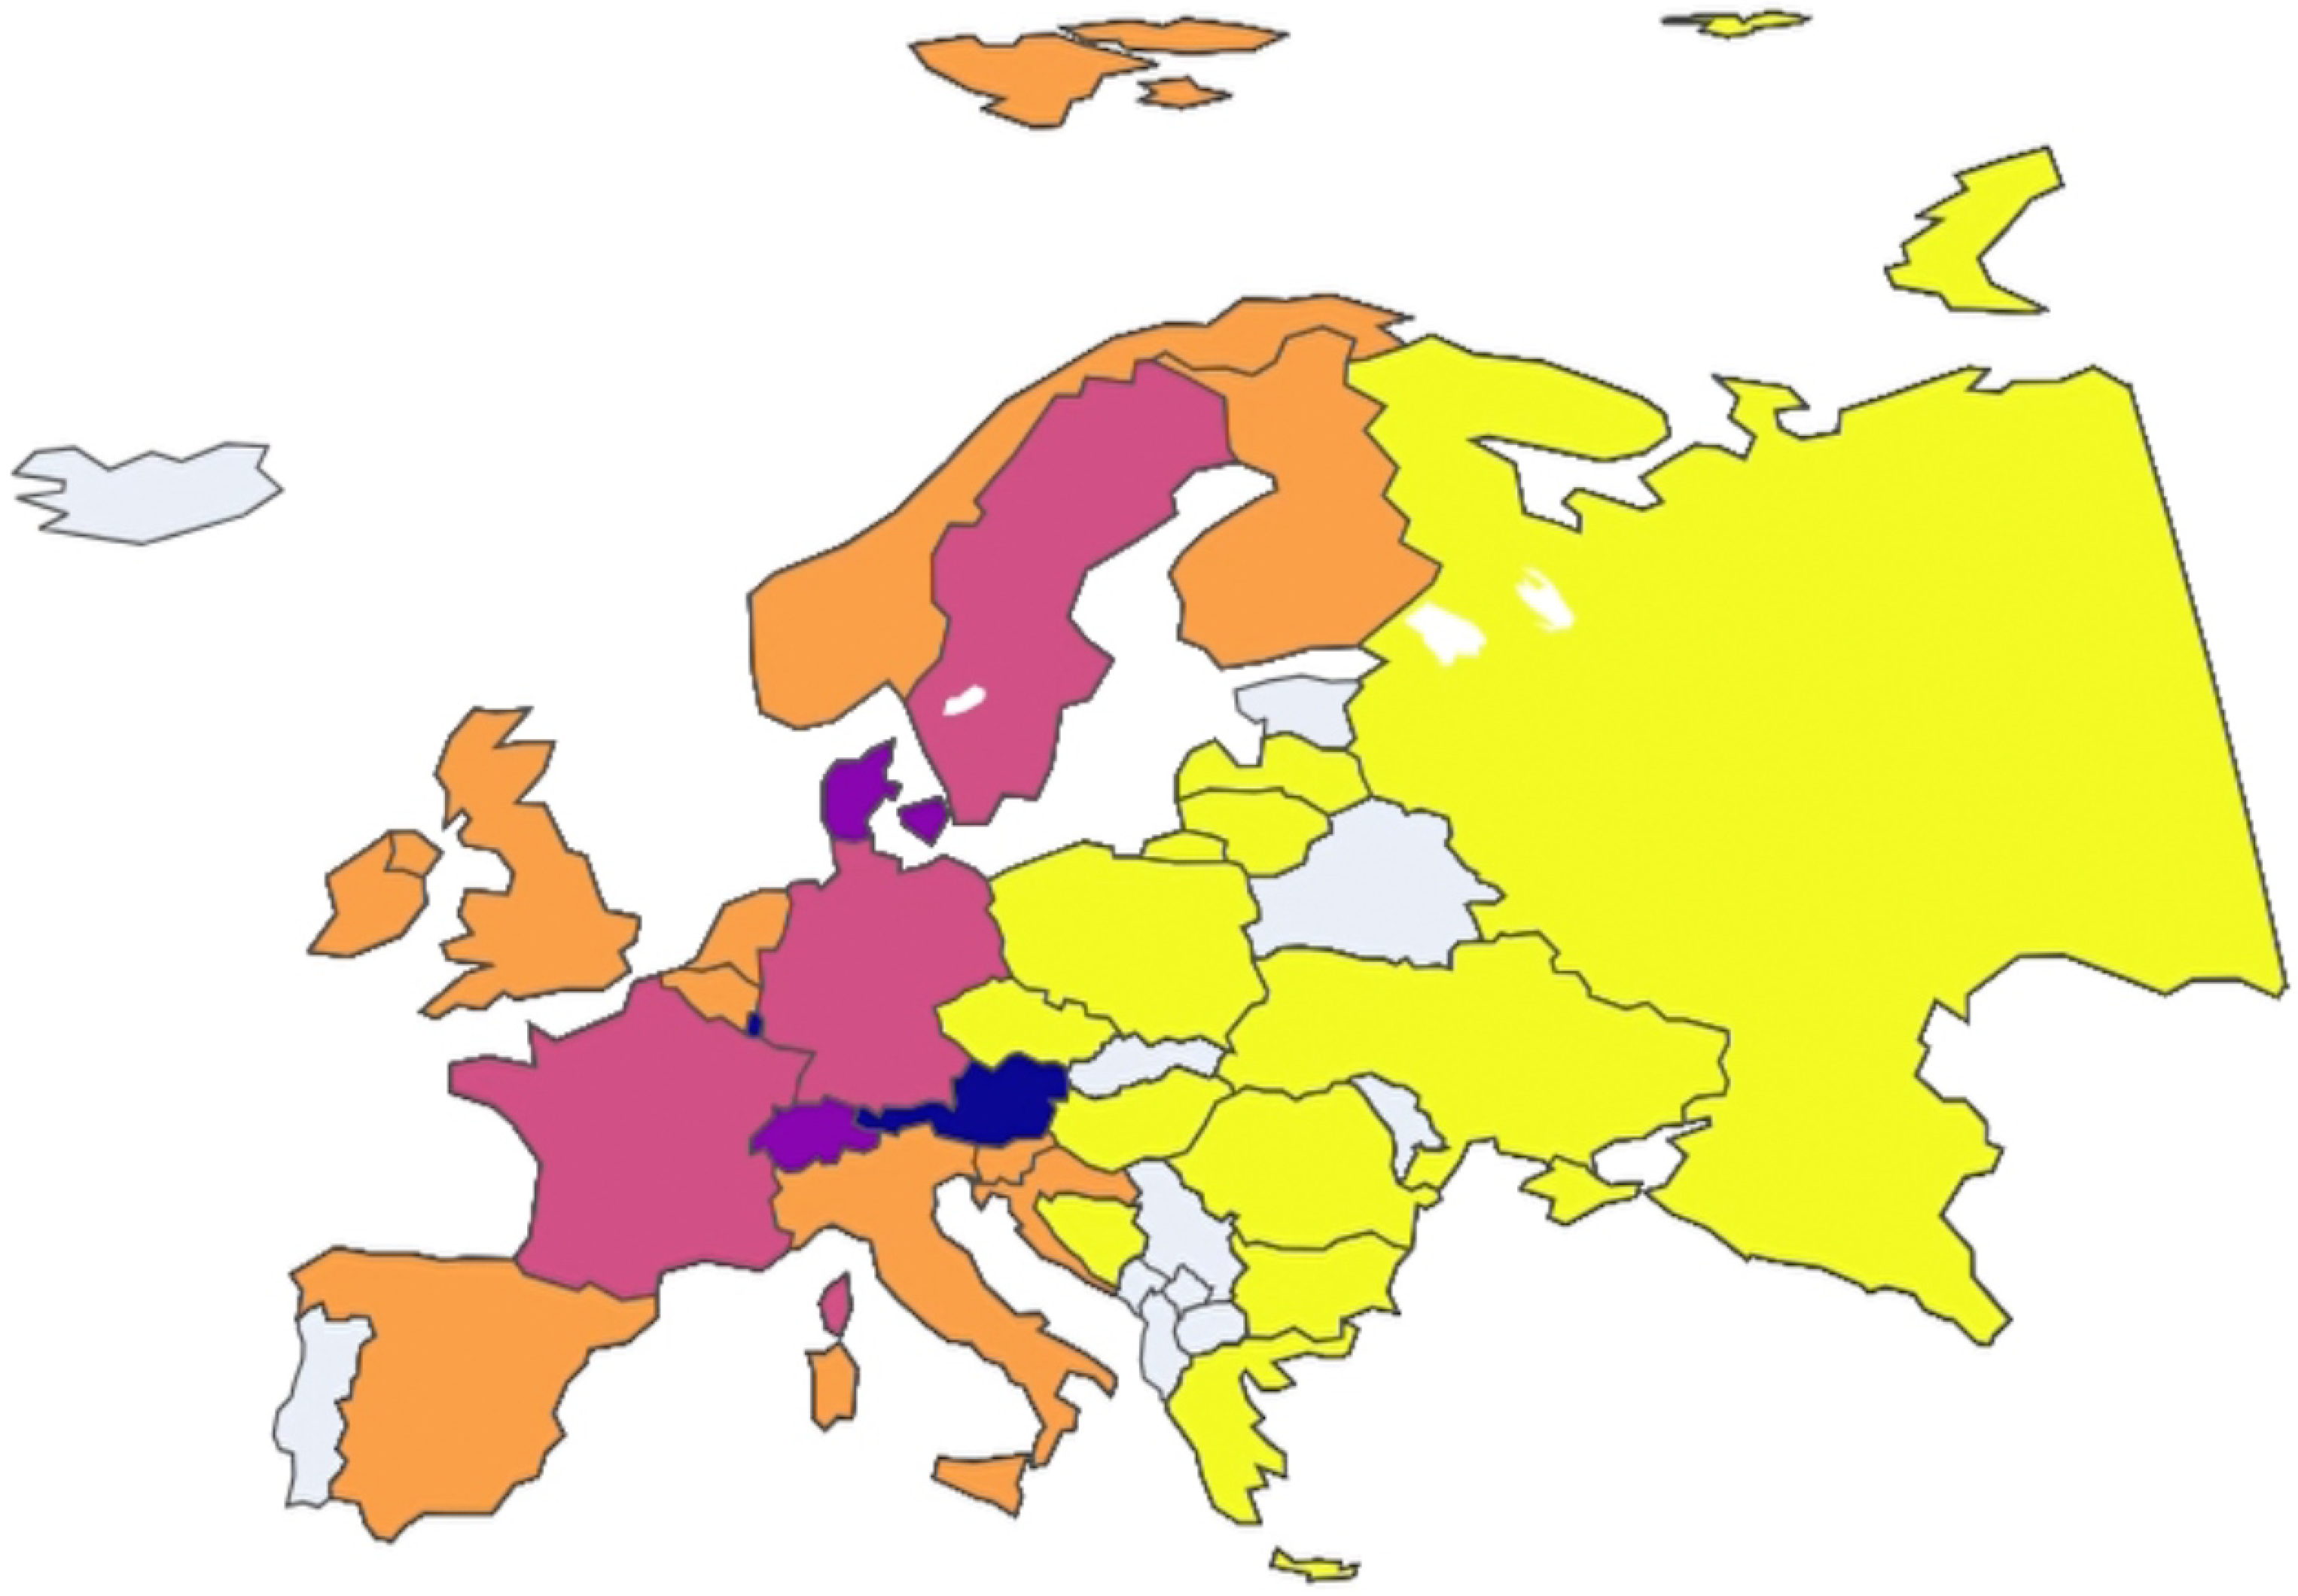

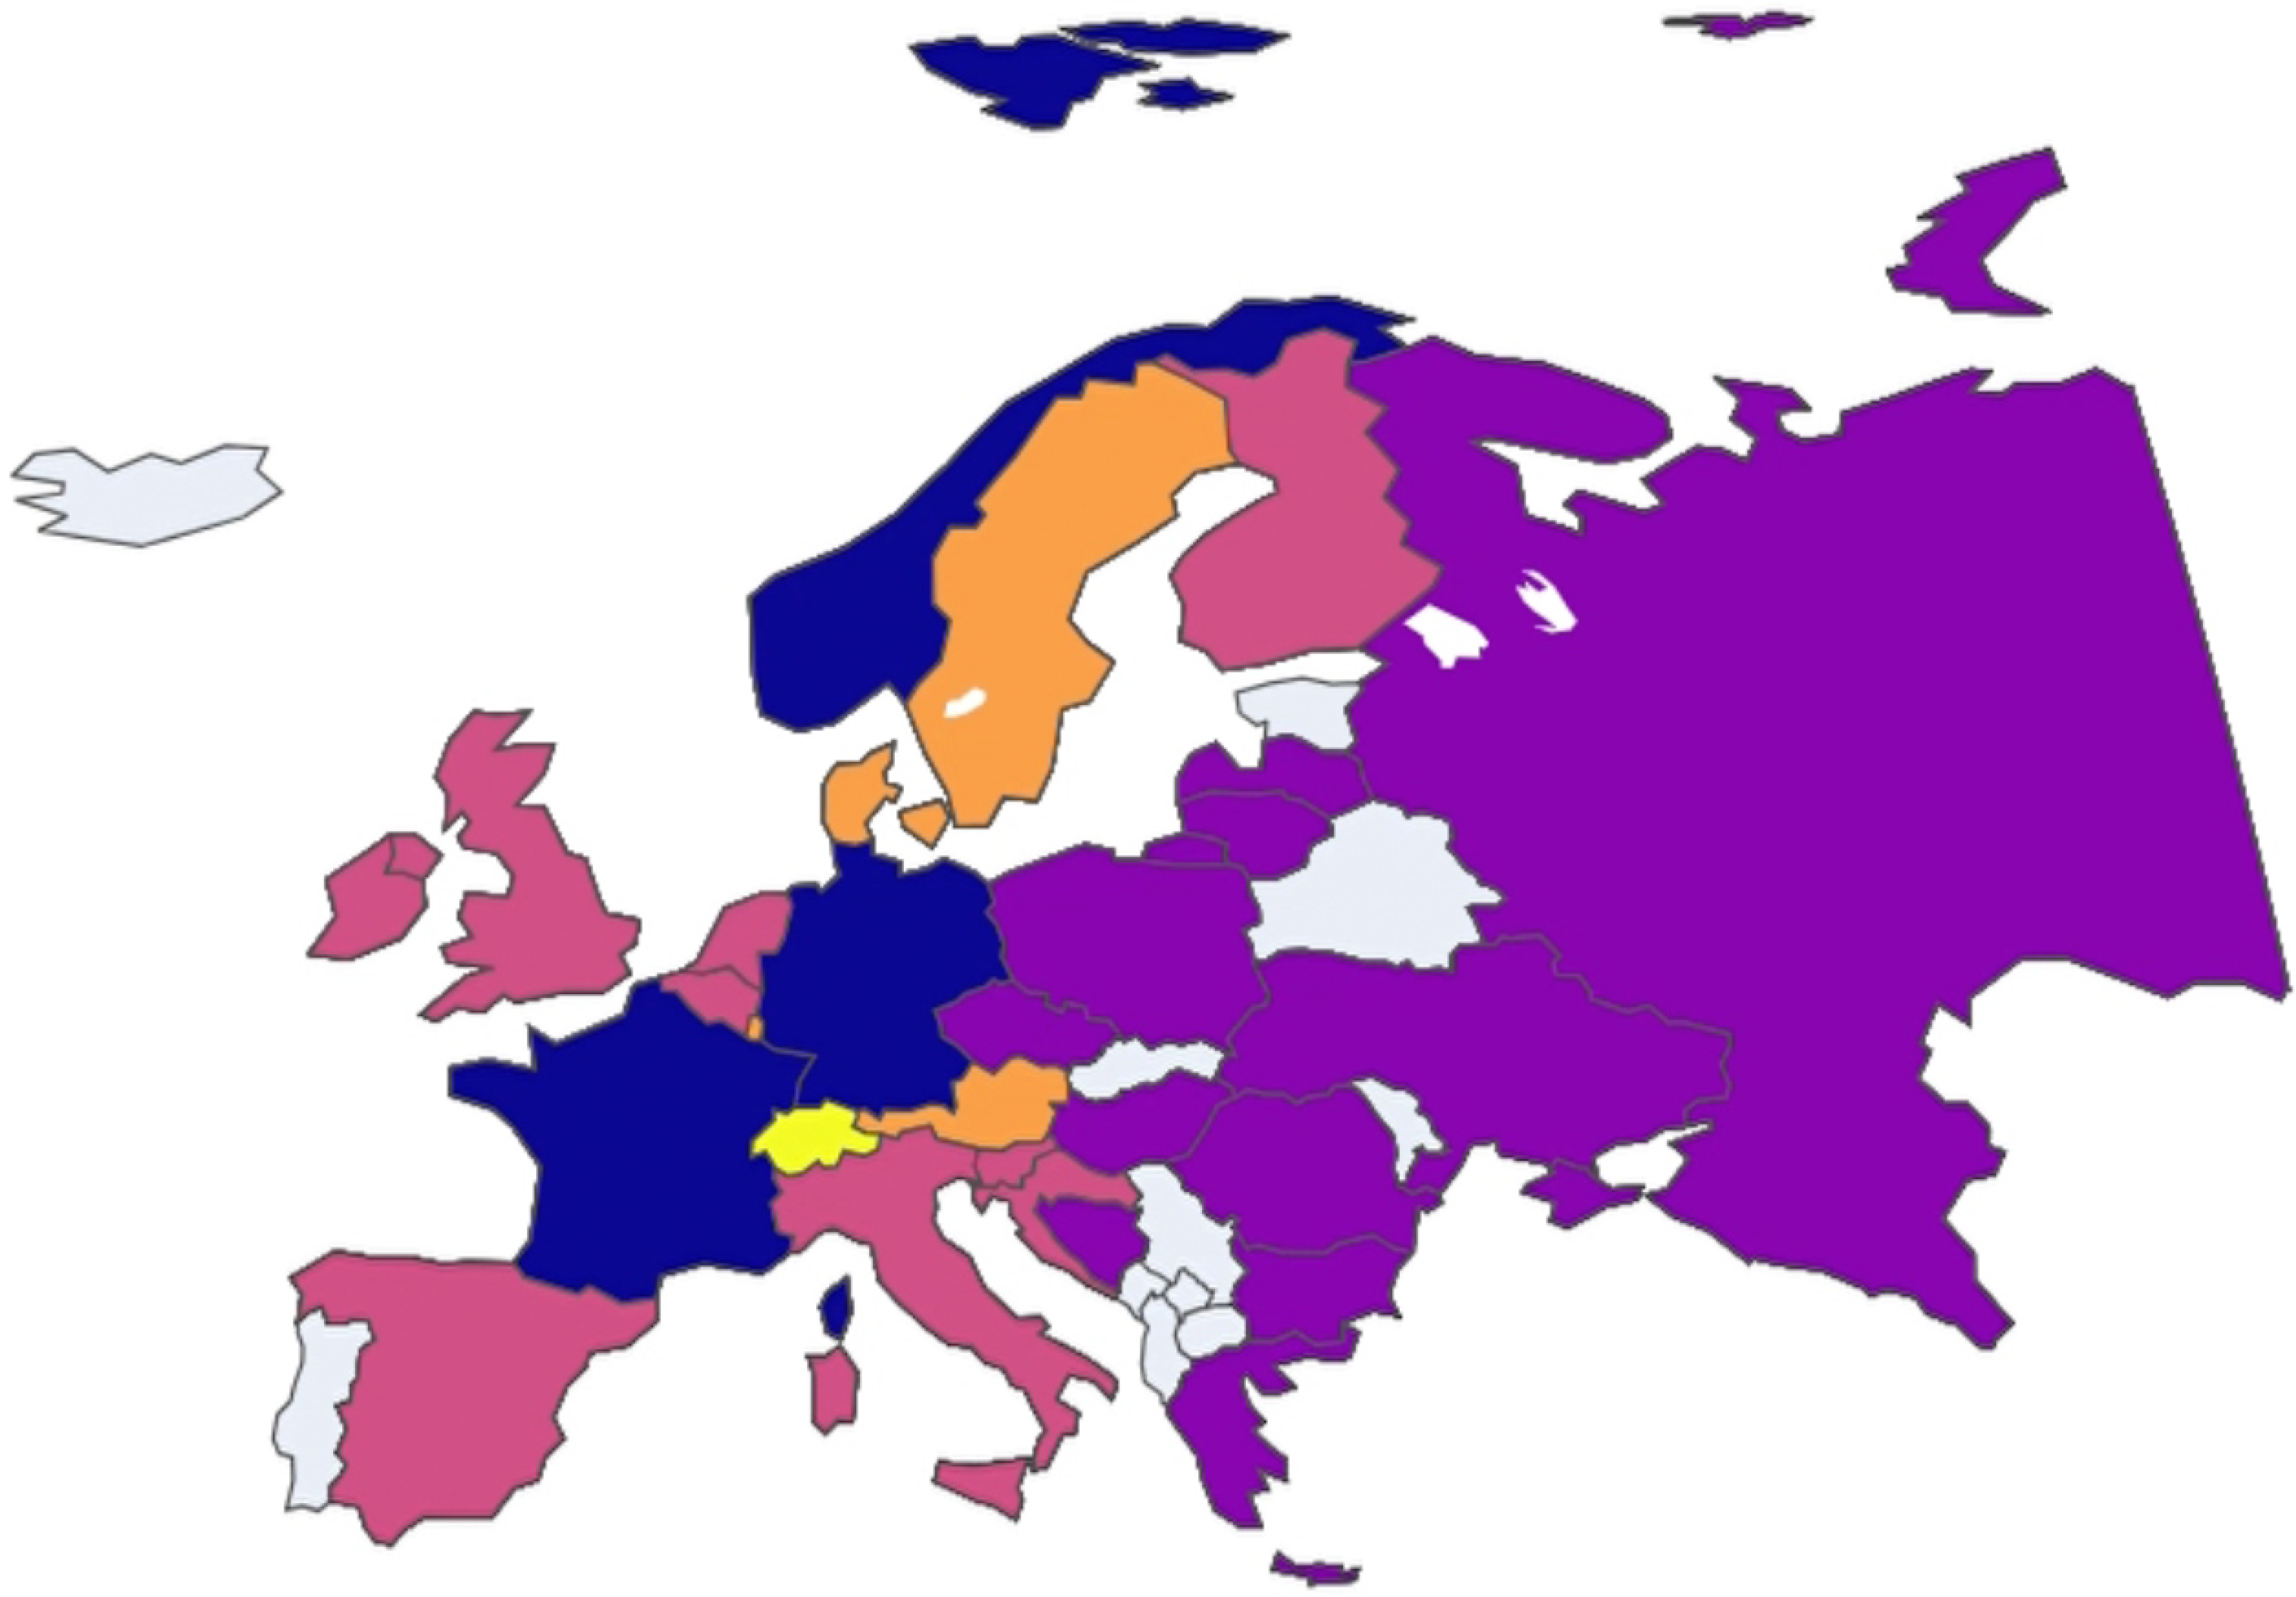
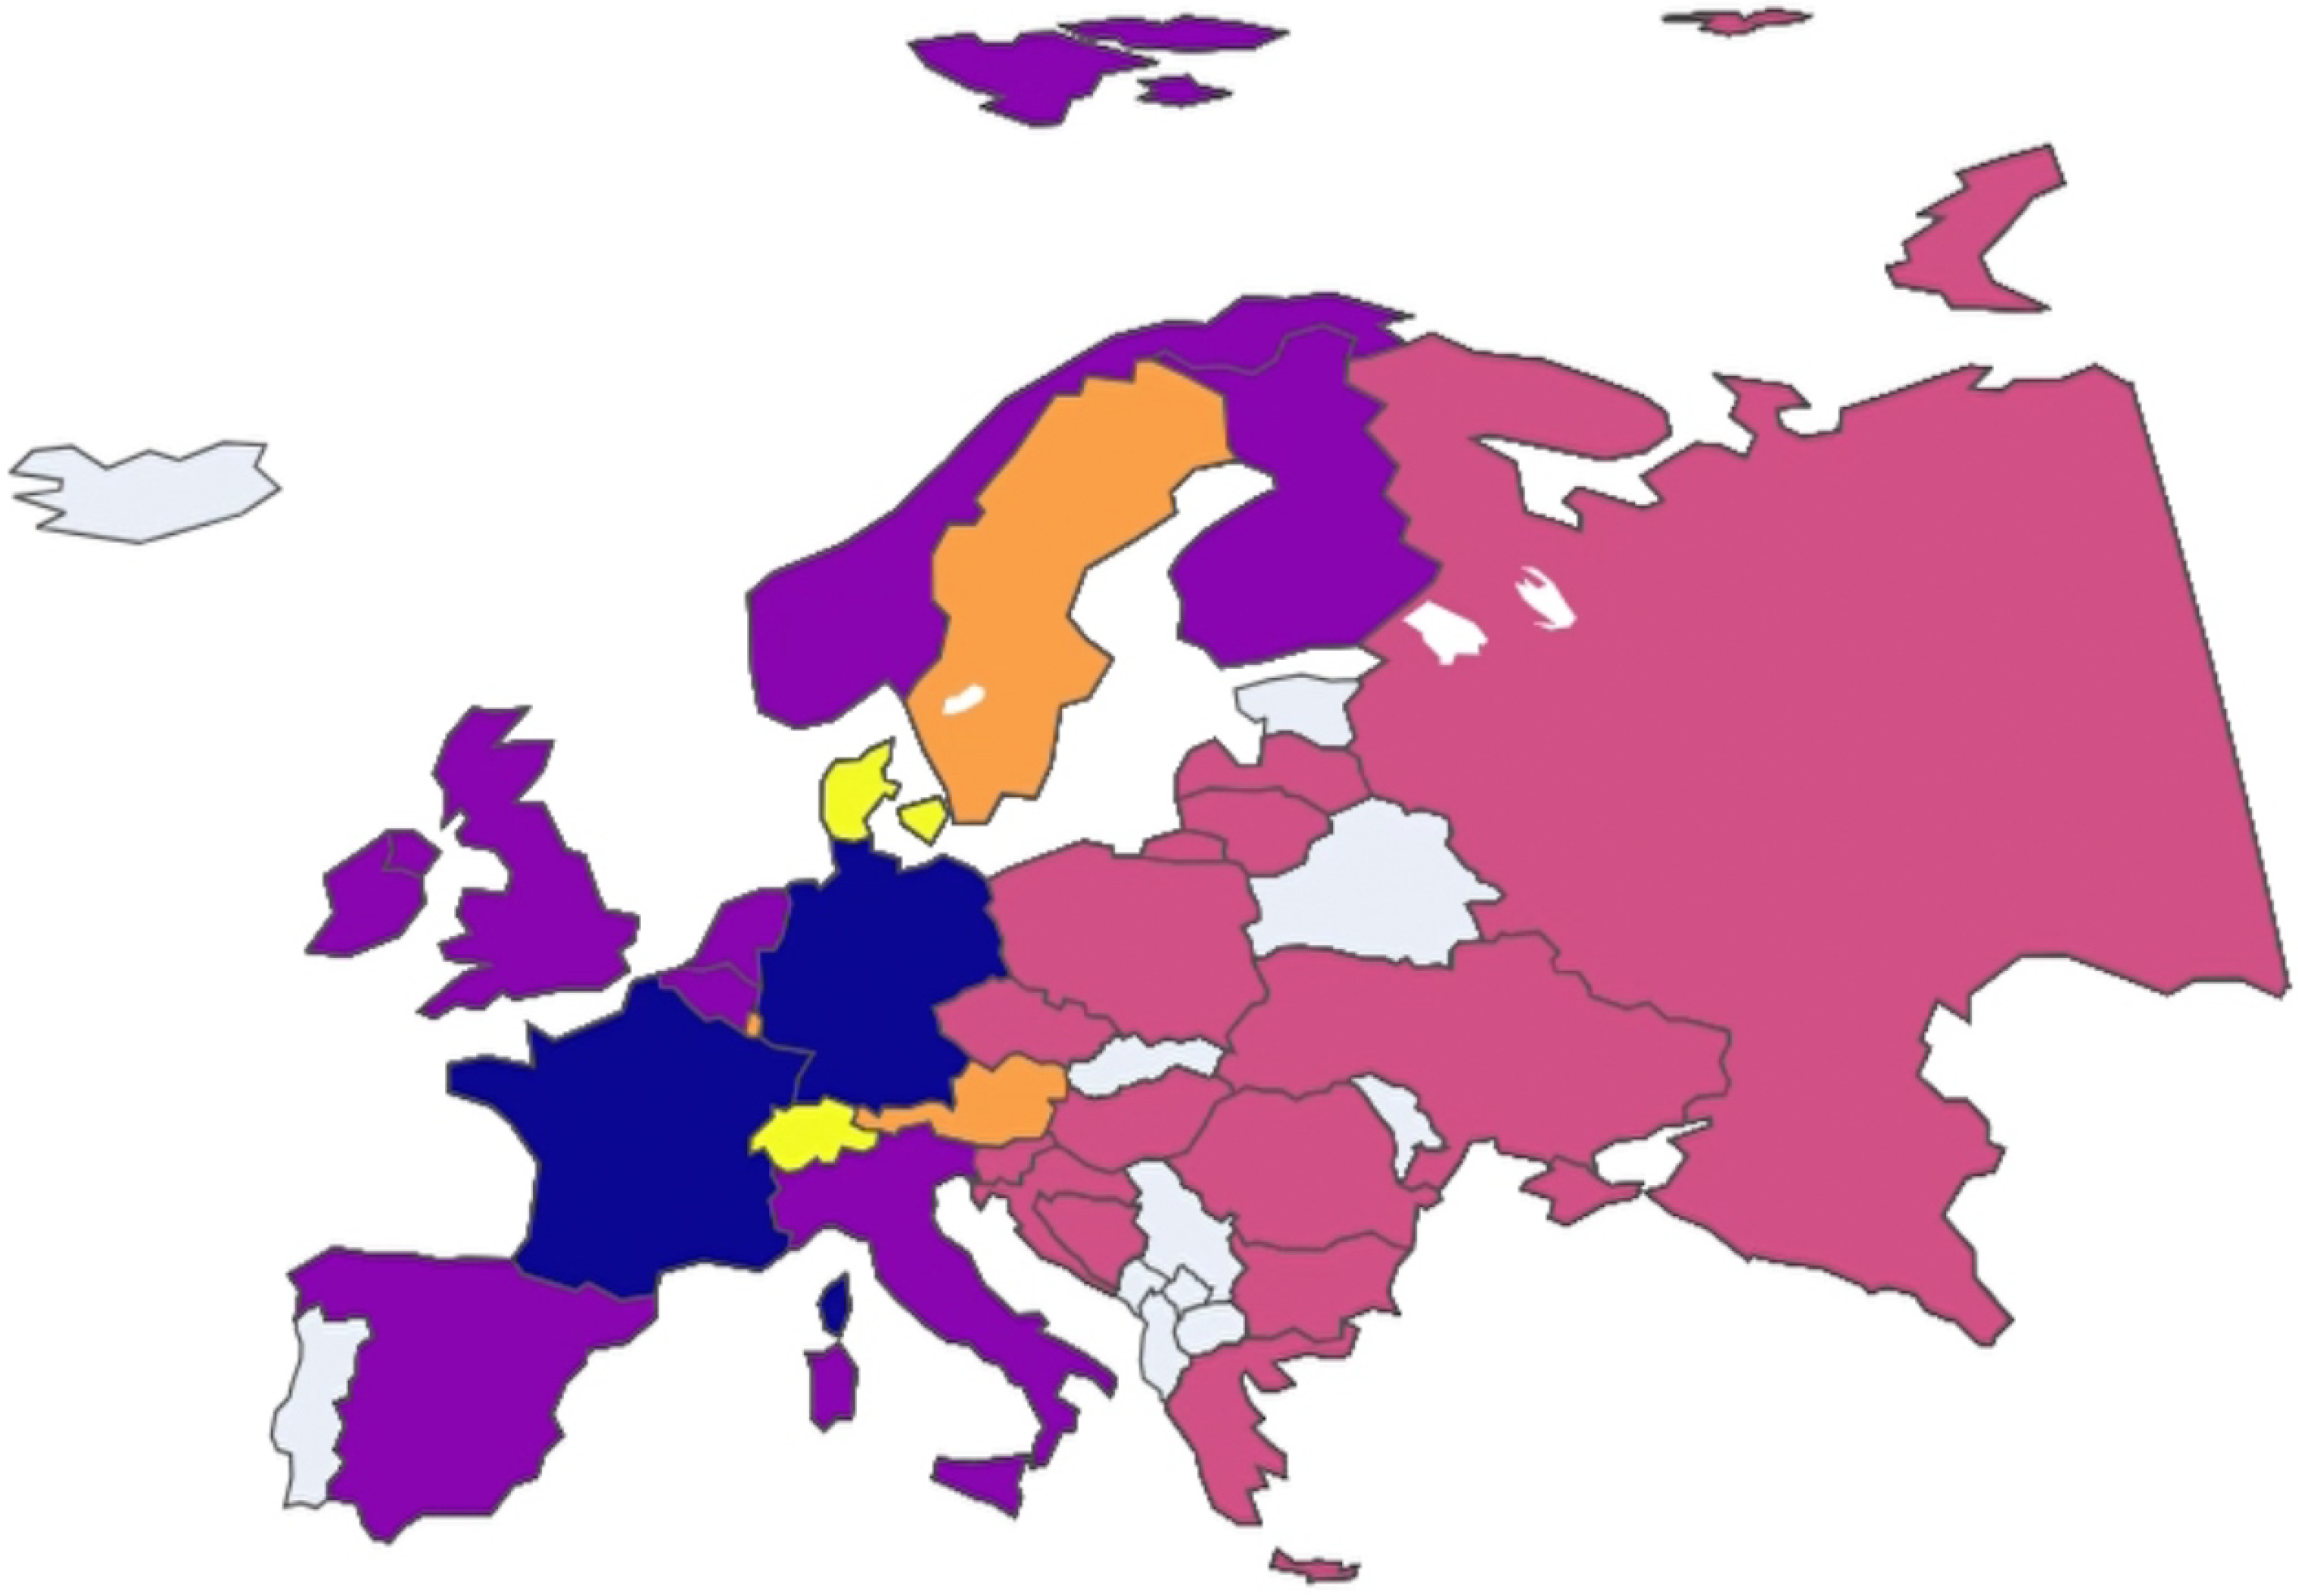
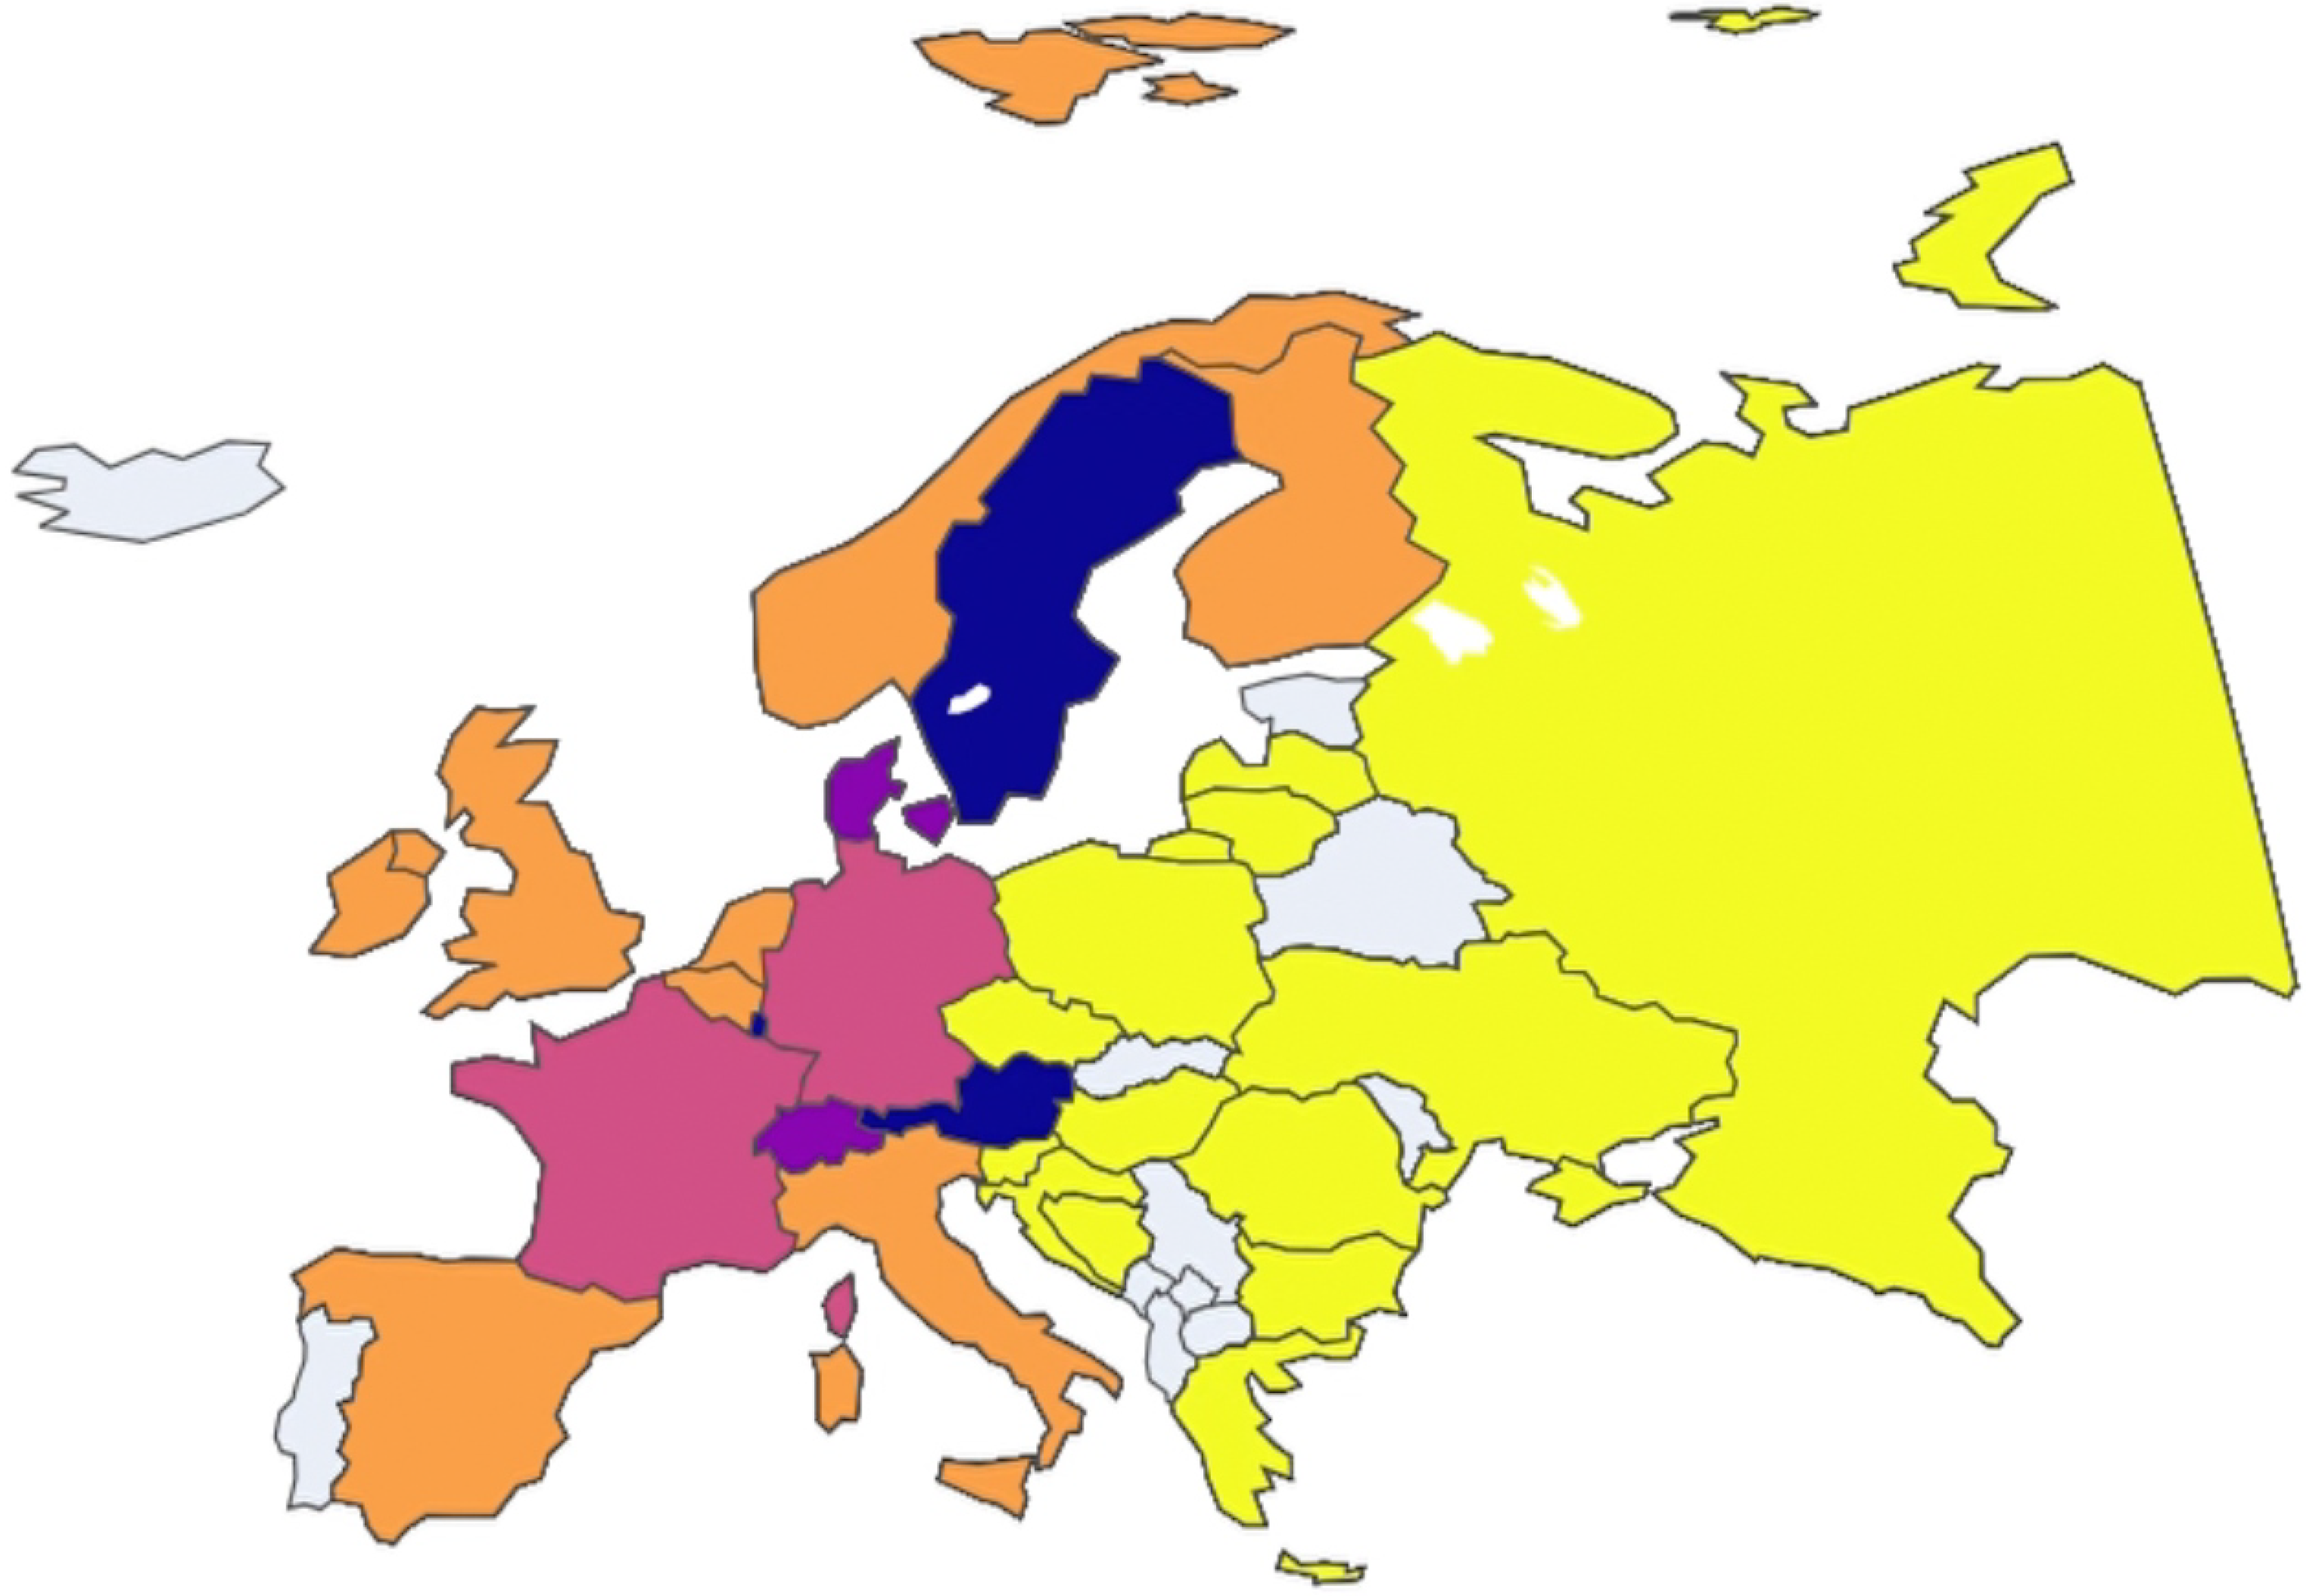
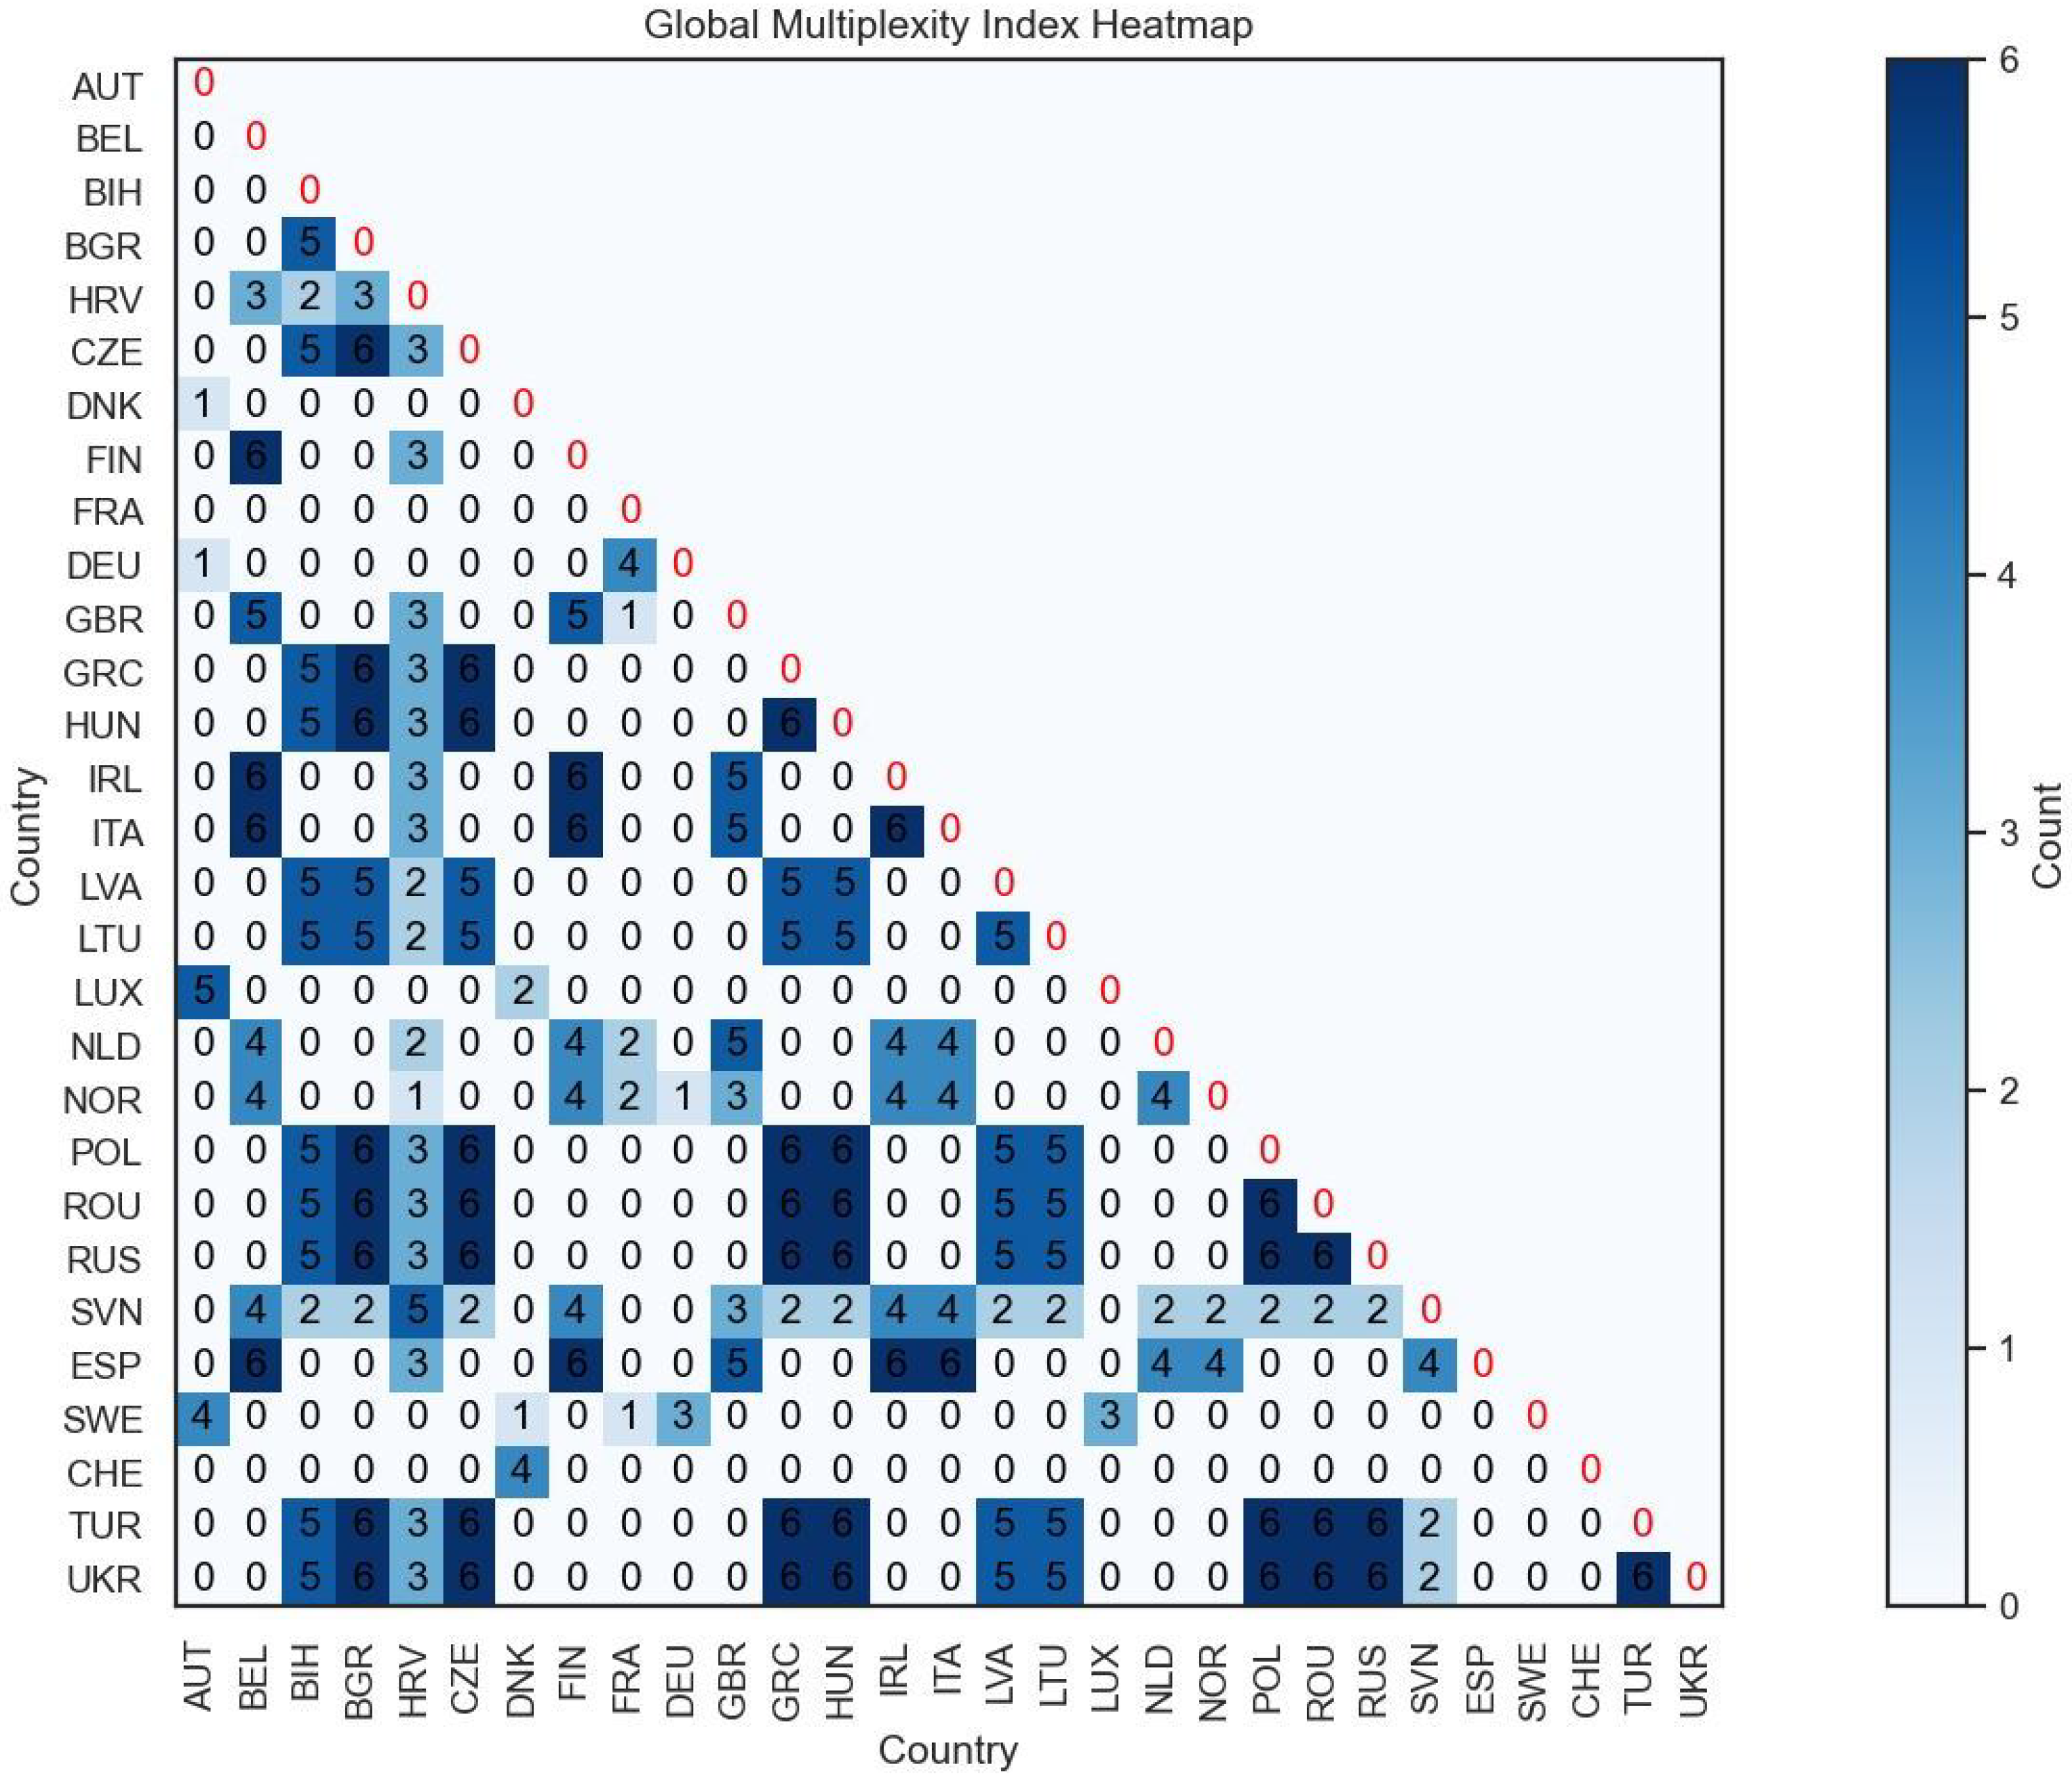


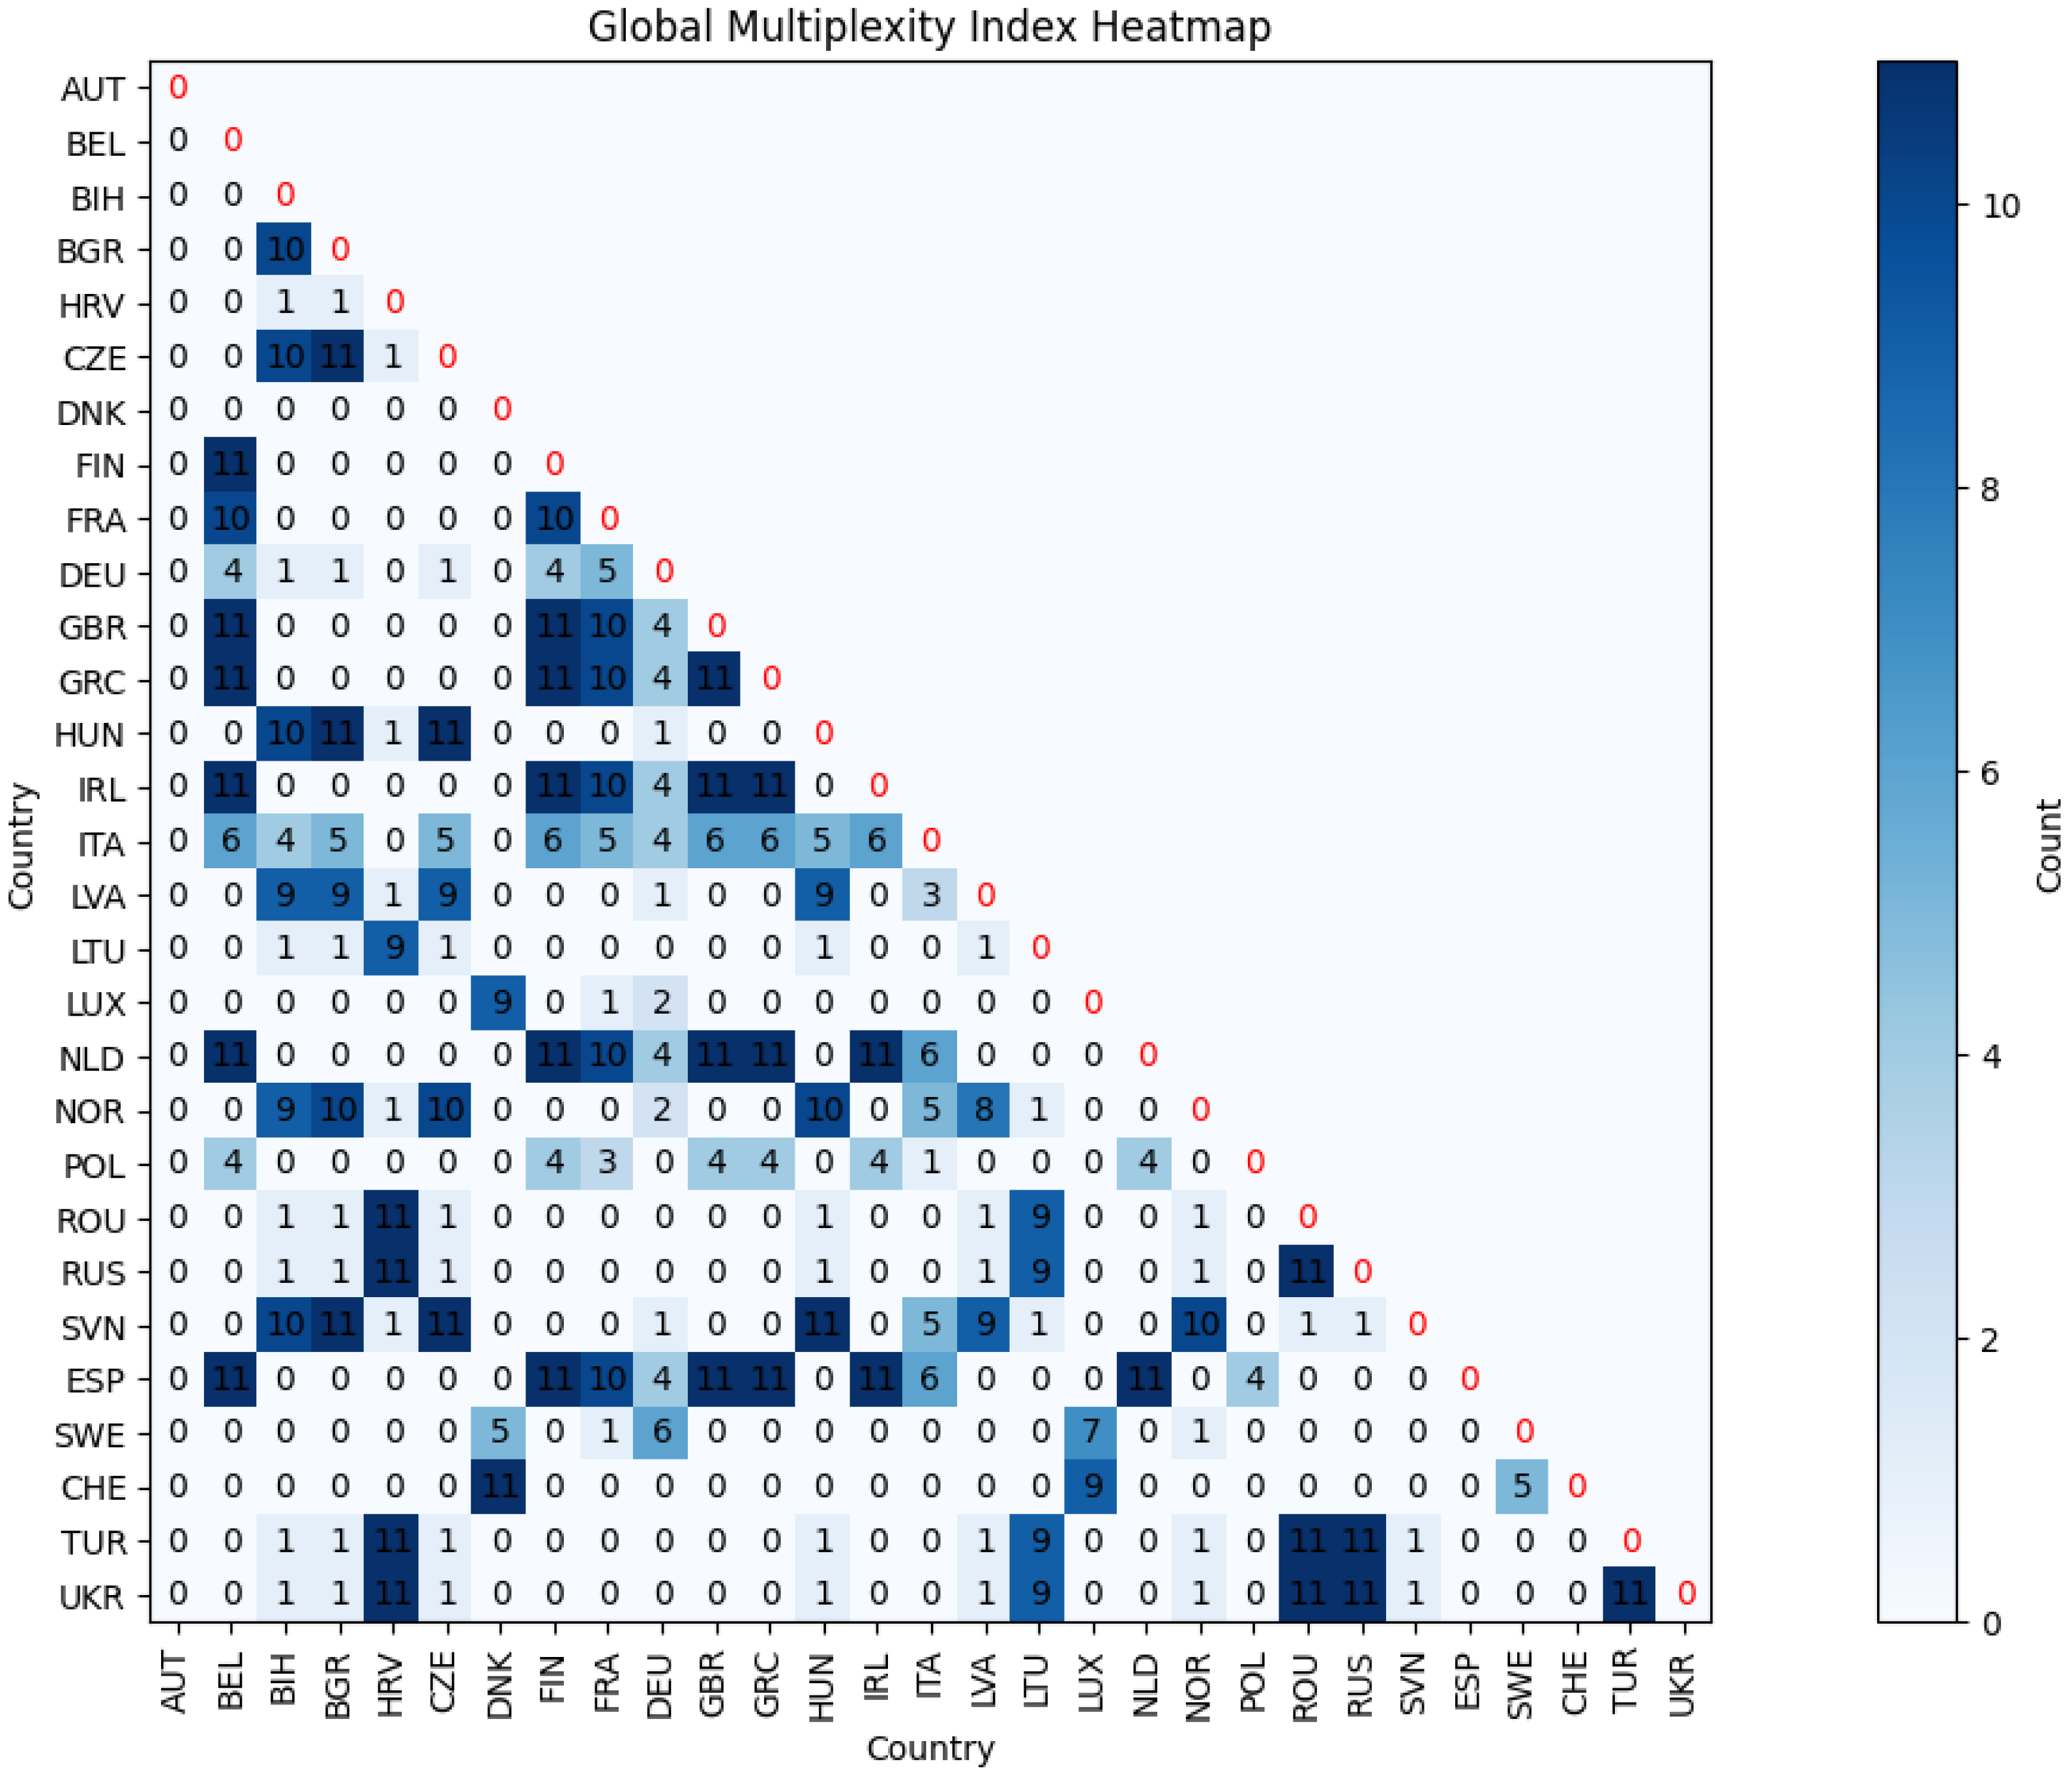
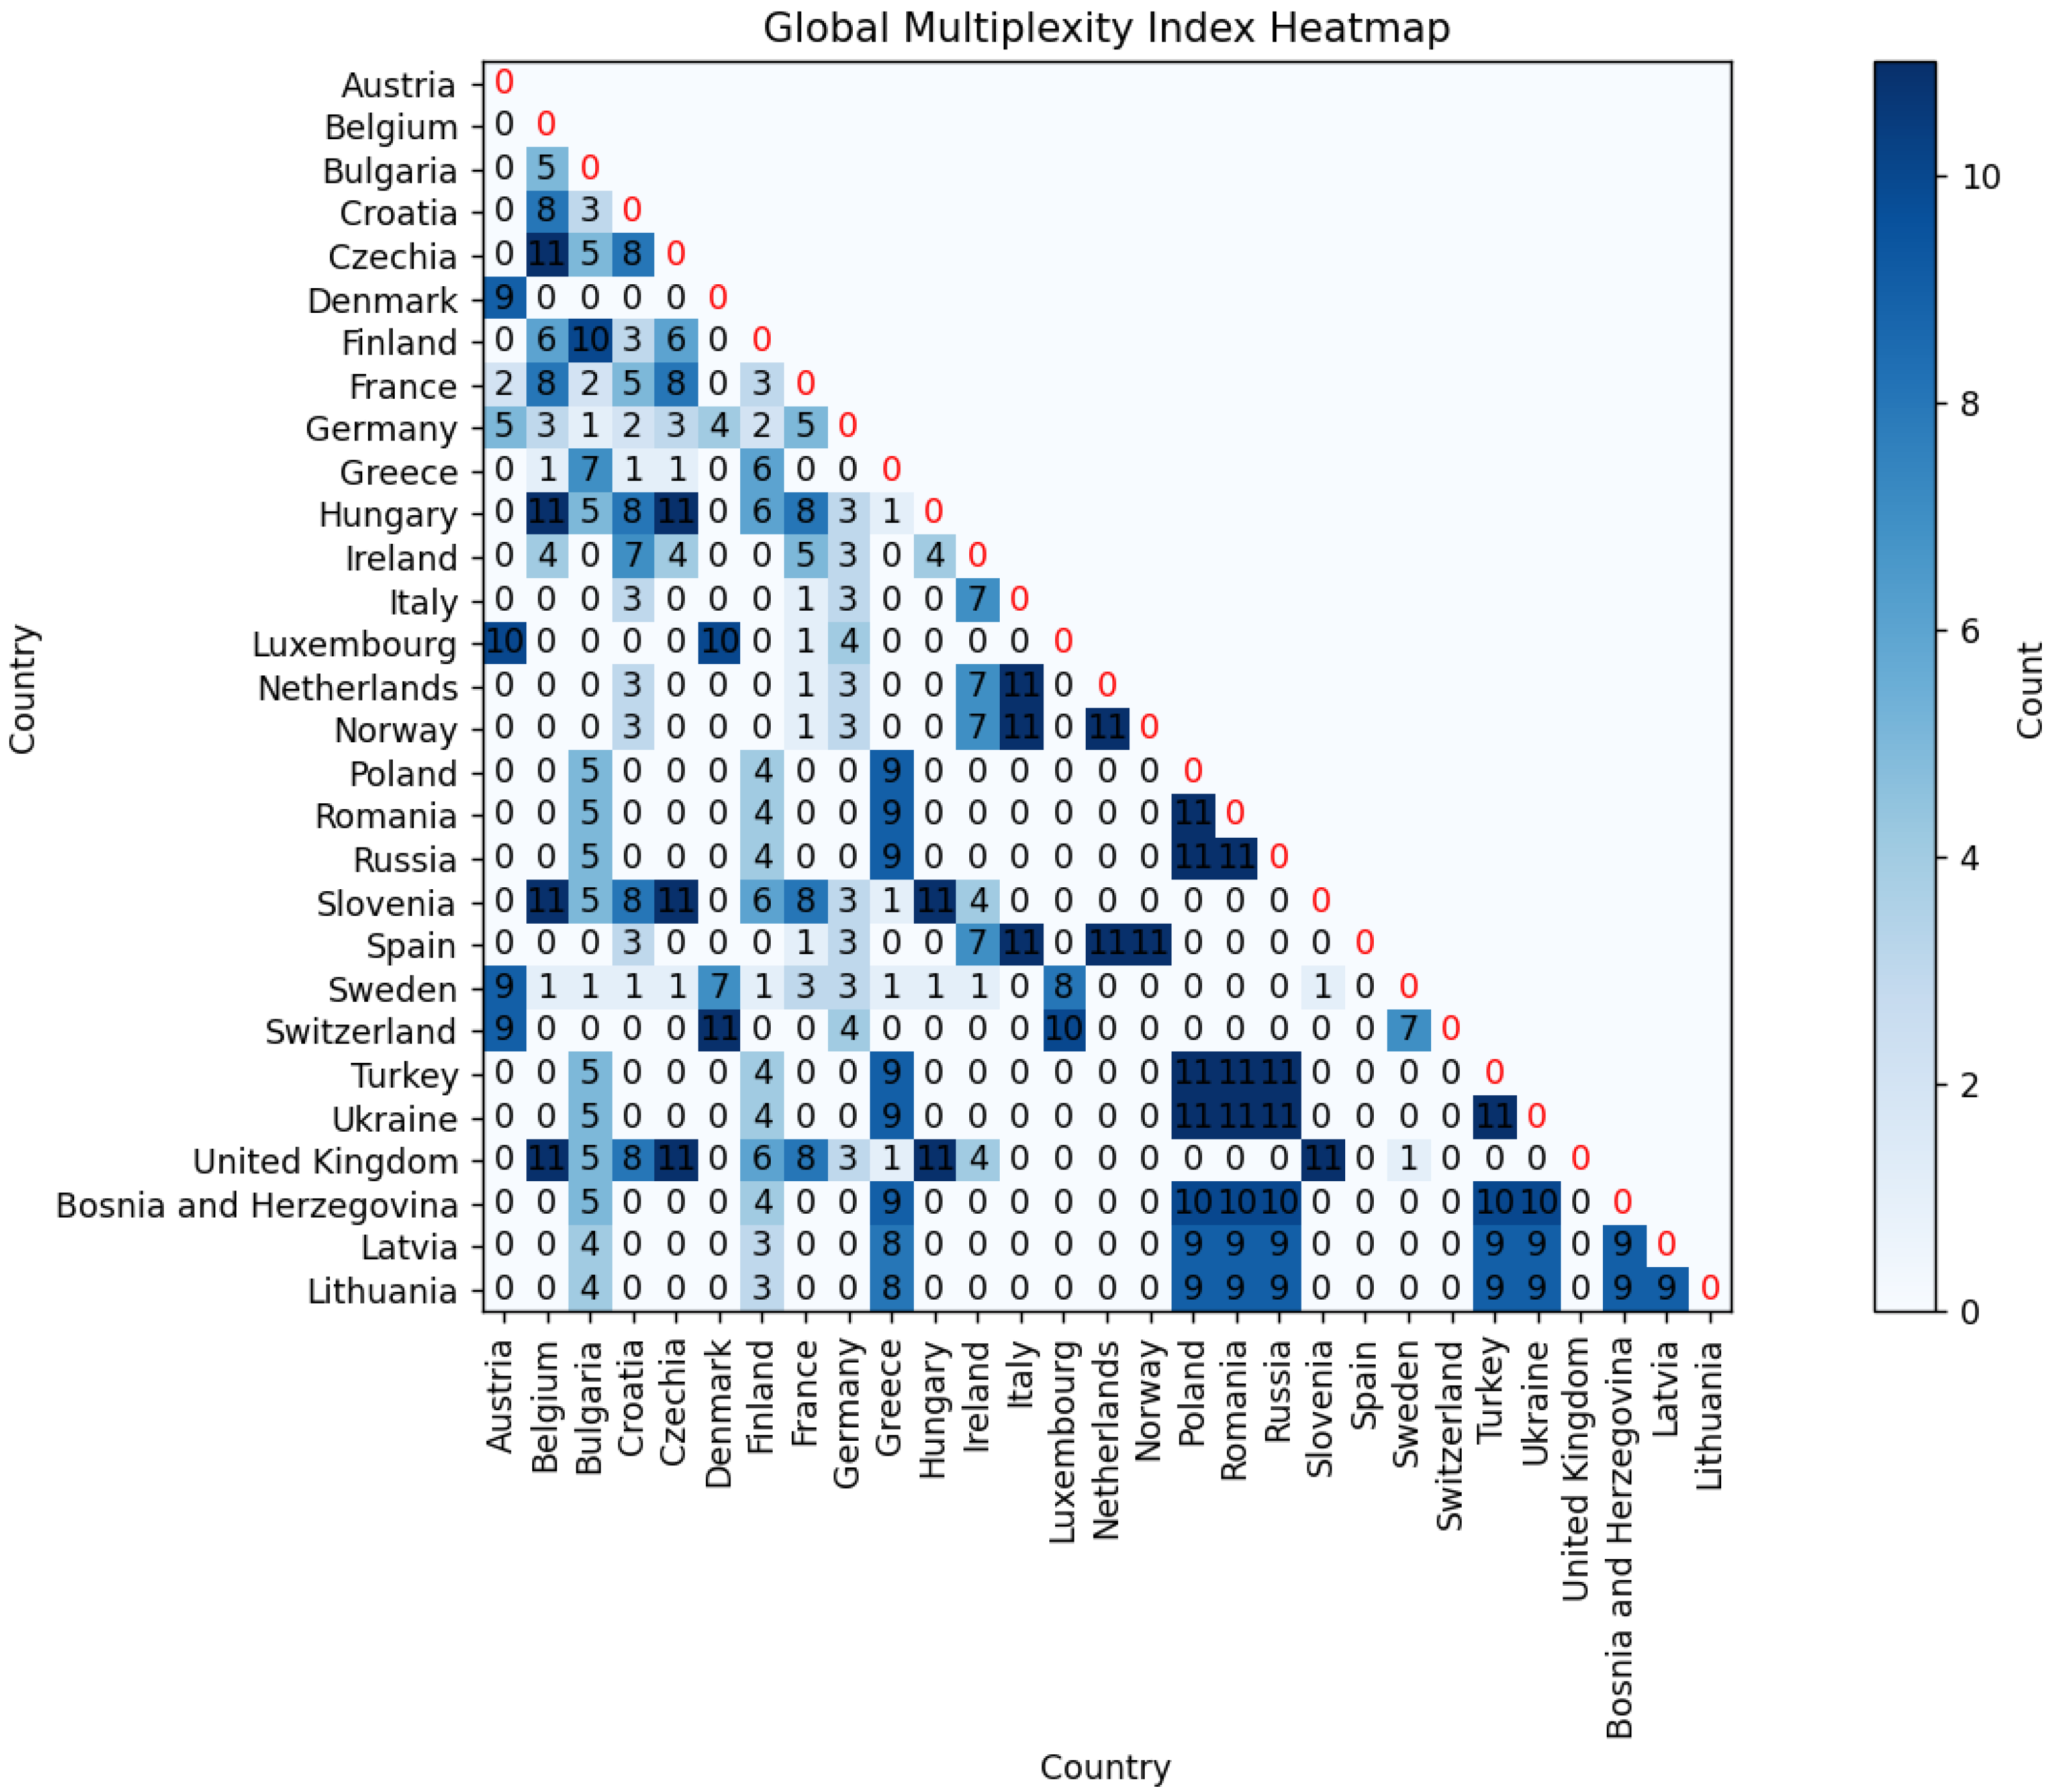
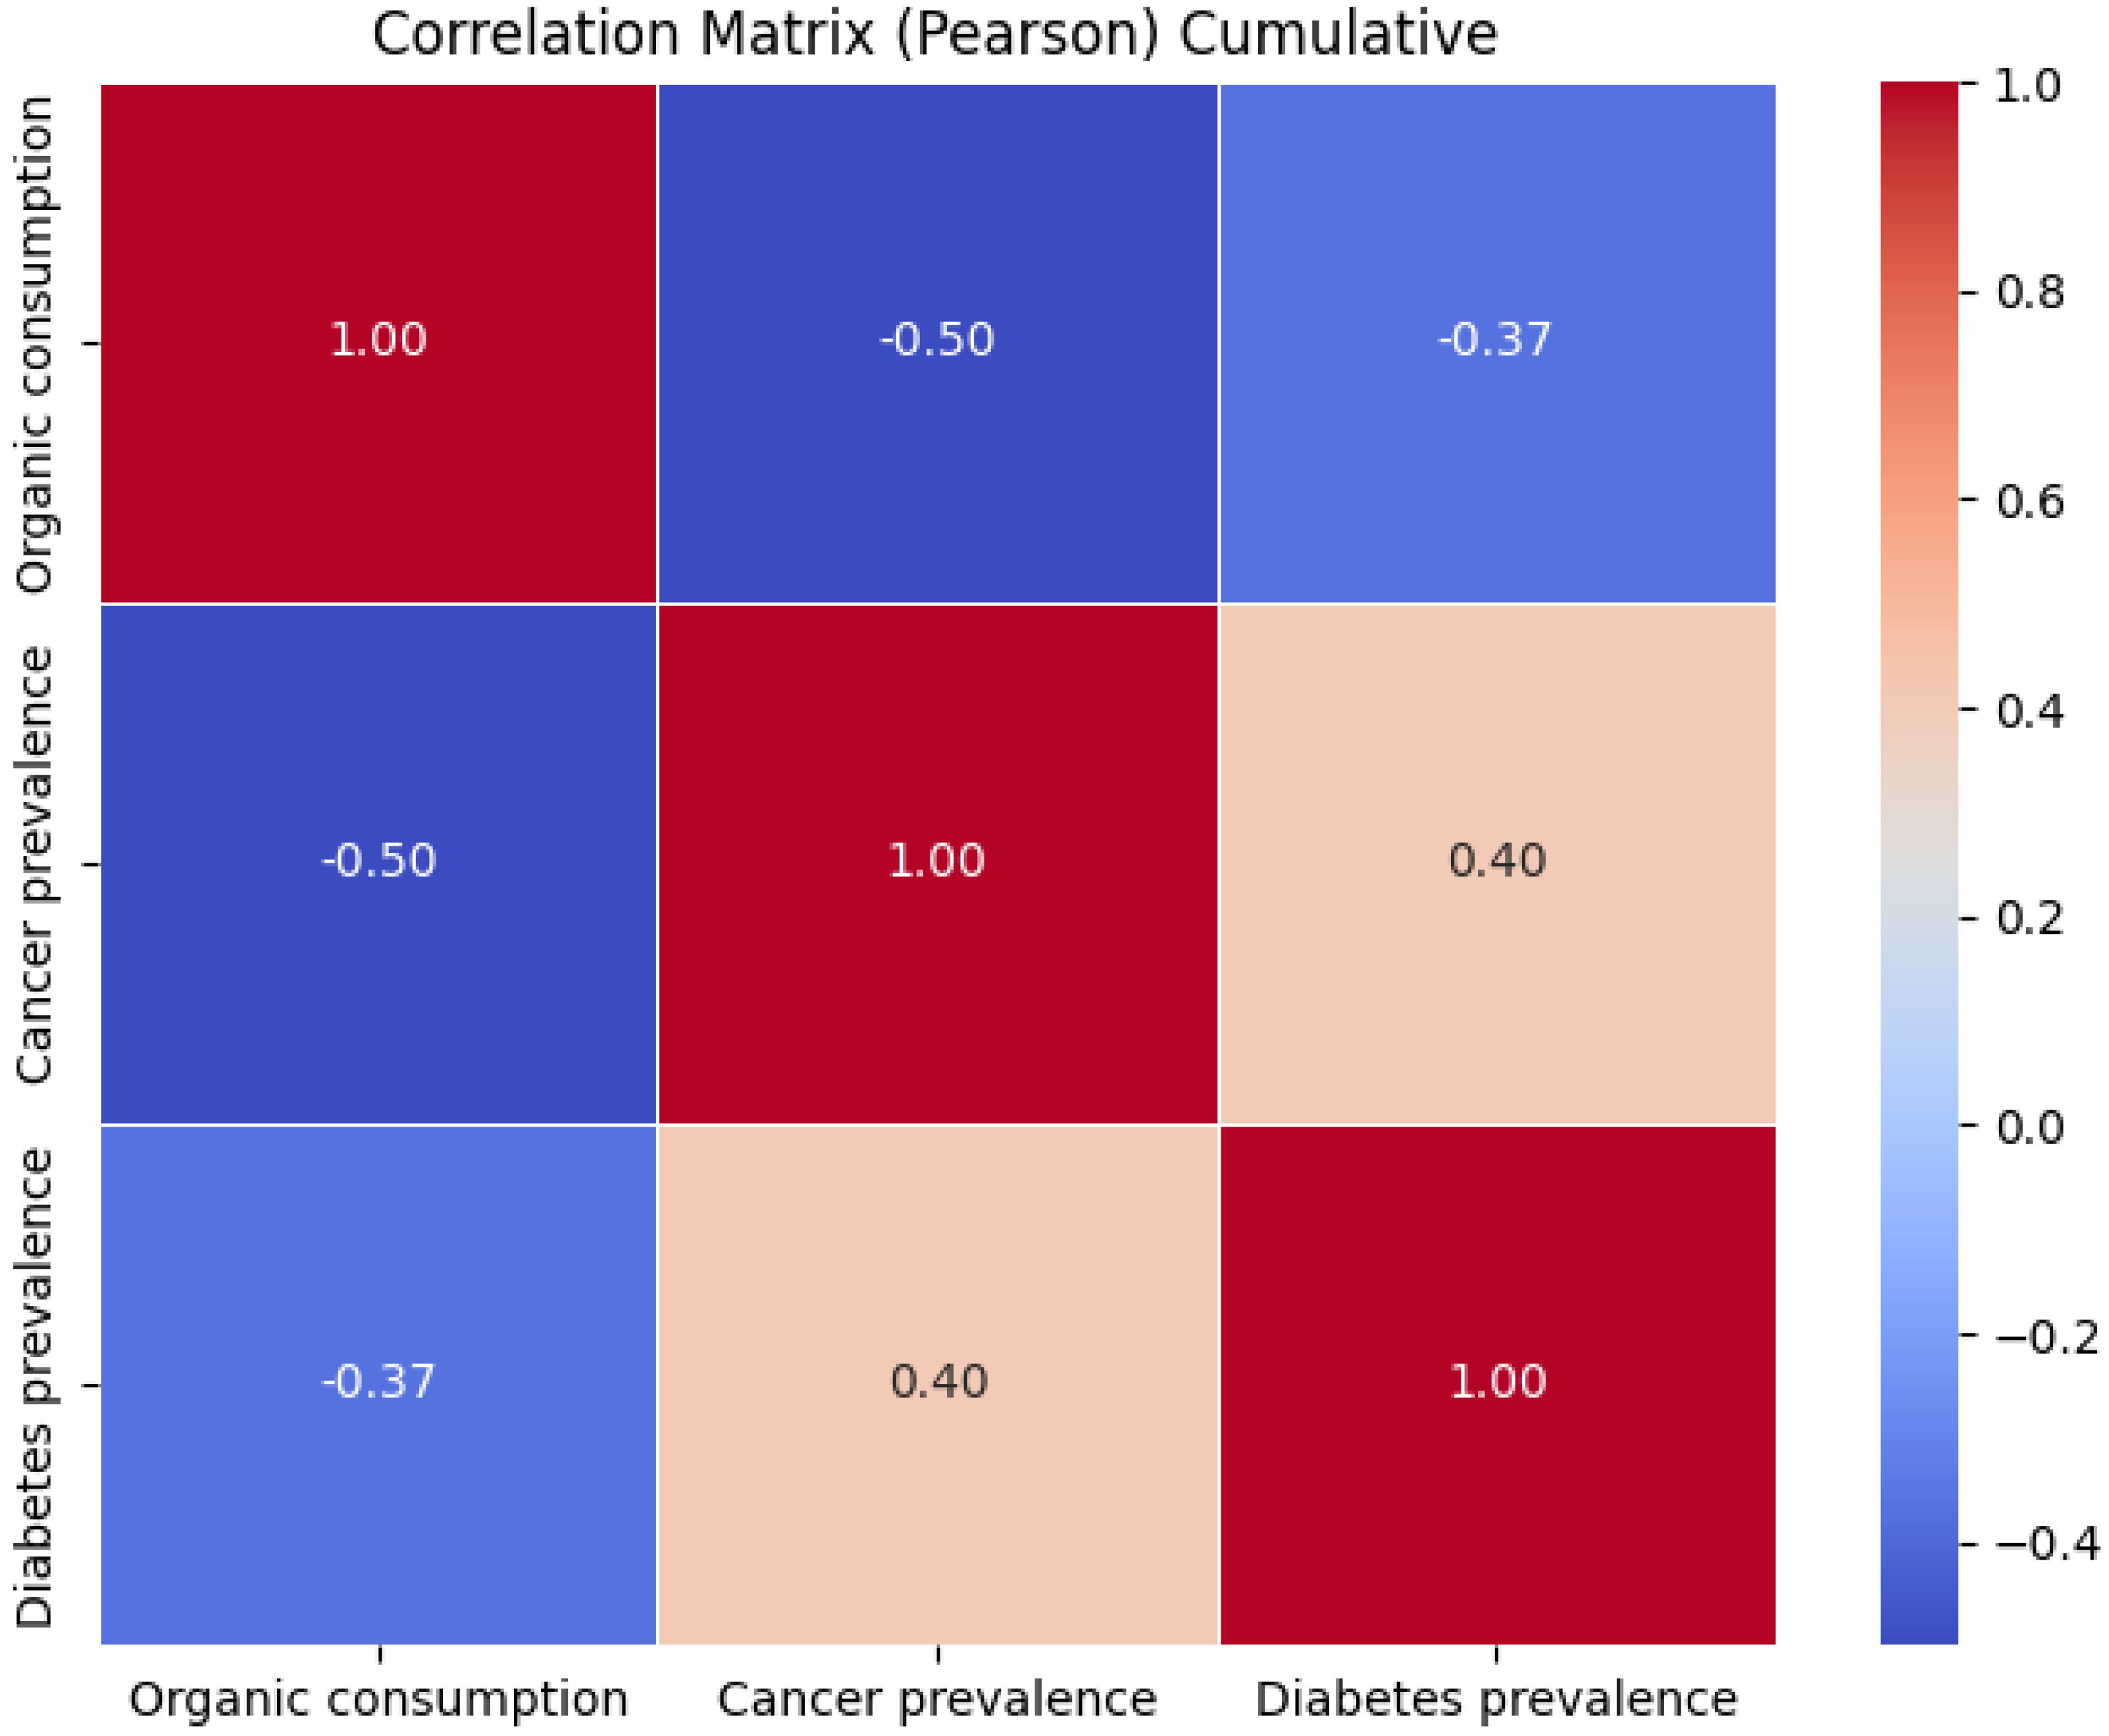
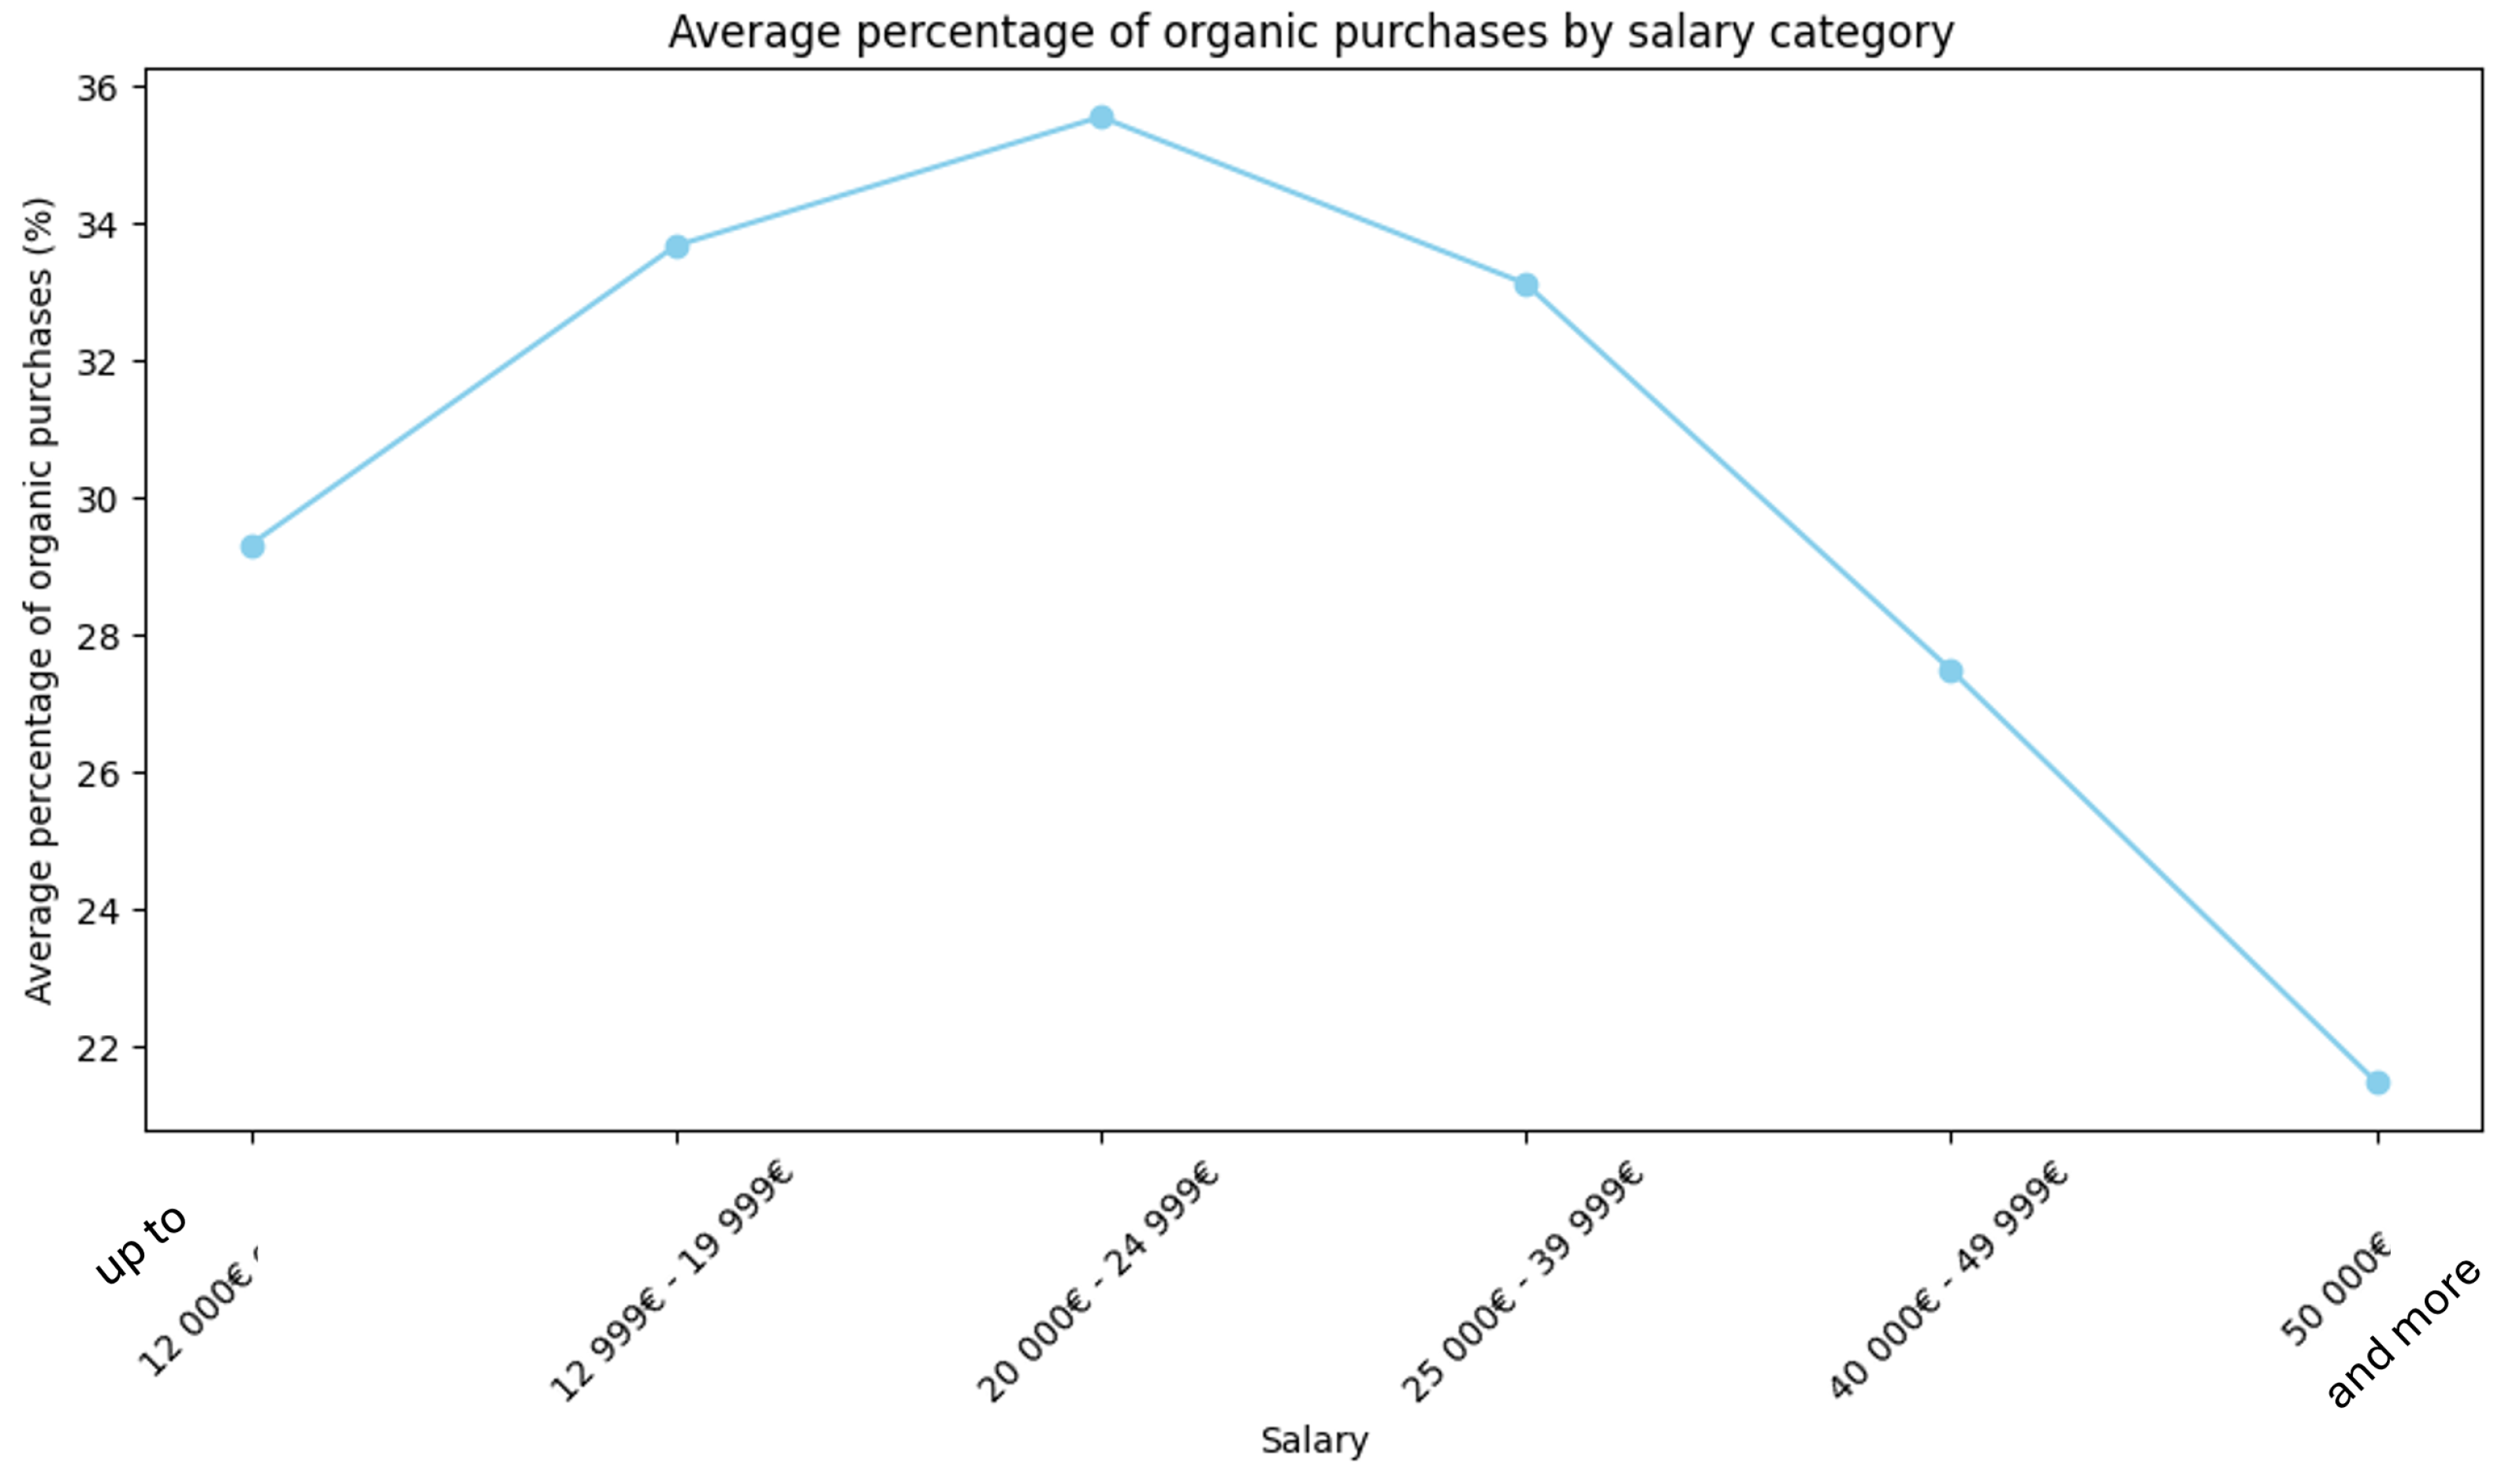
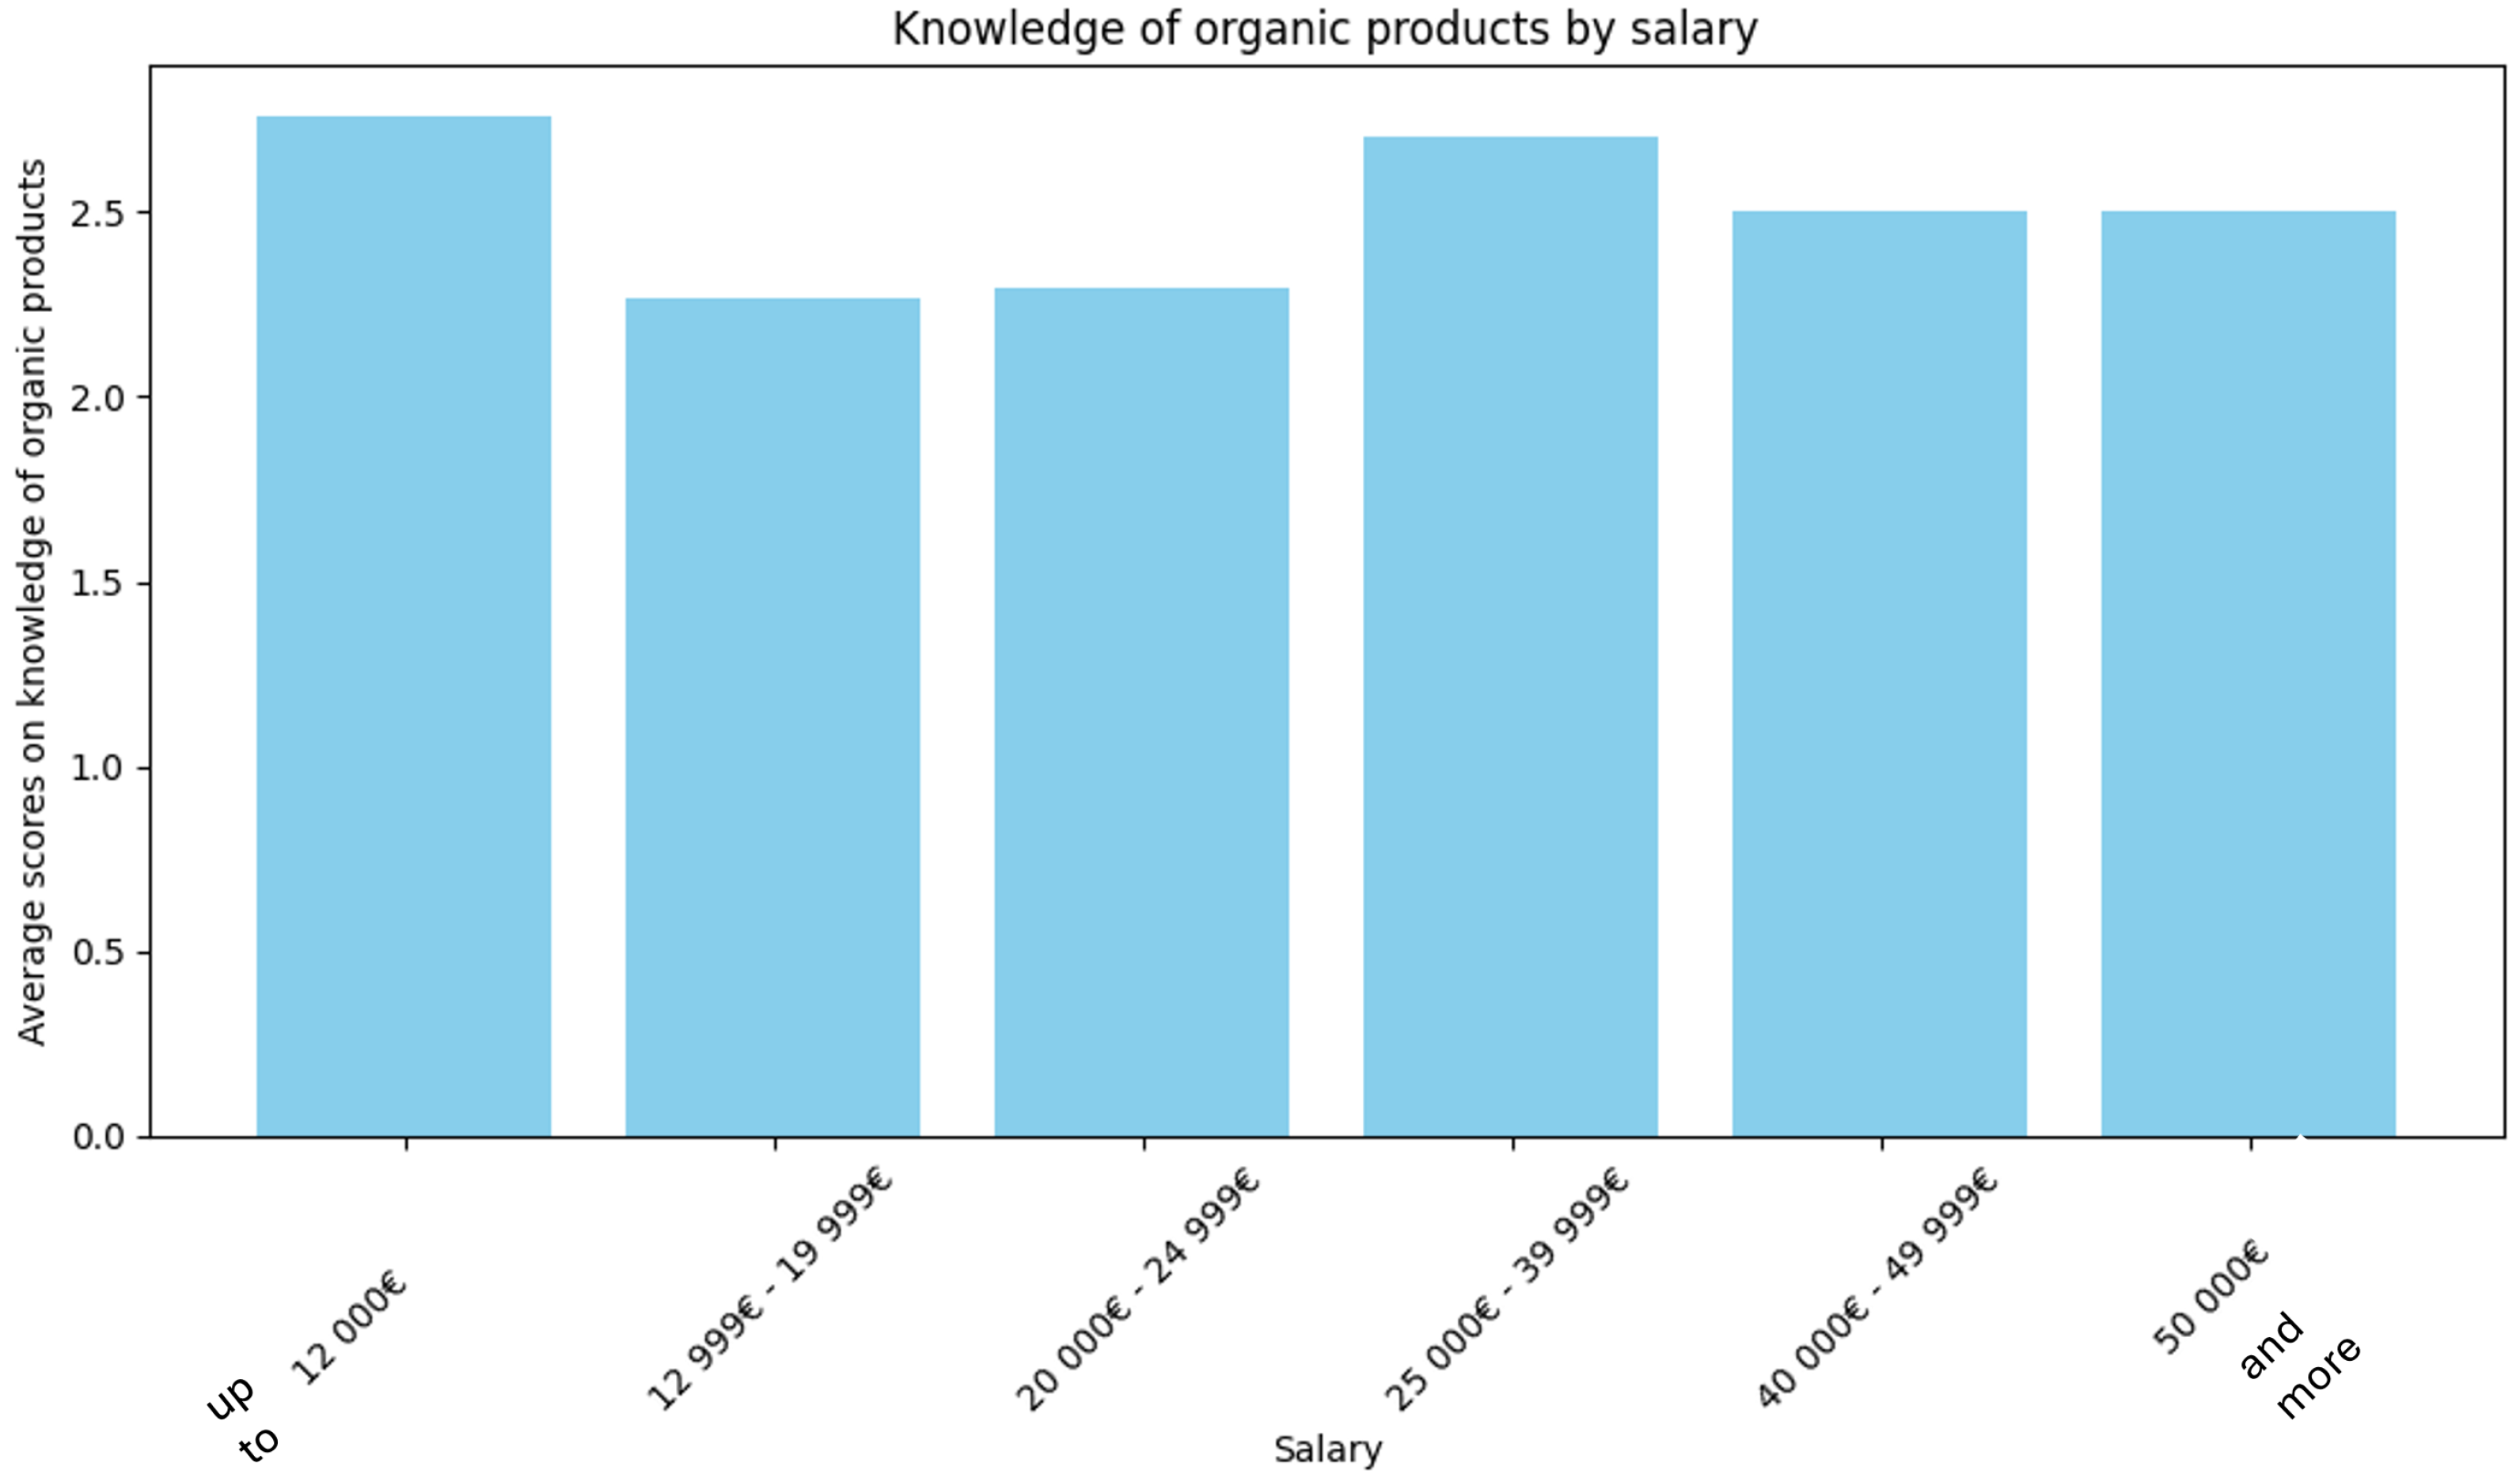
Disclaimer/Publisher’s Note: The statements, opinions and data contained in all publications are solely those of the individual author(s) and contributor(s) and not of MDPI and/or the editor(s). MDPI and/or the editor(s) disclaim responsibility for any injury to people or property resulting from any ideas, methods, instructions or products referred to in the content. |
© 2025 by the authors. Licensee MDPI, Basel, Switzerland. This article is an open access article distributed under the terms and conditions of the Creative Commons Attribution (CC BY) license (https://creativecommons.org/licenses/by/4.0/).