
Quantifying Cybersecurity Impacts on Clean Energy Market Volatility: A Time-Frequency Approach


Abstract
1. Introduction
2. Literature Review
2.1. Cybersecurity Risks and Financial Market Implications in the CE Sector
2.2. Cyber Risks as Drivers of Market Volatility
2.3. Financial Market Reactions to Cyberattacks in the CE Sector
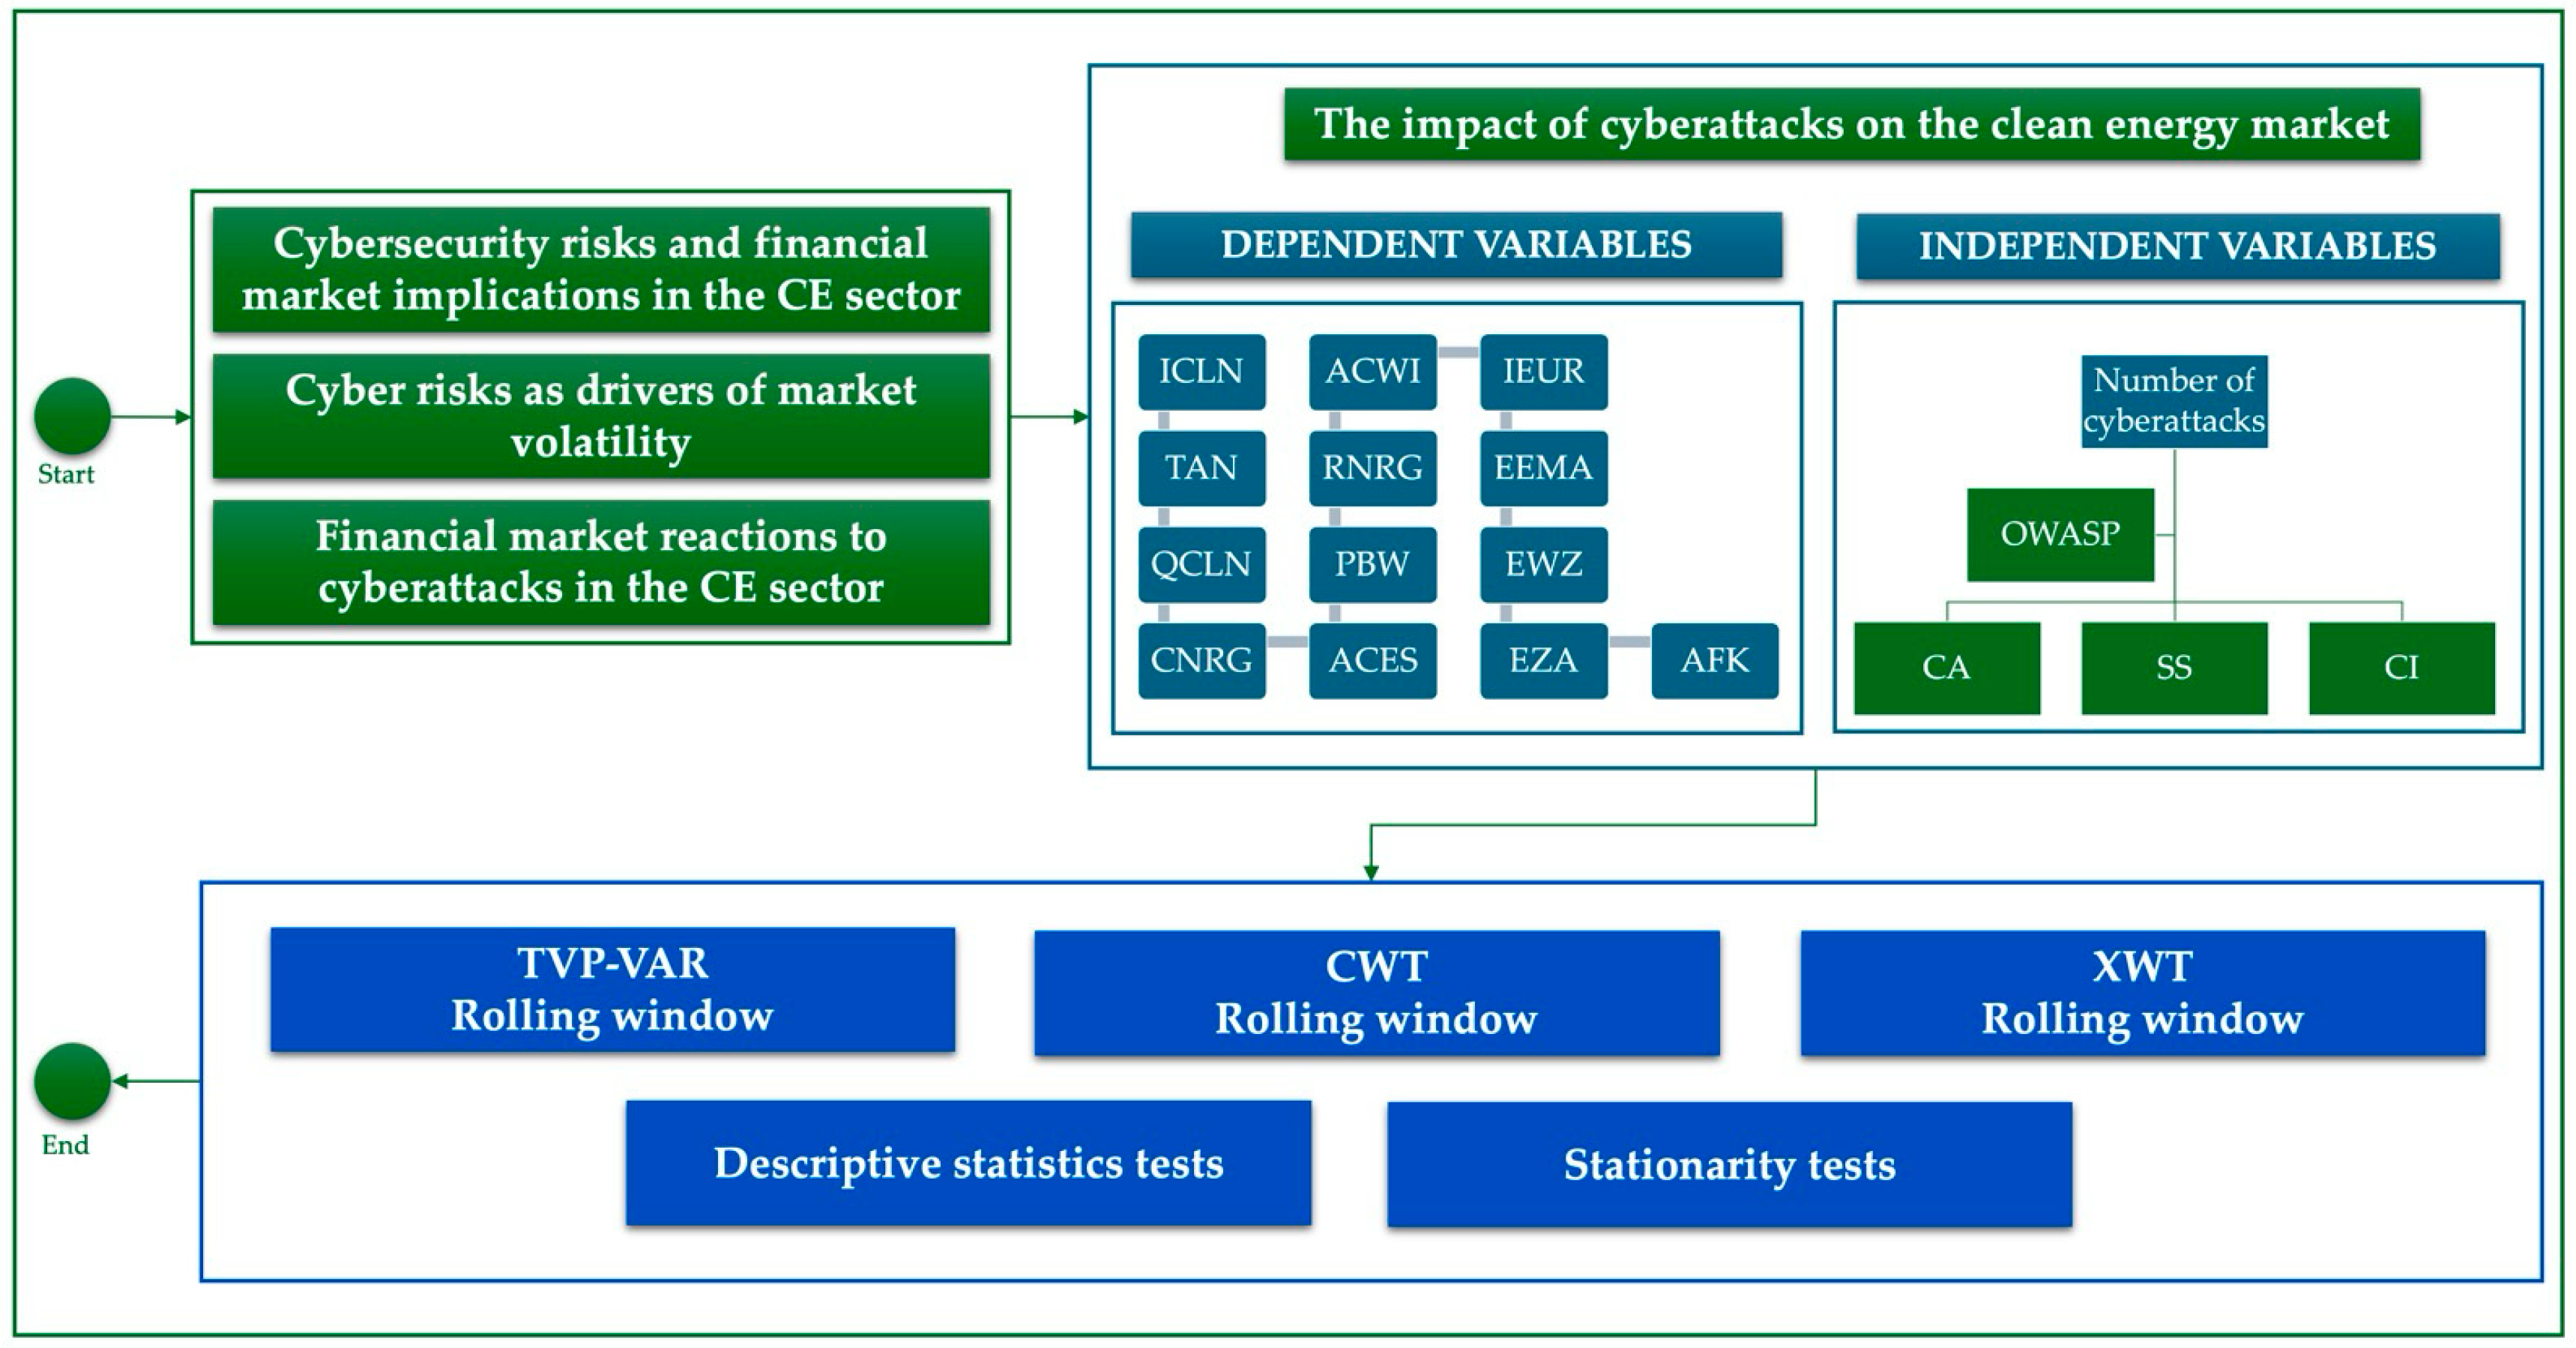
3. Data and Methodology
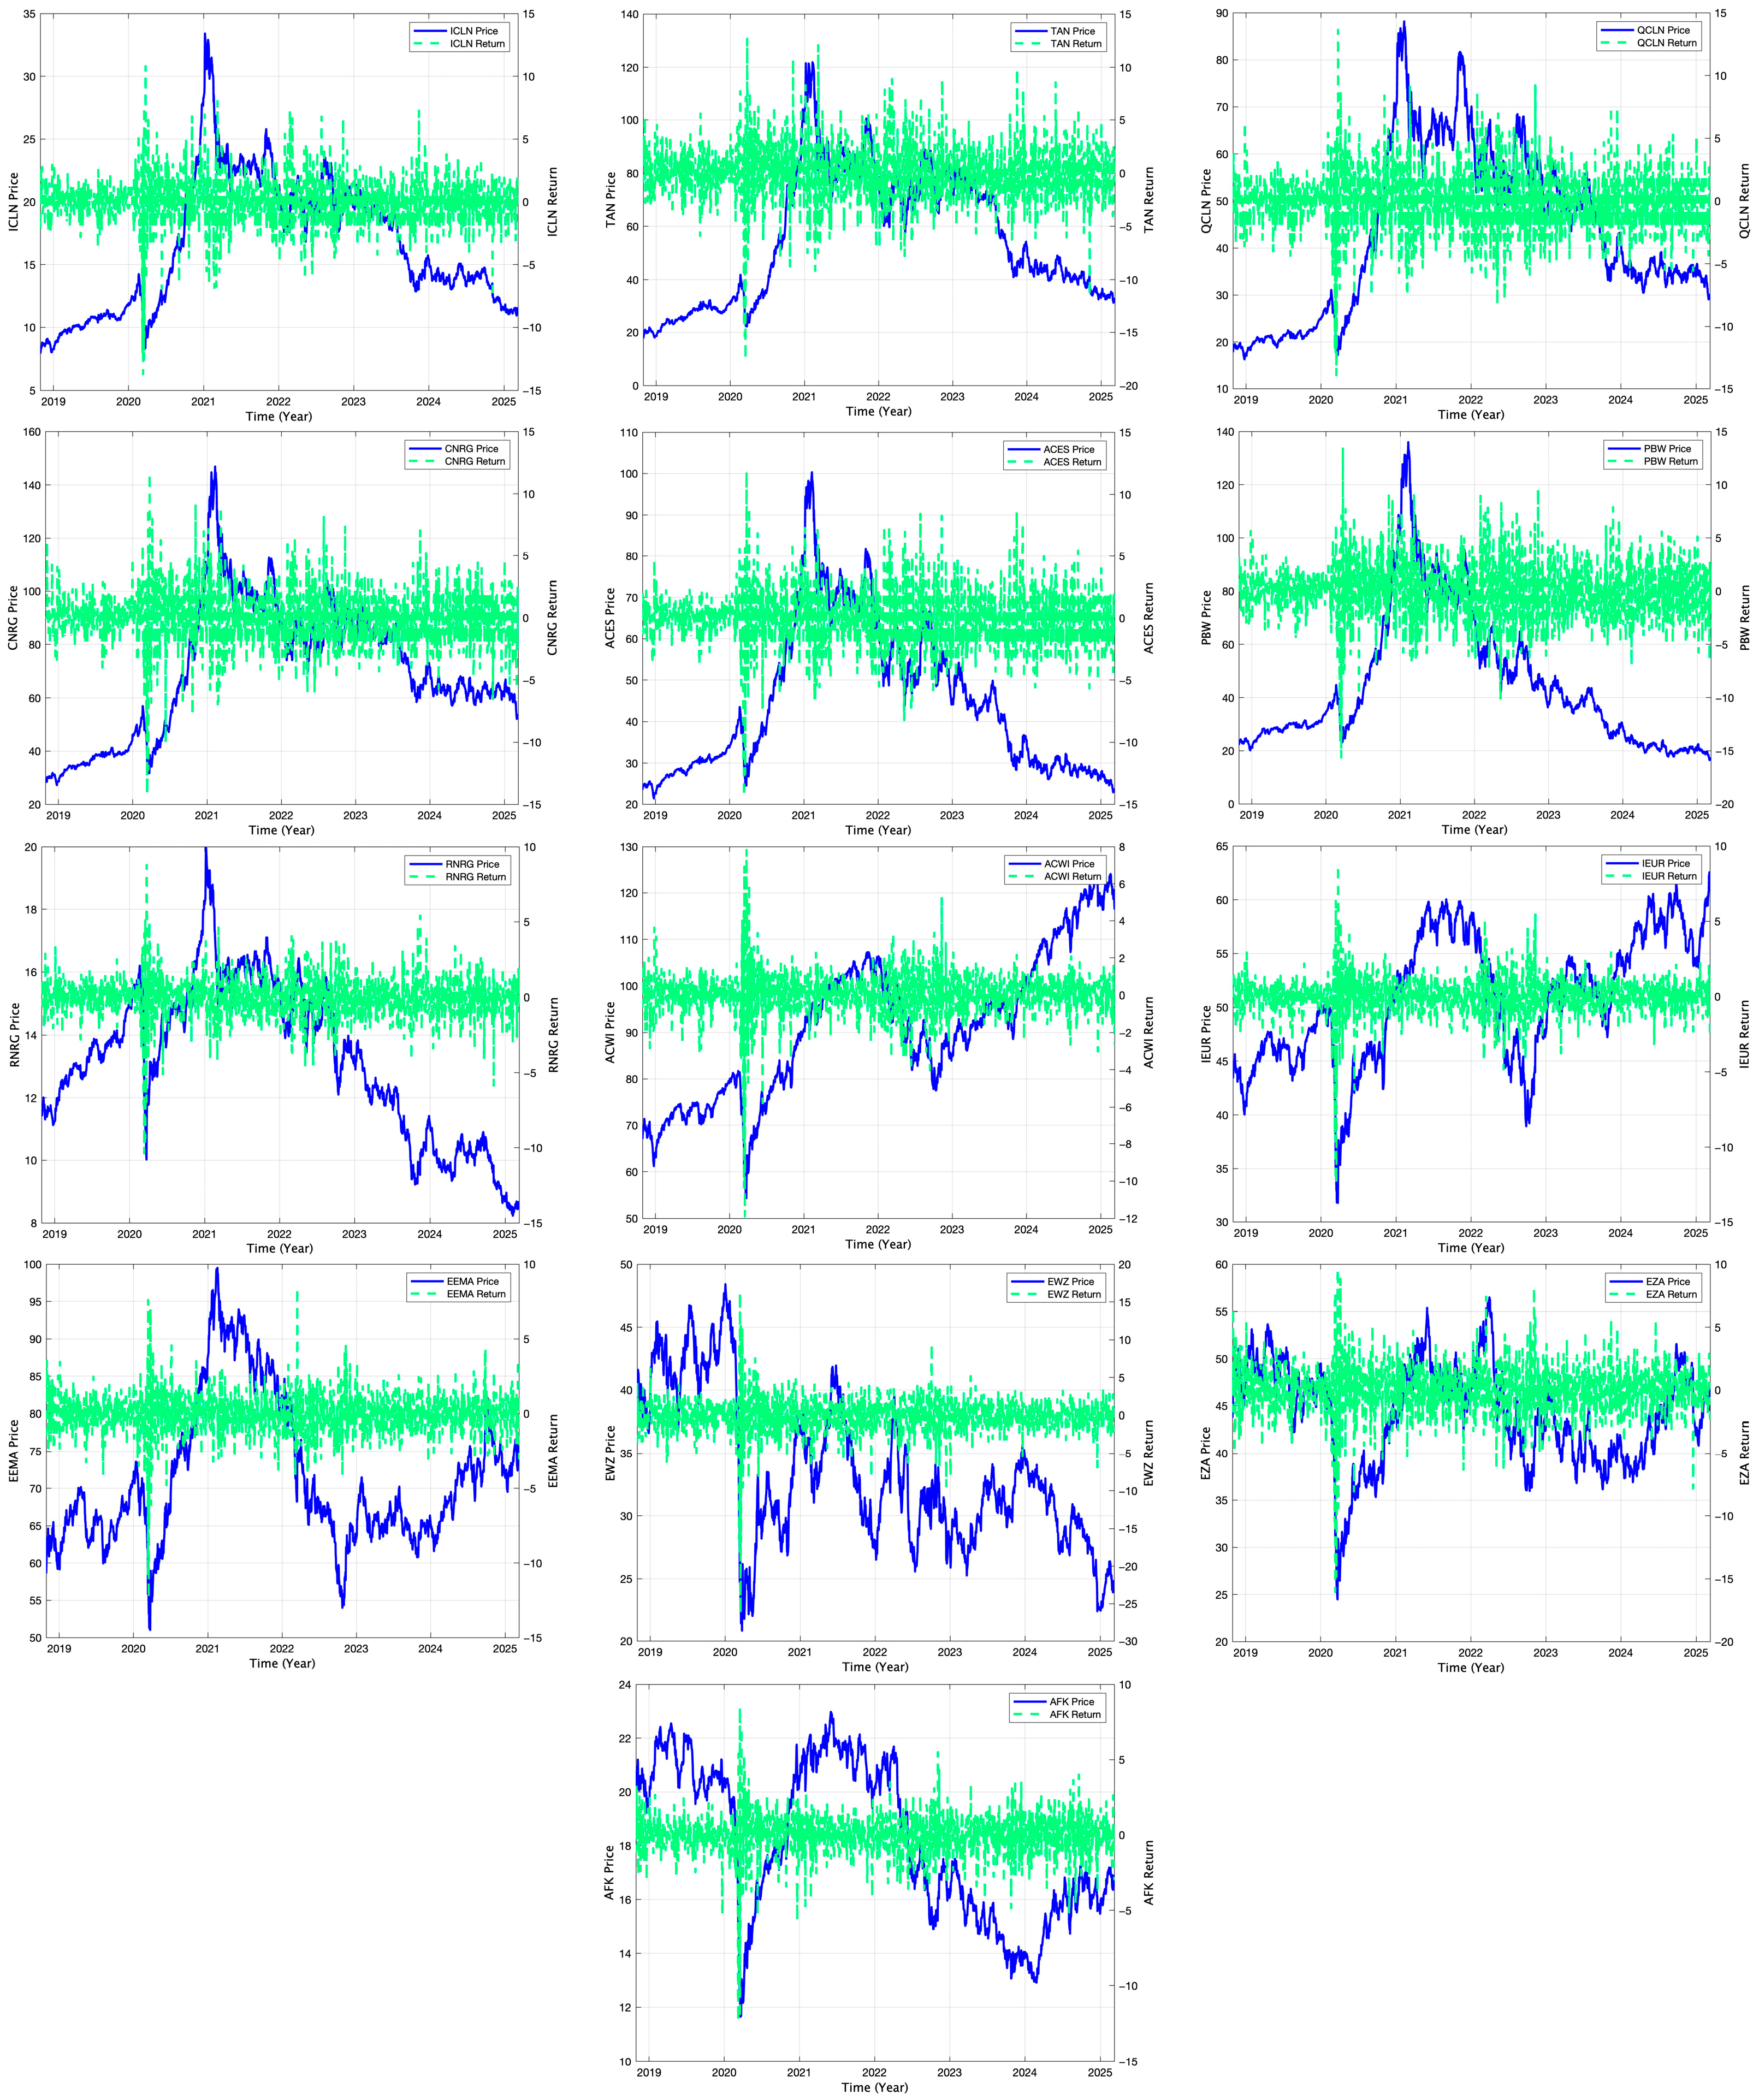
3.1. Sample and Data
3.2. Explanatory Variables
3.2.1. Dependent Variables
3.2.2. Independent Variables
- Number of cyberattacks. This variable represents the daily frequency of reported cyberattacks during the analysis period.
- Severity of cyberattacks. This continuous variable was calculated using the OWASP methodology. The resulting numeric scores provide a detailed assessment of each attack’s severity, allowing for a nuanced analysis of its potential to induce volatility in financial markets;
- Cyberattack intensity. The ratio between the number of attacks on a given day and the maximum number of attacks in the dataset, indicating the relative intensity of the attack on that day.
3.3. Analysis Methods
3.3.1. TVP-VAR Model Framework
3.3.2. CWT Method
3.4. Robustness Tests
4. Results
4.1. Statistical Summary
4.2. Stationarity Tests
4.3. Main Results of Econometric Analyses
4.3.1. TVP-VAR Model Results
4.3.2. CWT Results
4.3.3. Robustness Results
5. Discussion
5.1. Sectoral Sensitivities and the Role of Diversification in CE Markets
5.2. Influence of the Severity and Targeting of Attacks on CE Markets
5.3. Interaction with the Macroeconomic Context
6. Conclusions
Author Contributions
Funding
Data Availability Statement
Conflicts of Interest
Abbreviations
| CE | Clean Energy |
| IoT | Internet of Things |
| ETFs | Exchange-Traded Funds |
| TVP-VAR | Time-Varying Parameter Vector Autoregression |
| OWASP | Open Web Application Security Project |
| AI | Artificial Intelligence |
| ICLN | iShares Global Clean Energy ETF |
| TAN | Invesco Solar ETF |
| QCLN | First Trust NASDAQasdaq Clean Edge Green Energy ETF |
| CNRG | SPDR Kensho Clean Power ETF |
| ACES | ALPS Clean Energy ETF |
| PBW | Invesco Wilder Hill Clean Energy ETF |
| RNRG | Global X Renewable Energy Producers ETF |
| CA | Number of Cyberattacks |
| SS | Severity Score |
| CI | Targeted Critical Infrastructure |
| CWT | Continuous Wavelet Transform |
| XWT | Cross-Wavelet Transform |
| GFEVD | Generalized Forecast Error Variance Decomposition |
| IQR | Interquartile Range |
| ADF | Augmented Dickey–Fuller |
| PP | Phillips–Perron |
| KPSS | Kwiatkowski–Phillips–Schmidt–Shin |
Appendix A. Results of TVP-VAR Analysis
| Window | CA | SS | CI |
| 1 |  | ||
| 2 |  | ||
| 3 |  | ||
| 4 |  | ||
| 5 |  | ||
| 6 |  | ||
| 7 |  | ||
| 8 |  | ||
| 9 |  | ||
Appendix B. Wavelet Analysis Results
| Index | CWT Windows |
| ICLN |  |
 | |
 | |
| CA | |
 | |
 | |
 | |
| SS | |
 | |
 | |
 | |
| CI | |
| TAN | 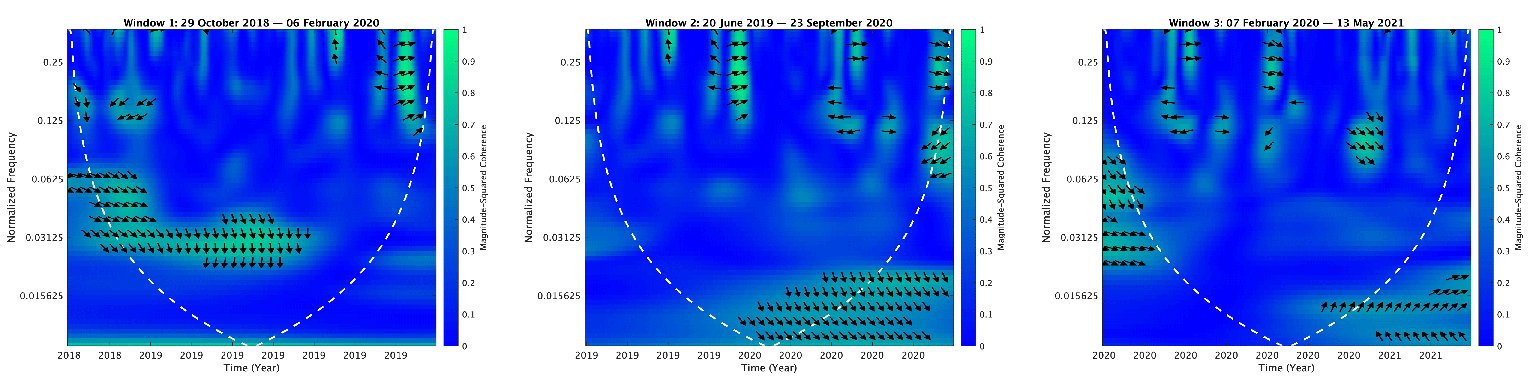 |
 | |
 | |
| CA | |
 | |
 | |
 | |
| SS | |
 | |
 | |
 | |
| CI | |
| QCLN | 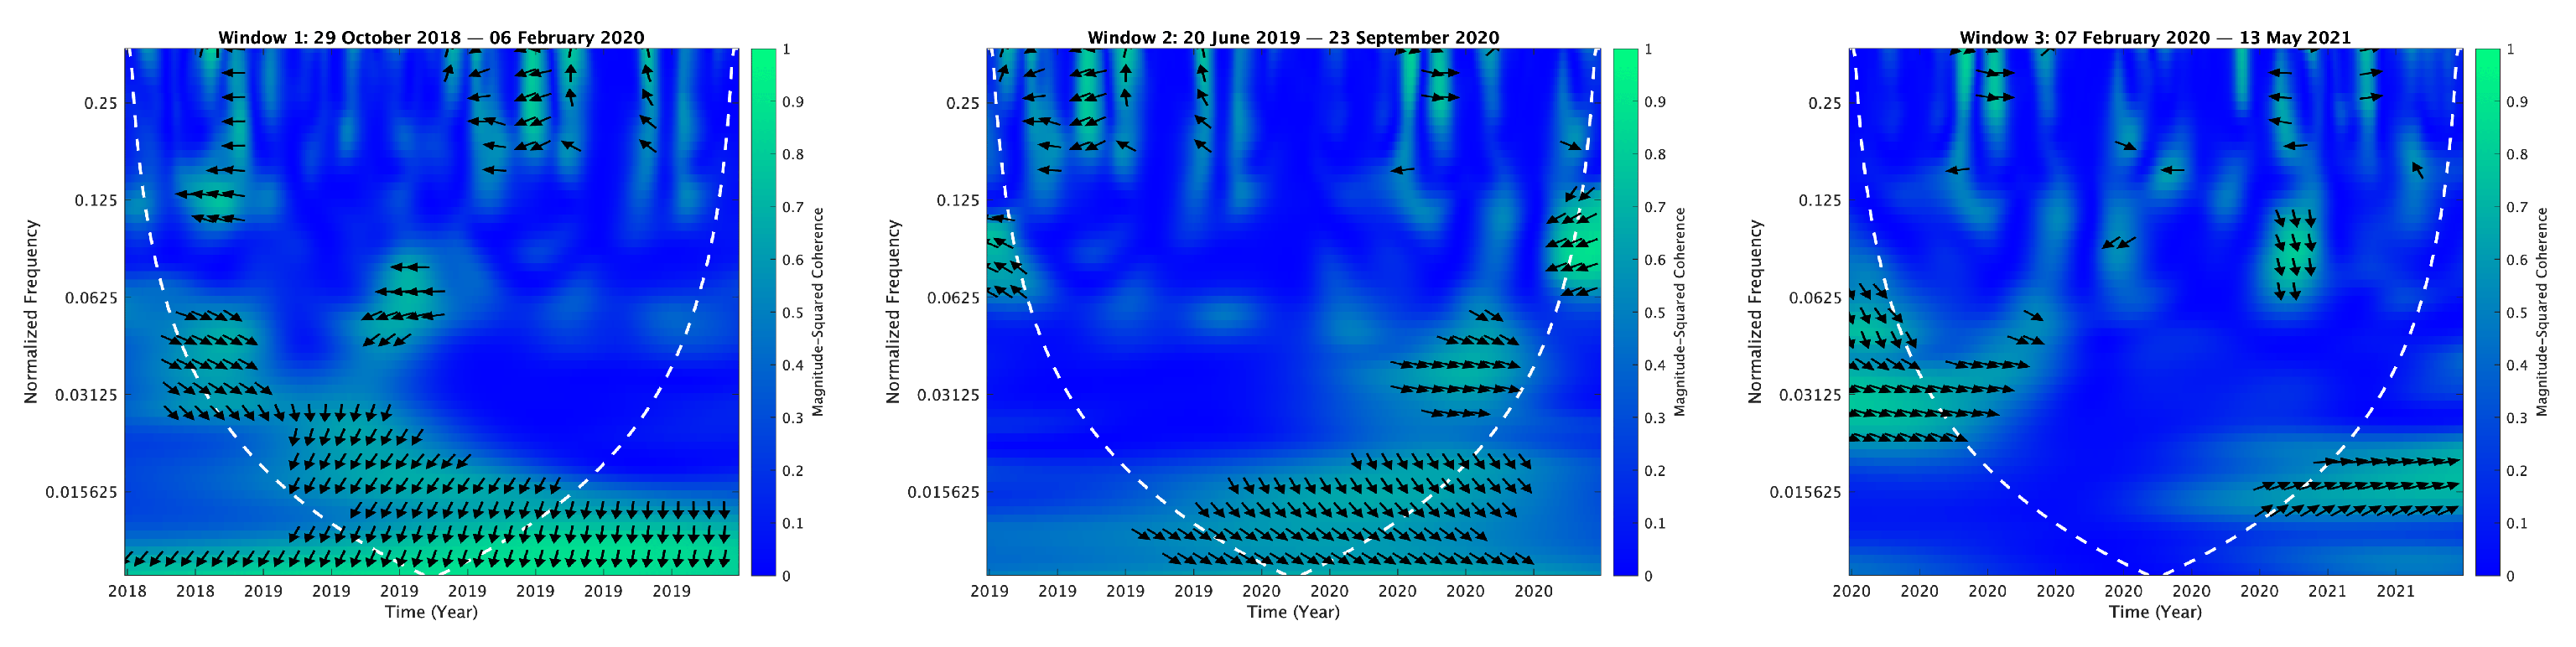 |
 | |
 | |
| CA | |
 | |
 | |
 | |
| SS | |
 | |
 | |
 | |
| CI | |
| CNRG | 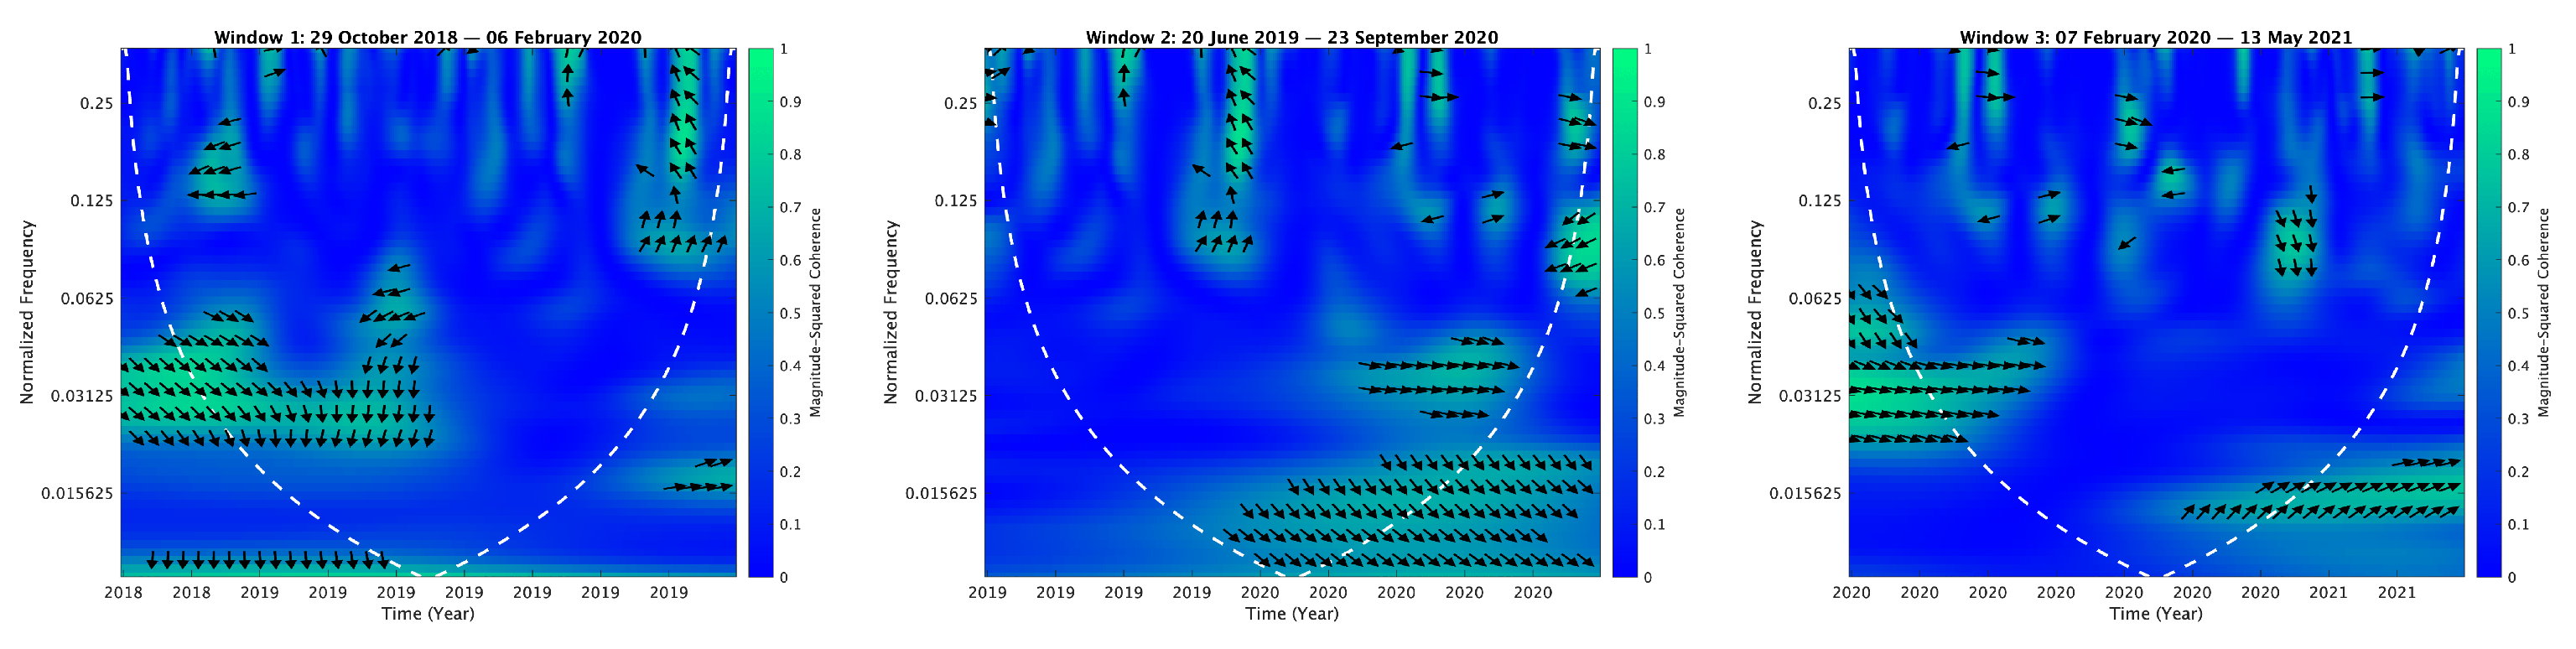 |
 | |
 | |
| CA | |
 | |
 | |
 | |
| SS | |
 | |
 | |
 | |
| CI | |
| ACES |  |
 | |
 | |
| CA | |
 | |
 | |
 | |
| SS | |
 | |
 | |
 | |
| CI | |
| PBW | 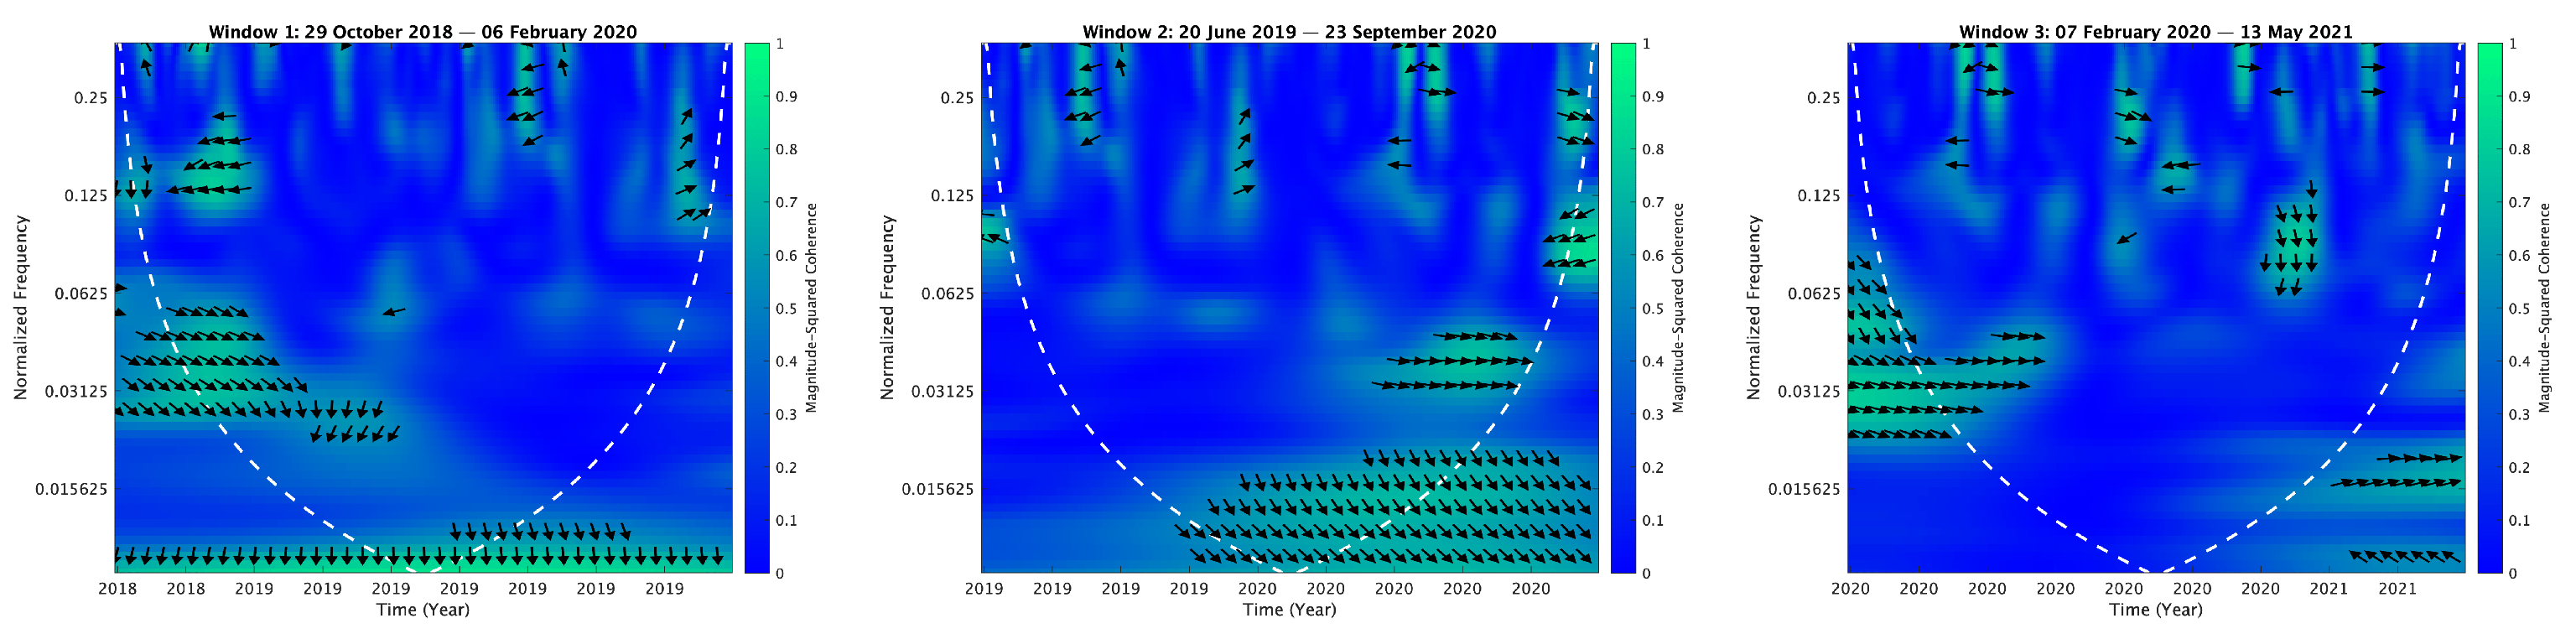 |
 | |
 | |
| CA | |
 | |
 | |
 | |
| SS | |
 | |
 | |
 | |
| CI | |
| RNRG | 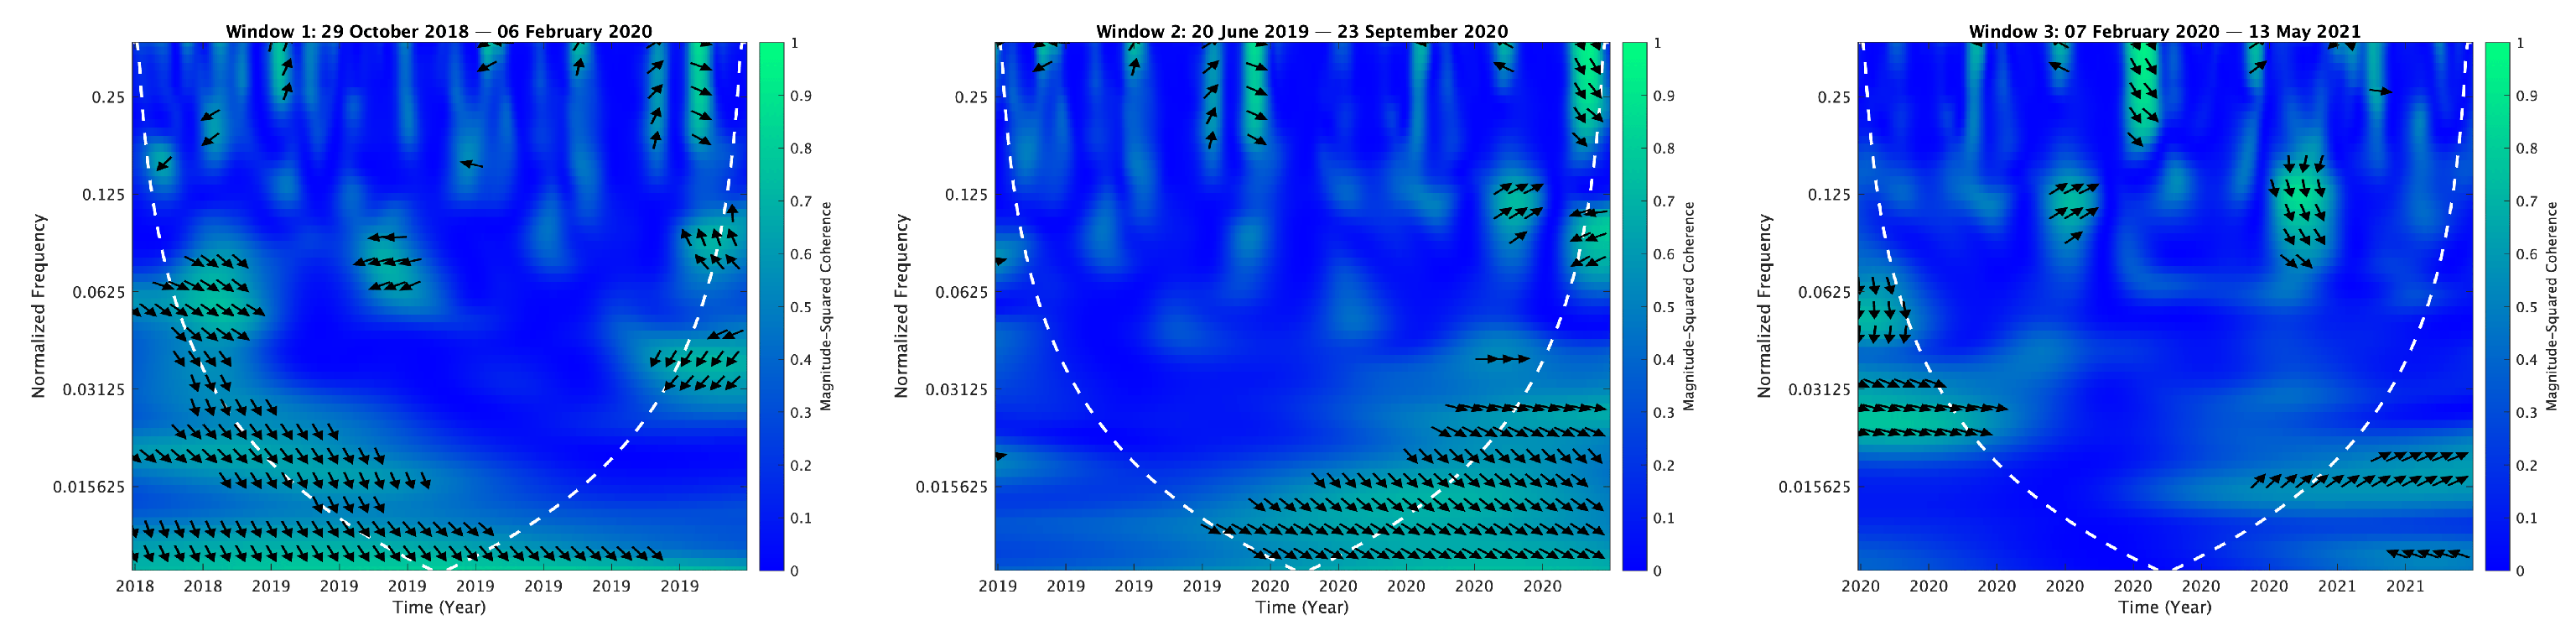 |
 | |
 | |
| CA | |
 | |
 | |
 | |
| SS | |
 | |
 | |
 | |
| CI | |
| ACWI | 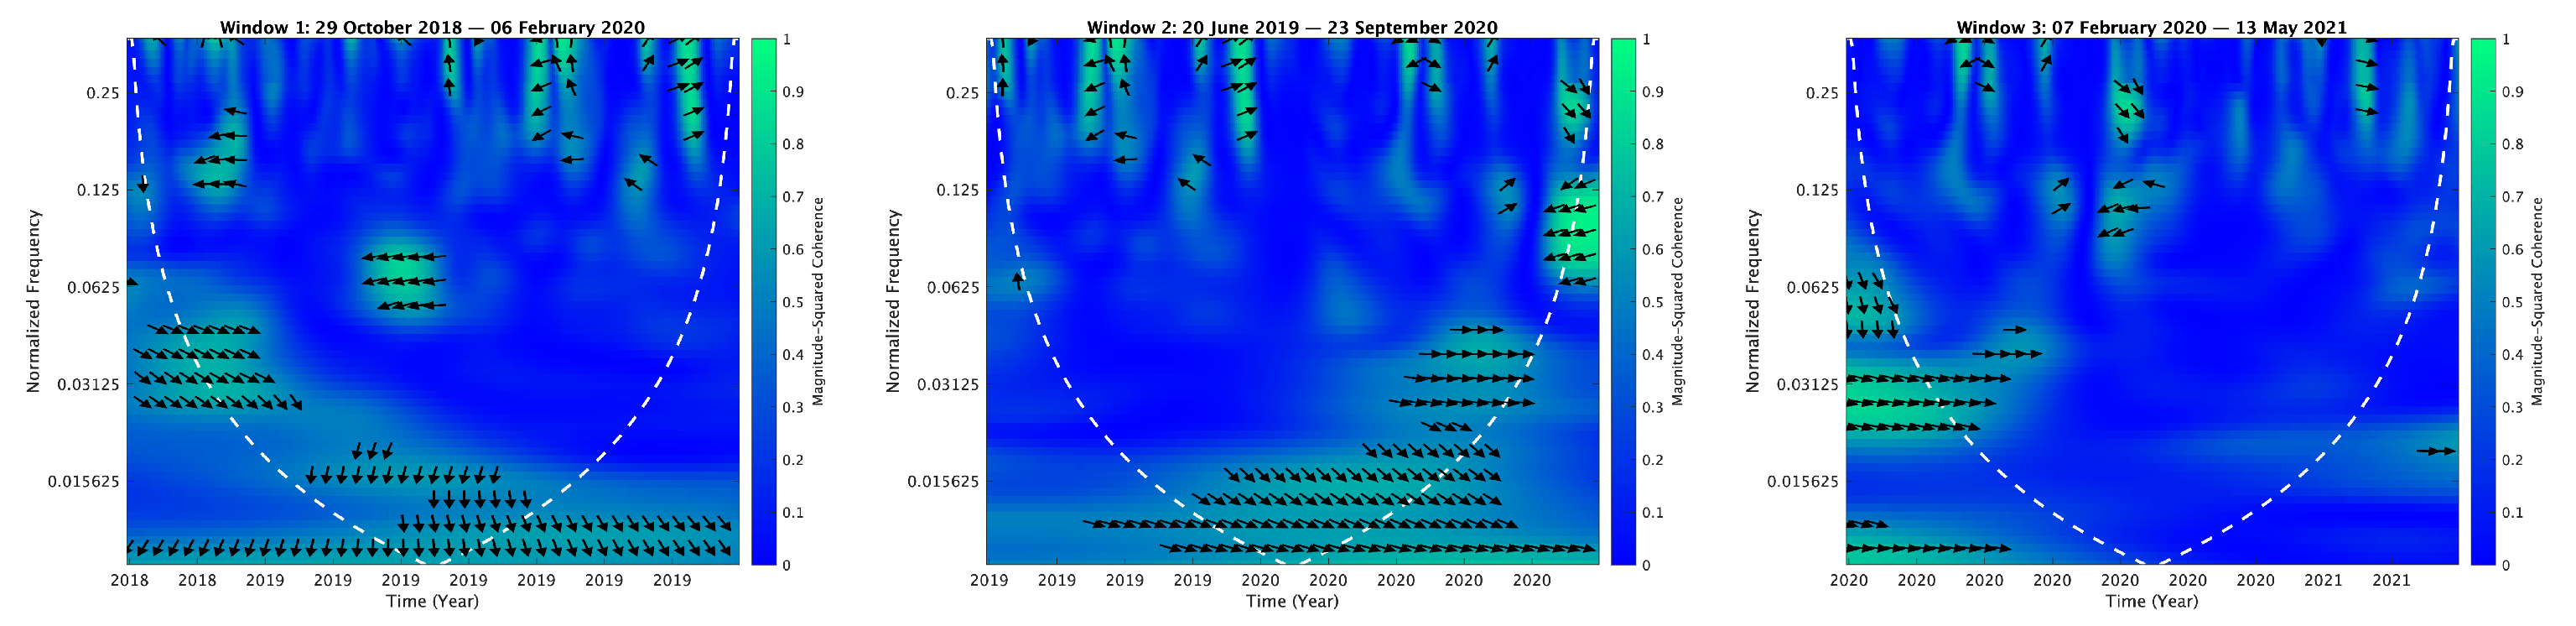 |
 | |
 | |
| CA | |
 | |
 | |
 | |
| SS | |
 | |
 | |
 | |
| CI | |
| IEUR | 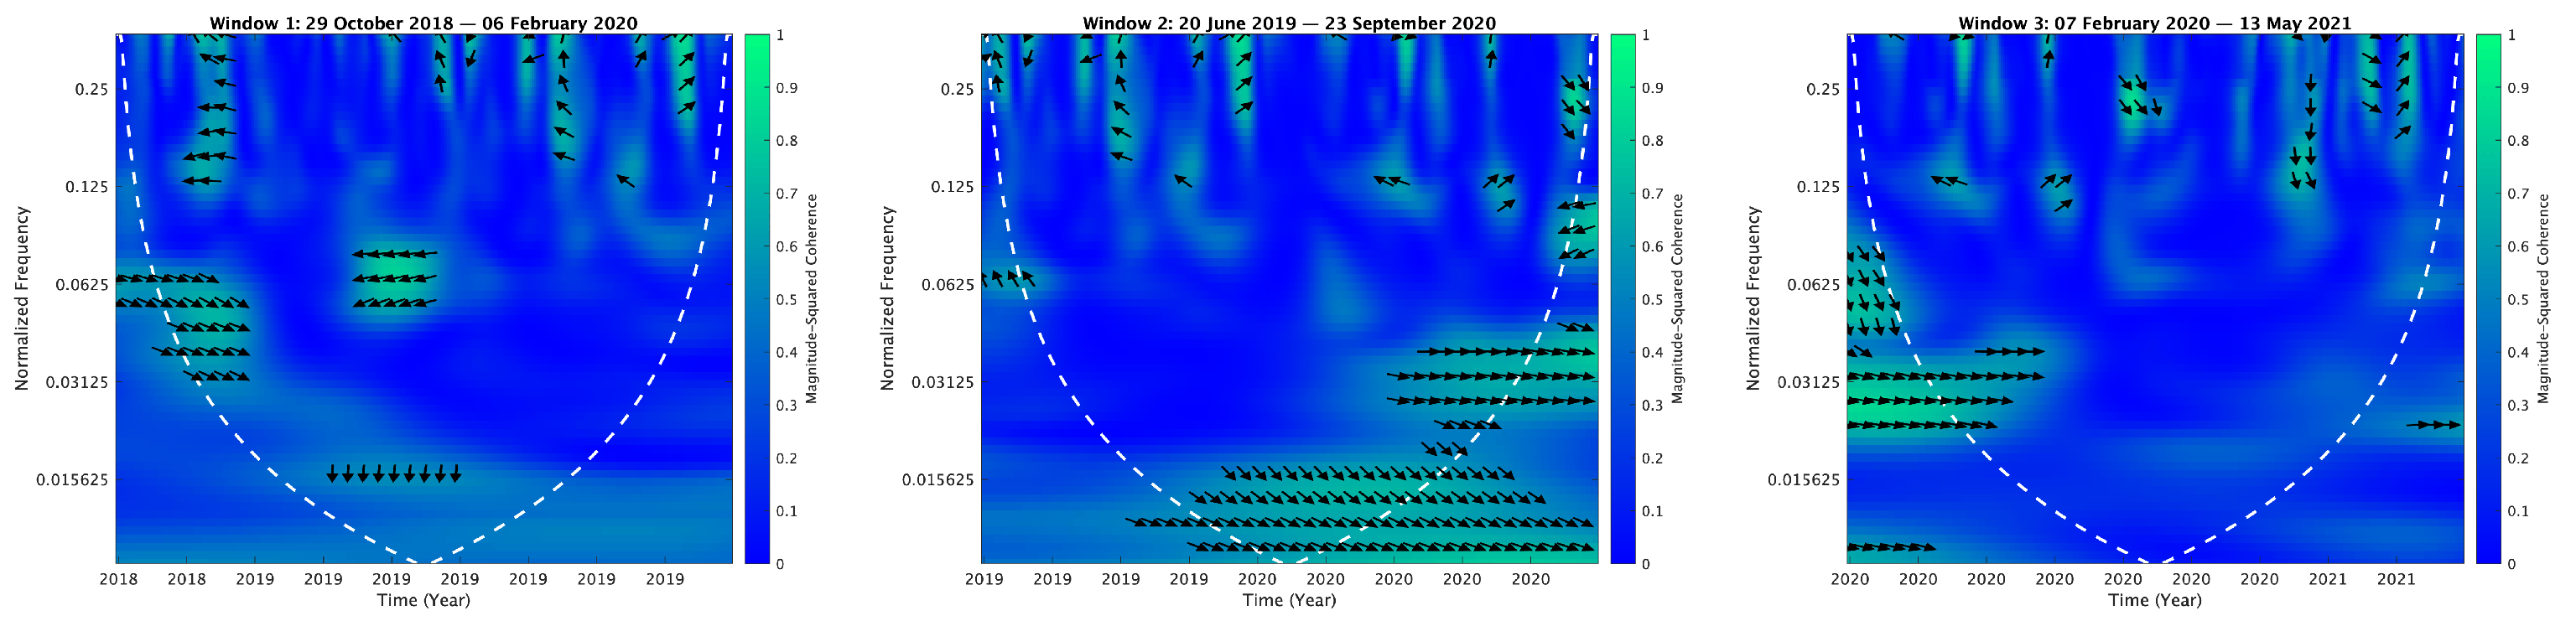 |
 | |
 | |
| CA | |
 | |
 | |
 | |
| SS | |
 | |
 | |
 | |
| CI | |
| EEMA |  |
 | |
 | |
| CA | |
 | |
 | |
 | |
| SS | |
 | |
 | |
 | |
| CI | |
| EWZ | 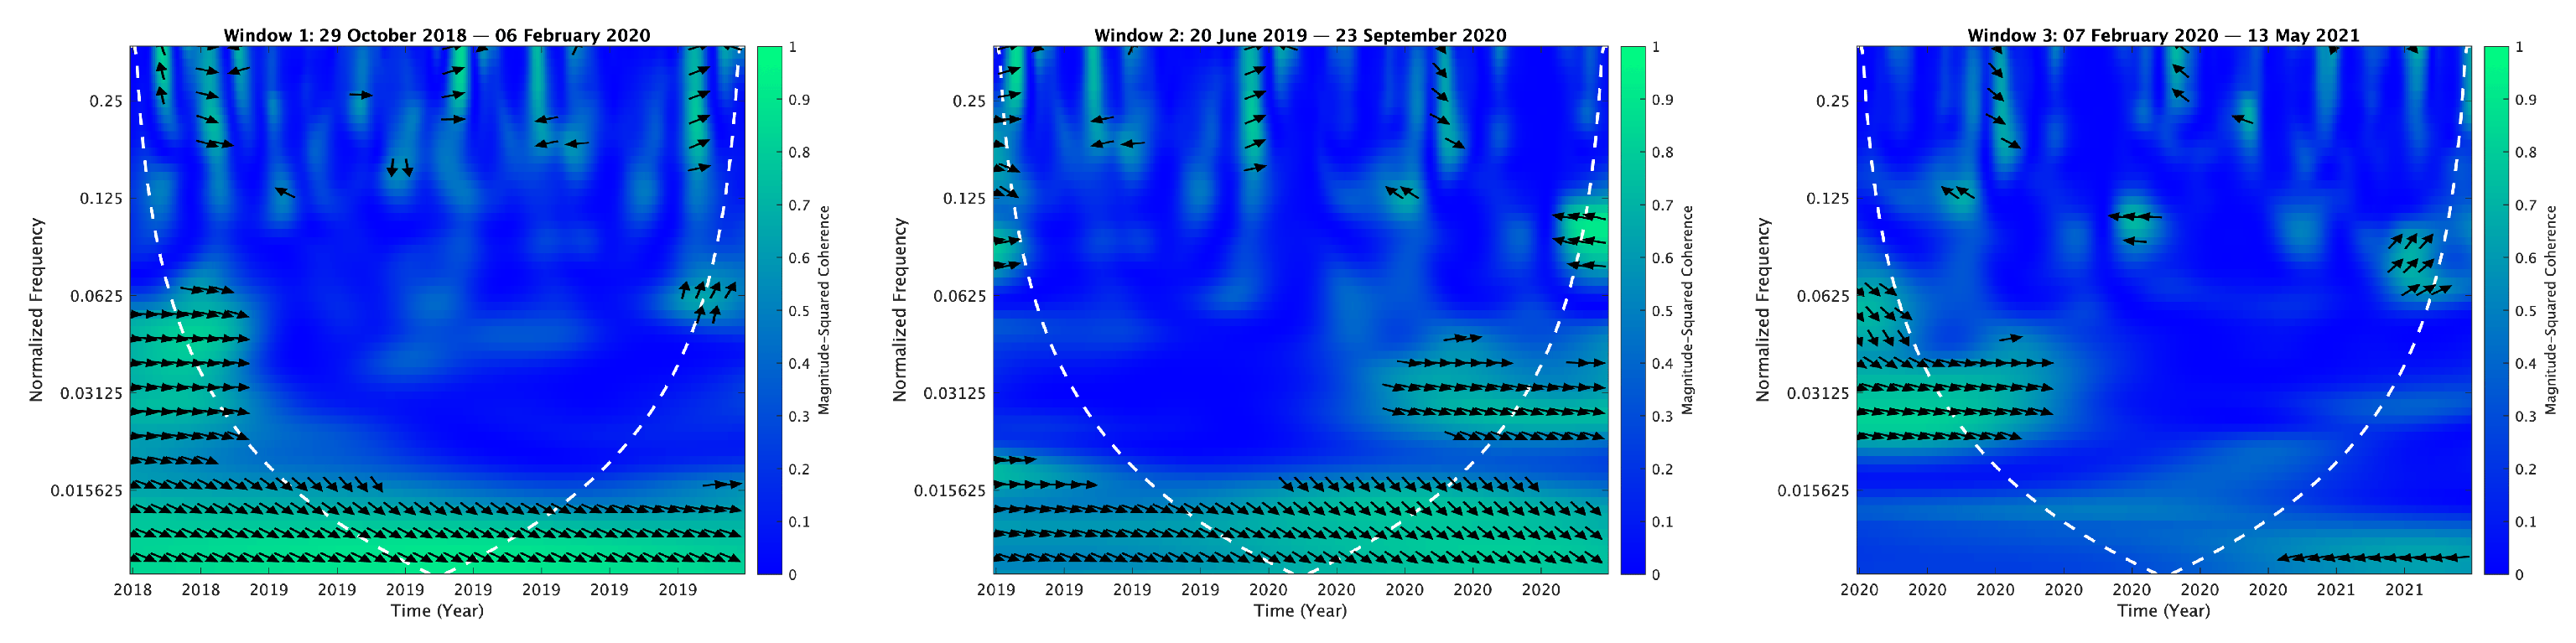 |
 | |
 | |
| CA | |
 | |
 | |
 | |
| SS | |
 | |
 | |
 | |
| CI | |
| EZA | 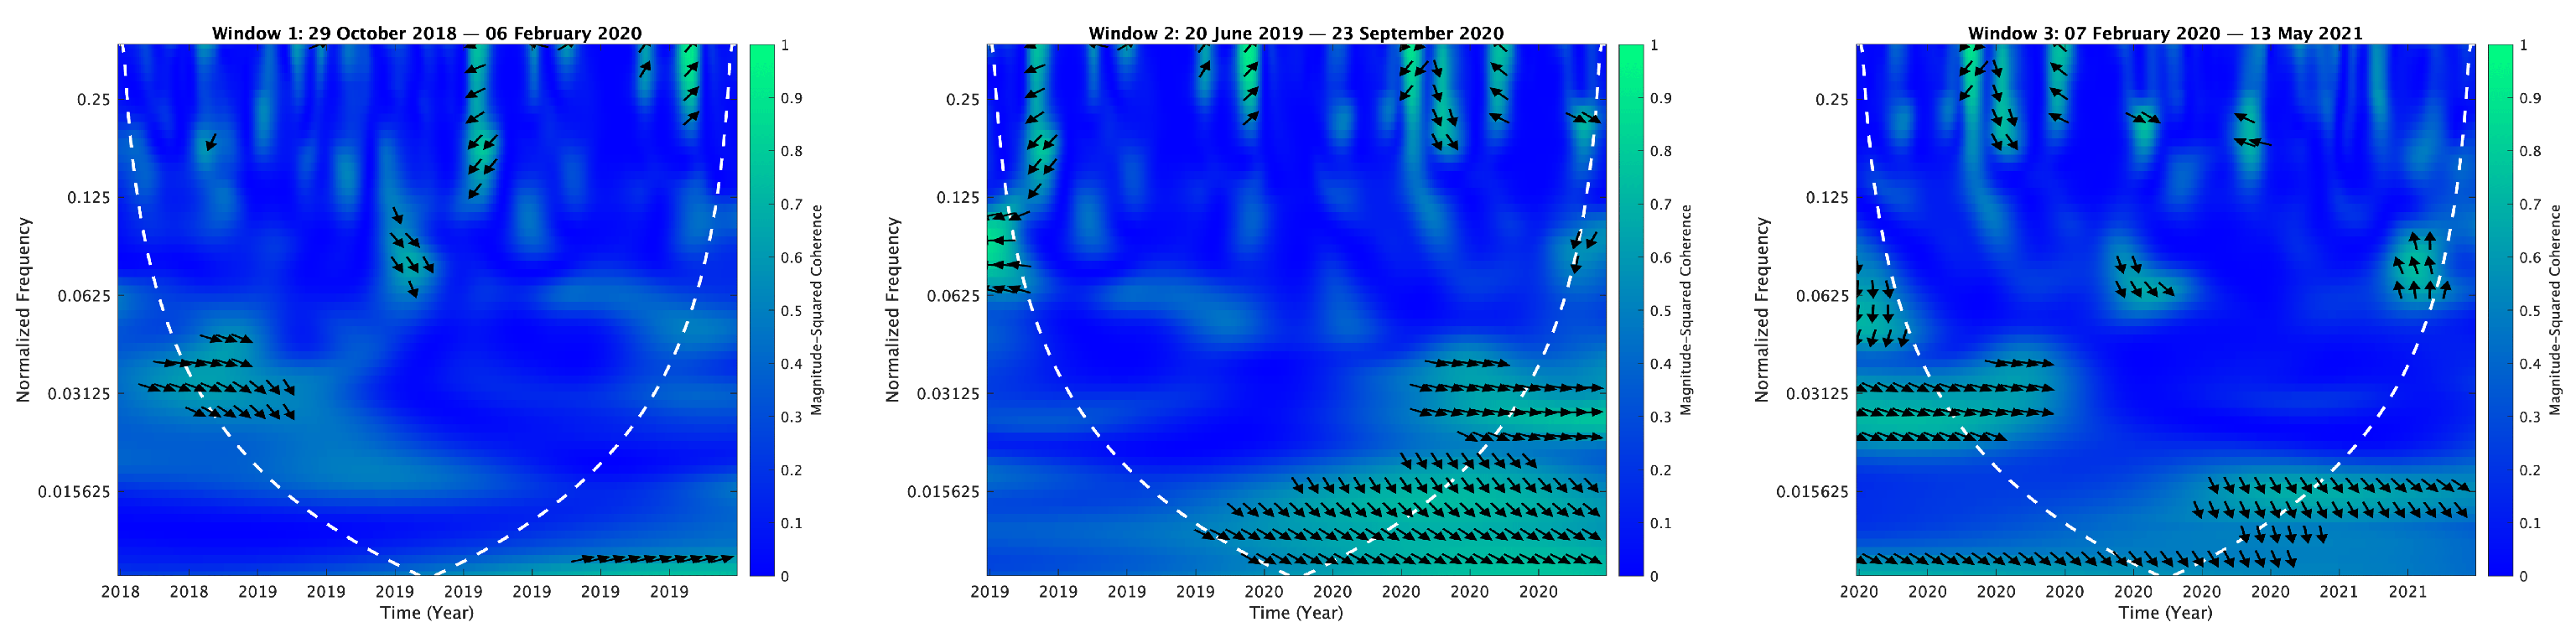 |
 | |
 | |
| CA | |
 | |
 | |
 | |
| SS | |
 | |
 | |
 | |
| CI | |
| AFK |  |
 | |
 | |
| CA | |
 | |
 | |
 | |
| SS | |
 | |
 | |
 | |
| CI | |
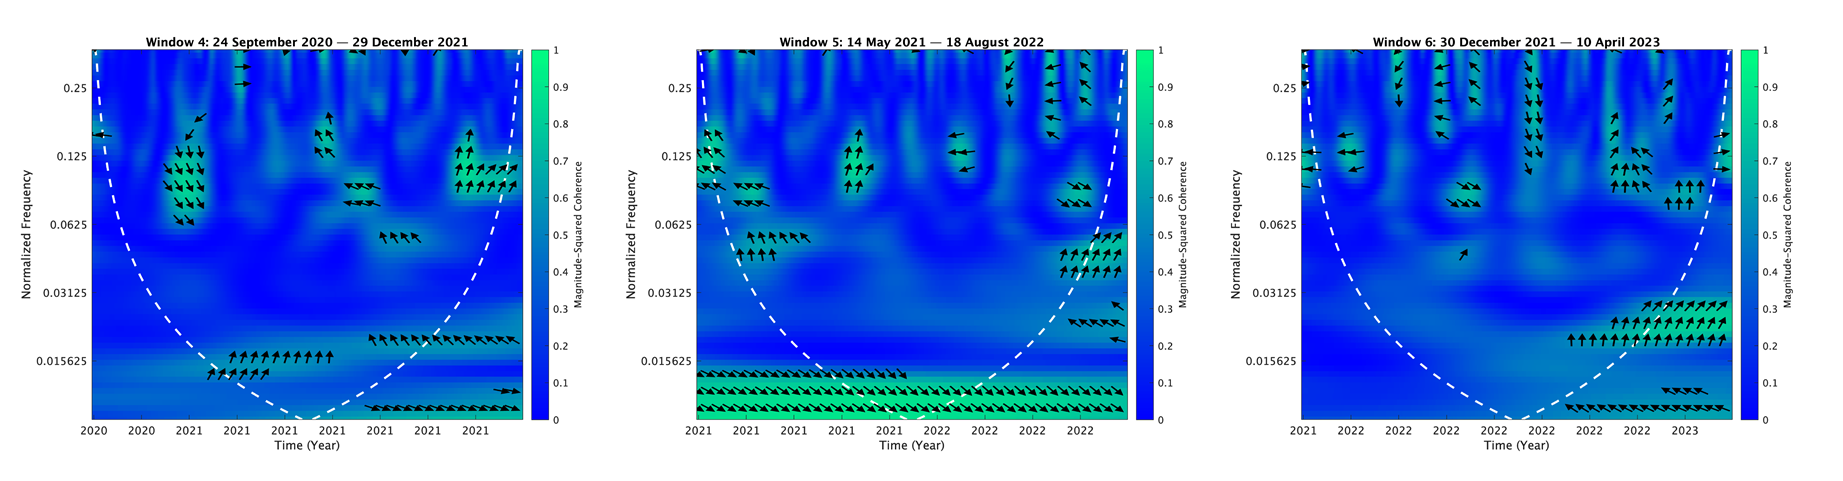
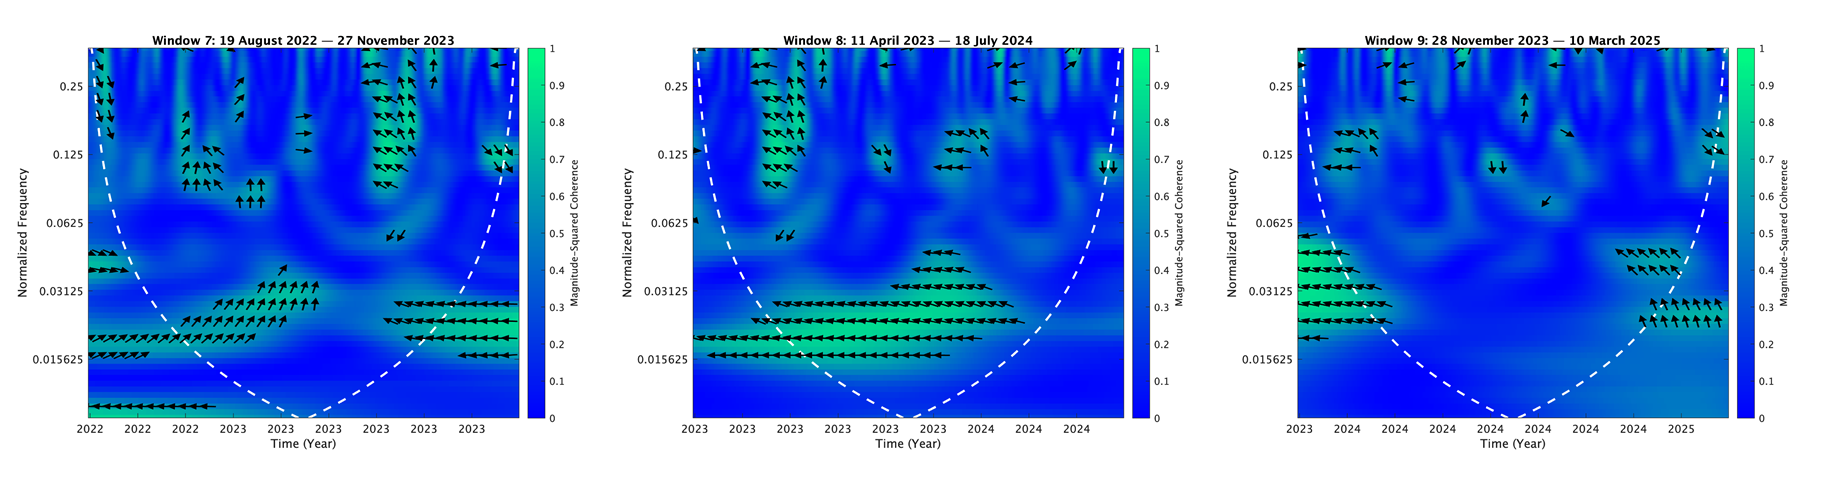
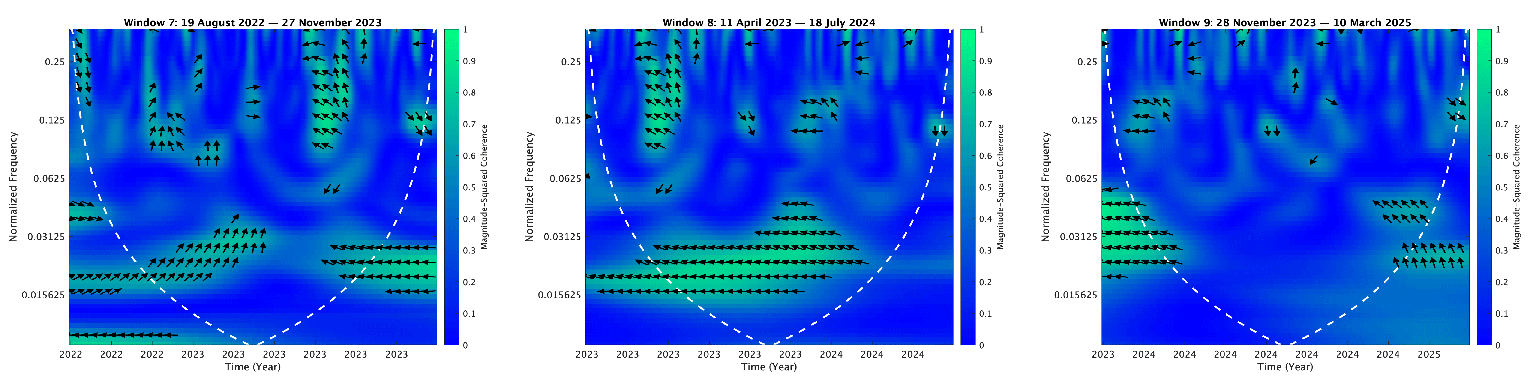
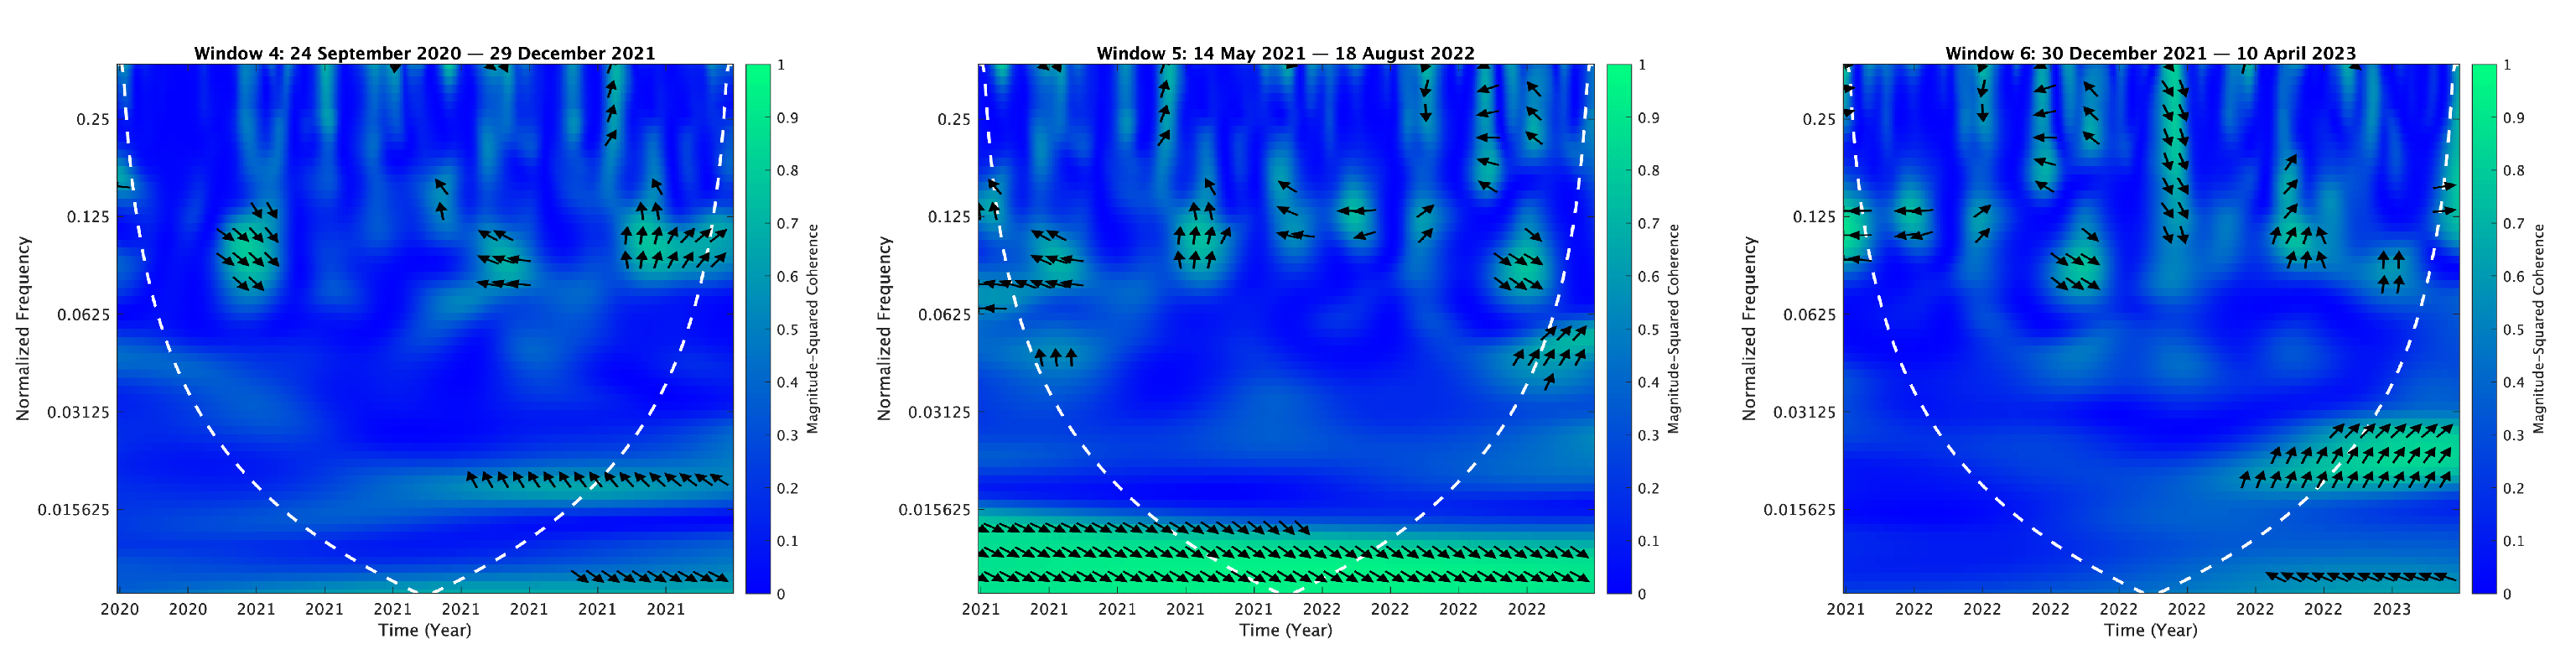
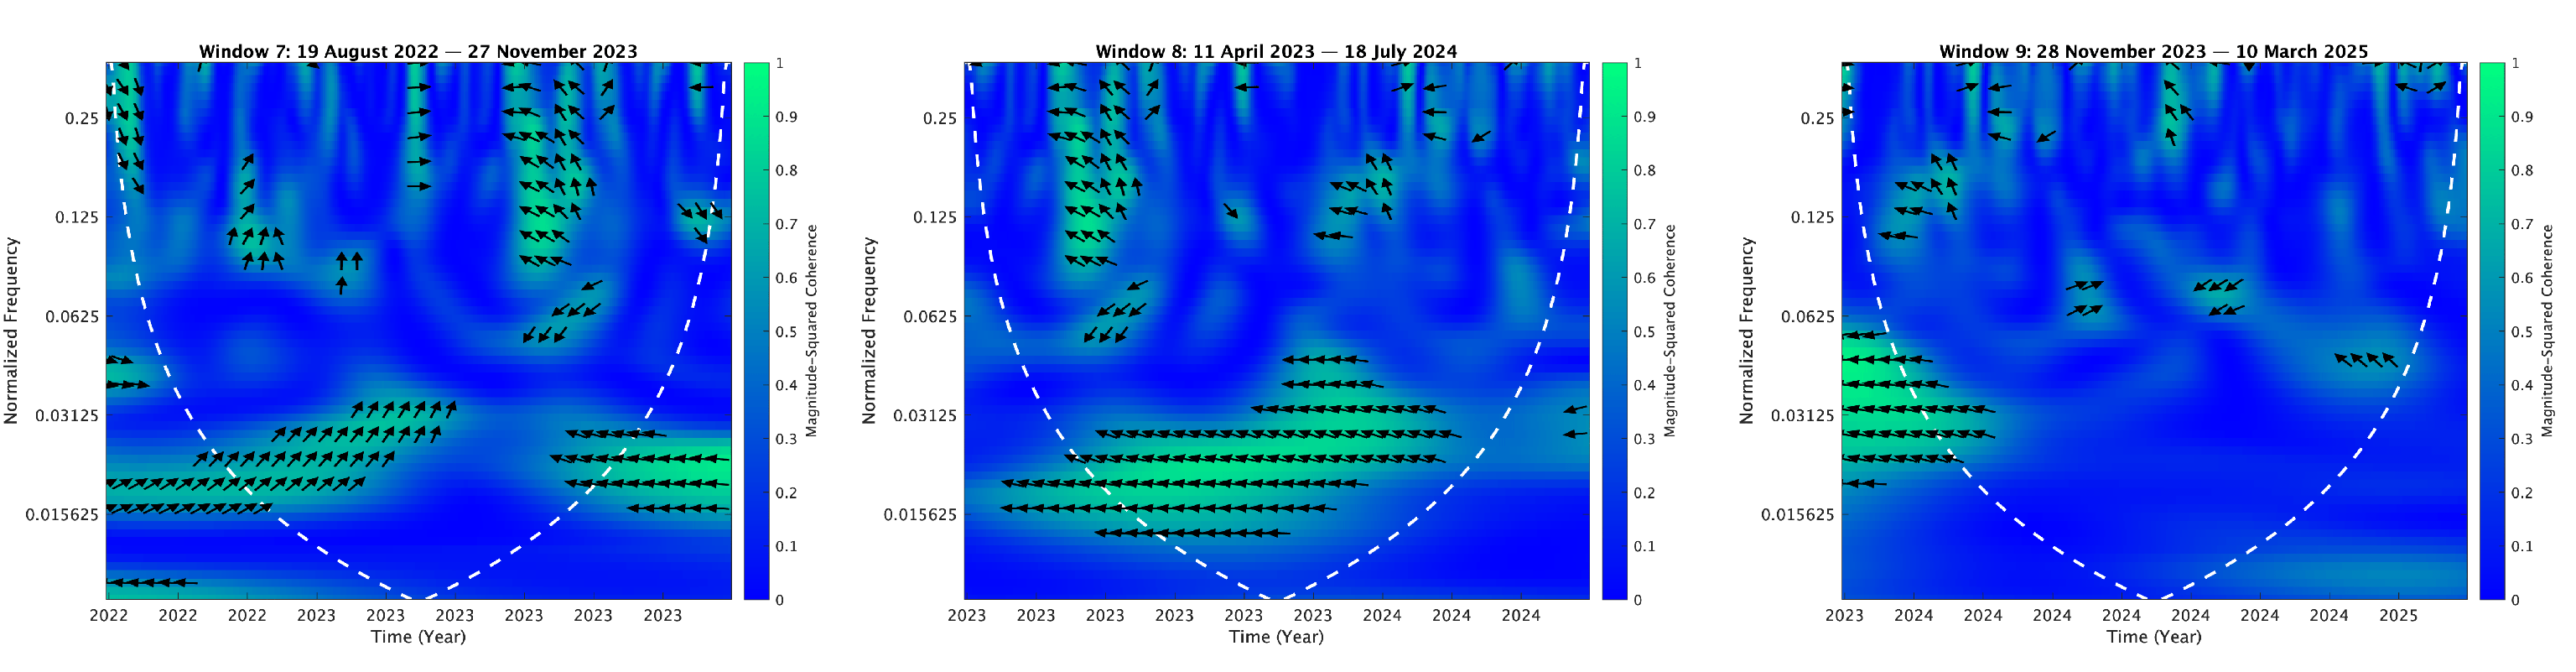
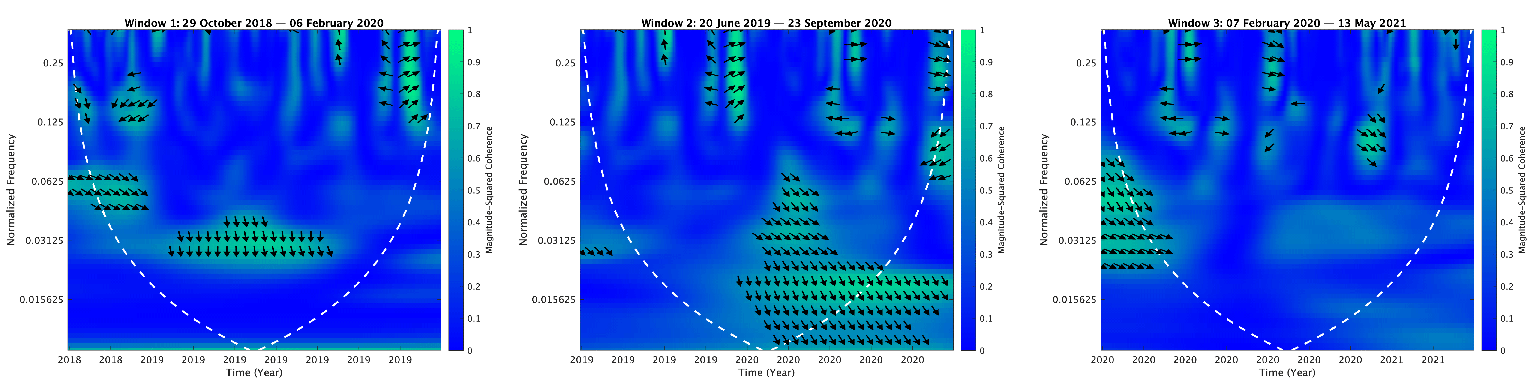
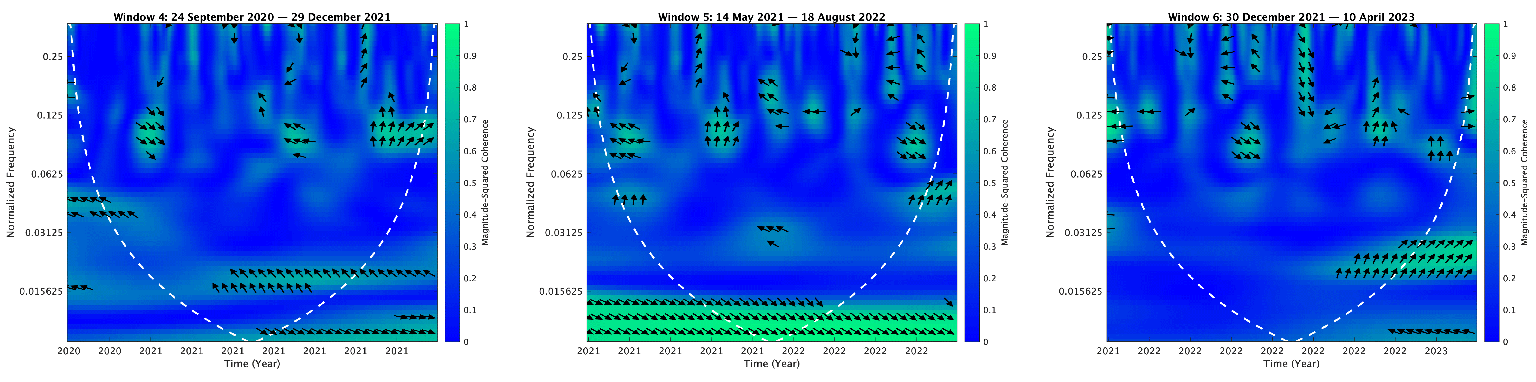
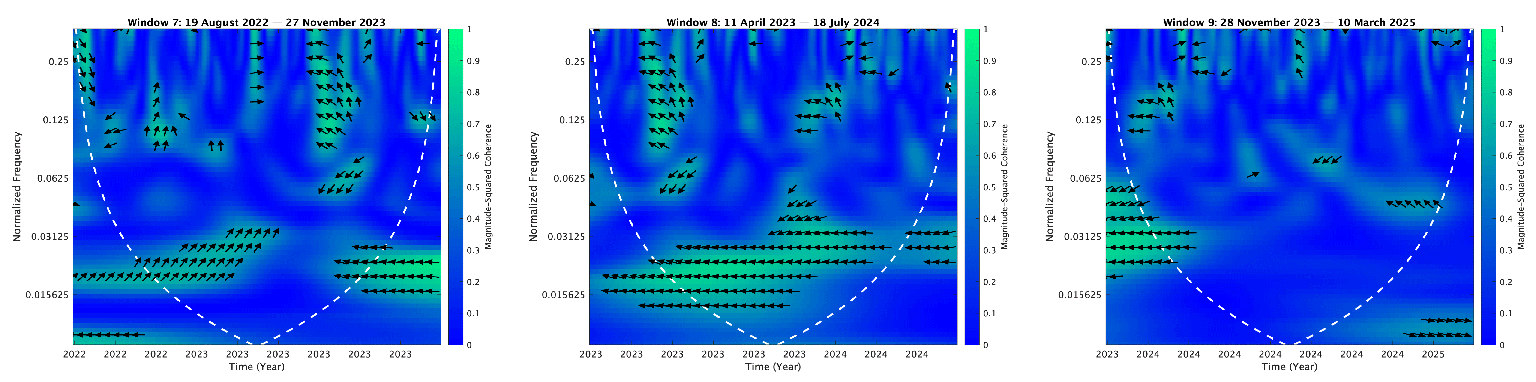
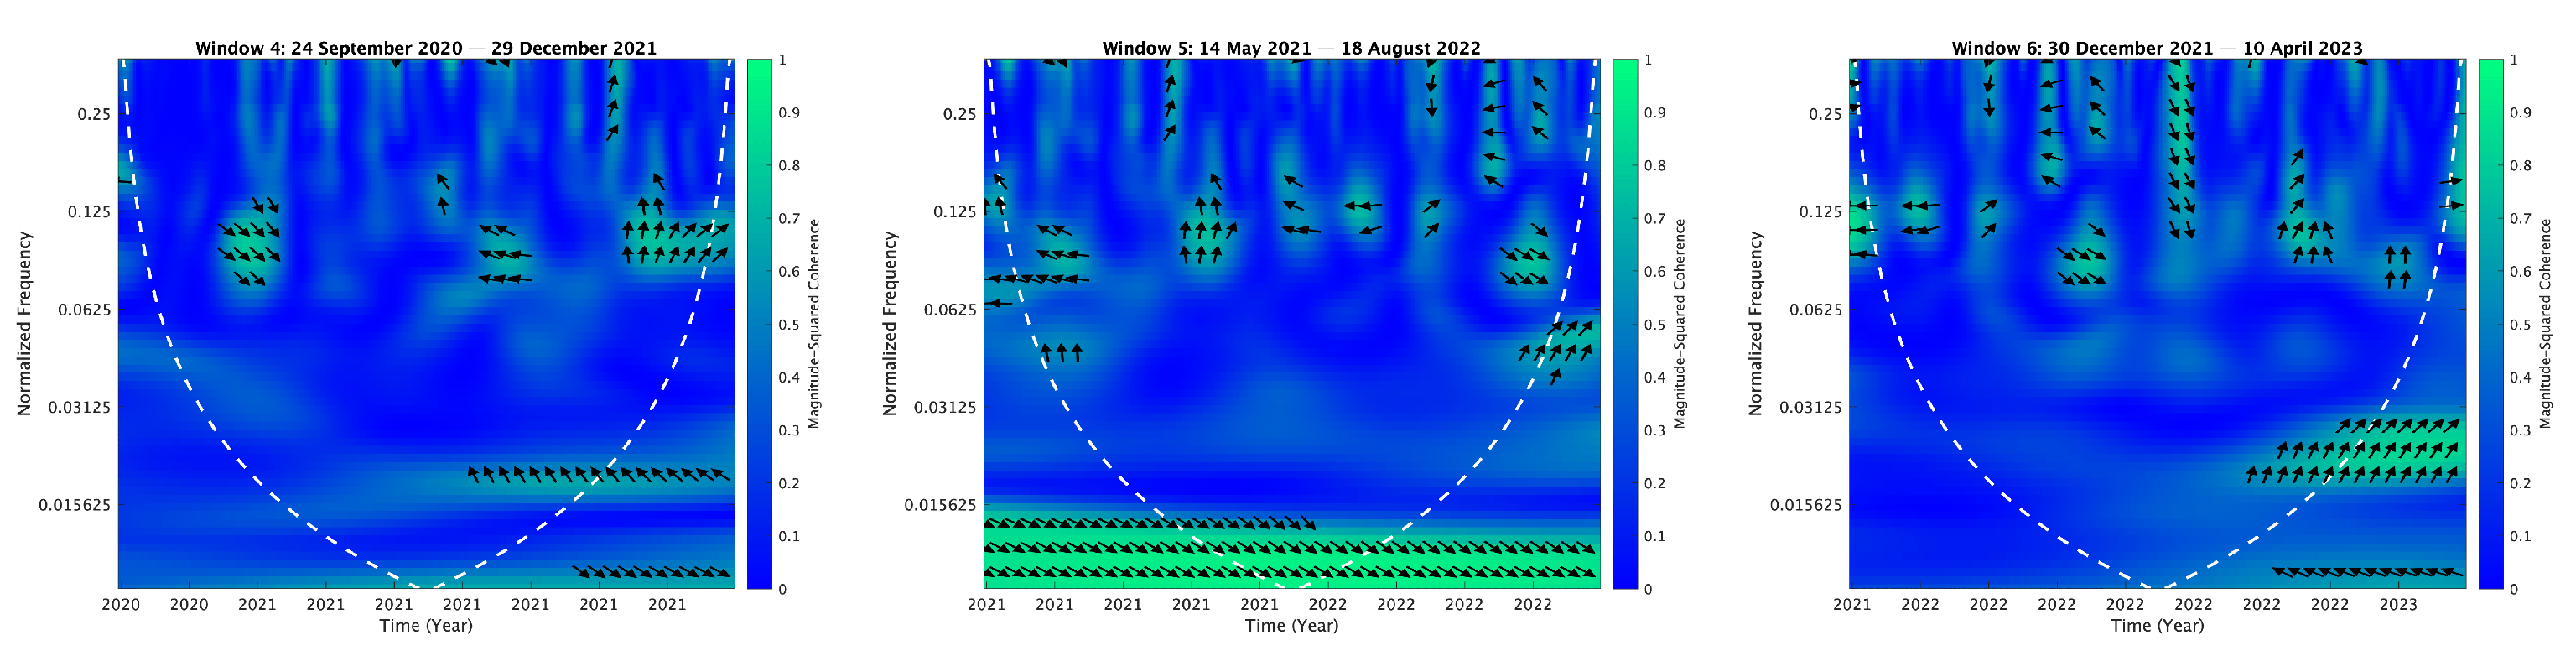
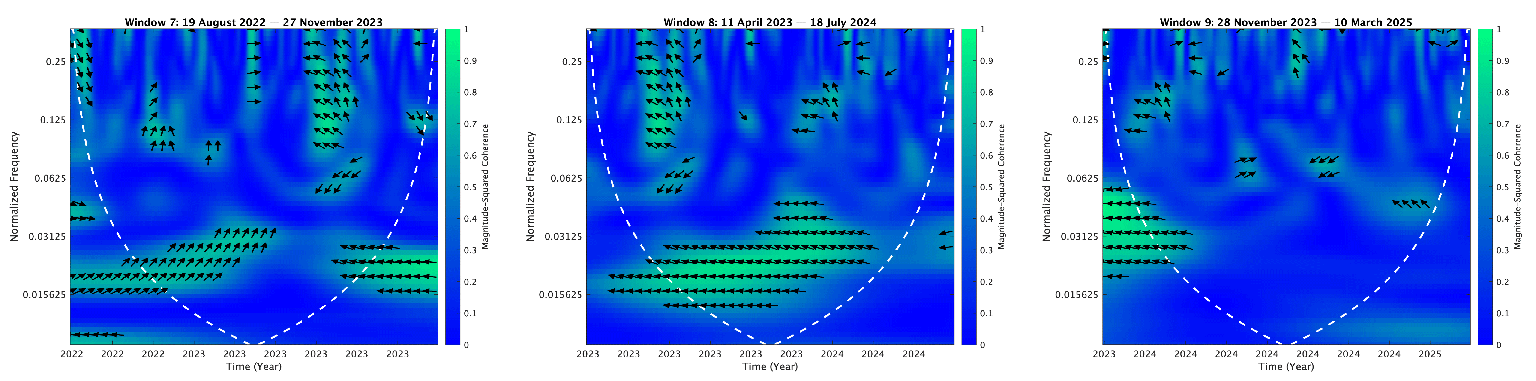
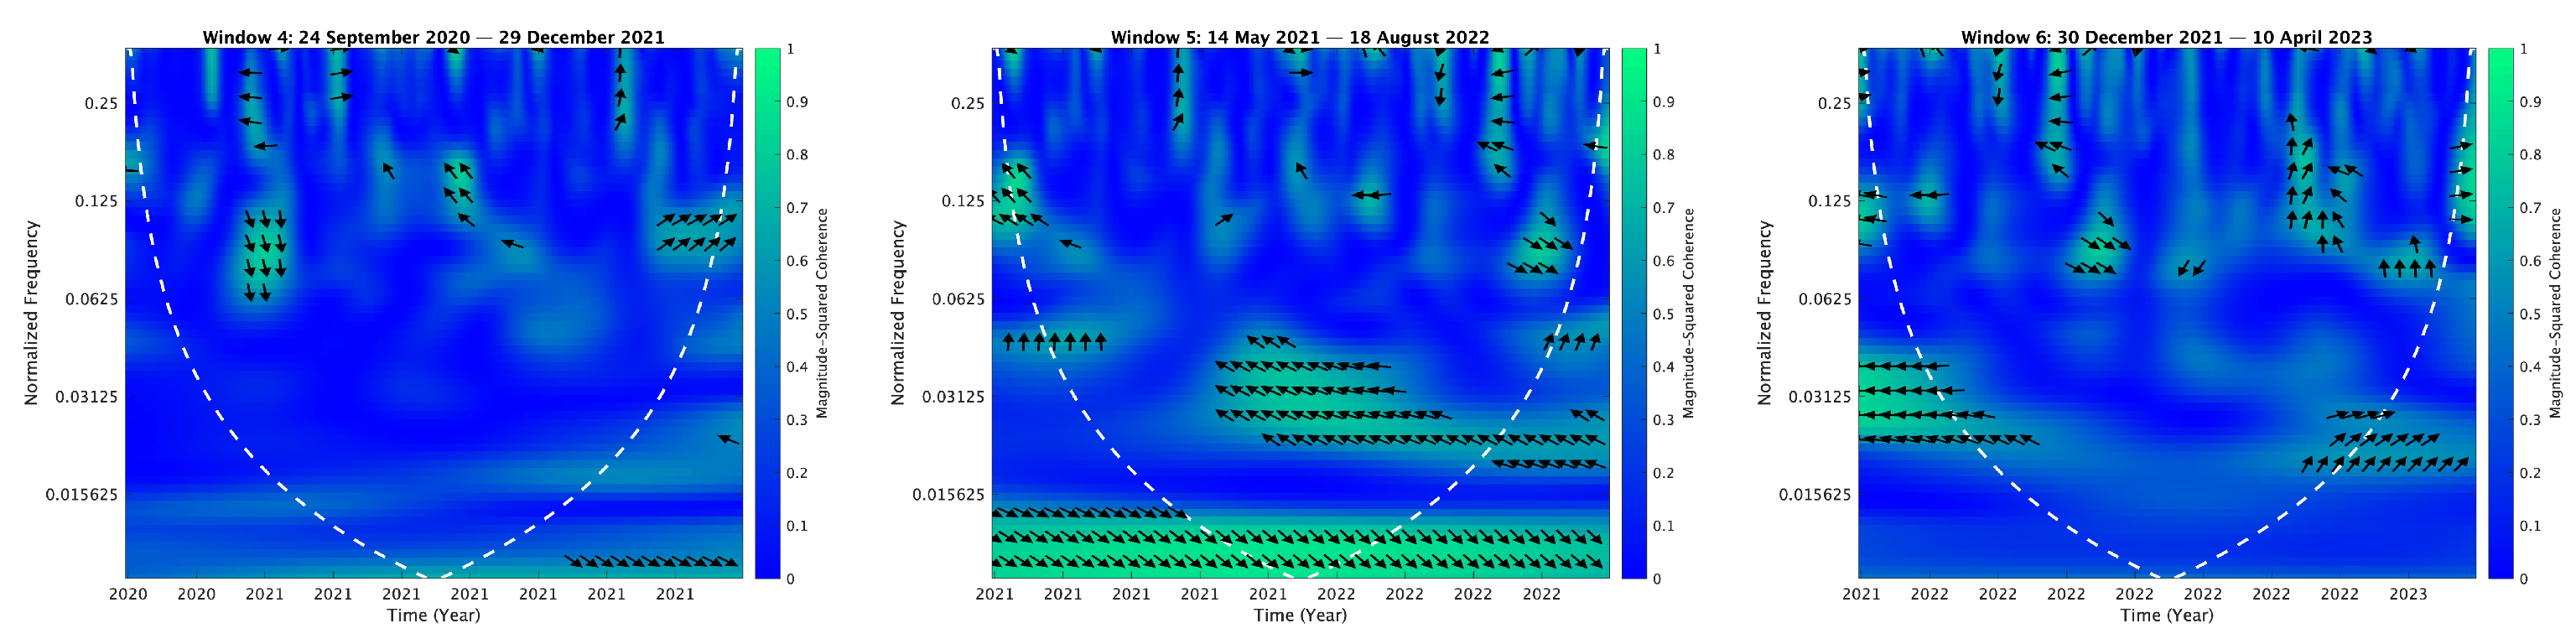
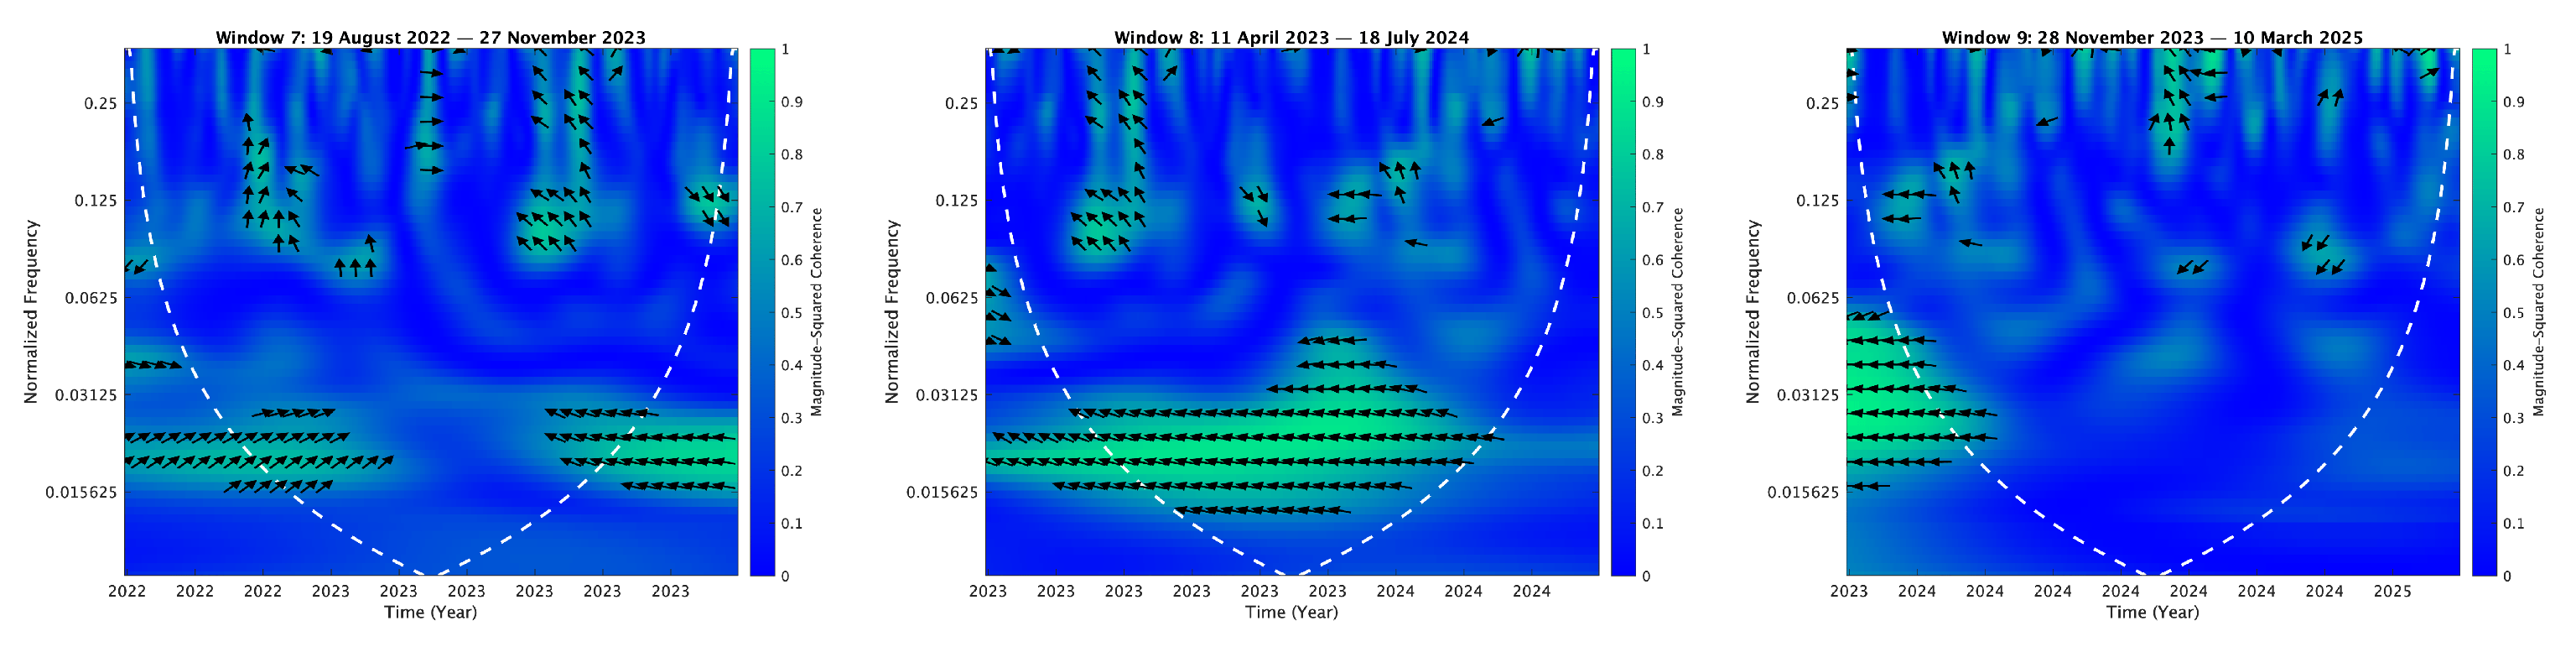
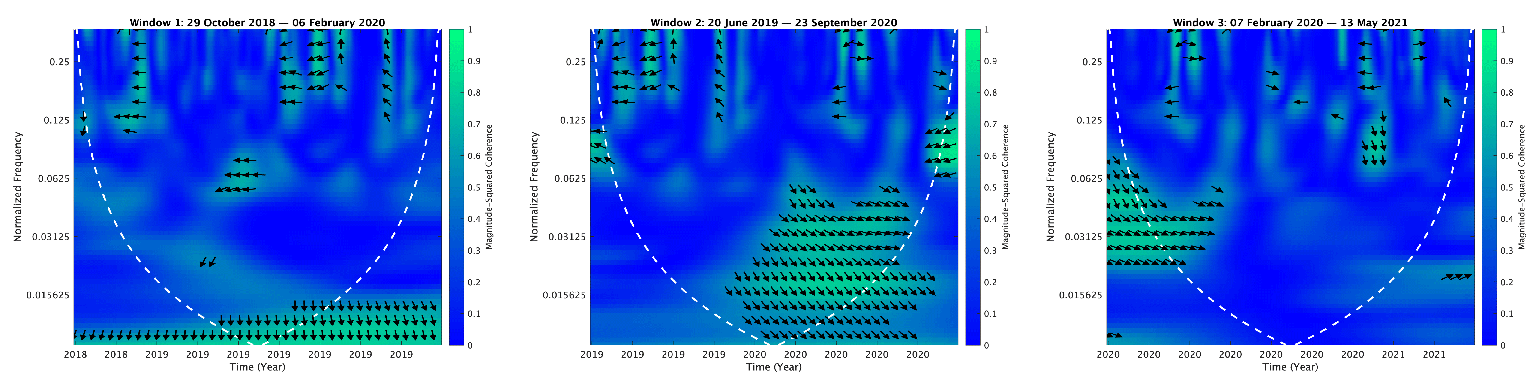
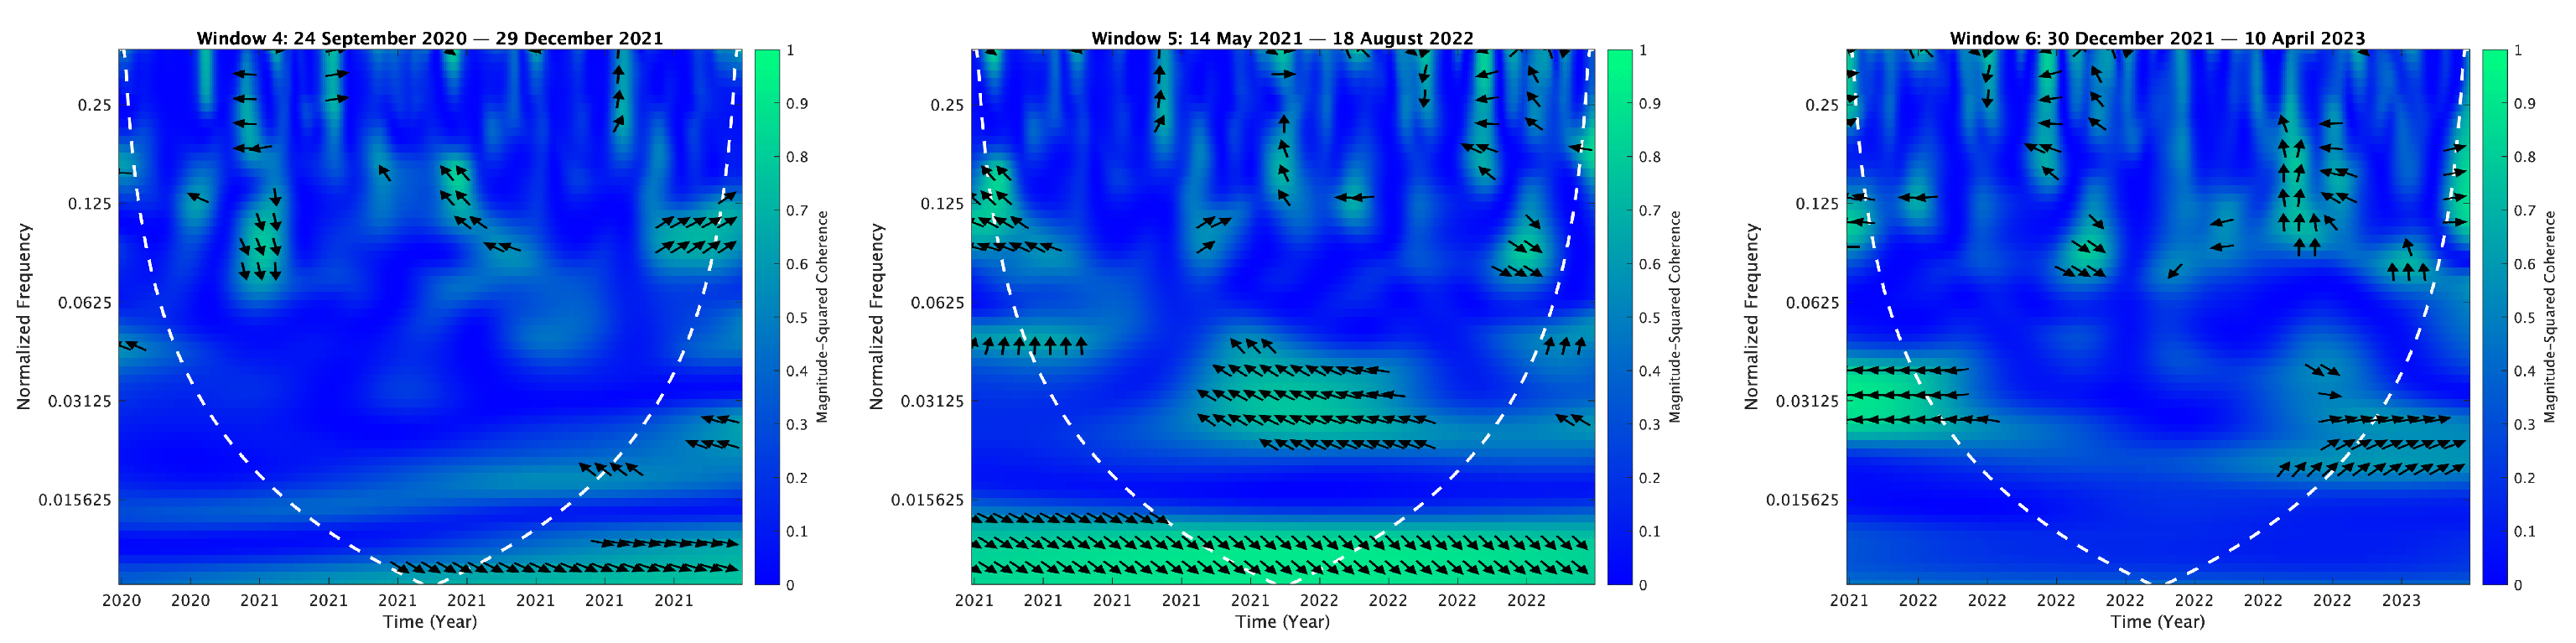
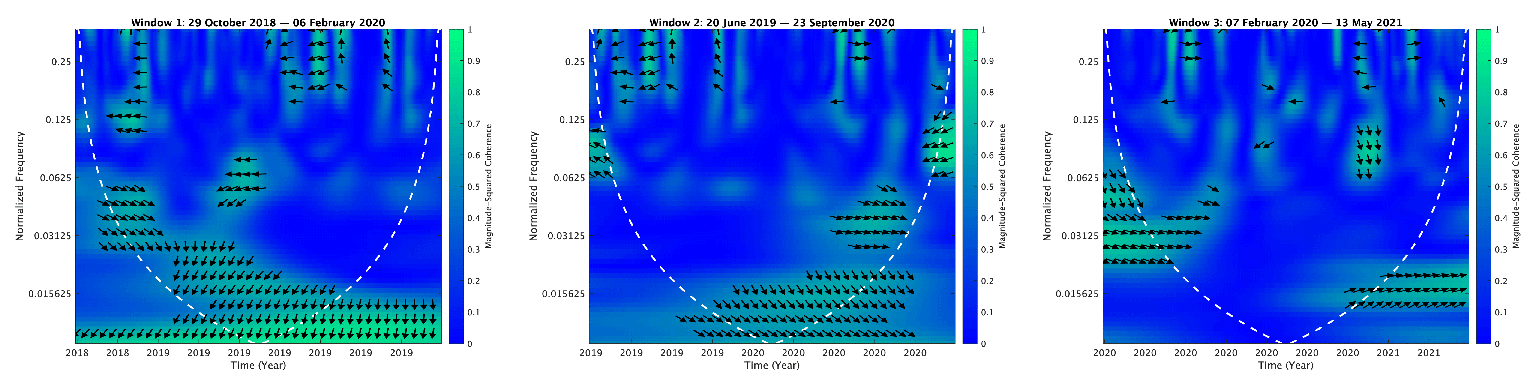
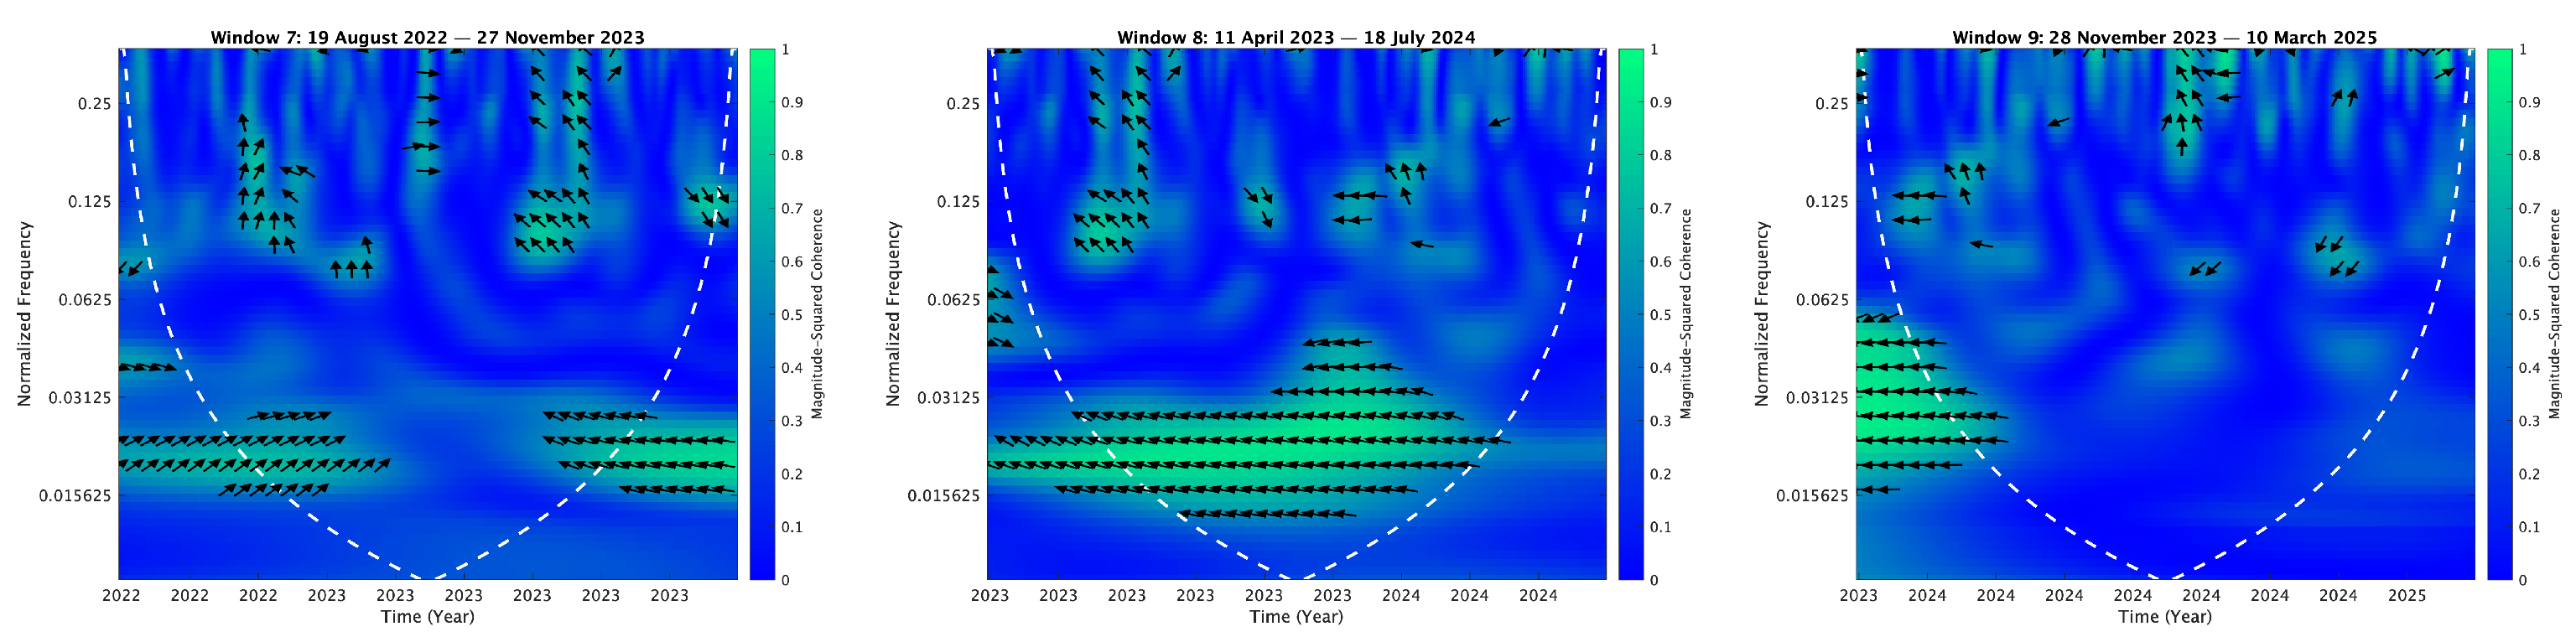
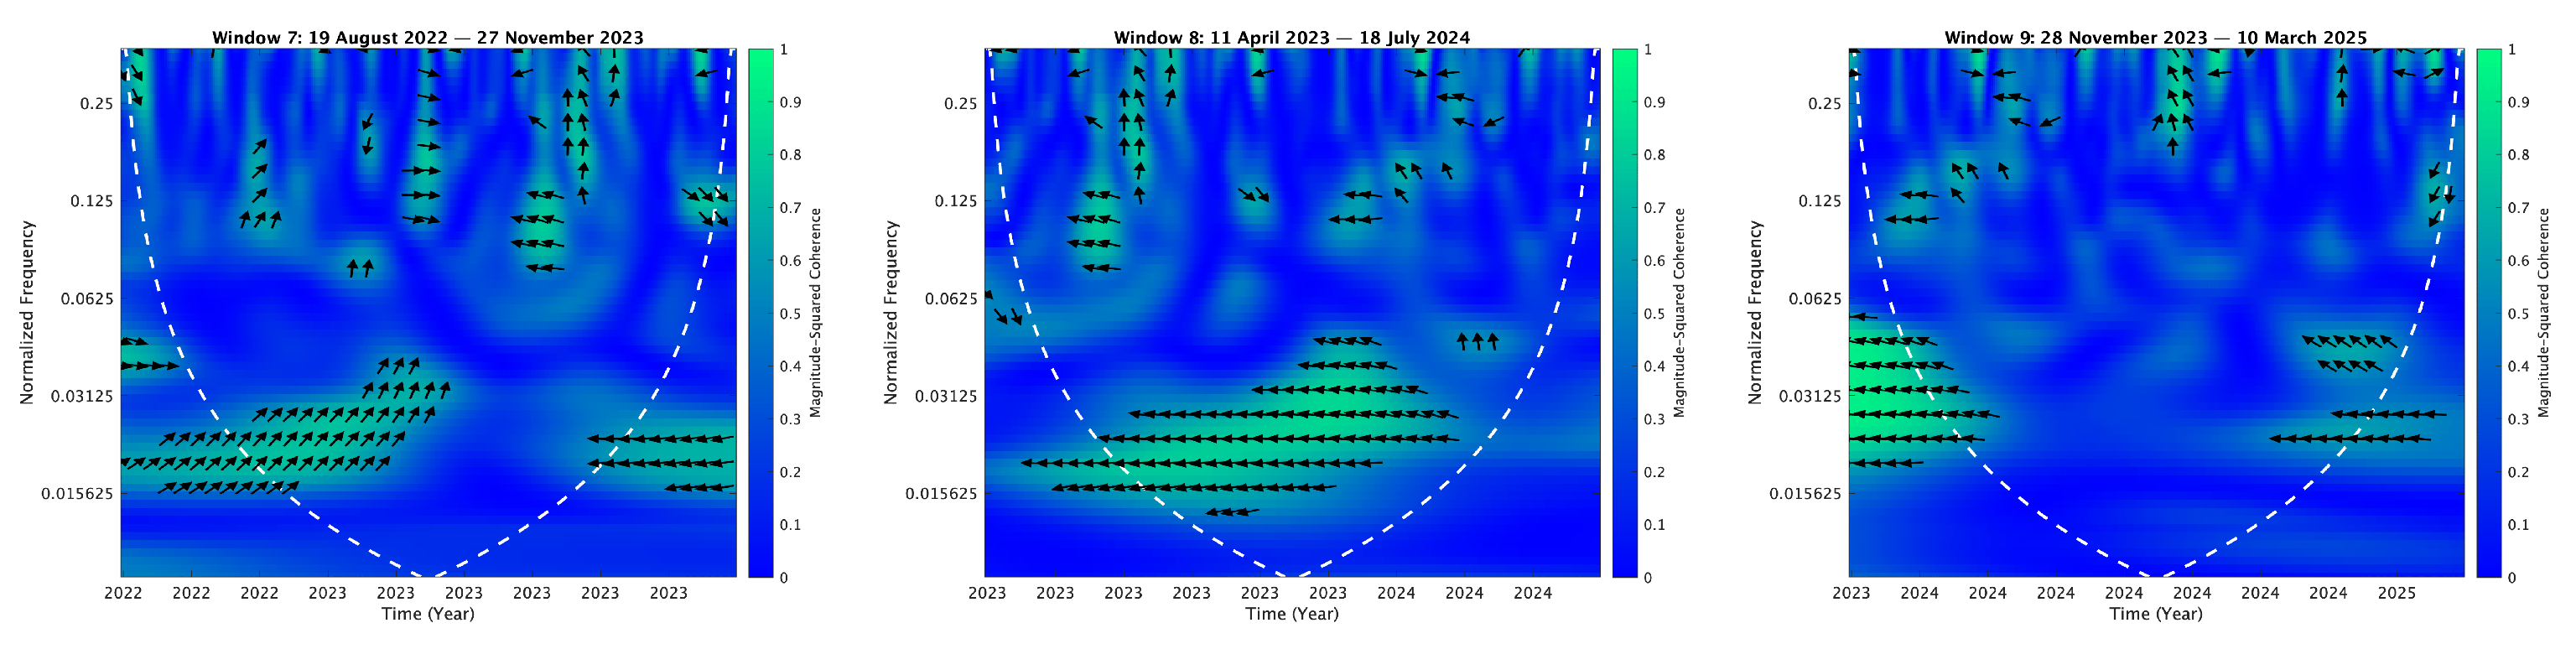
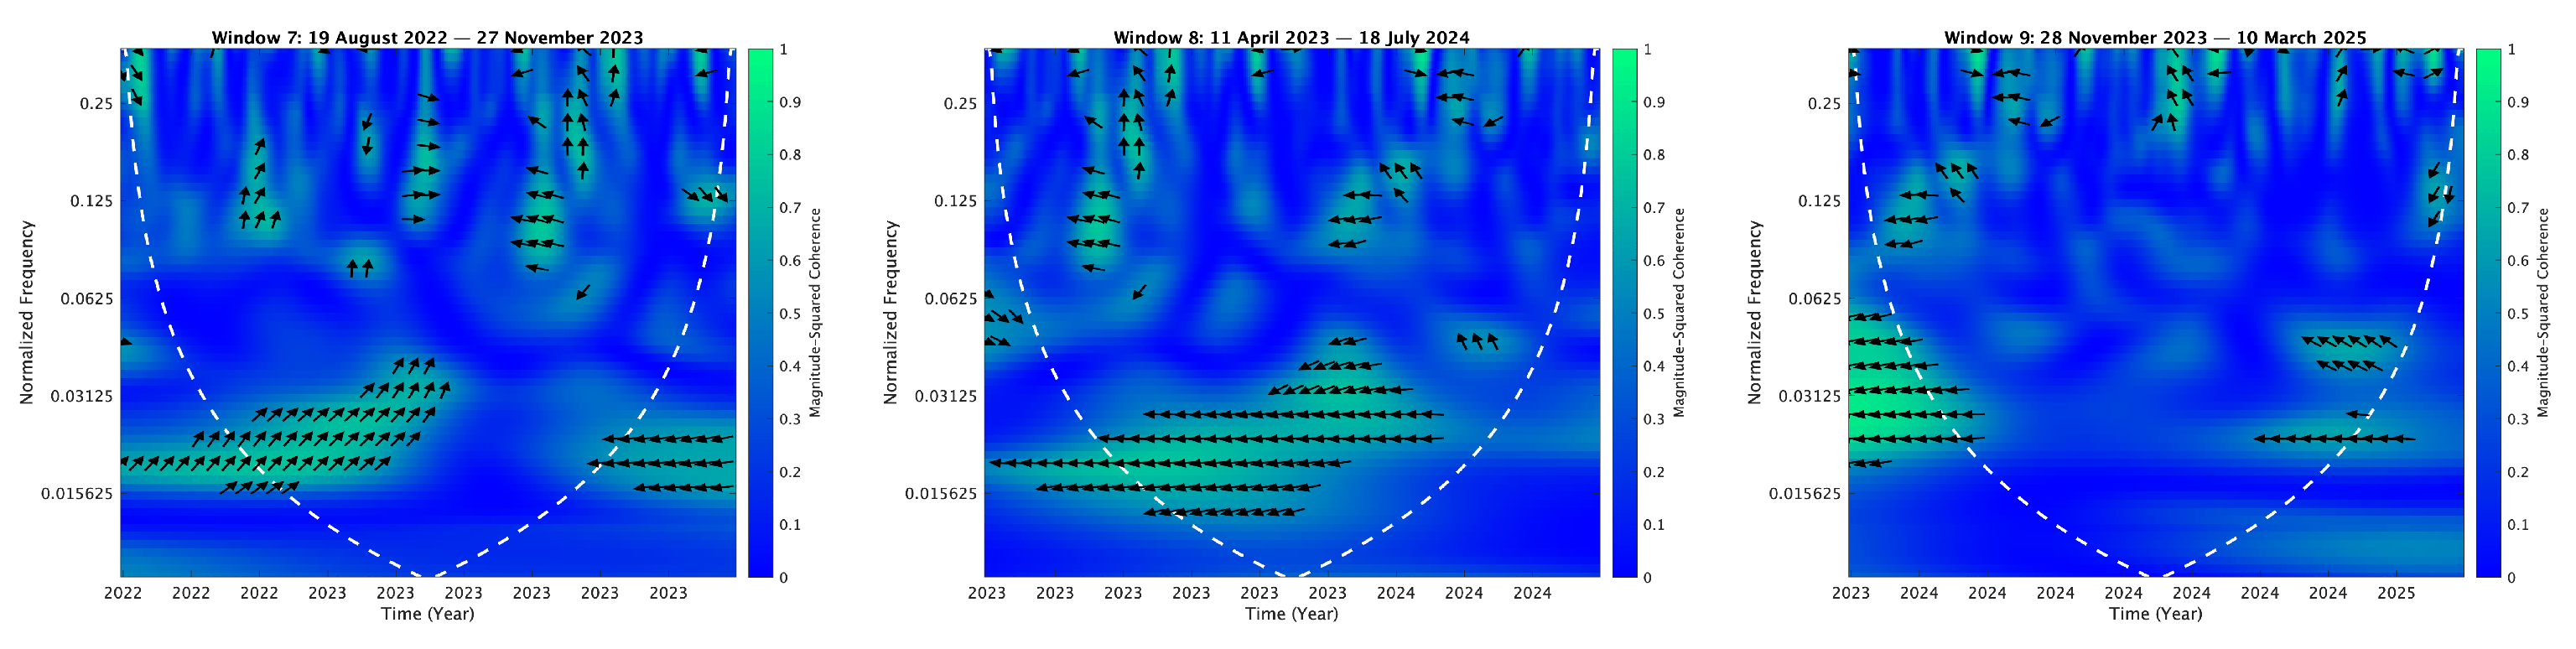
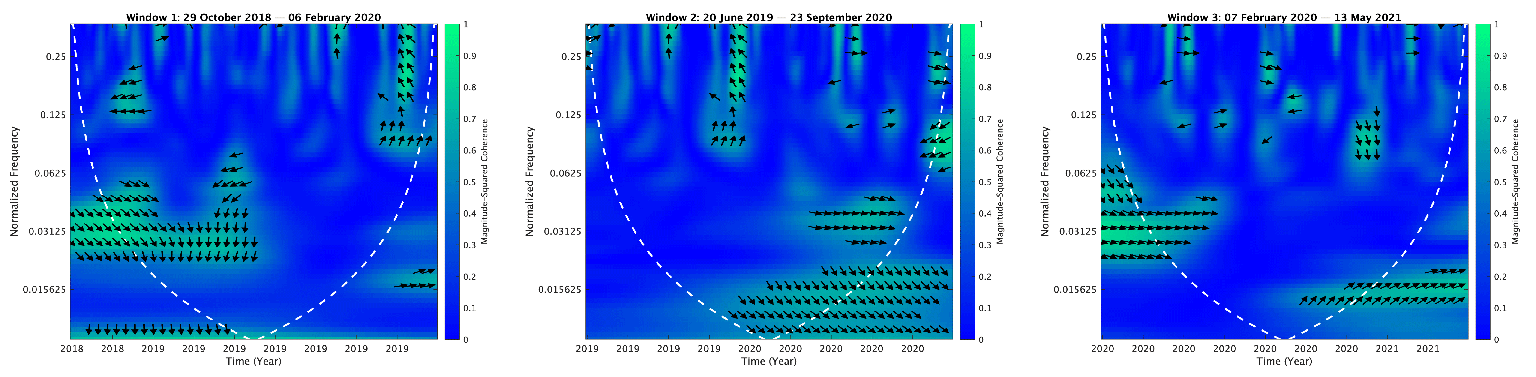
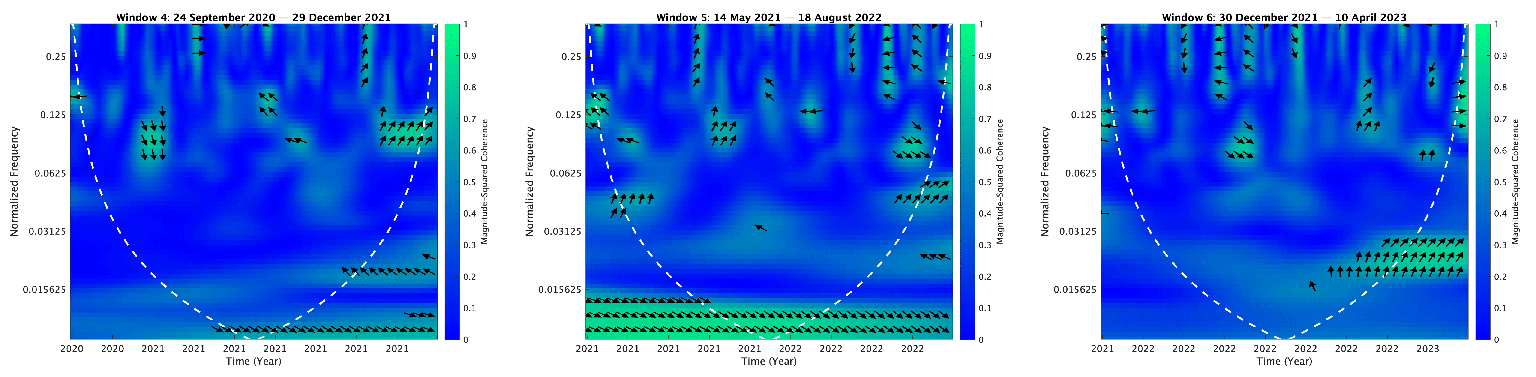
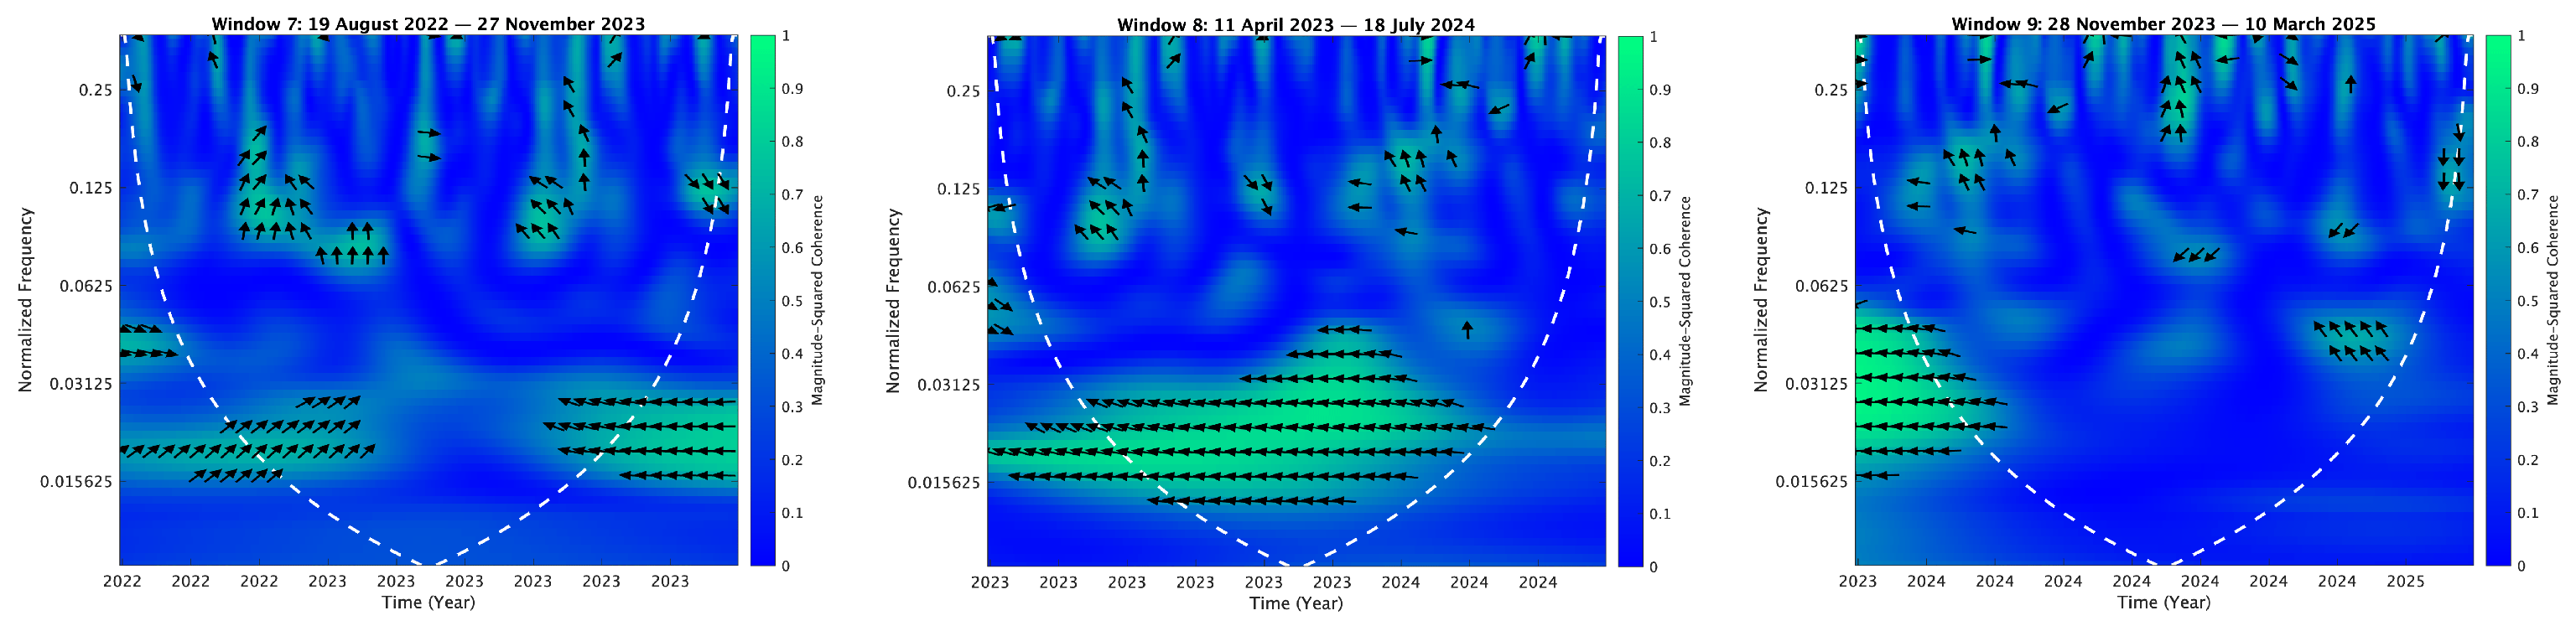
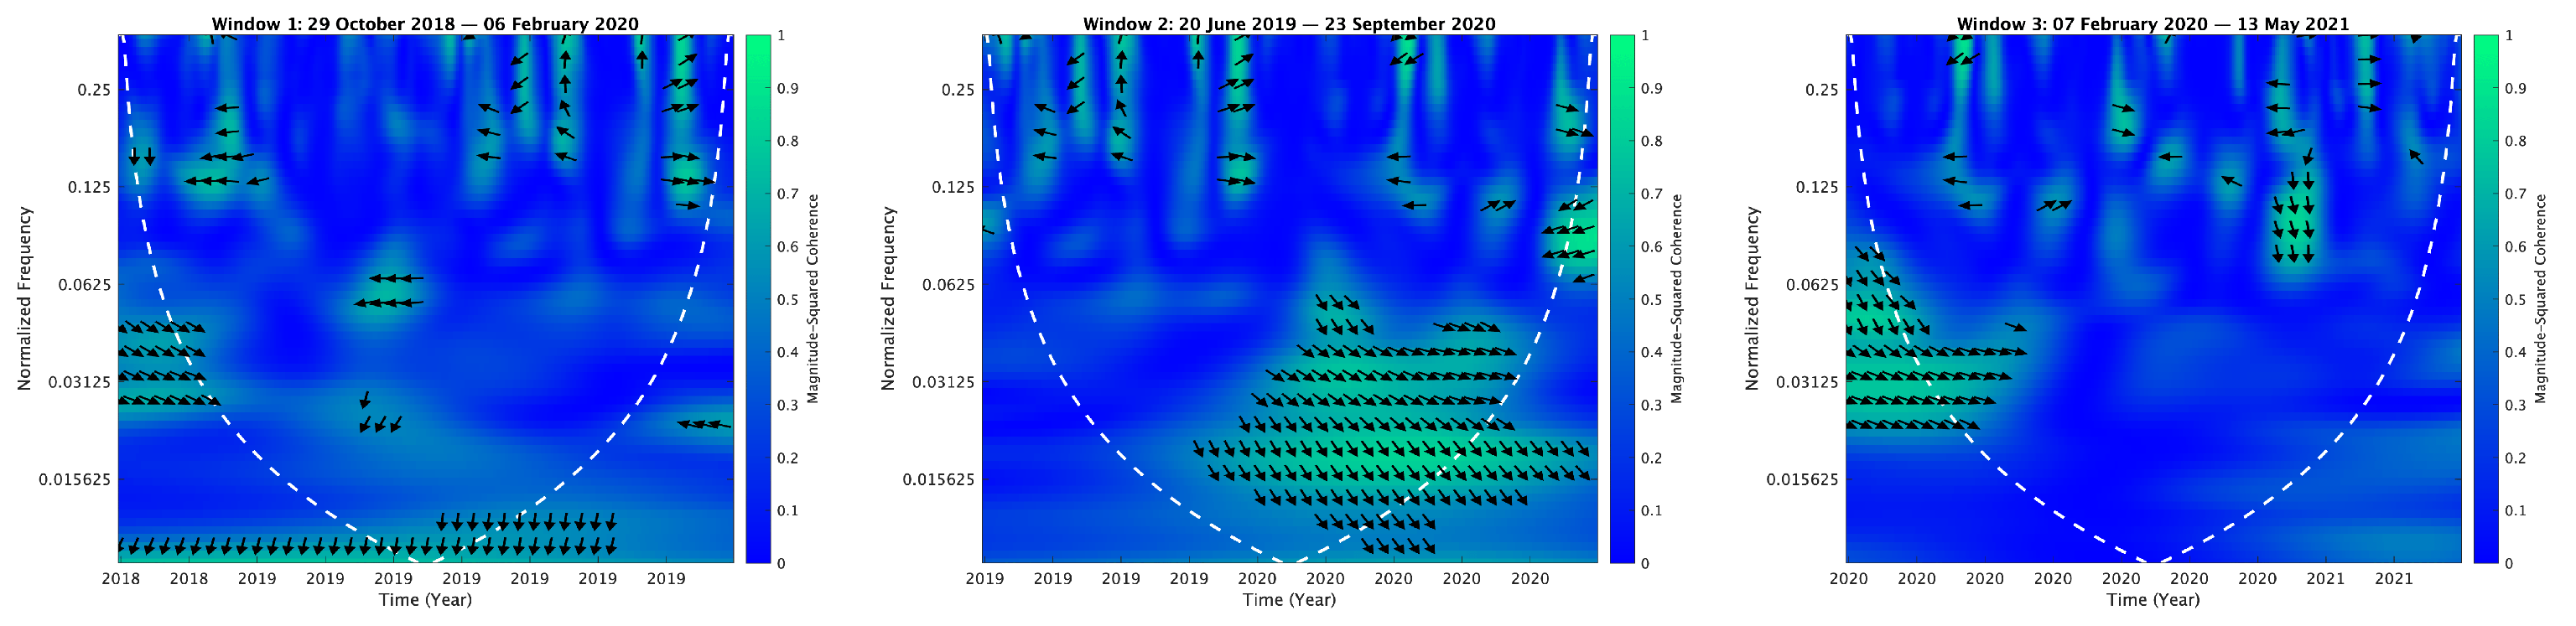
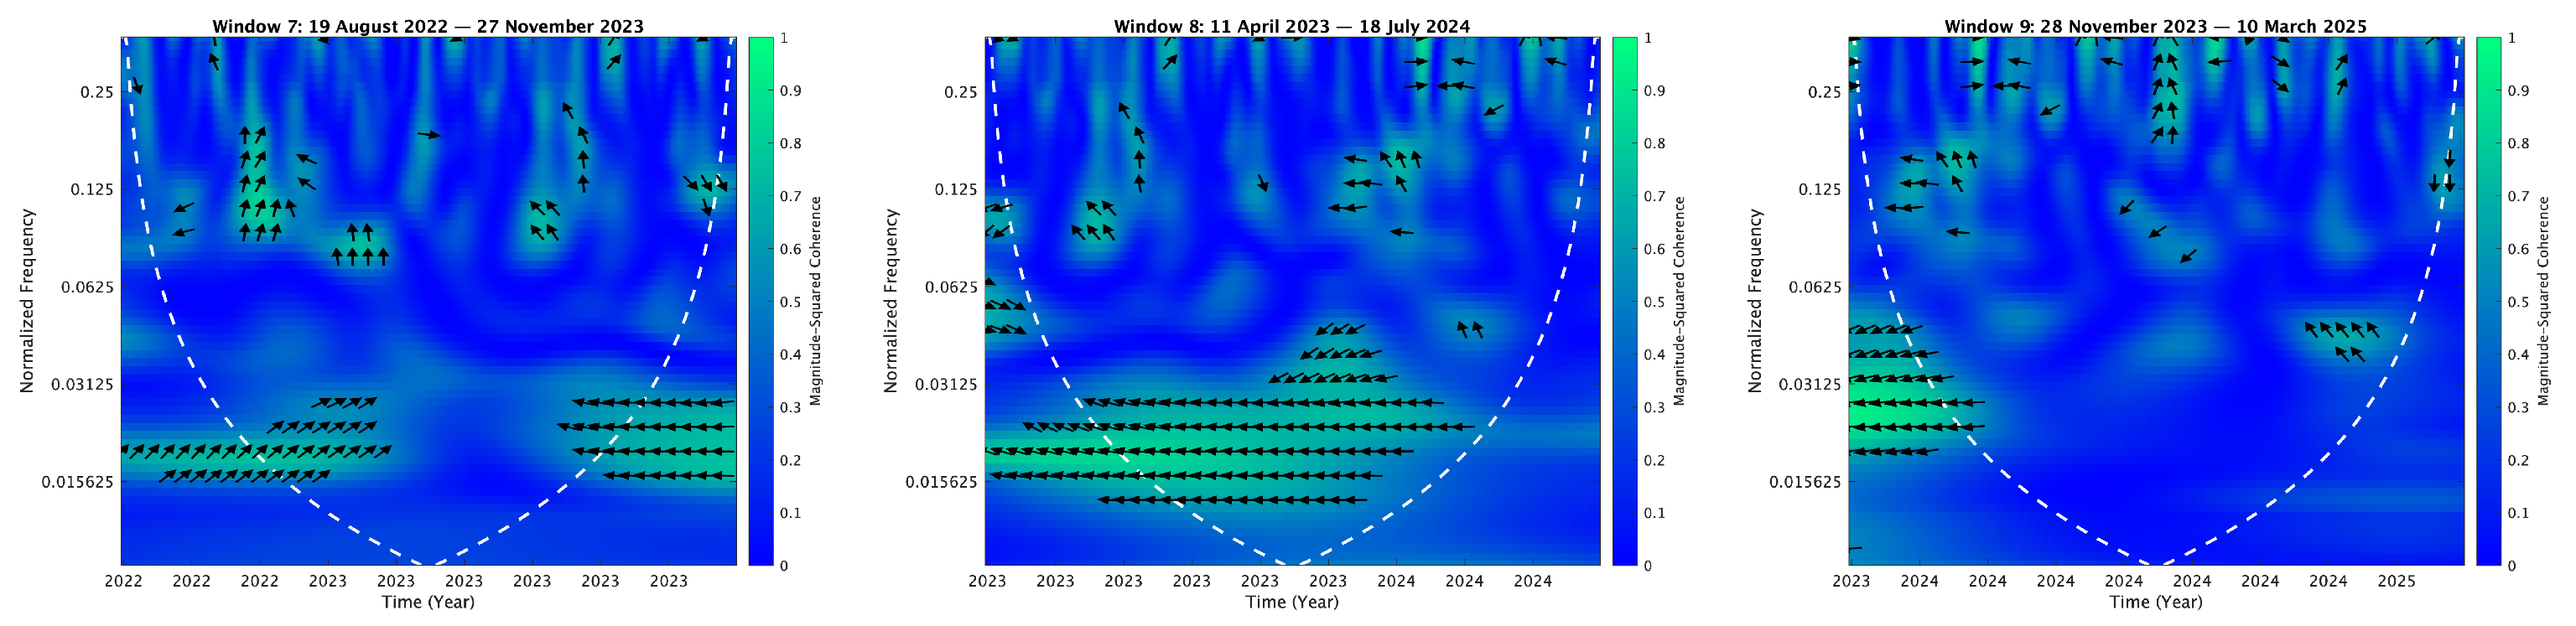
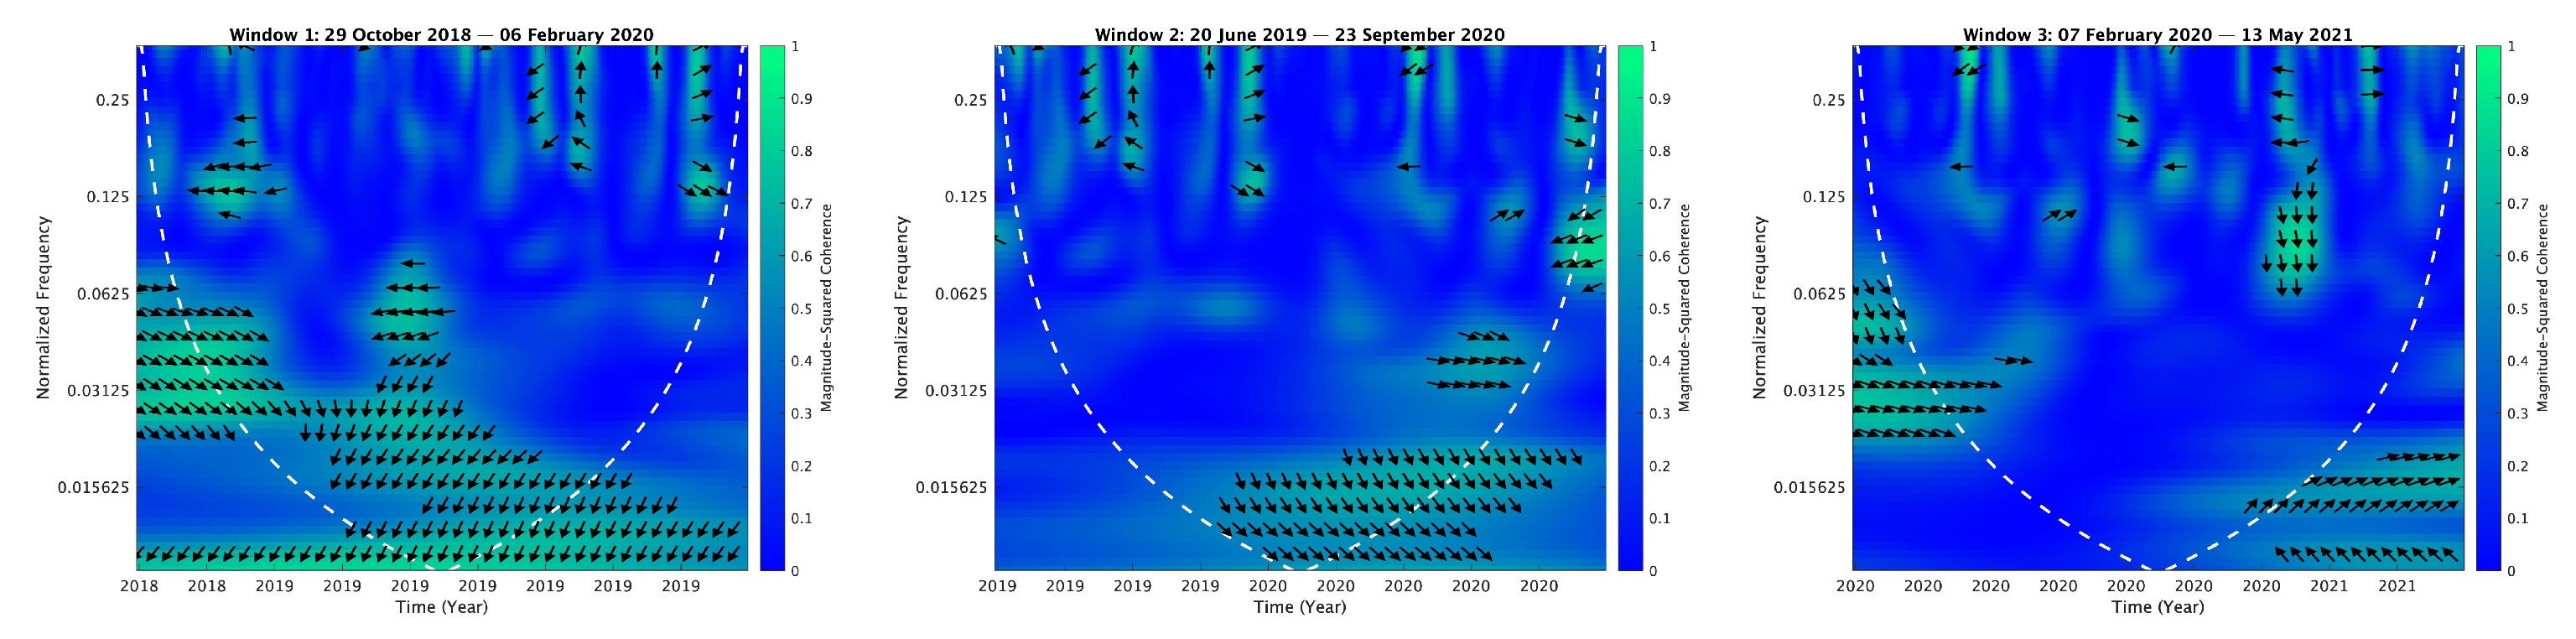
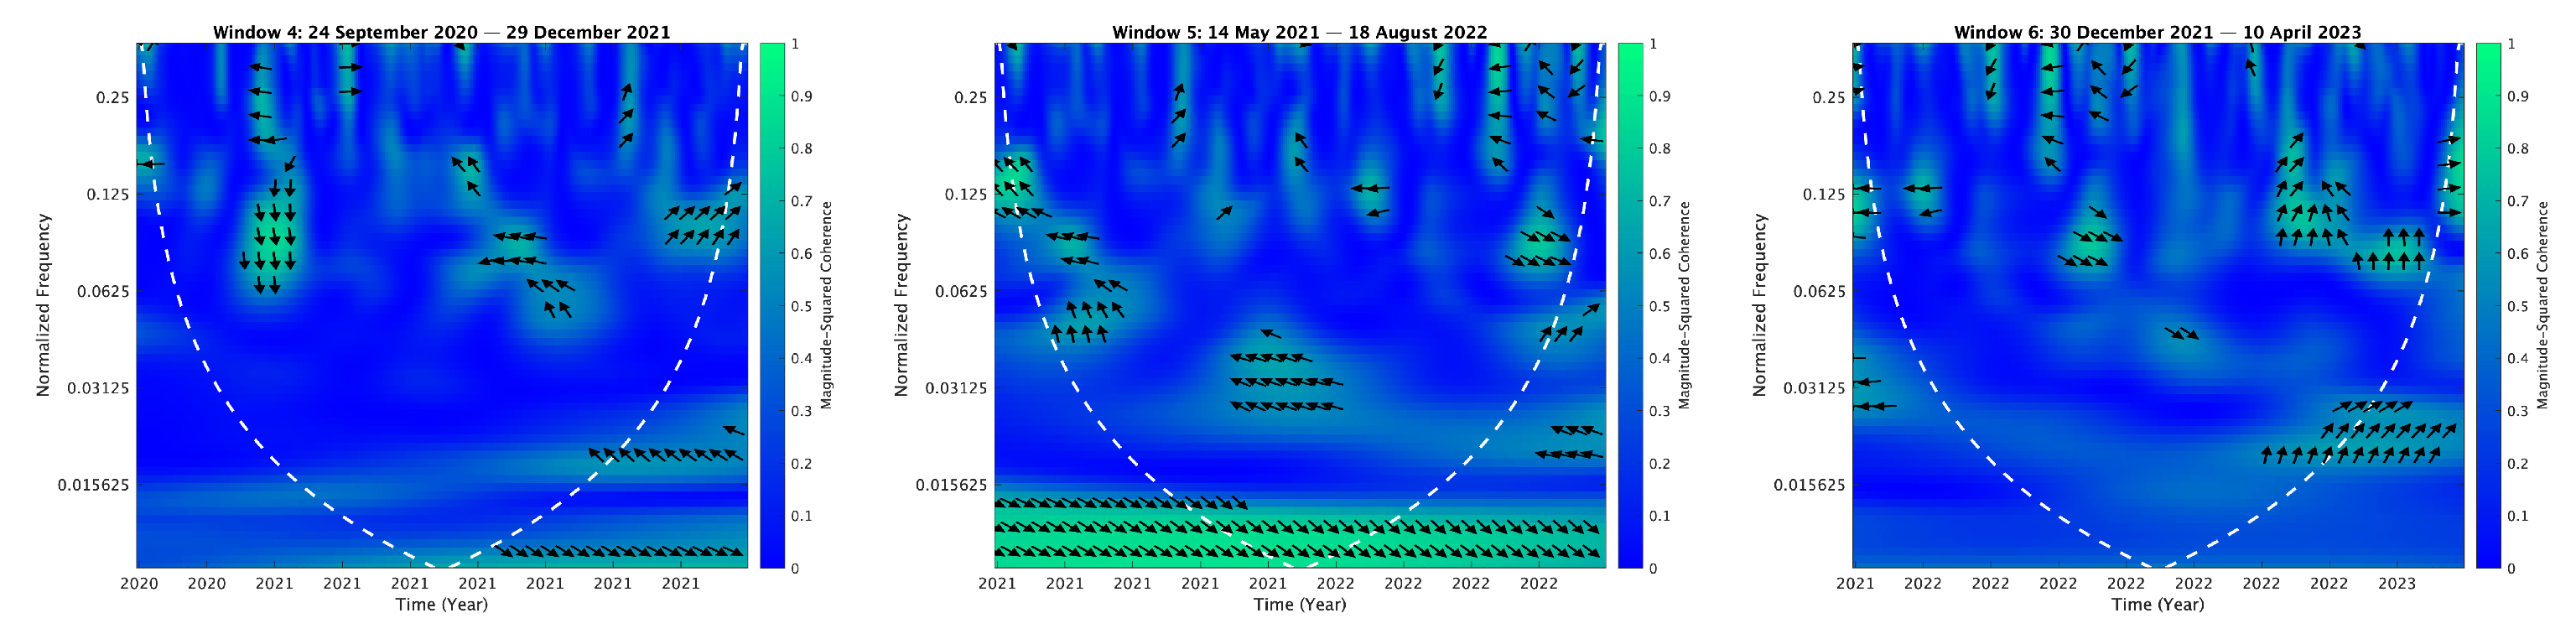
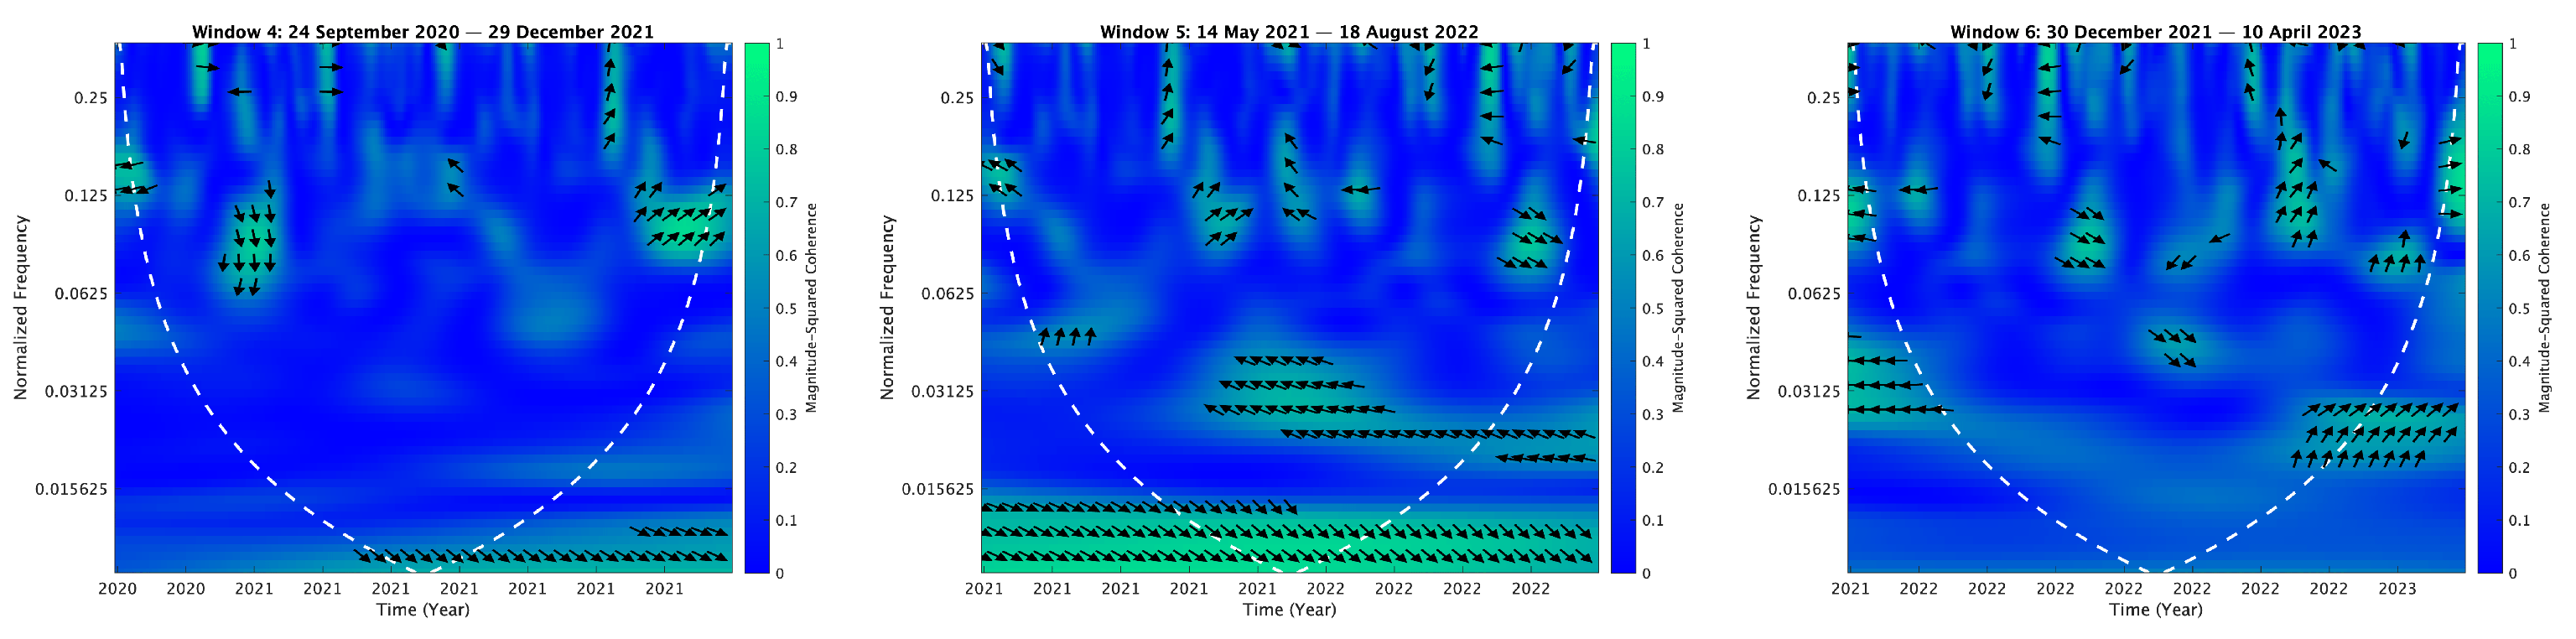
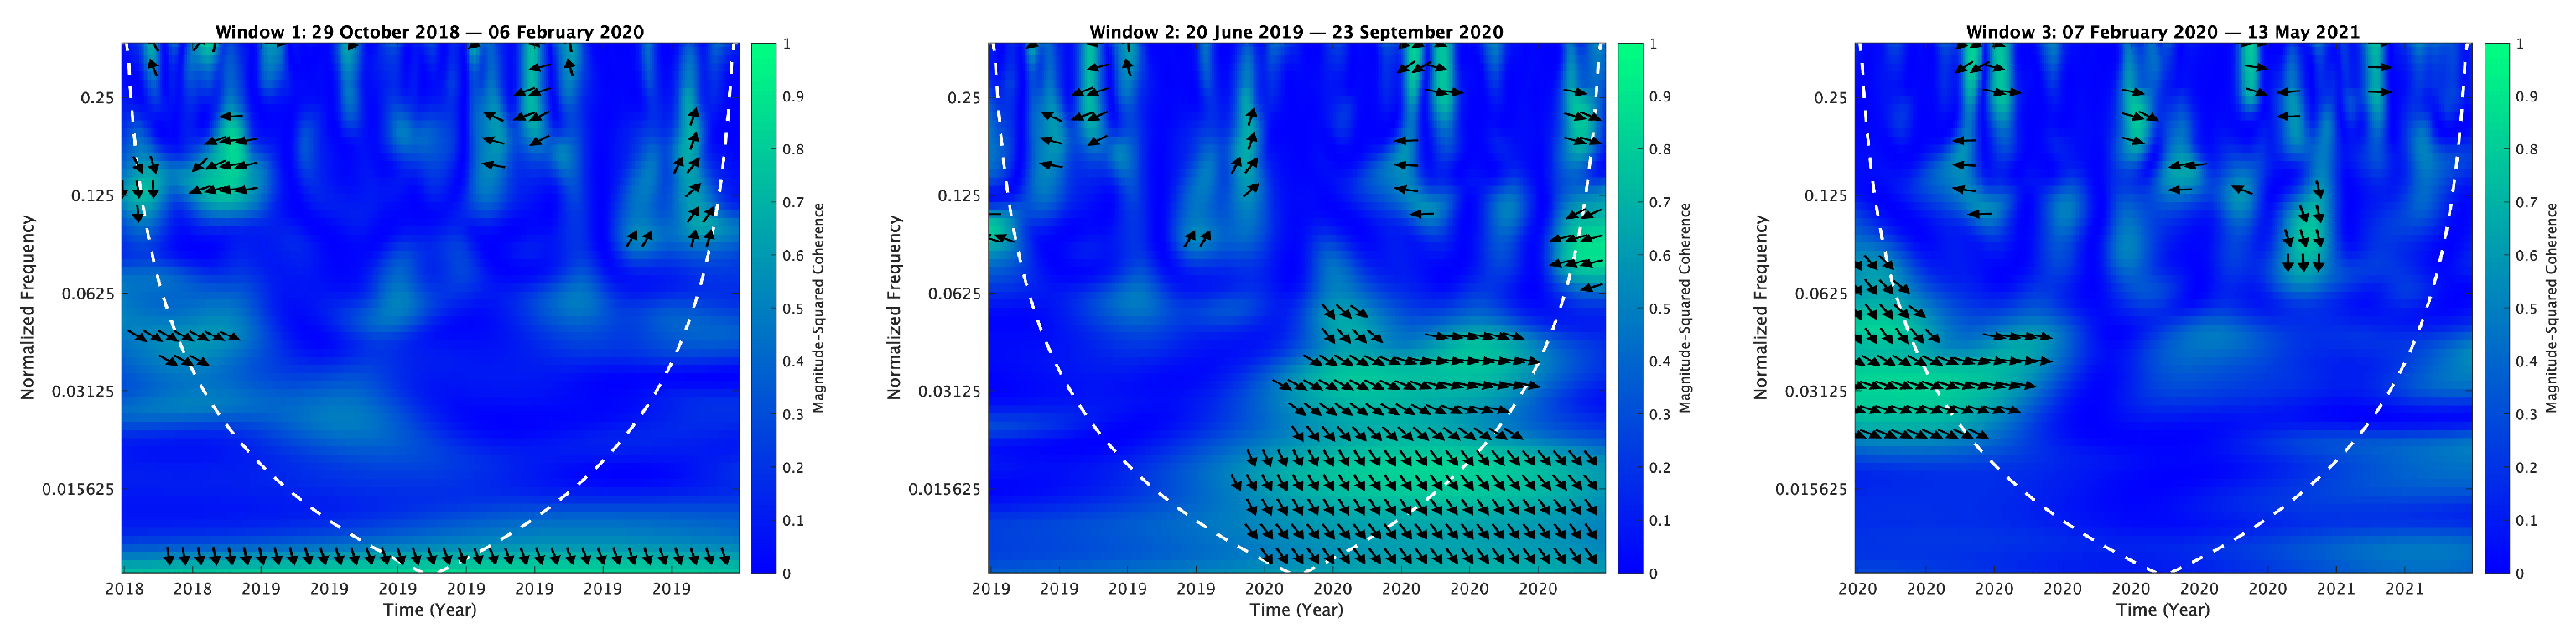
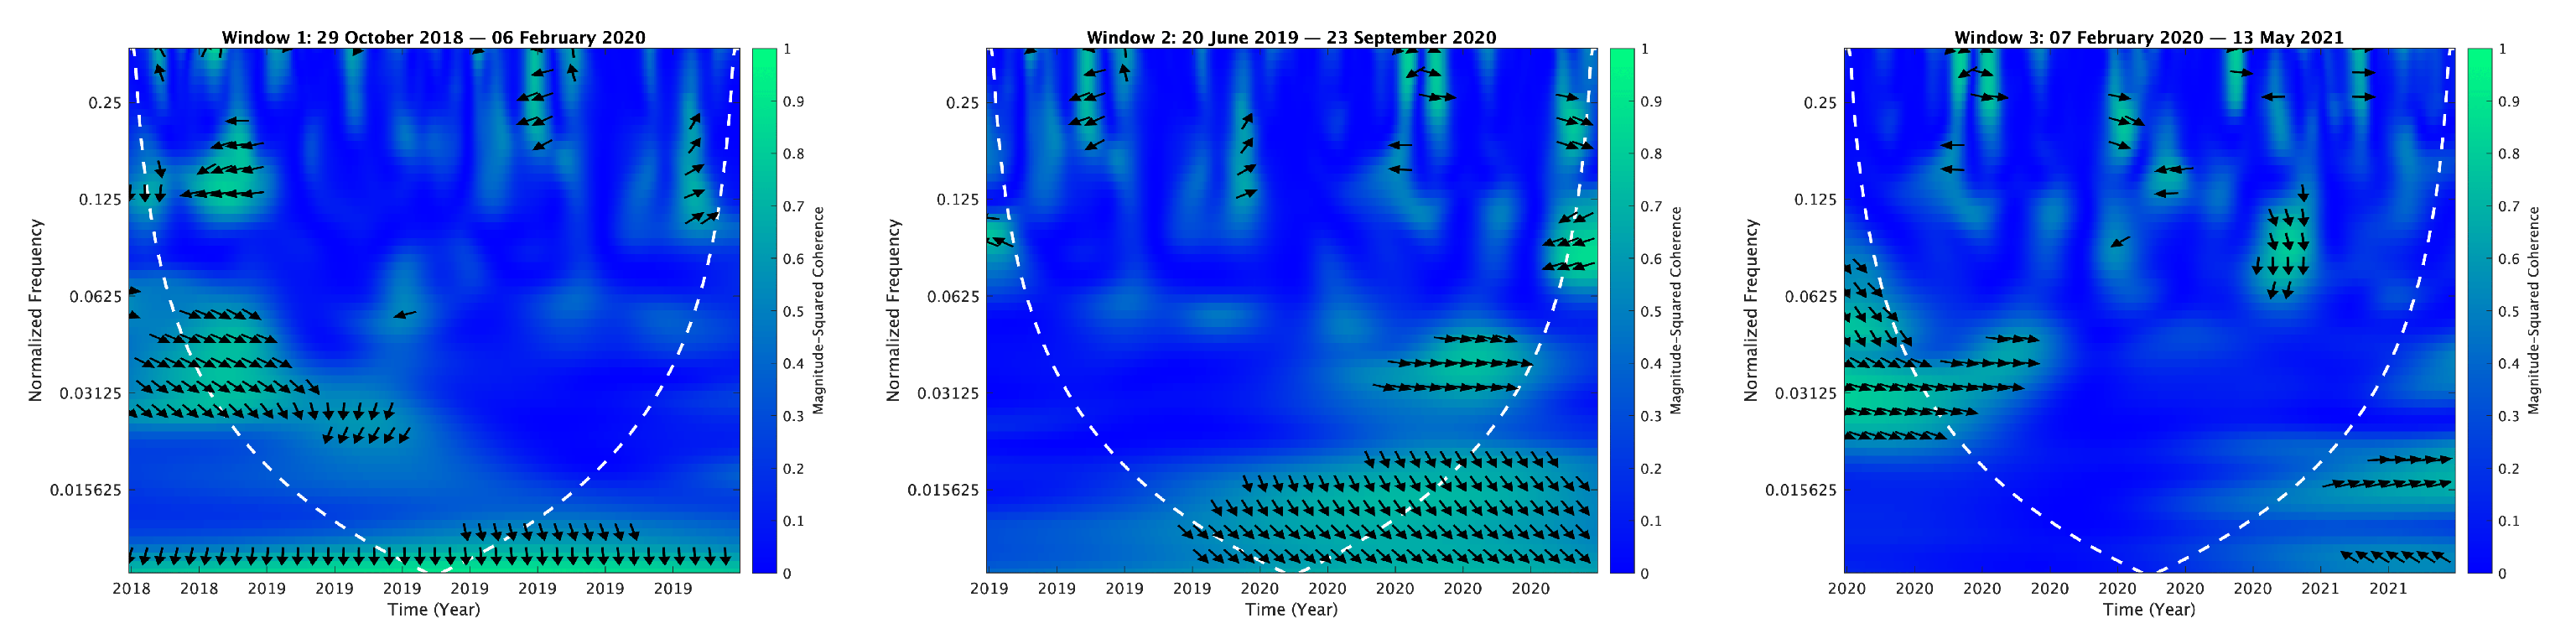
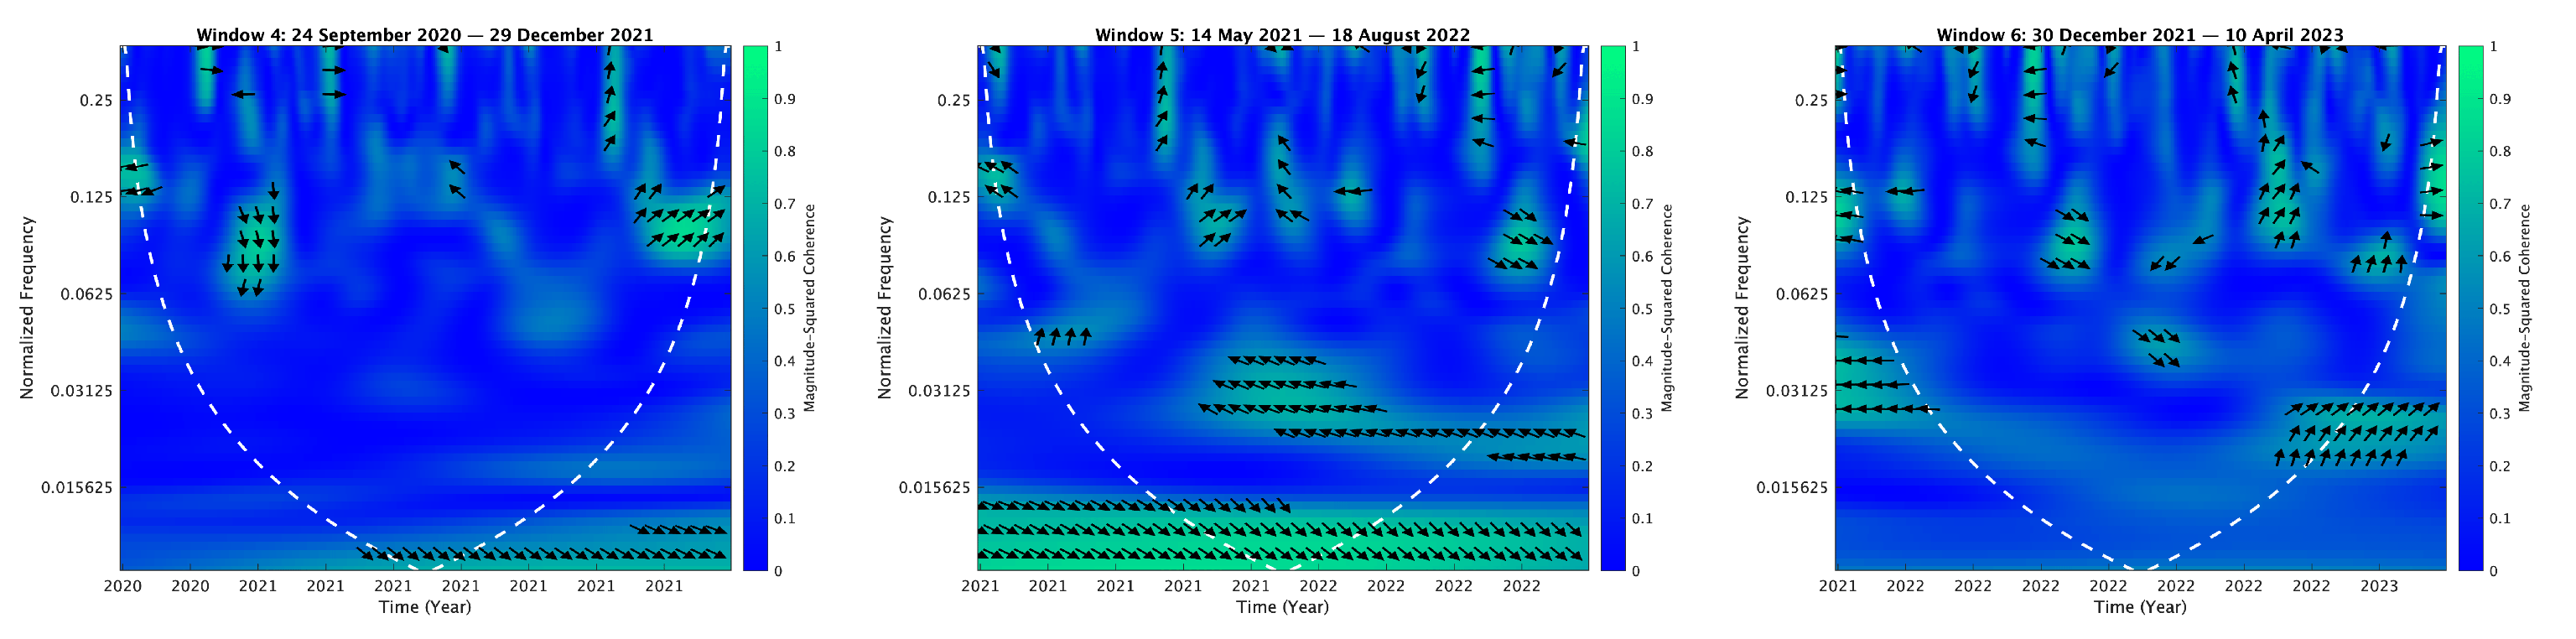
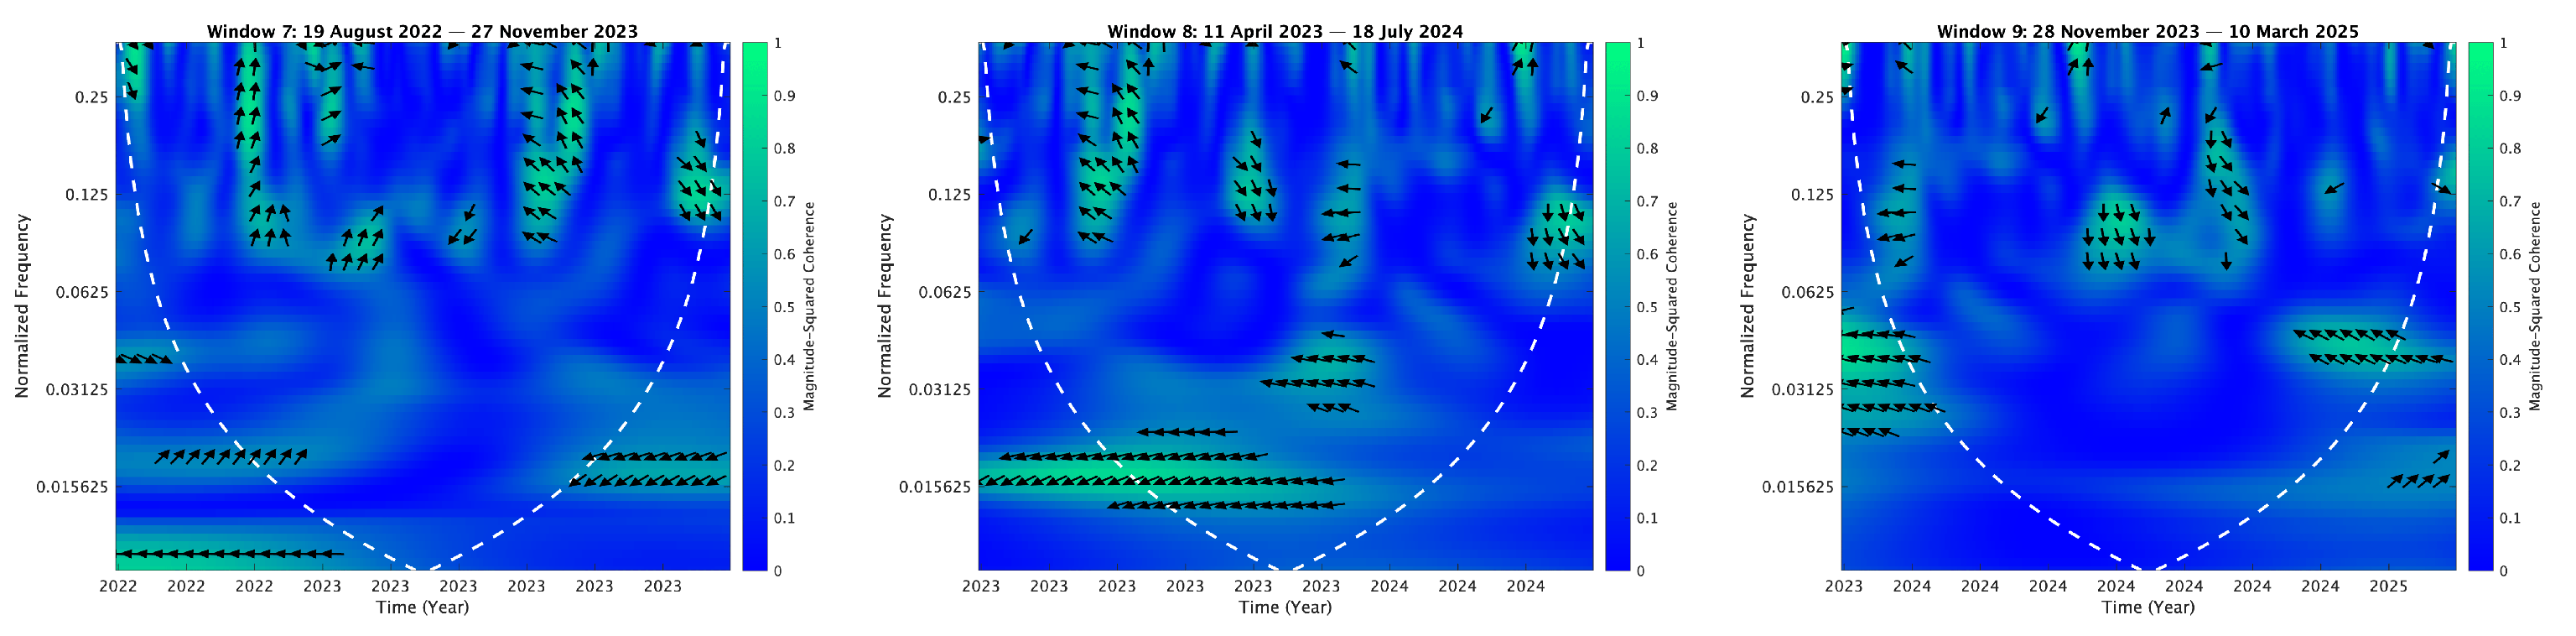
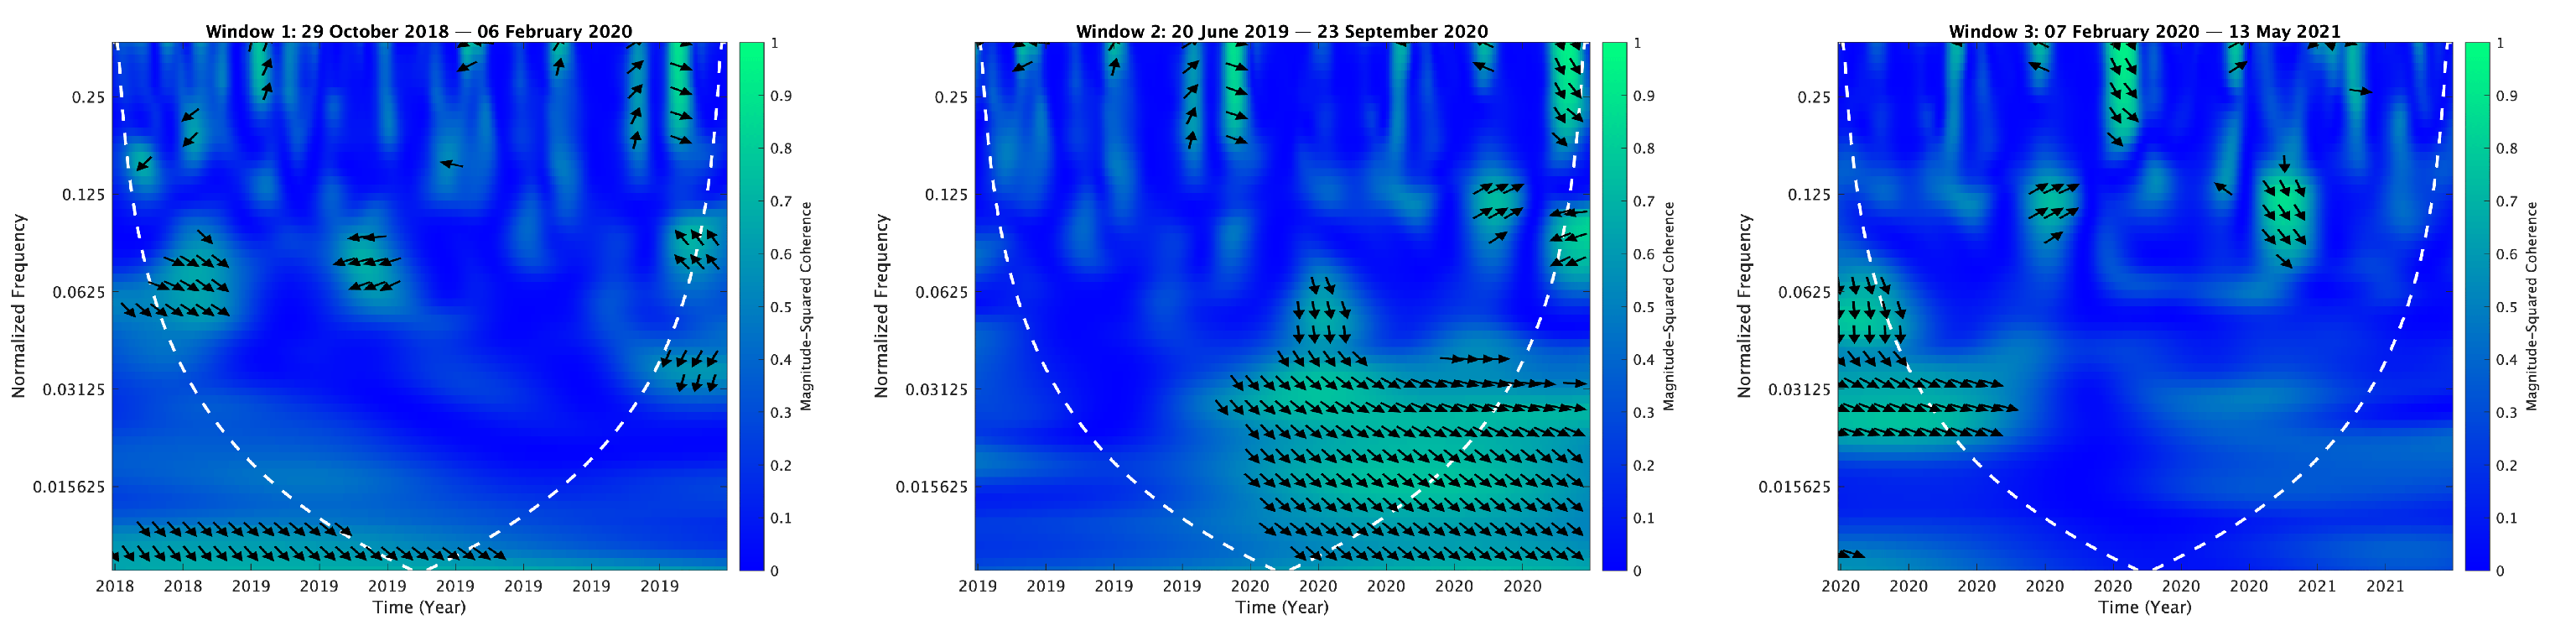
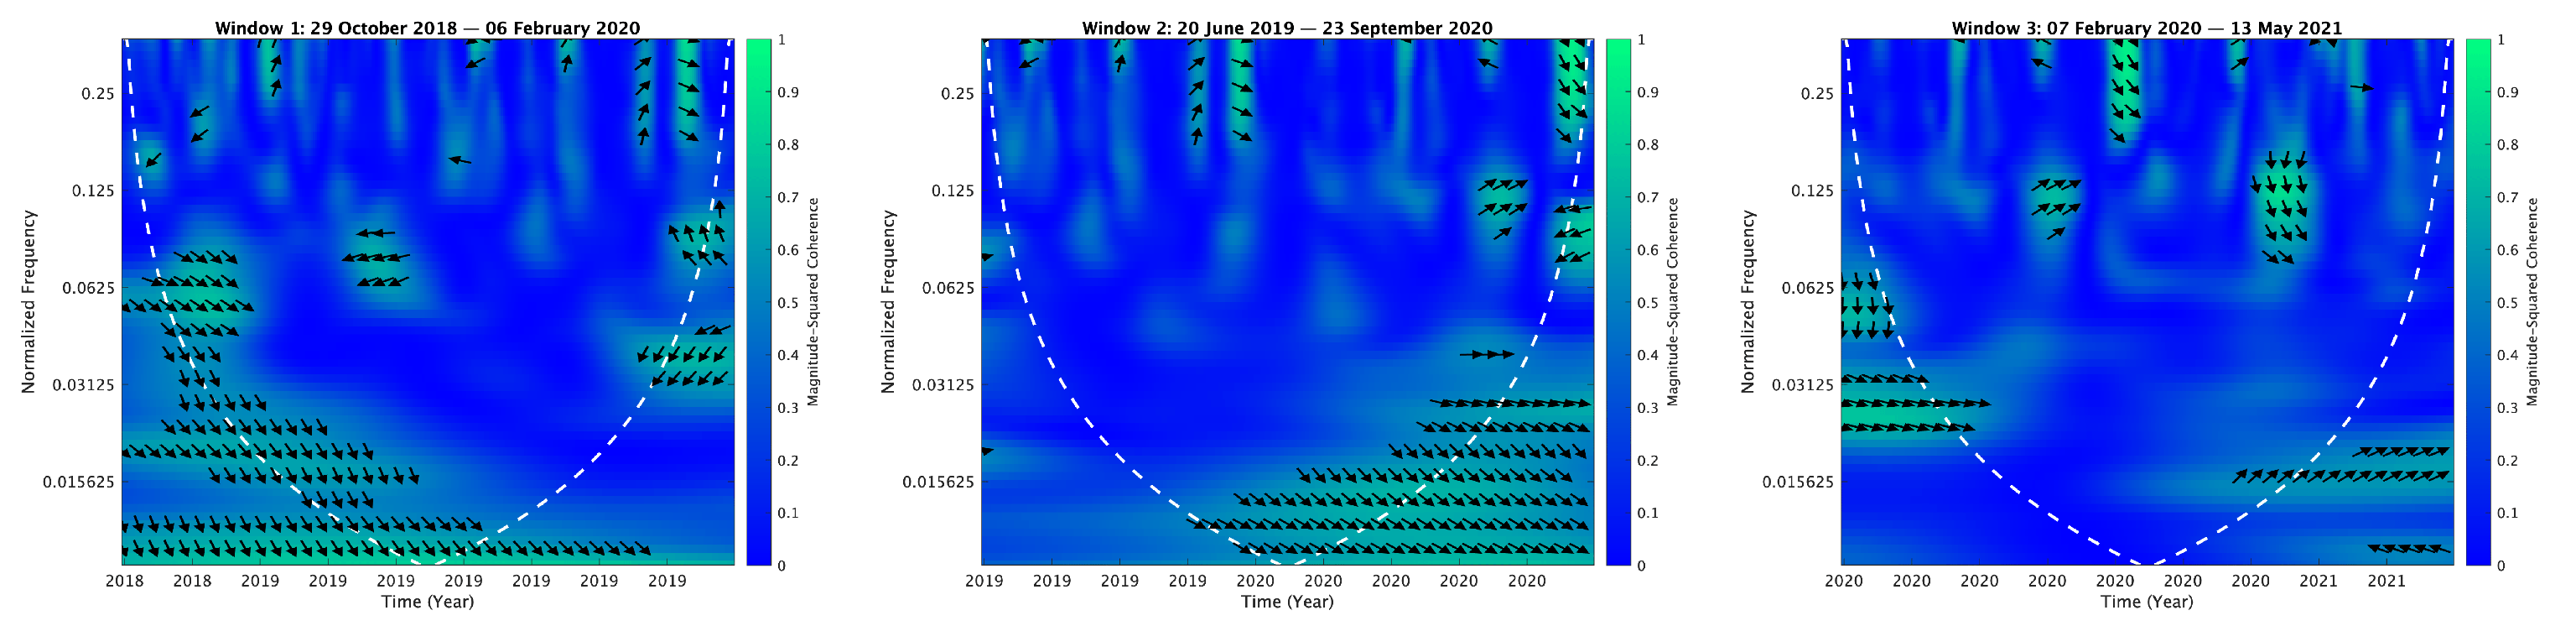
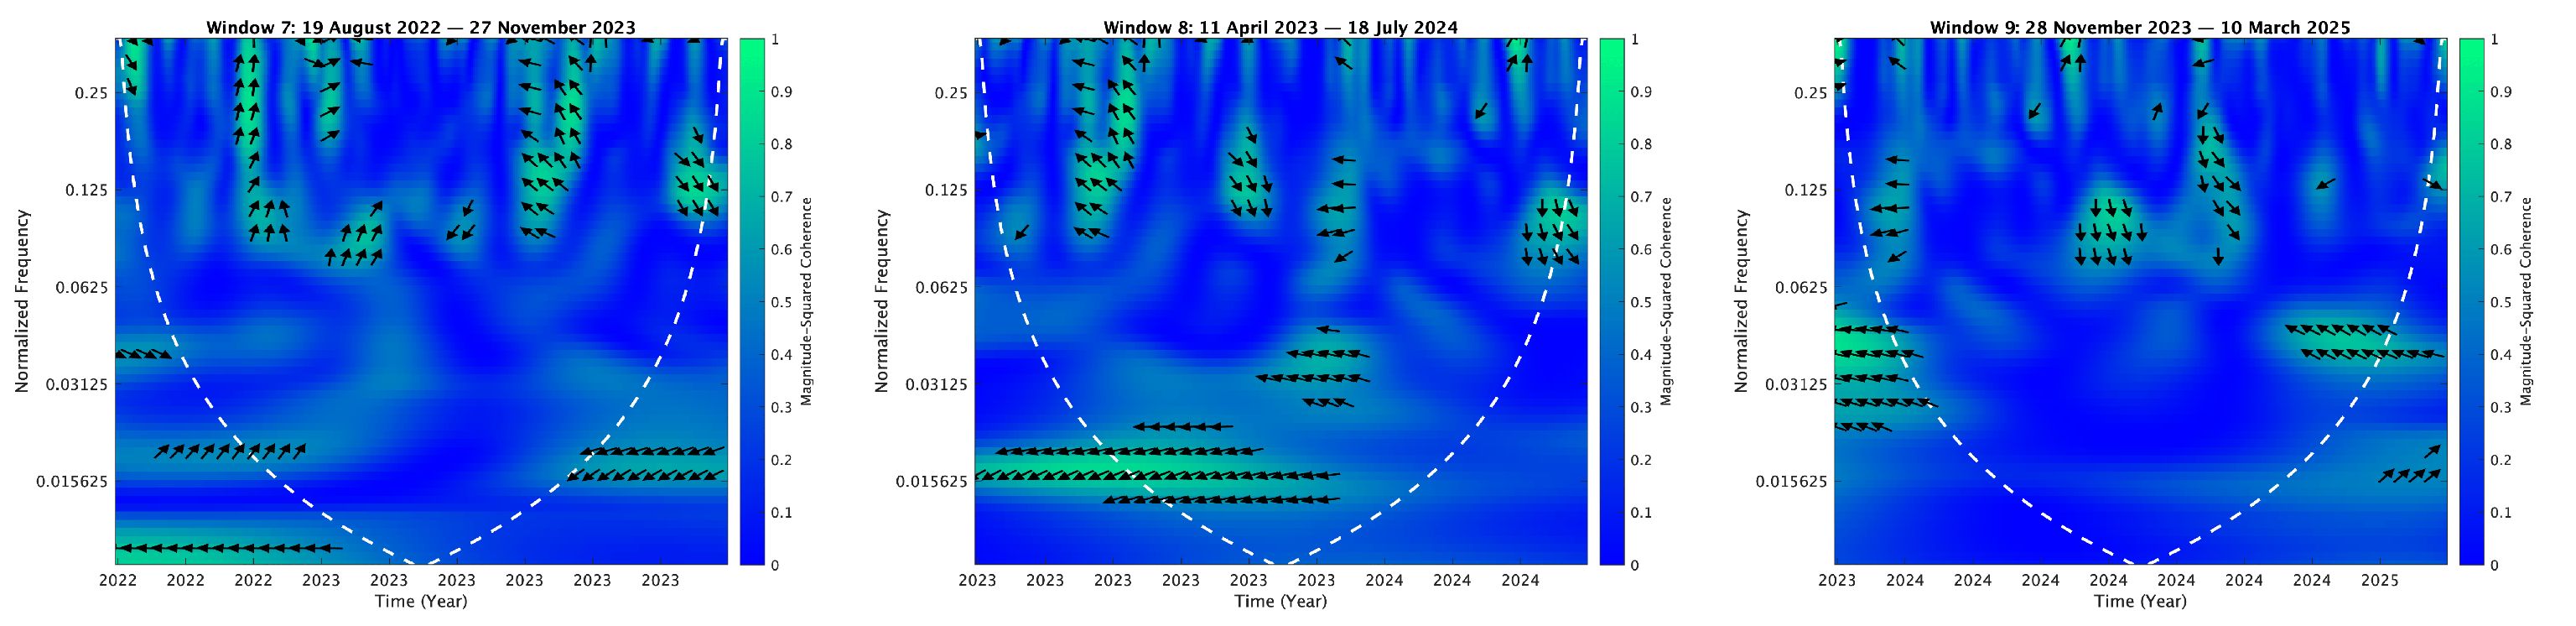
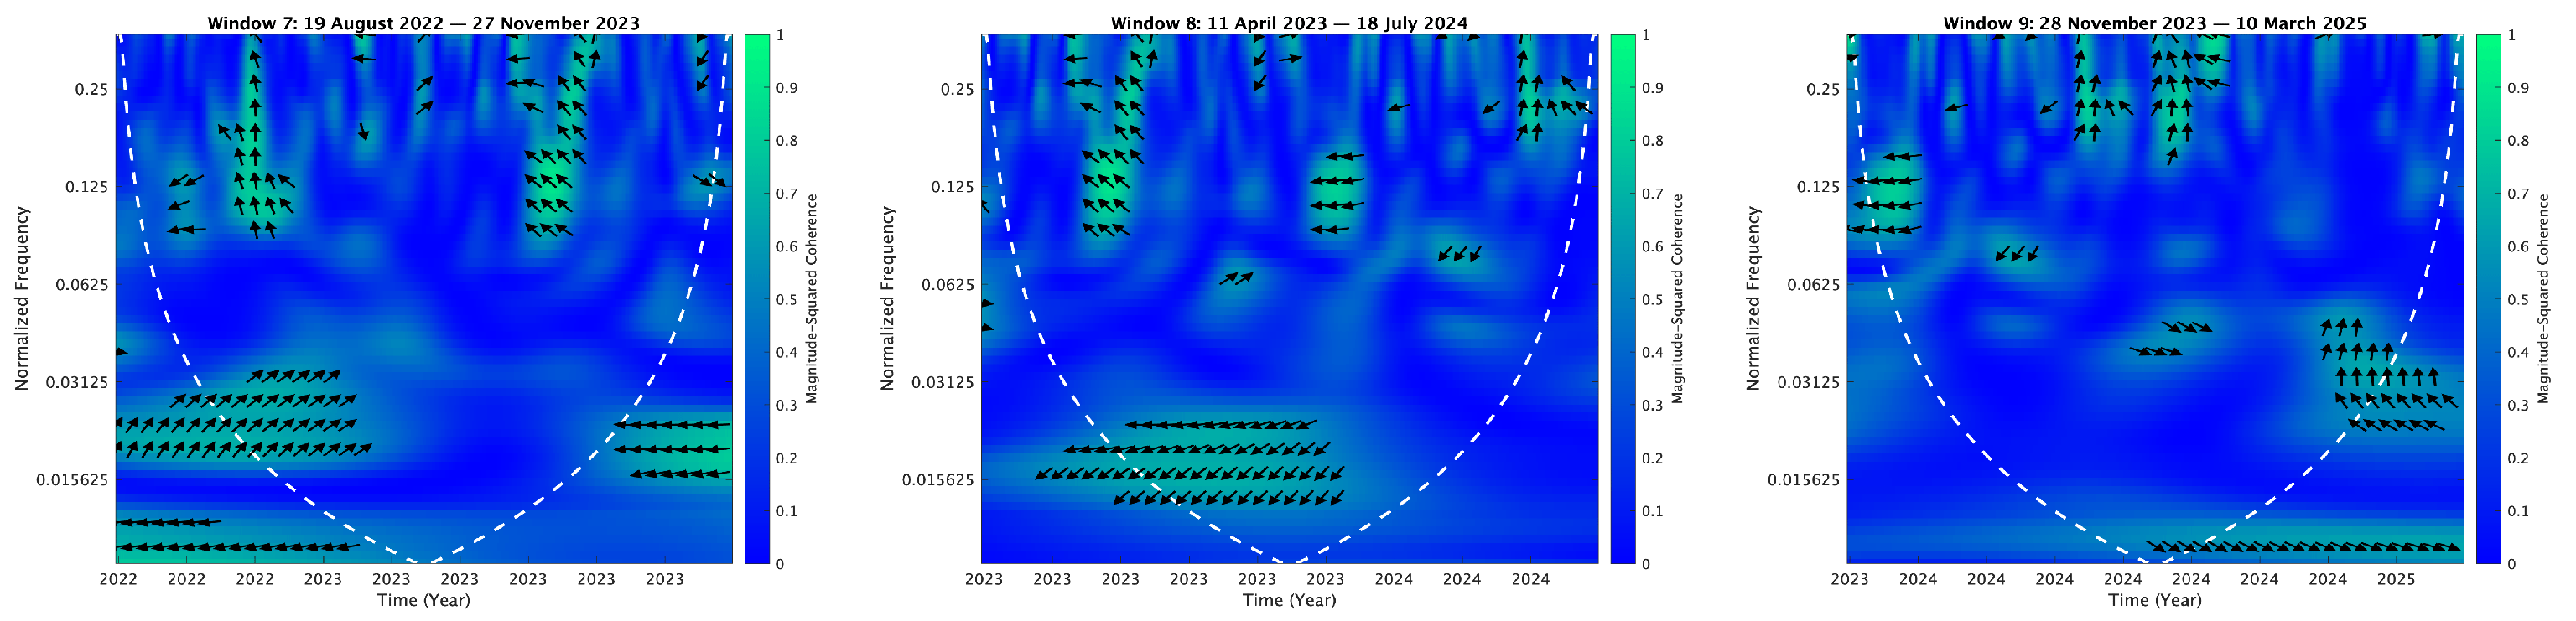
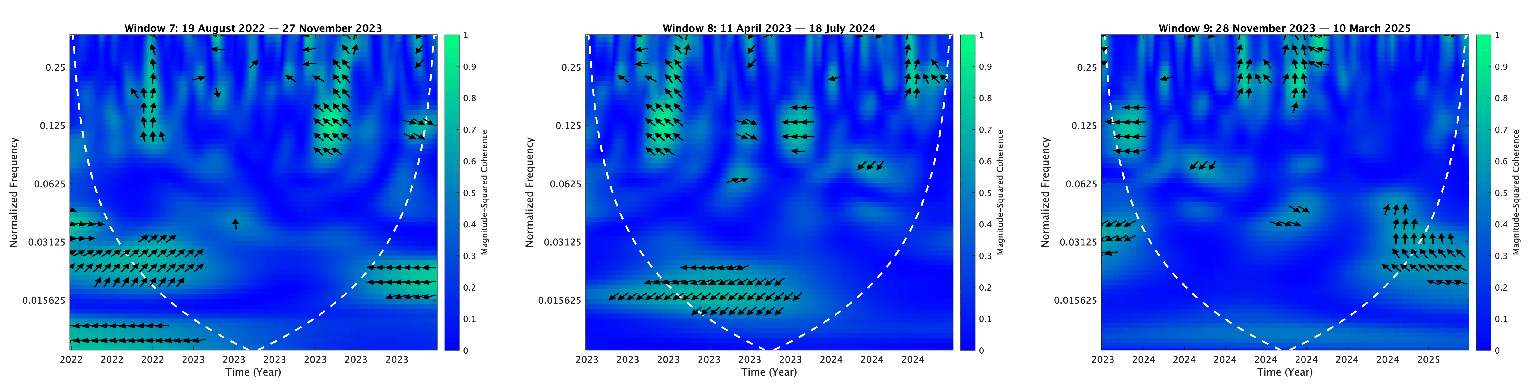
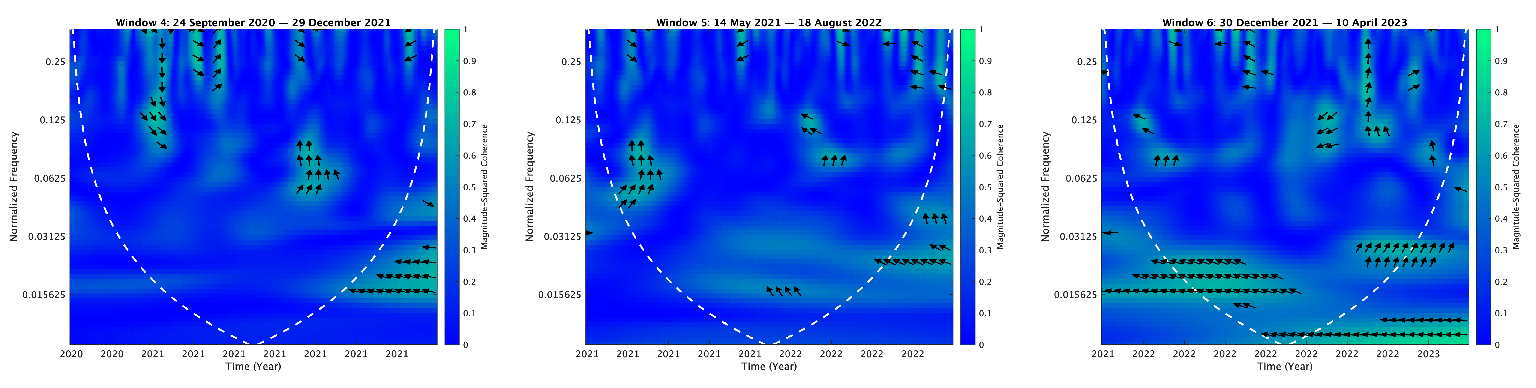
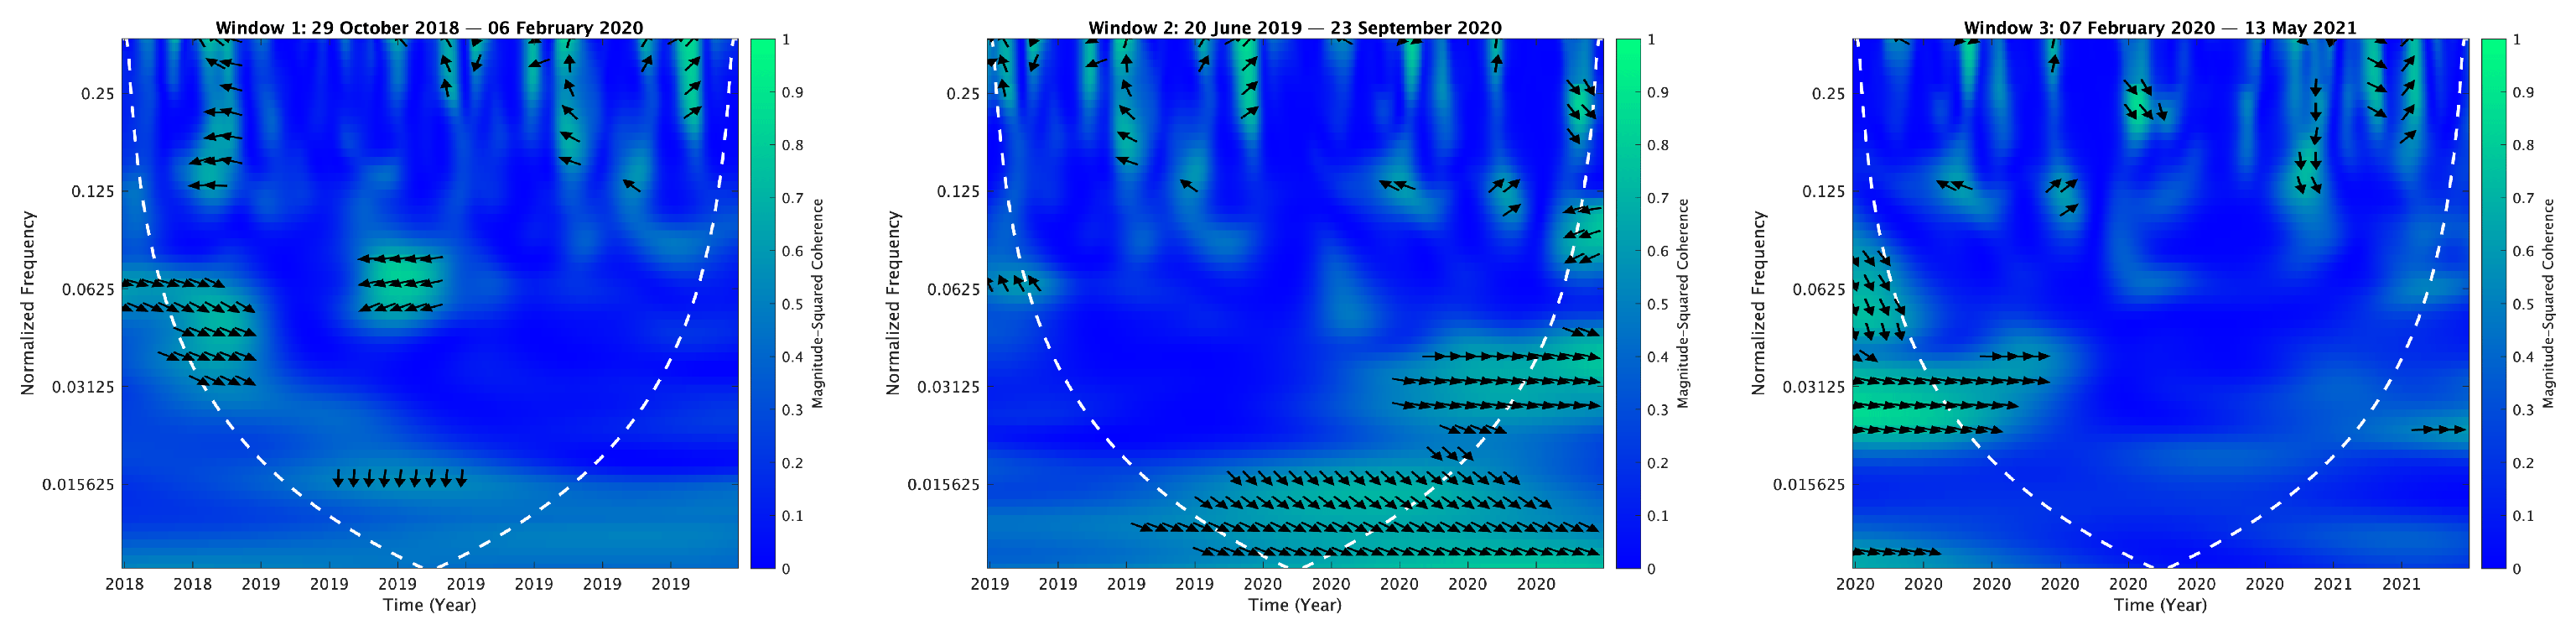
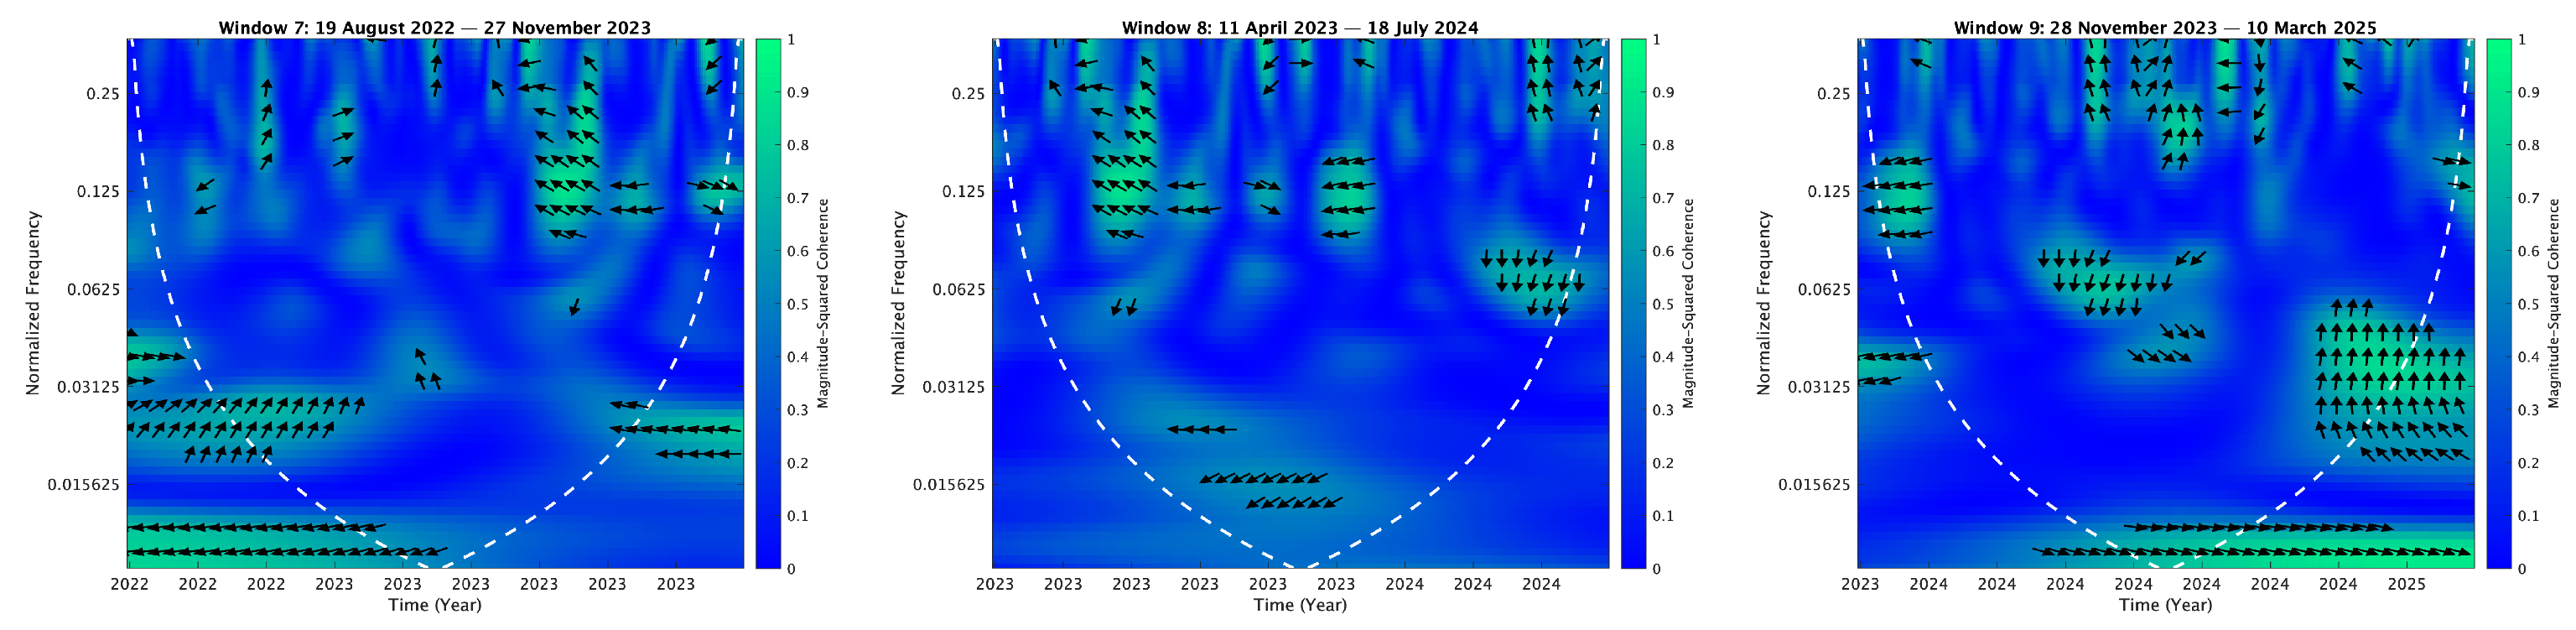
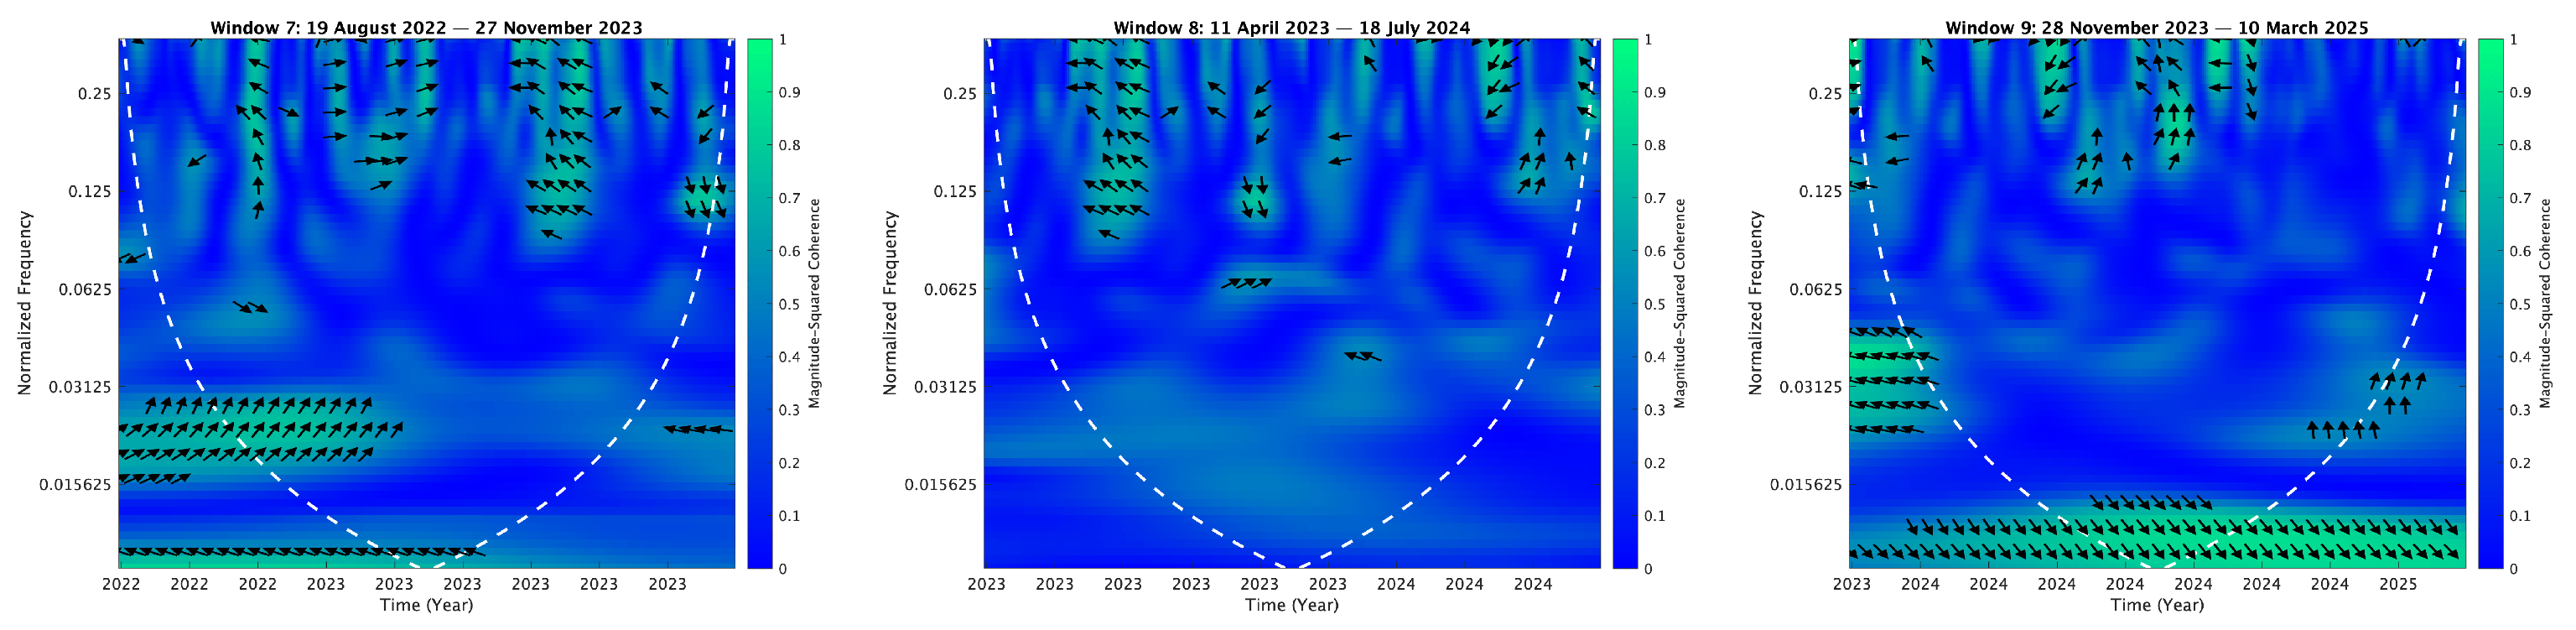
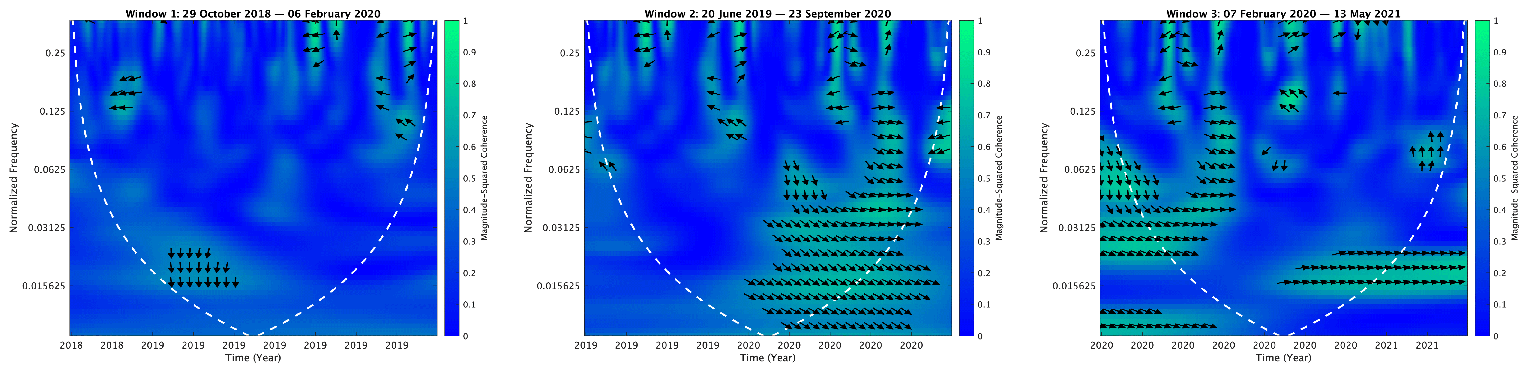
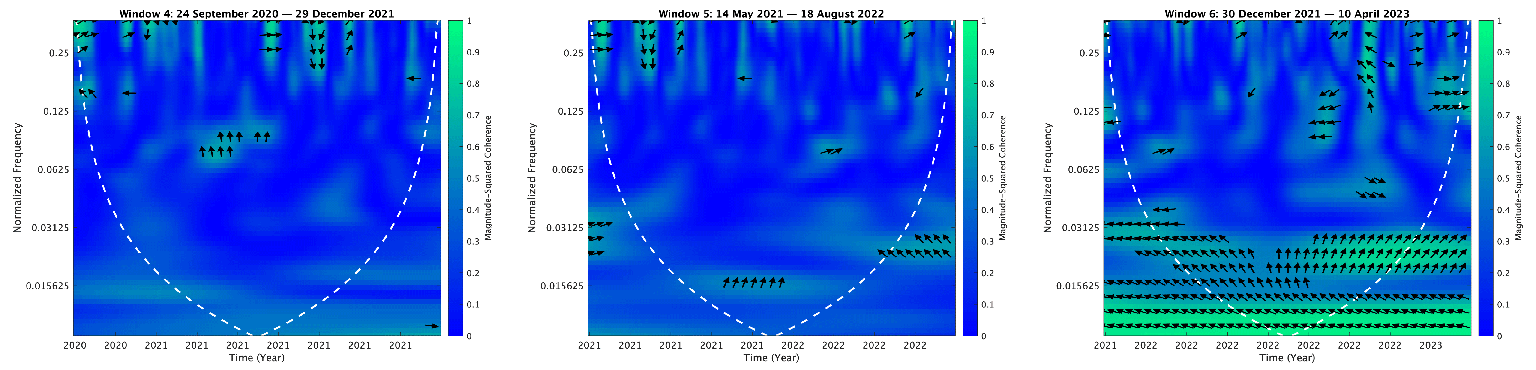
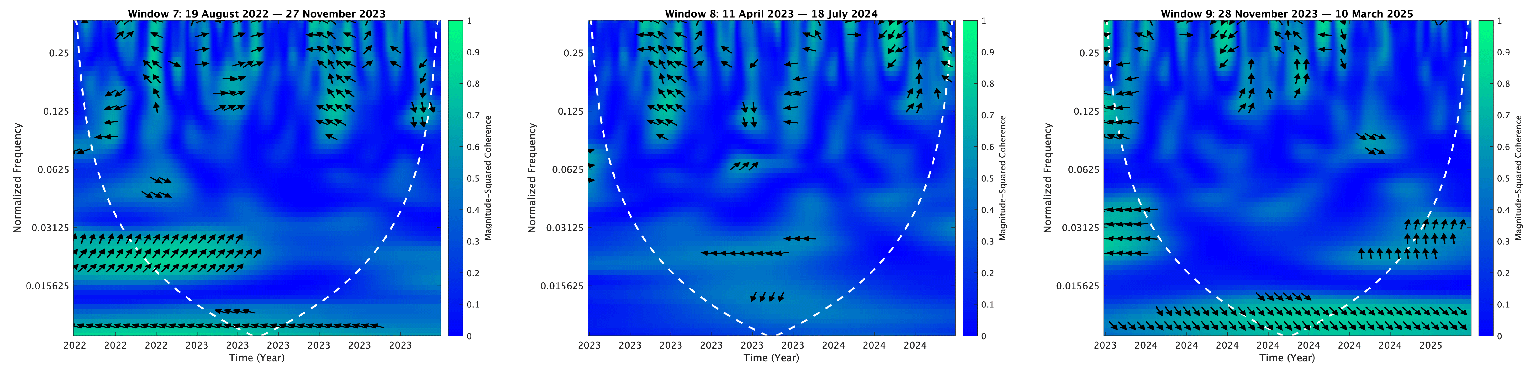
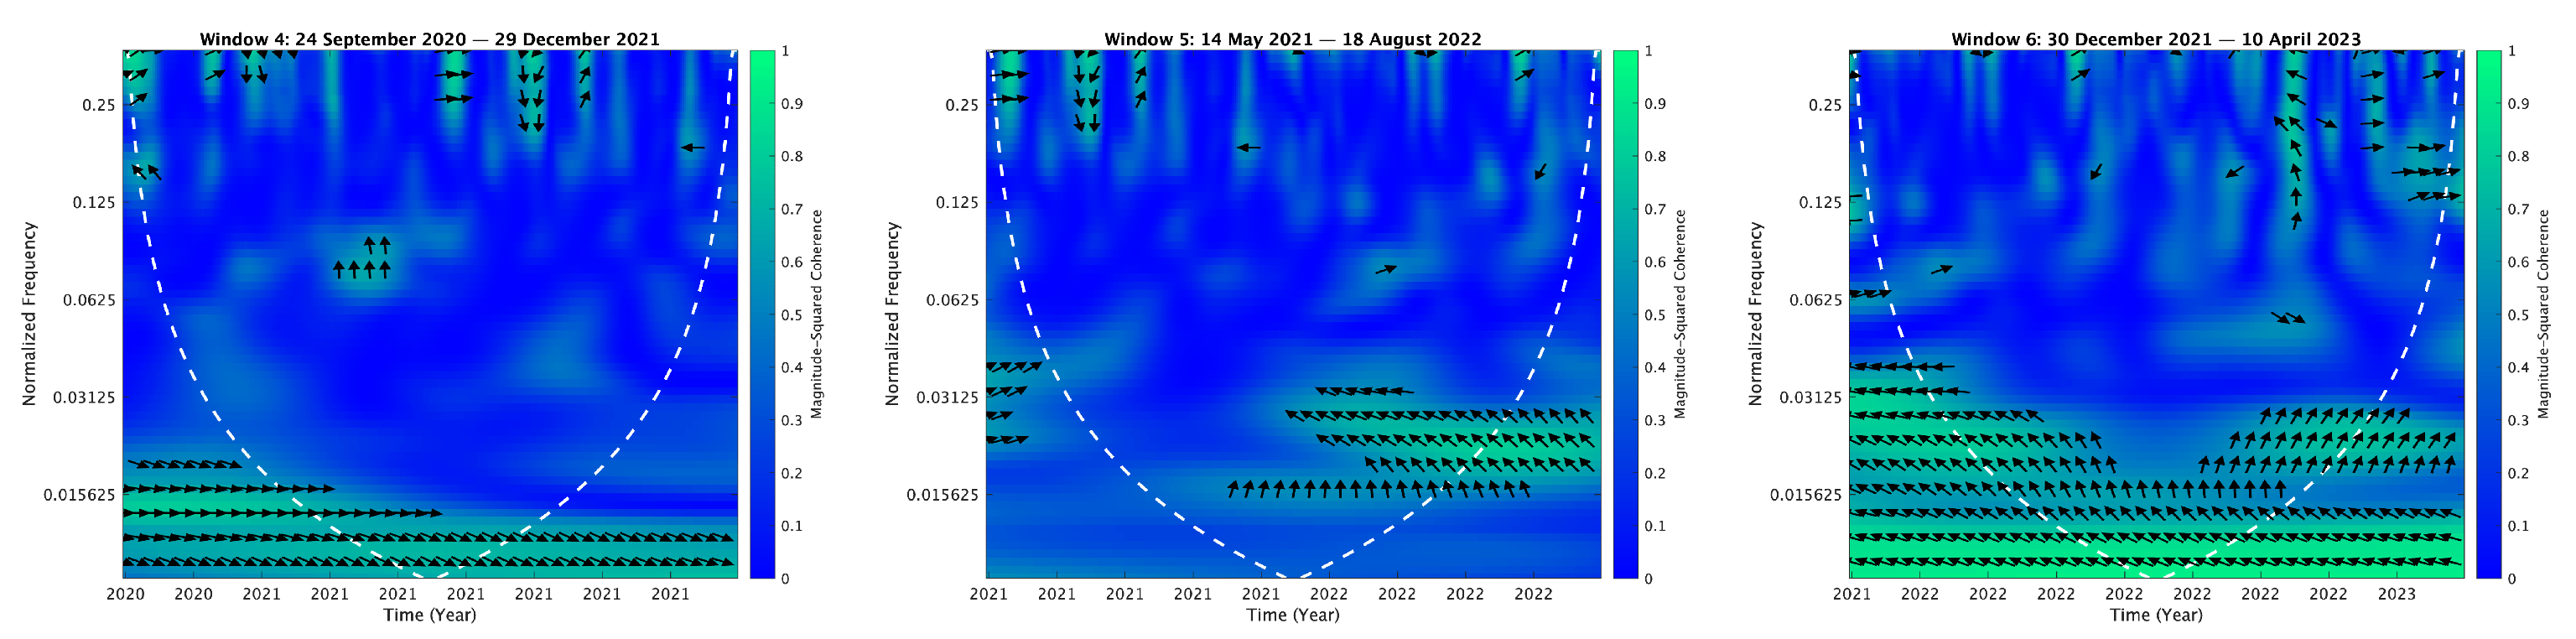
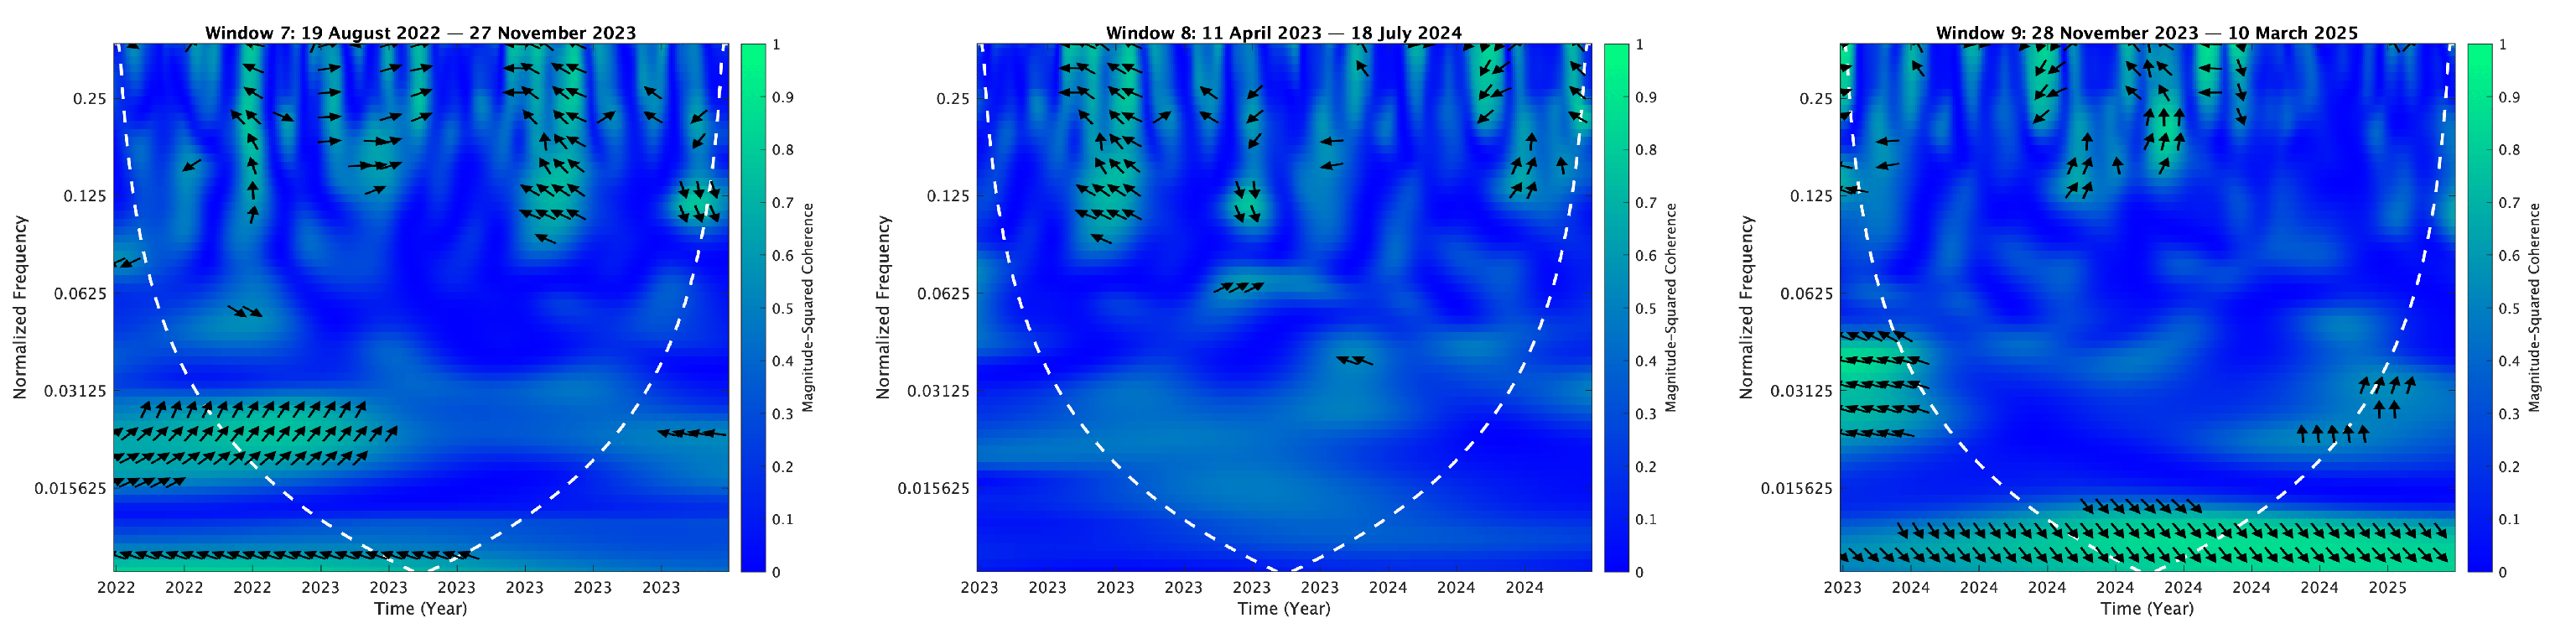
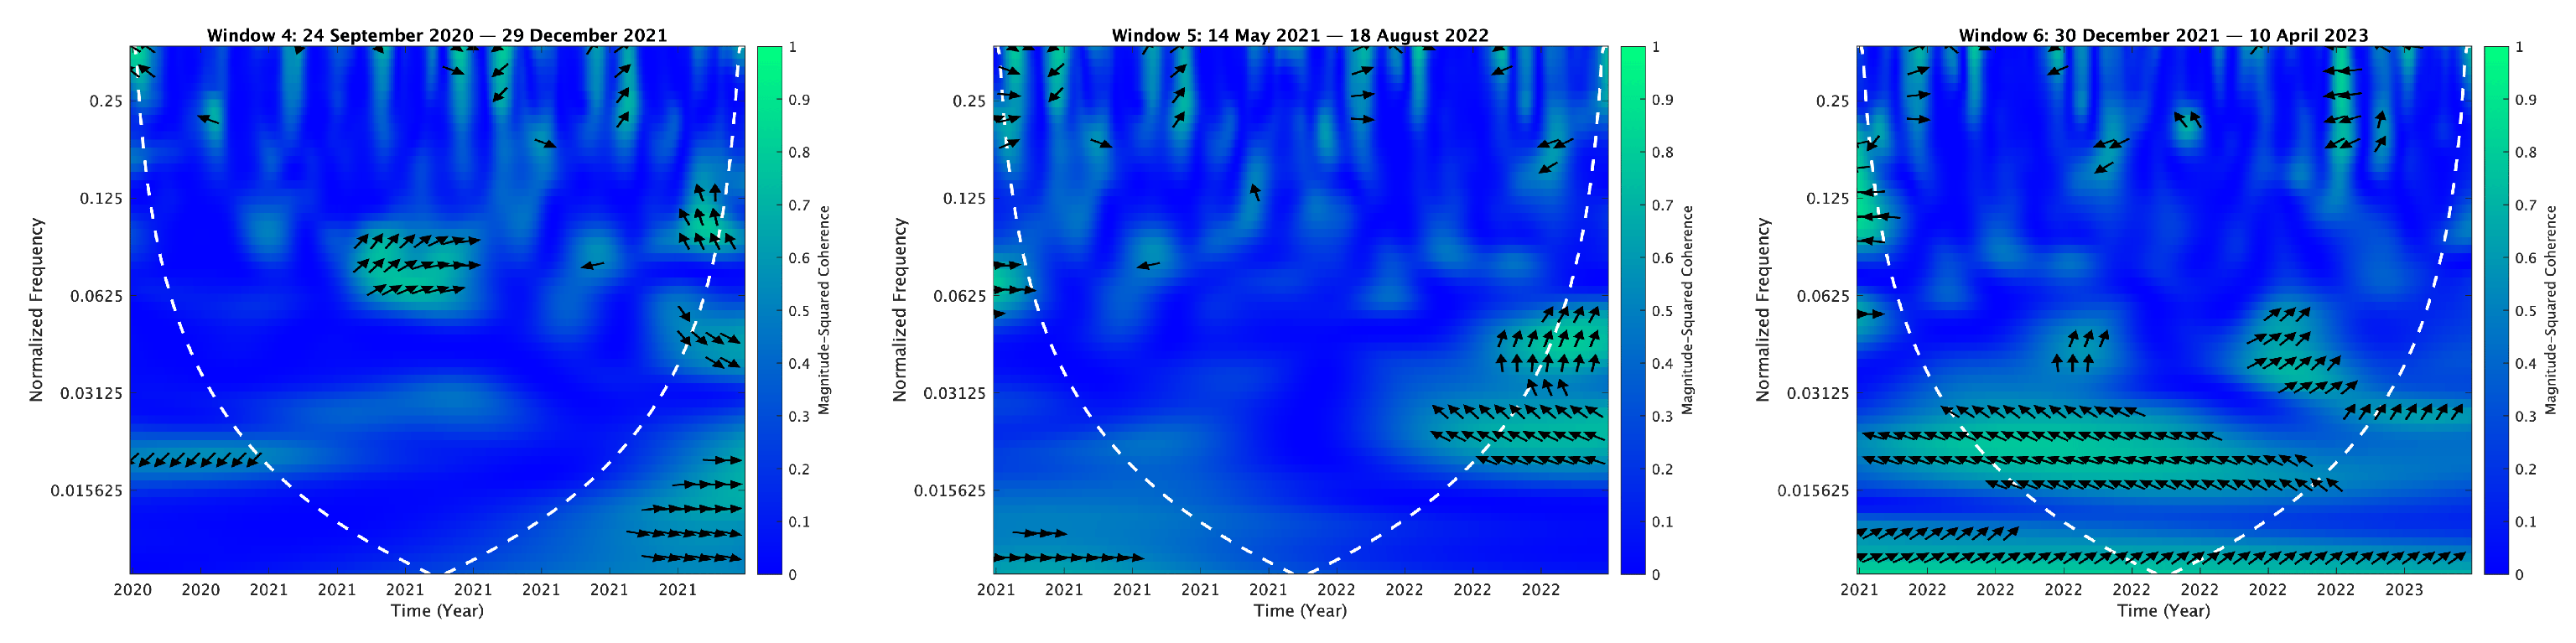
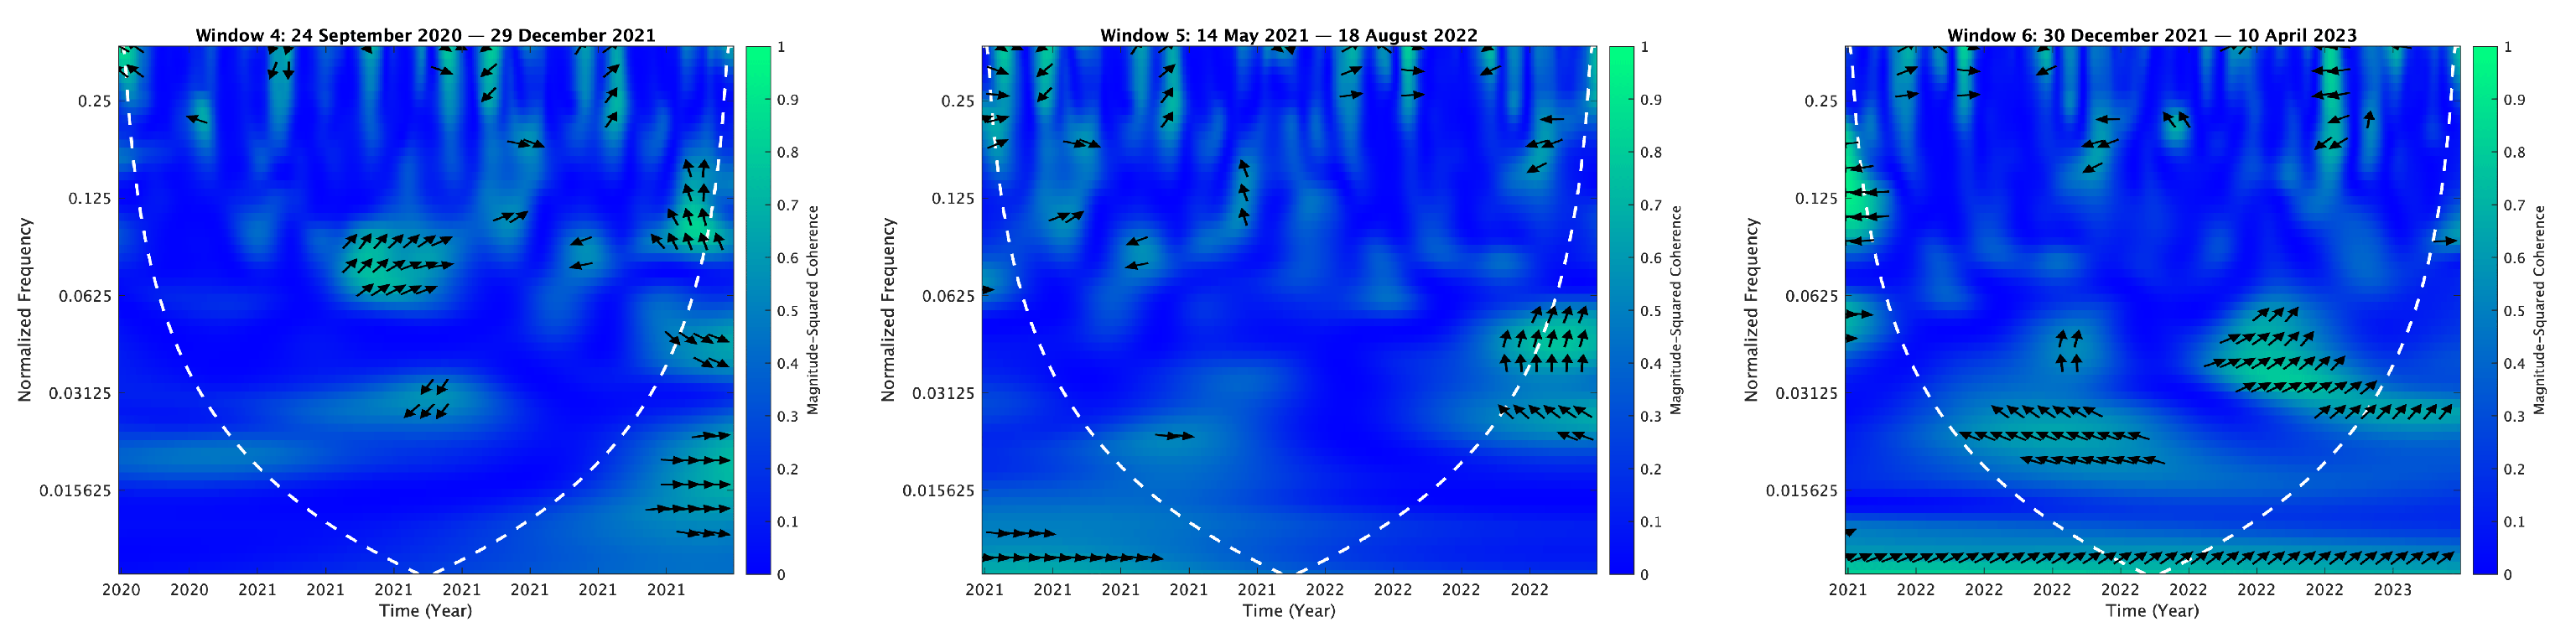
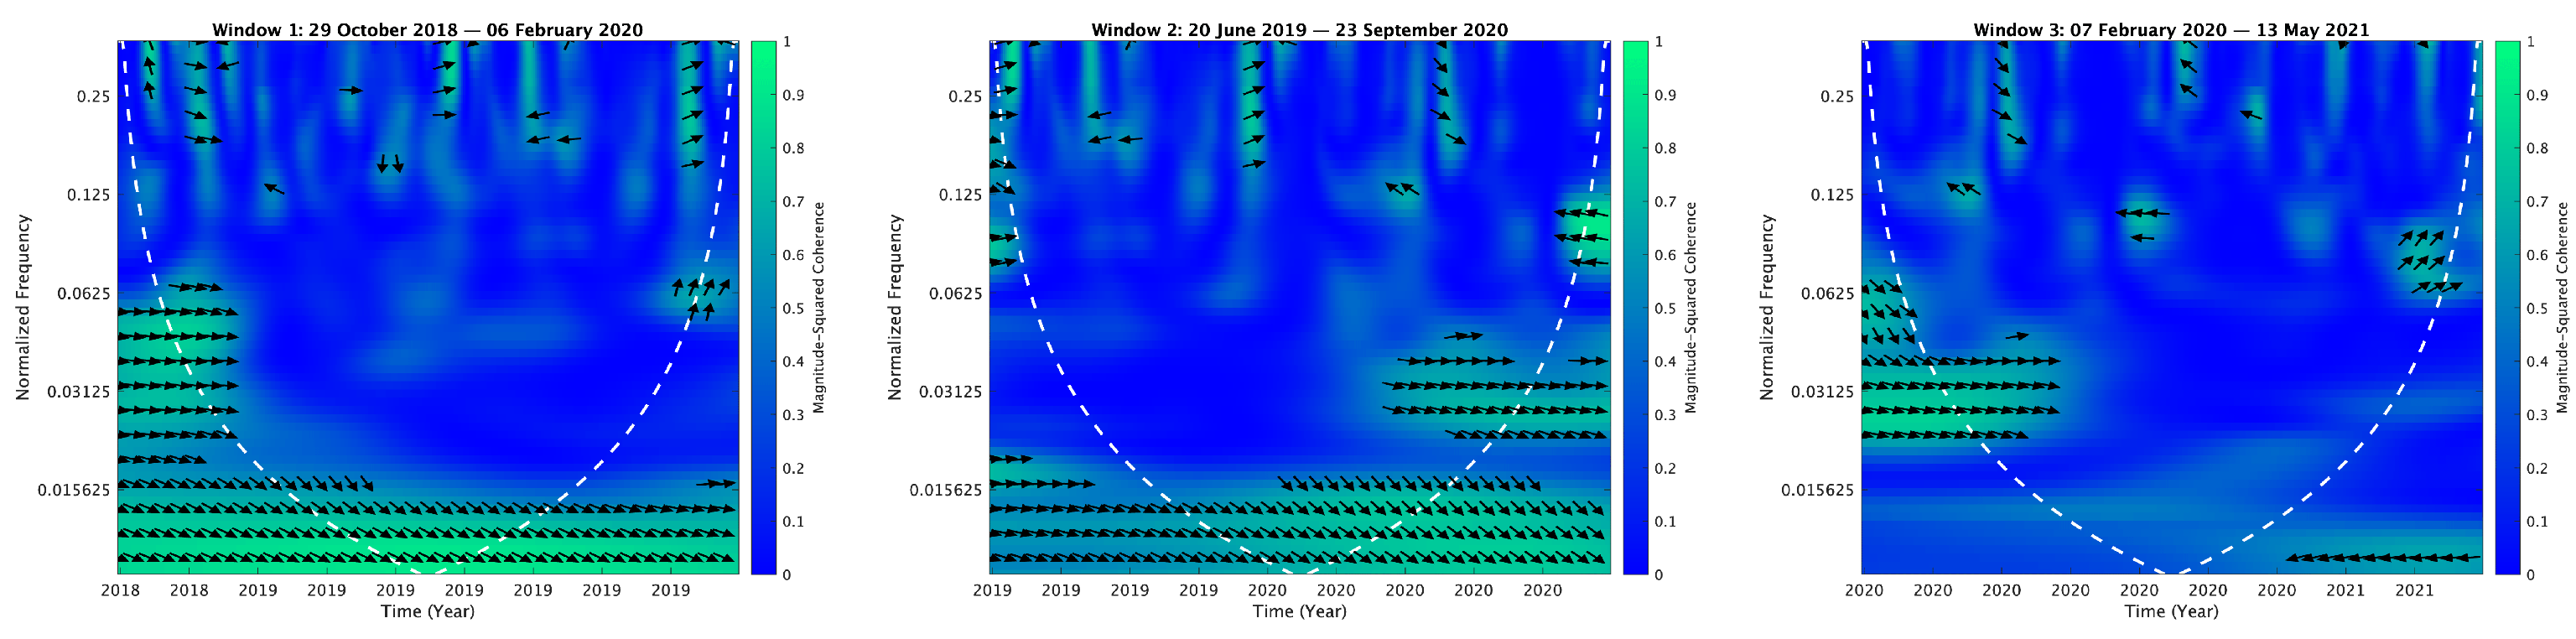
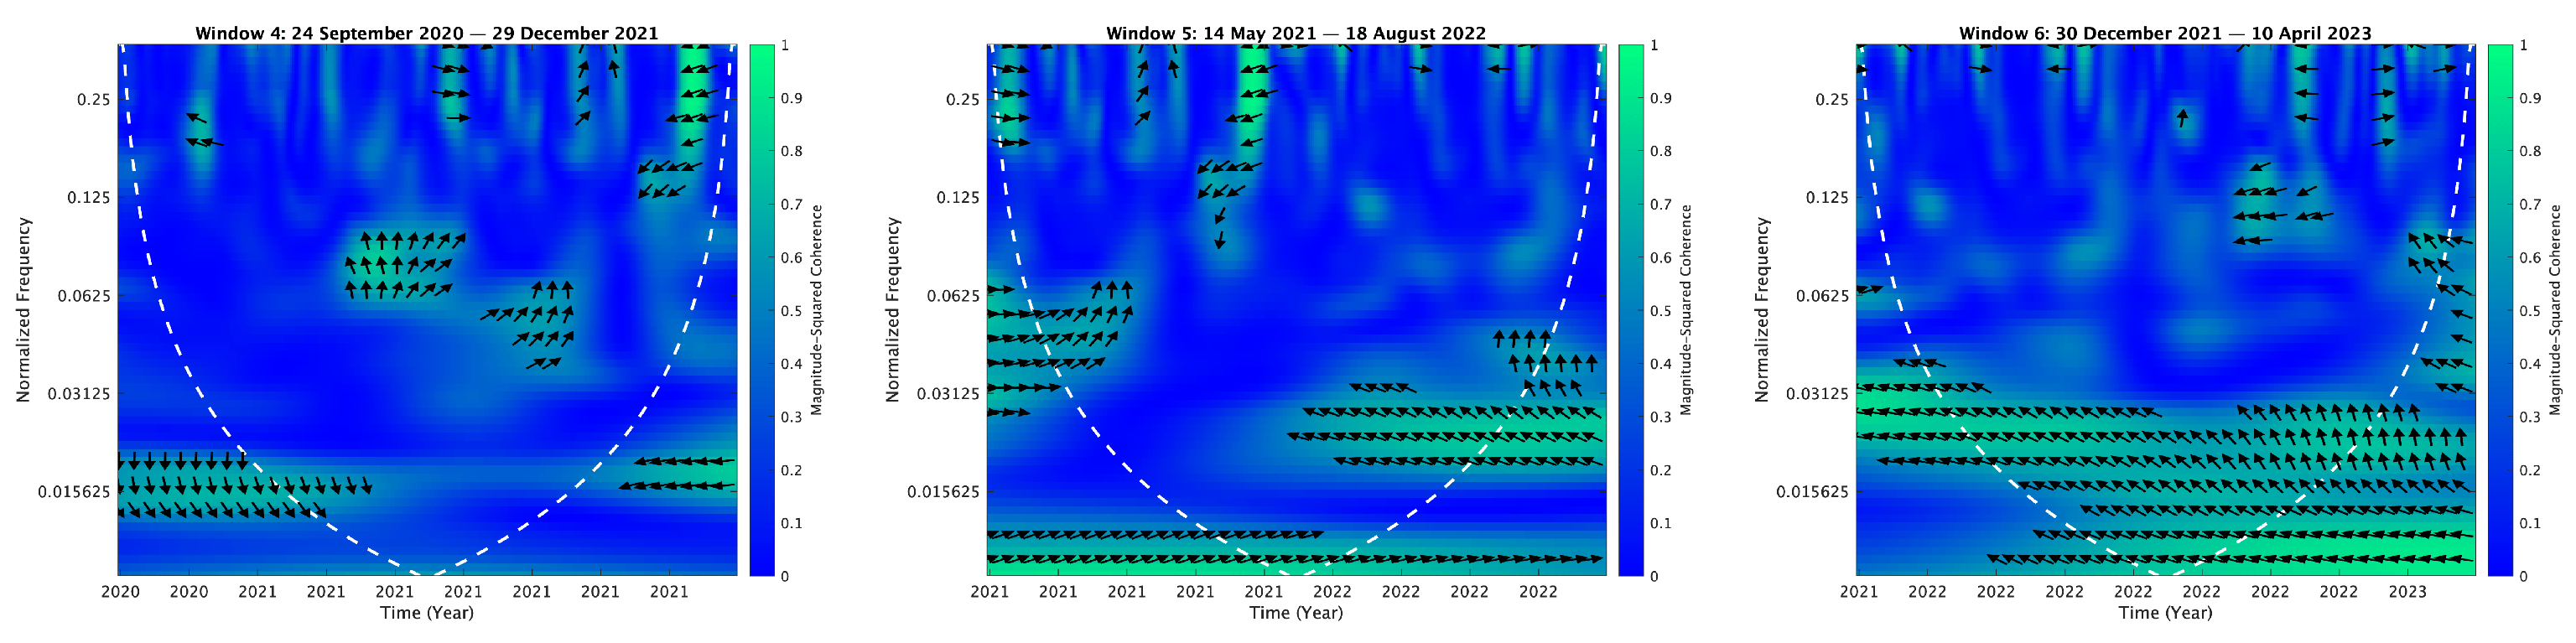
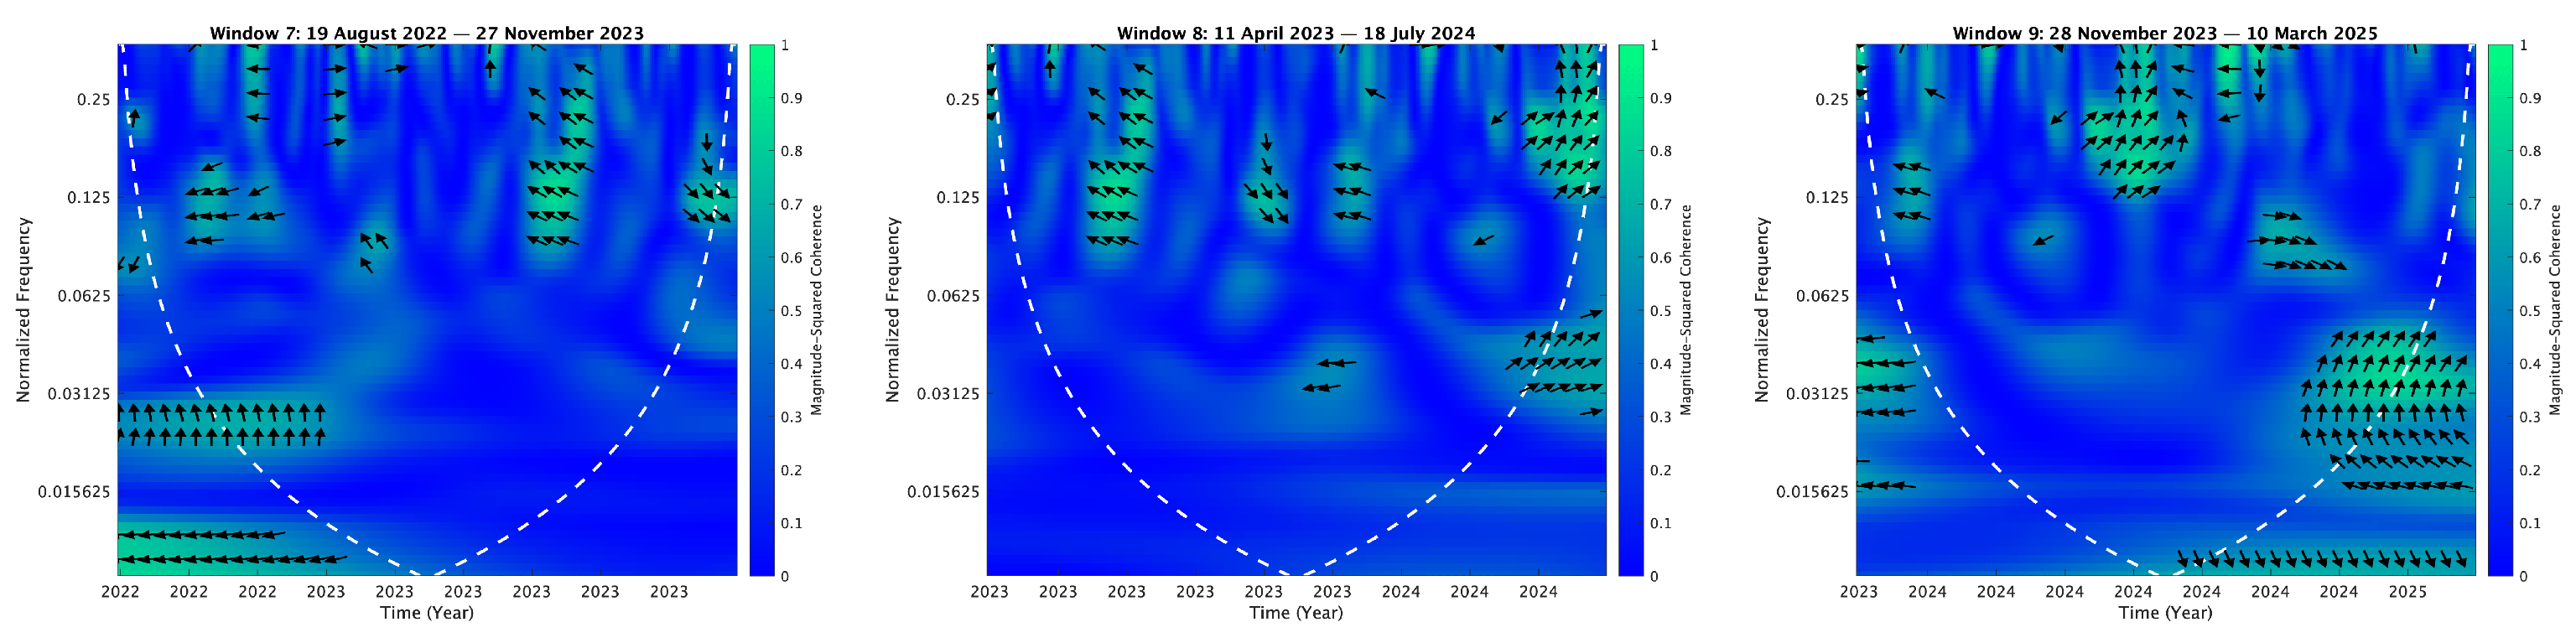
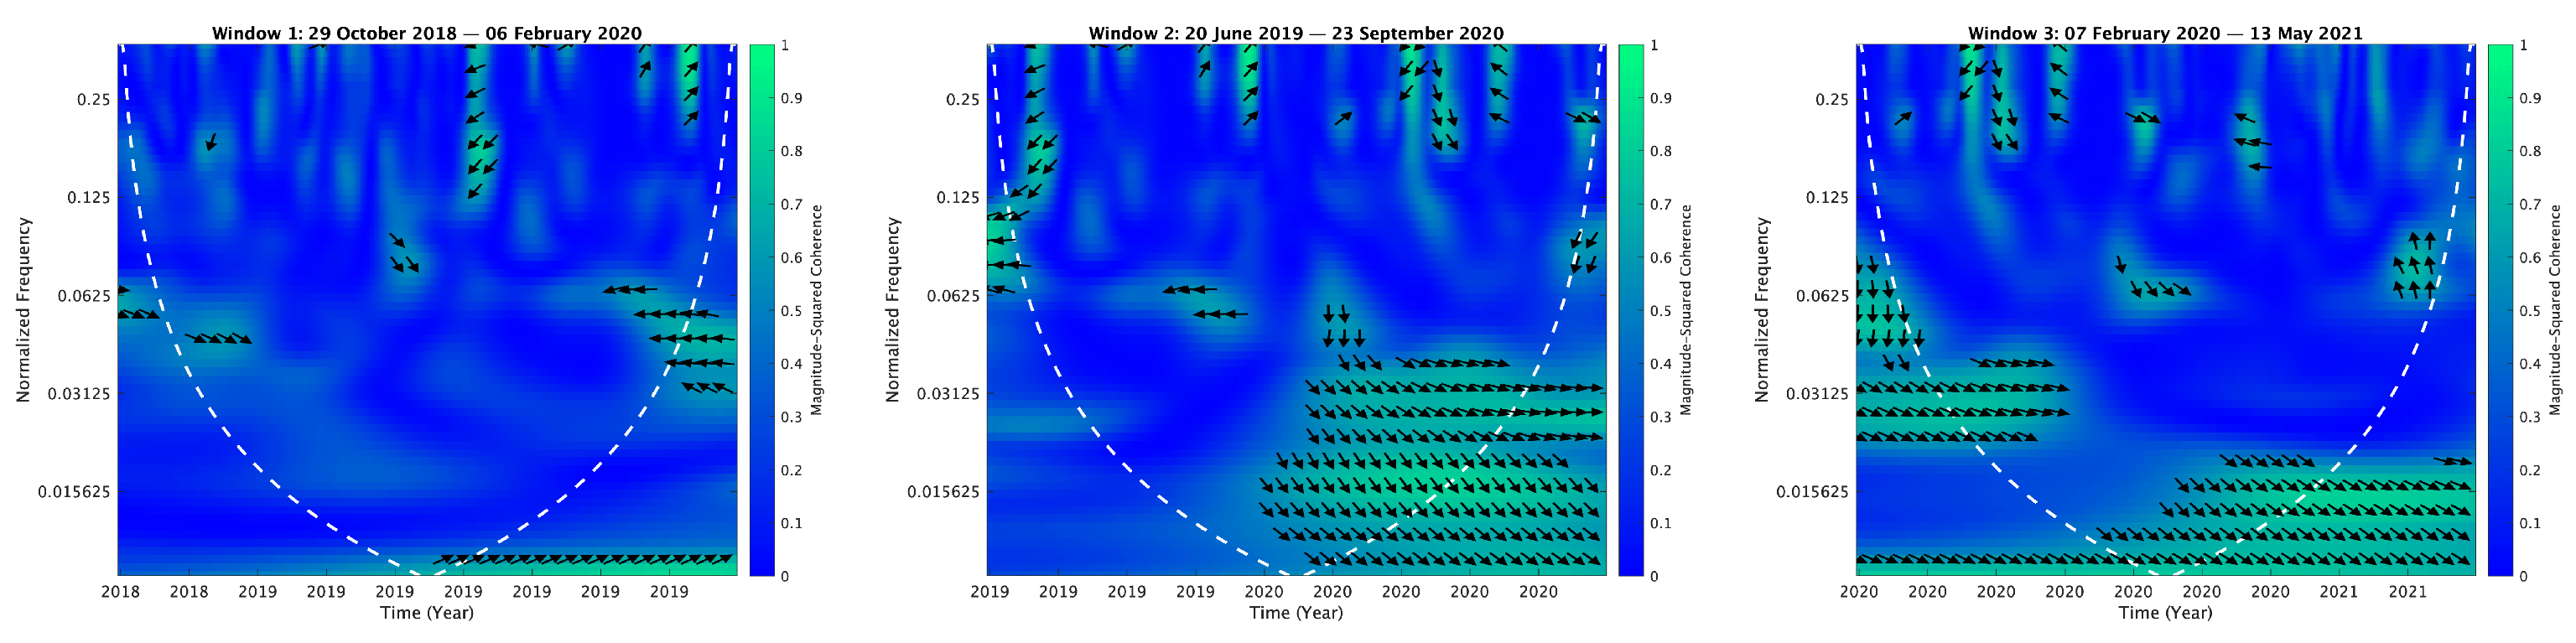
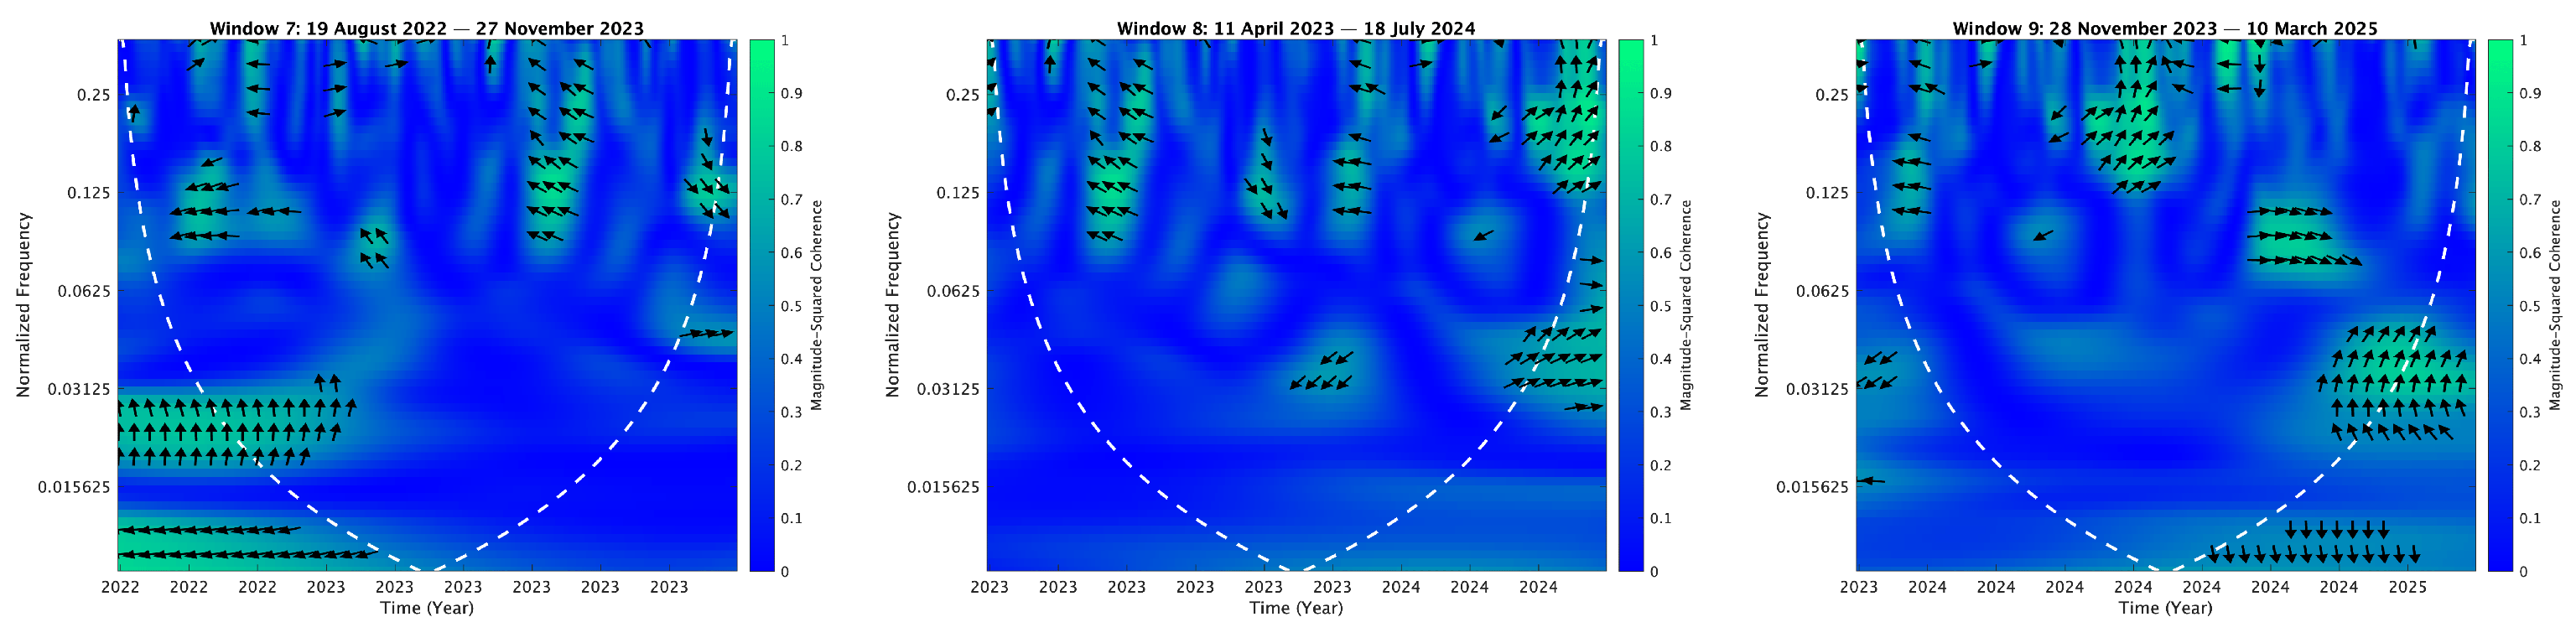
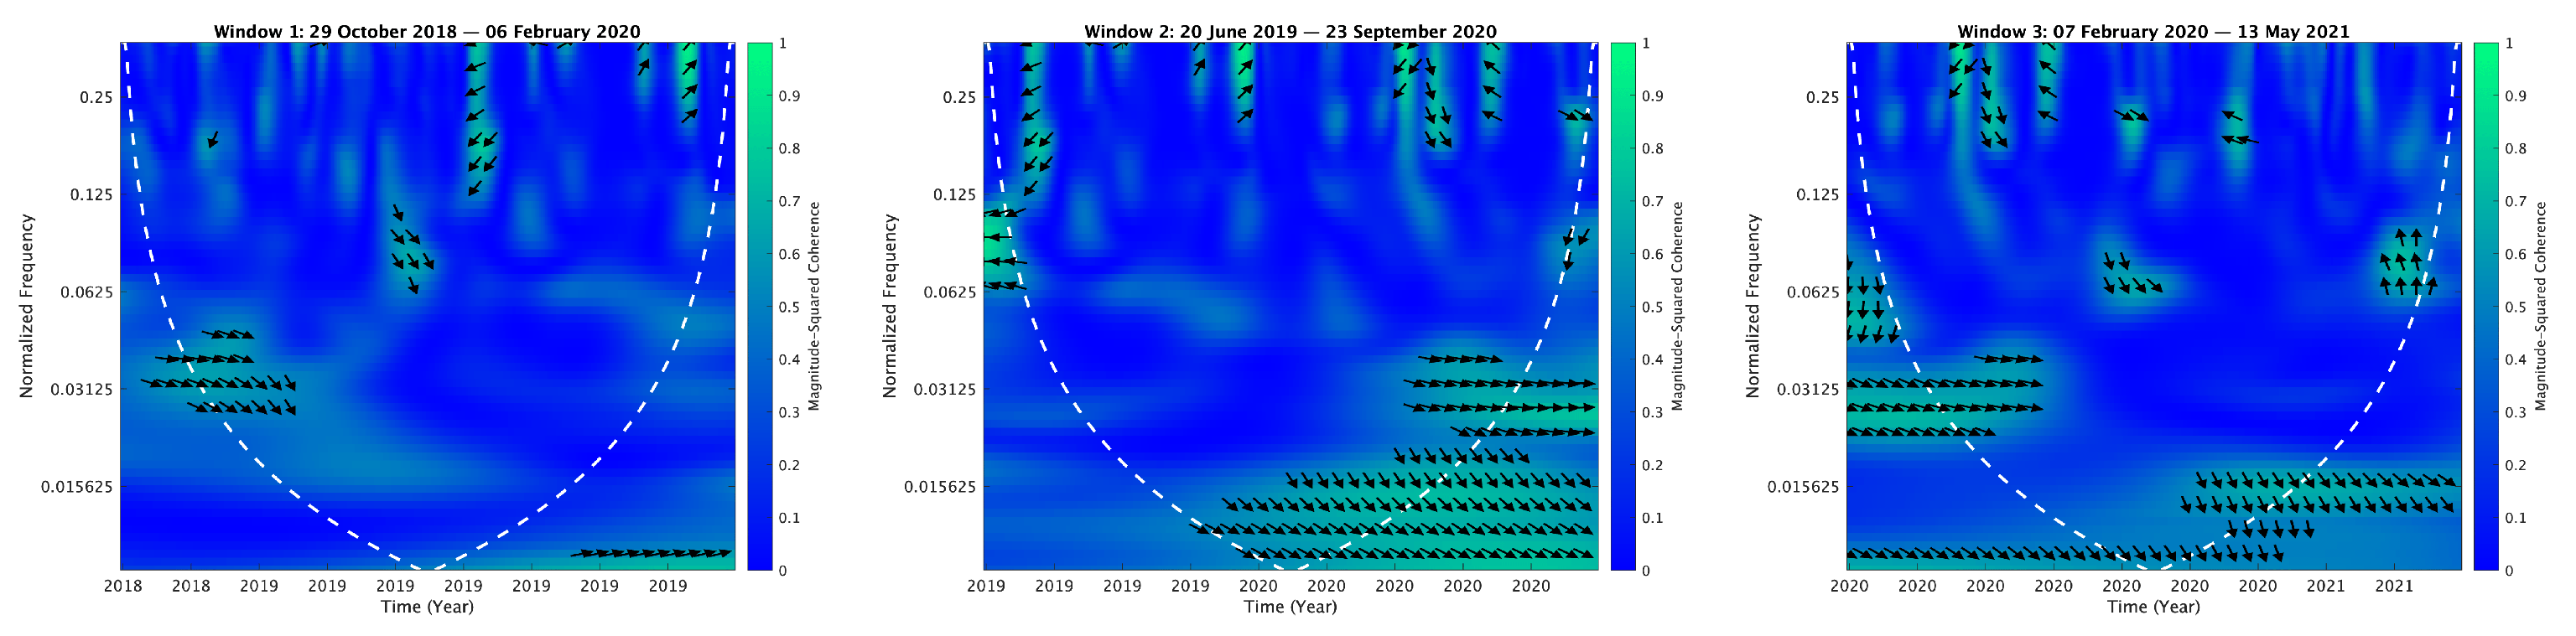
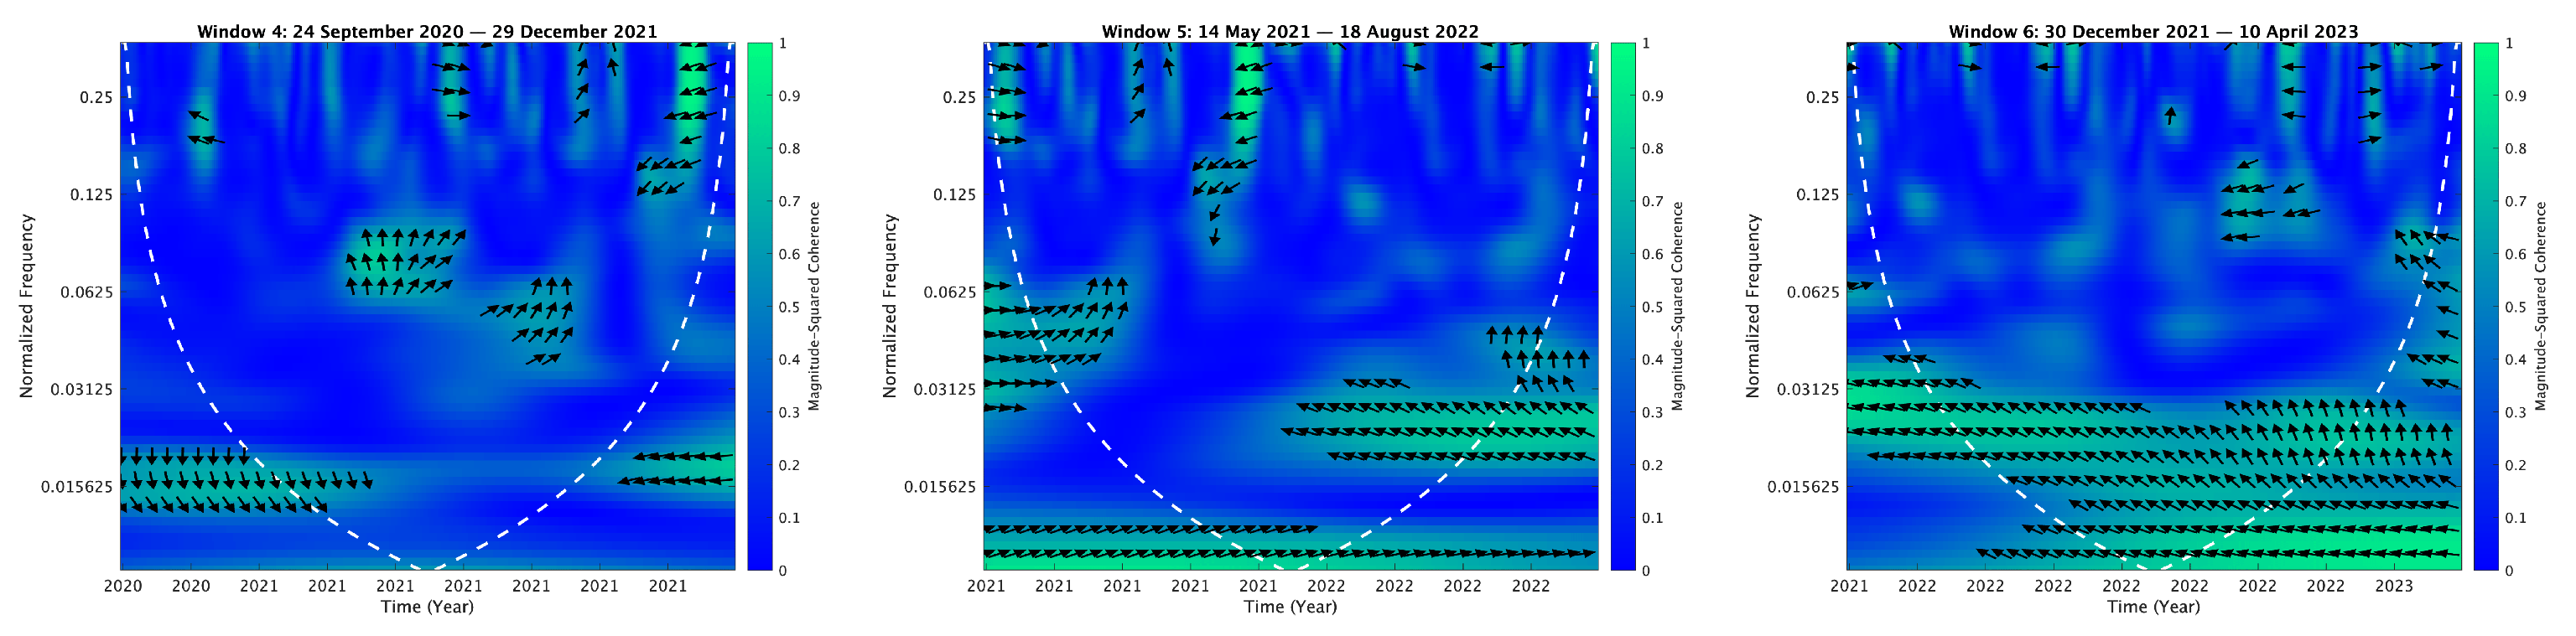
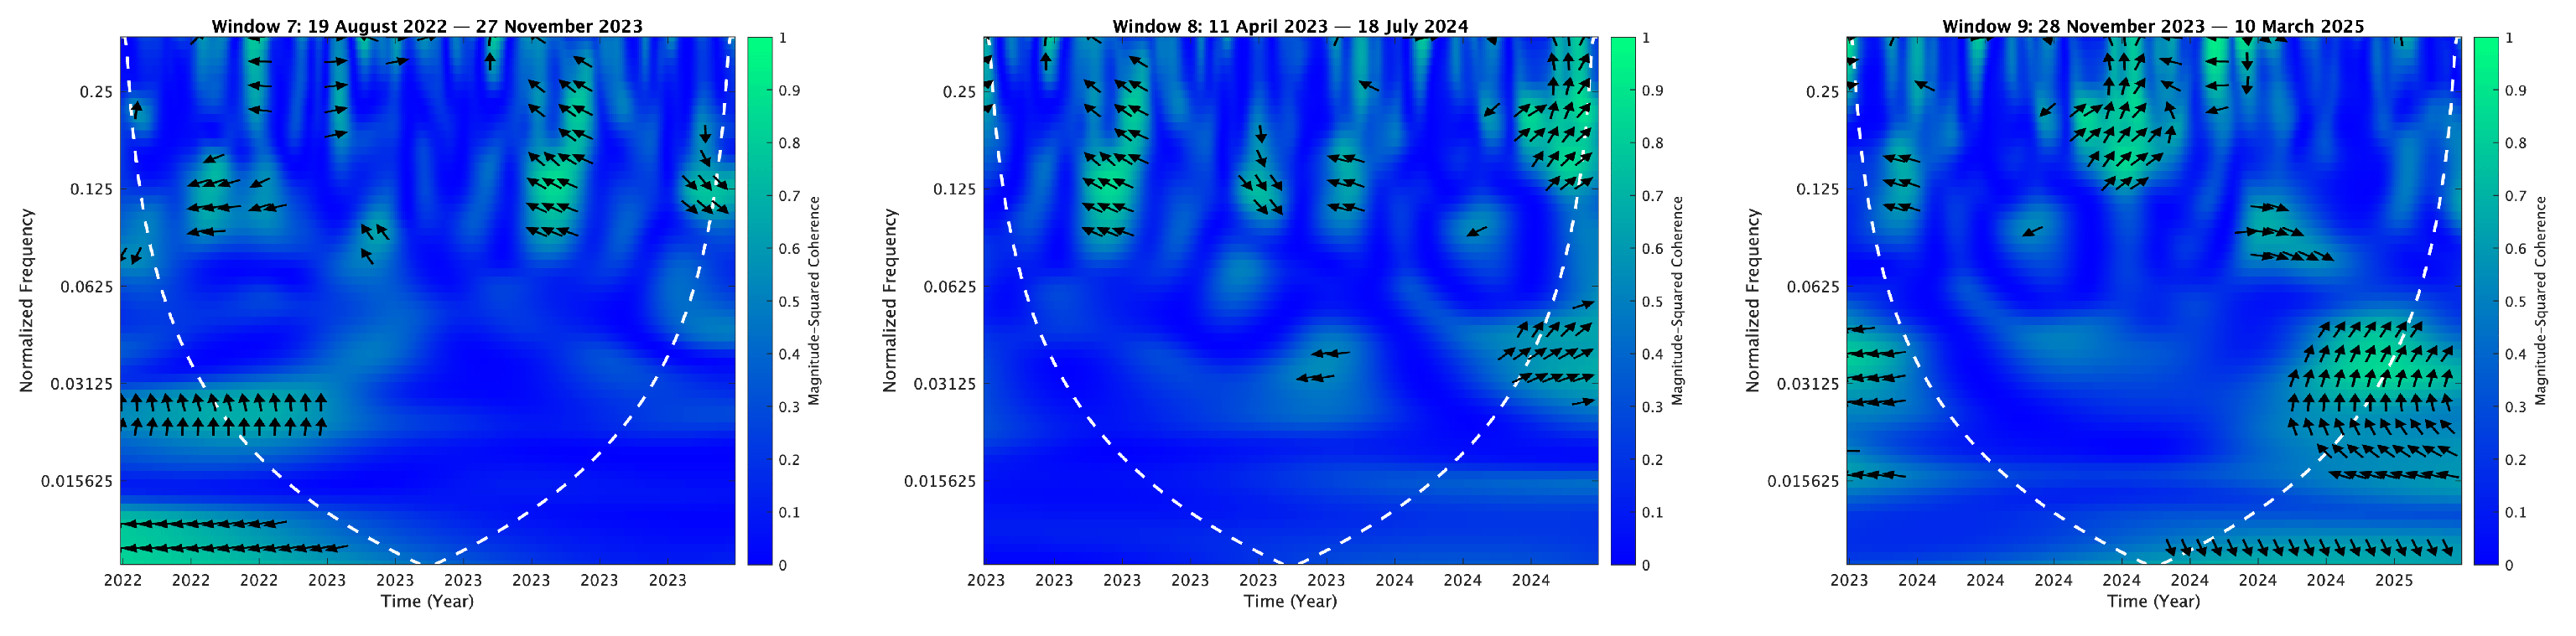
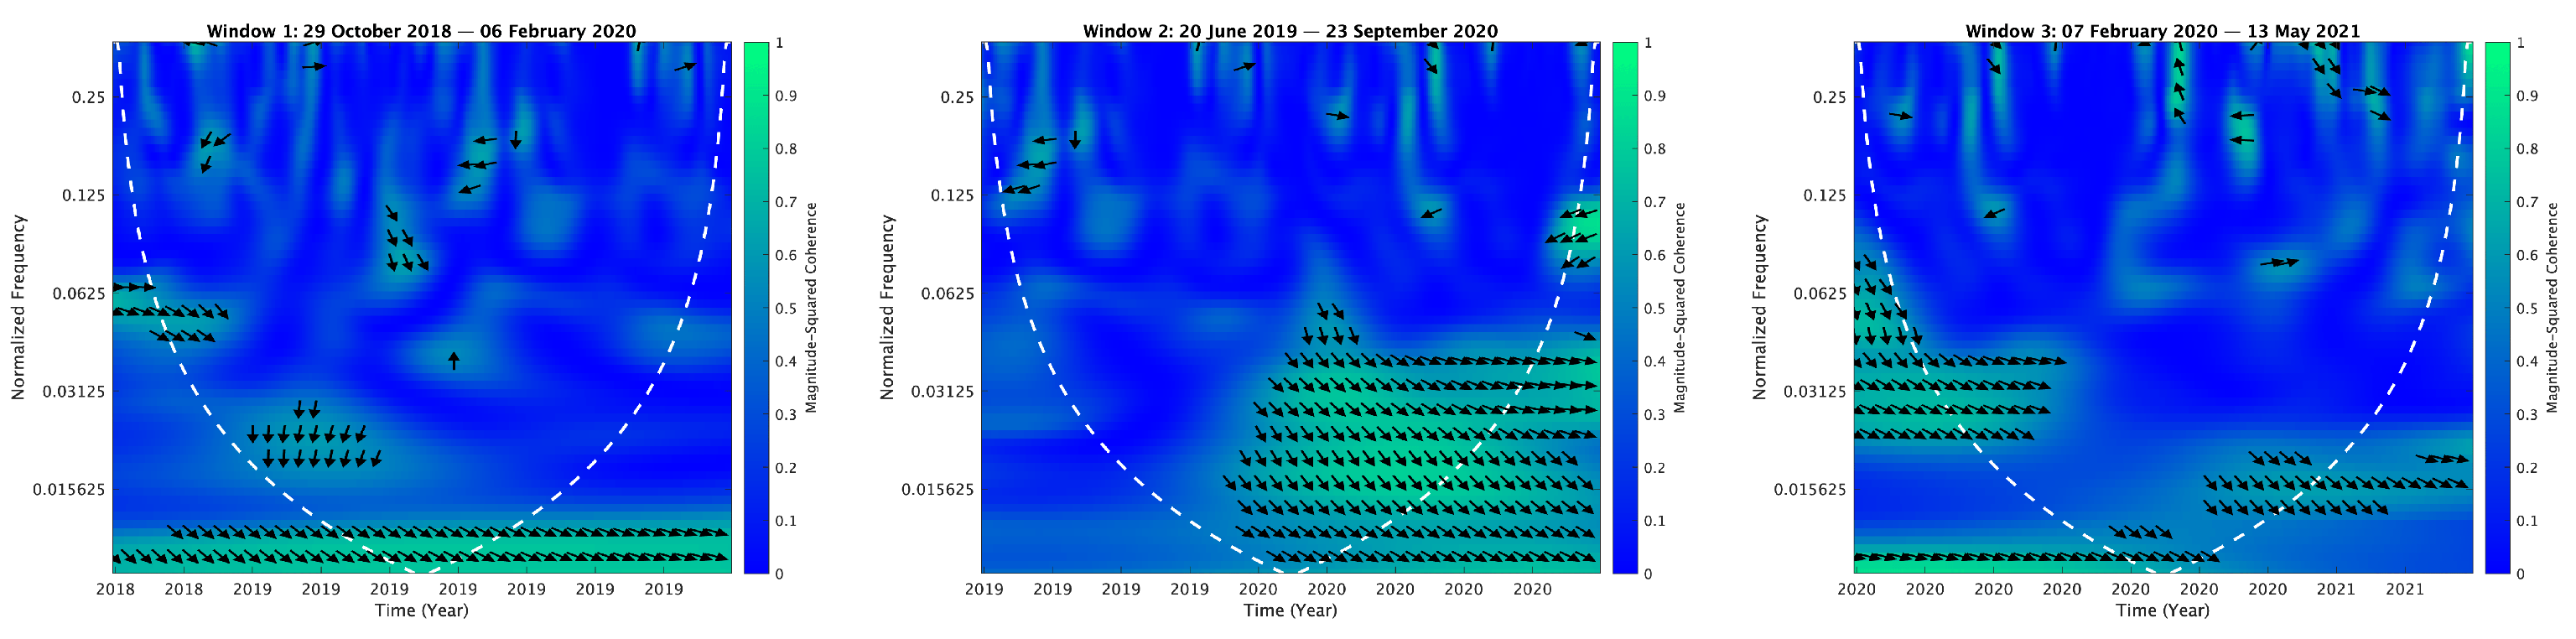
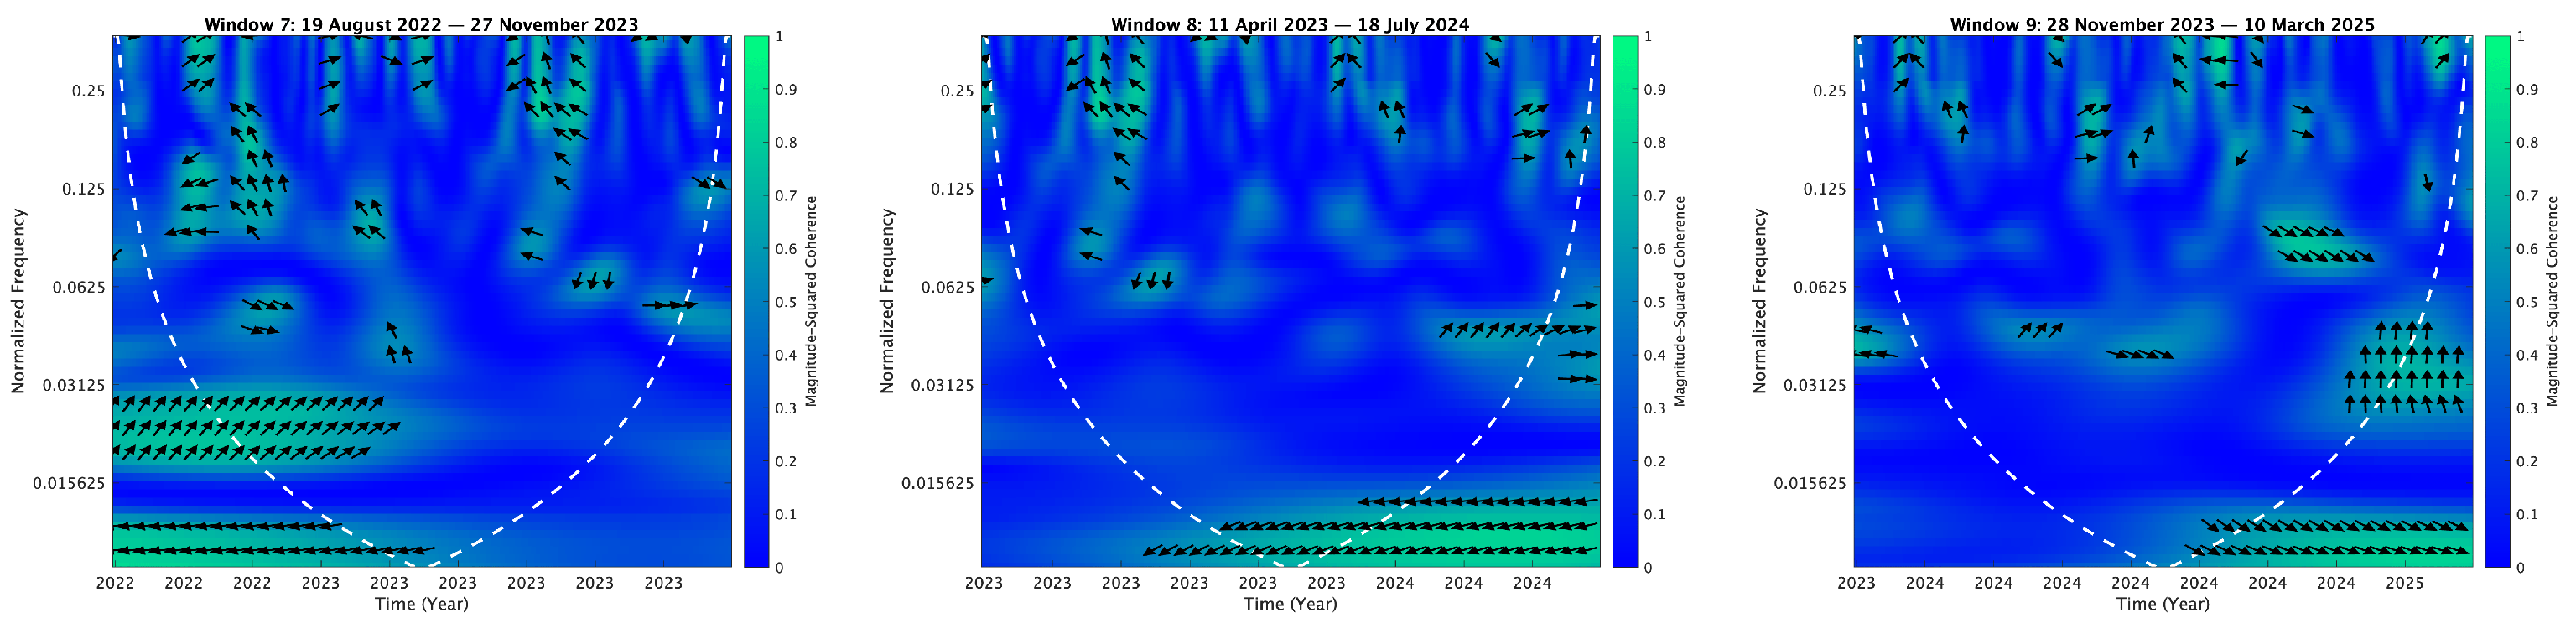
| Note: The appendix summarizes the wavelet analysis results, showing the influence of cyberattacks, severity scores, and targeted critical infrastructure on clean energy indices across time windows. Colors indicate wavelet power, with cooler tones (light blue and cyan) showing lower power and warmer tones (green) indicating higher power. Arrows depict phase relationships: rightward for in-phase, leftward for antiphase, upward for first series leading, and downward for second series leading. The white cone represents the cone of influence, beyond which edge effects may distort the results. | |
Appendix C. XWT Results
| Index/ Window | CA | SS | CI | |
| ICLN | 1 |  | ||
| 2 |  | |||
| 3 |  | |||
| 4 |  | |||
| 5 |  | |||
| 6 |  | |||
| 7 |  | |||
| 8 |  | |||
| 9 |  | |||
| TAN | 1 |  | ||
| 2 |  | |||
| 3 |  | |||
| 4 |  | |||
| 5 |  | |||
| 6 |  | |||
| 7 |  | |||
| 8 |  | |||
| 9 |  | |||
| QCLN | 1 |  | ||
| 2 |  | |||
| 3 |  | |||
| 4 |  | |||
| 5 |  | |||
| 6 |  | |||
| 7 |  | |||
| 8 |  | |||
| 9 |  | |||
| CNRG | 1 |  | ||
| 2 |  | |||
| 3 |  | |||
| 4 |  | |||
| 5 |  | |||
| 6 |  | |||
| 7 |  | |||
| 8 |  | |||
| 9 |  | |||
| ACES | 1 |  | ||
| 2 |  | |||
| 3 |  | |||
| 4 |  | |||
| 5 |  | |||
| 6 |  | |||
| 7 |  | |||
| 8 |  | |||
| 9 |  | |||
| PBW | 1 |  | ||
| 2 |  | |||
| 3 |  | |||
| 4 |  | |||
| 5 |  | |||
| 6 |  | |||
| 7 |  | |||
| 8 |  | |||
| 9 |  | |||
| RNRG | 1 |  | ||
| 2 |  | |||
| 3 |  | |||
| 4 |  | |||
| 5 |  | |||
| 6 |  | |||
| 7 |  | |||
| 8 |  | |||
| 9 |  | |||
| ACWI | 1 |  | ||
| 2 |  | |||
| 3 |  | |||
| 4 |  | |||
| 5 |  | |||
| 6 |  | |||
| 7 |  | |||
| 8 |  | |||
| 9 |  | |||
| IEUR | 1 |  | ||
| 2 |  | |||
| 3 |  | |||
| 4 |  | |||
| 5 |  | |||
| 6 |  | |||
| 7 |  | |||
| 8 |  | |||
| 9 |  | |||
| EEMA | 1 |  | ||
| 2 |  | |||
| 3 |  | |||
| 4 |  | |||
| 5 |  | |||
| 6 |  | |||
| 7 |  | |||
| 8 |  | |||
| 9 |  | |||
| EWZ | 1 |  | ||
| 2 |  | |||
| 3 |  | |||
| 4 |  | |||
| 5 |  | |||
| 6 |  | |||
| 7 |  | |||
| 8 |  | |||
| 9 |  | |||
| EZA | 1 |  | ||
| 2 |  | |||
| 3 |  | |||
| 4 |  | |||
| 5 |  | |||
| 6 |  | |||
| 7 |  | |||
| 8 |  | |||
| 9 |  | |||
| AFK | 1 |  | ||
| 2 |  | |||
| 3 |  | |||
| 4 |  | |||
| 5 |  | |||
| 6 |  | |||
| 7 |  | |||
| 8 |  | |||
| 9 |  | |||
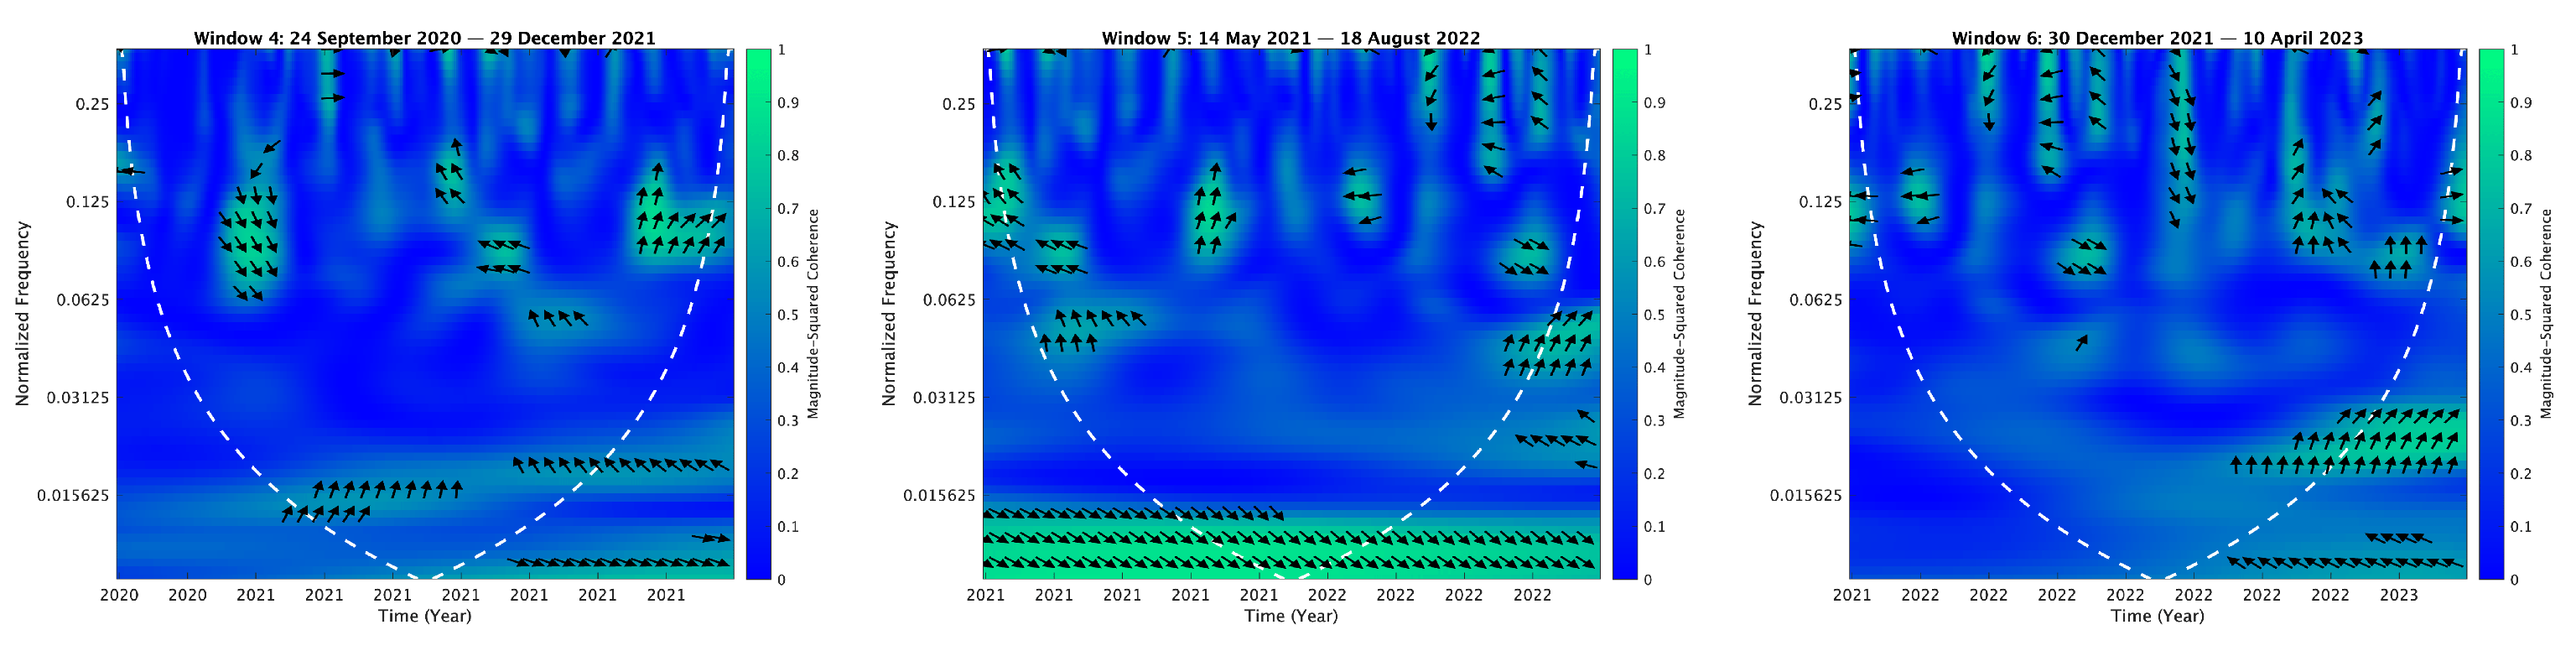
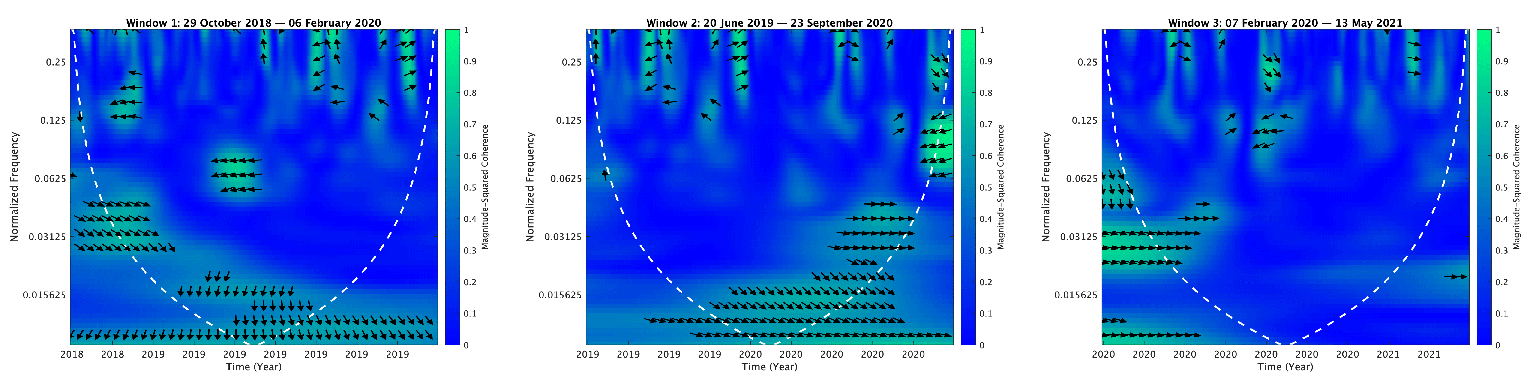
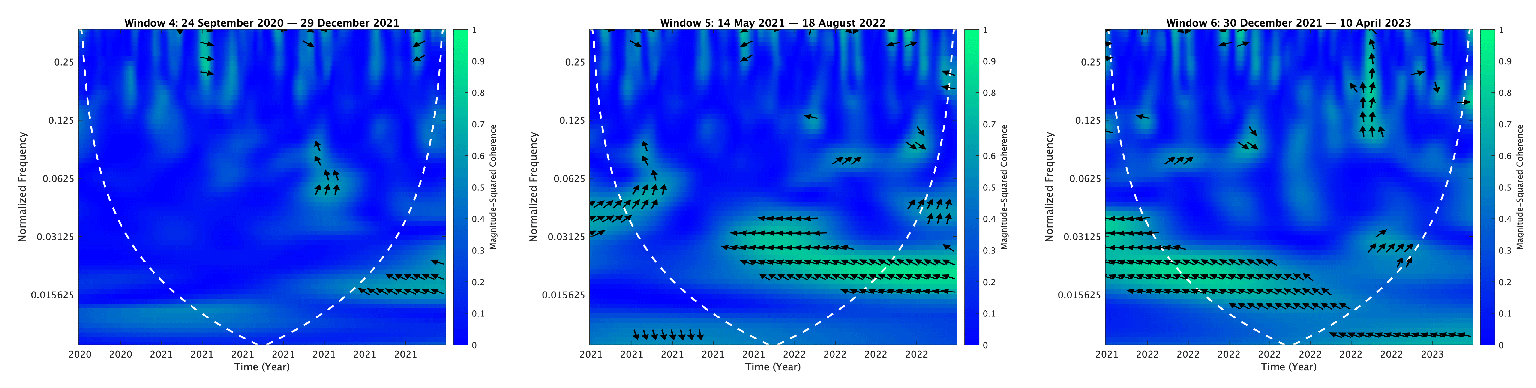
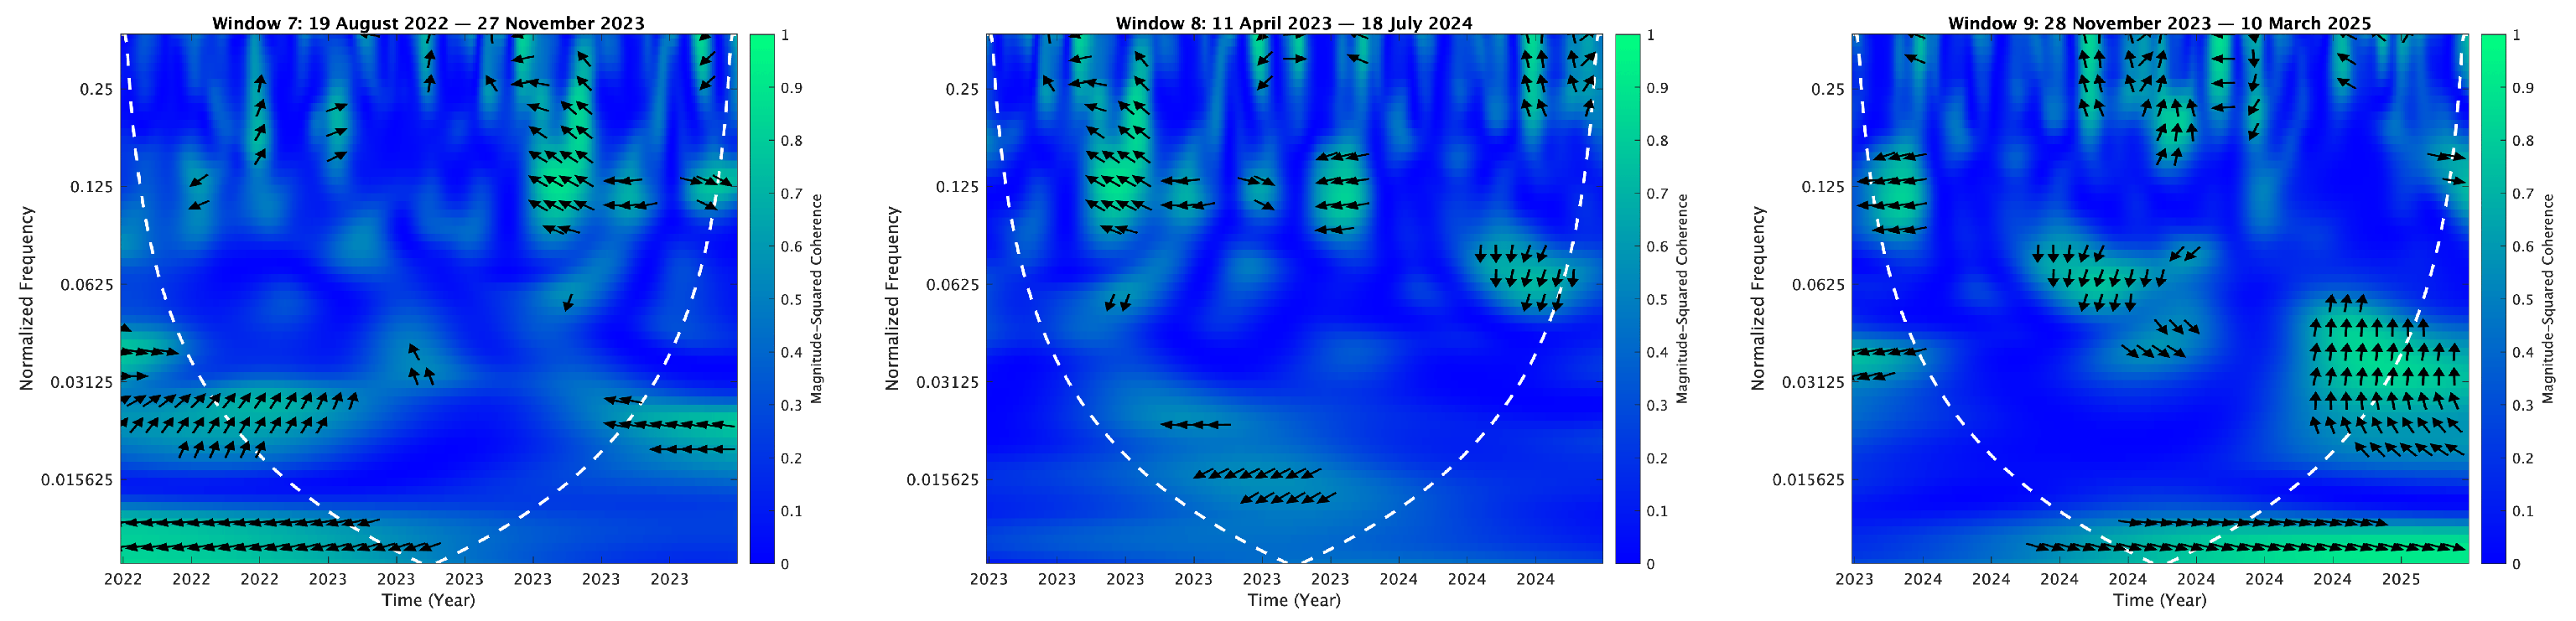
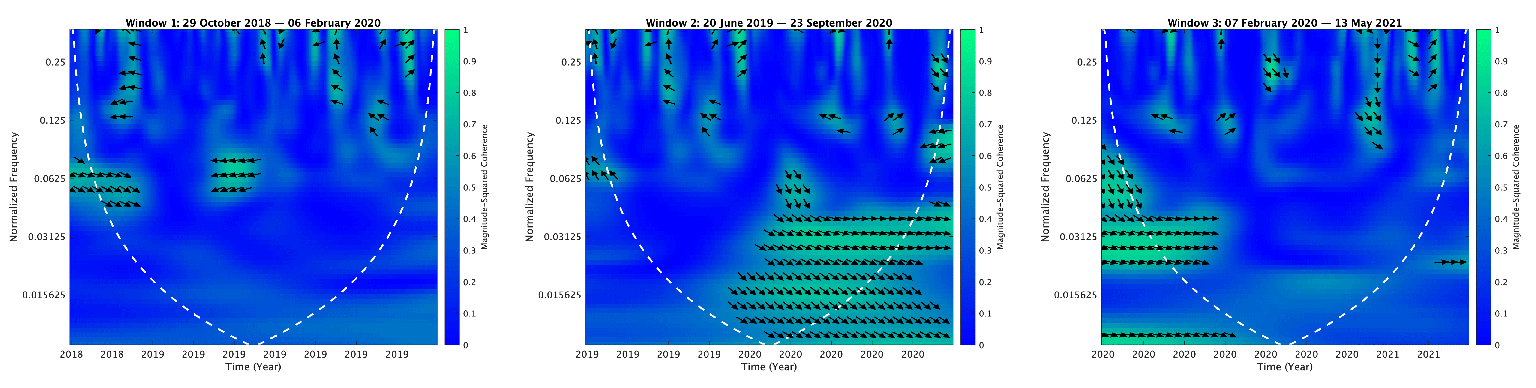
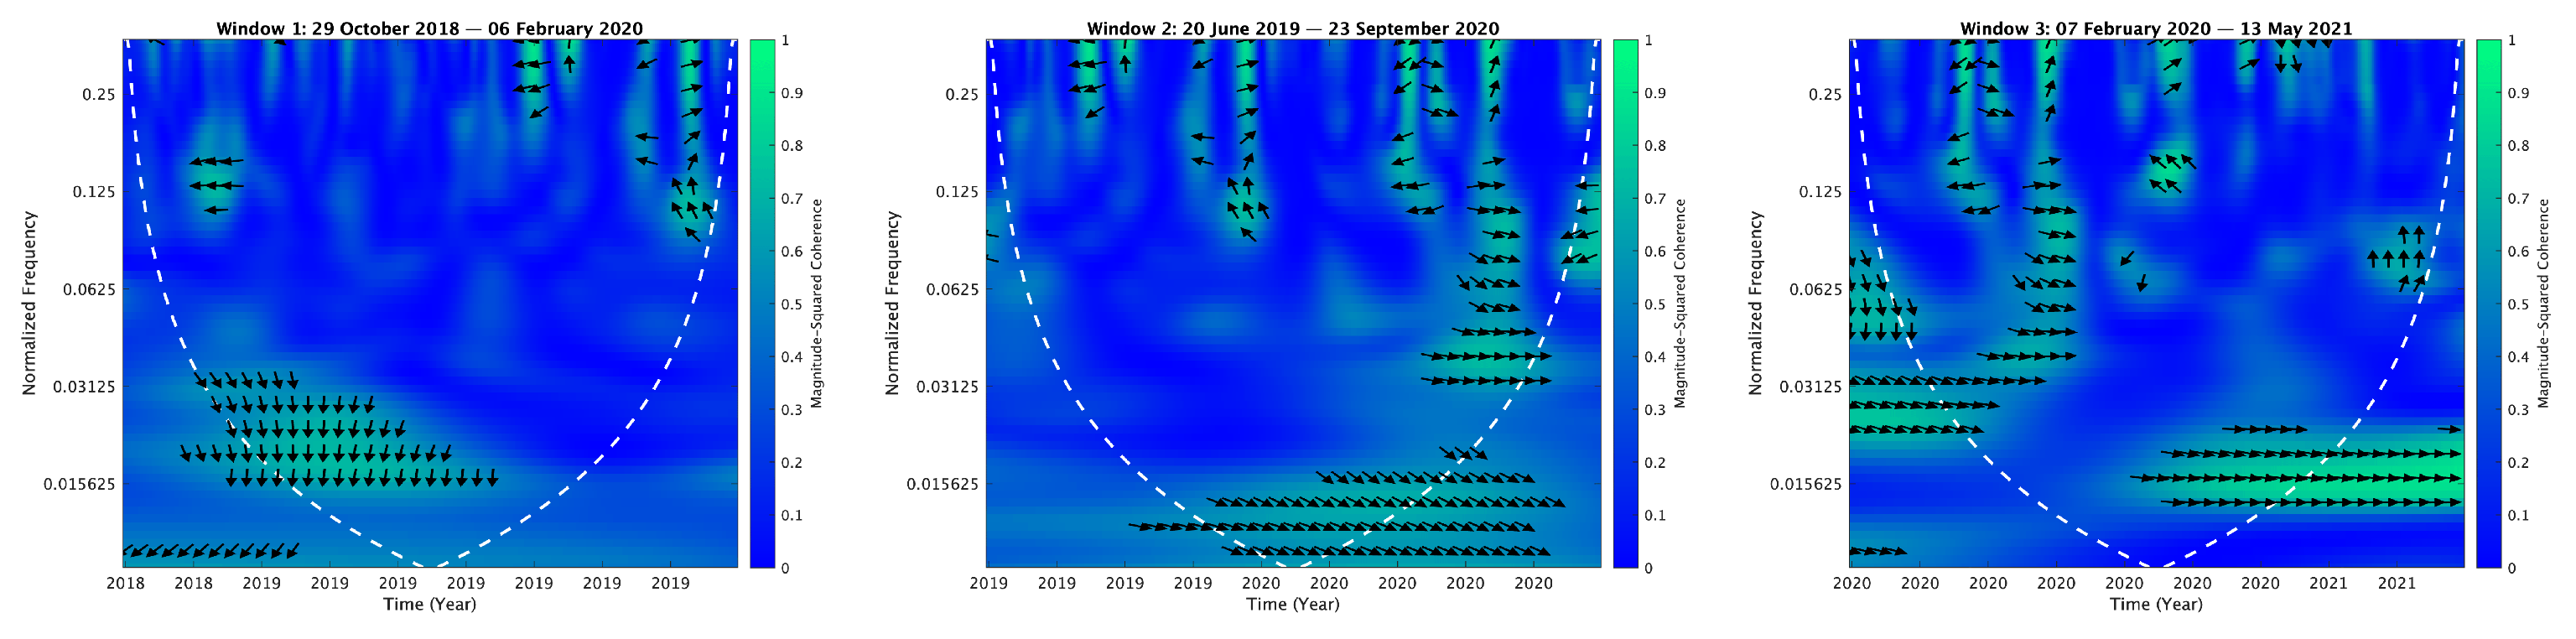
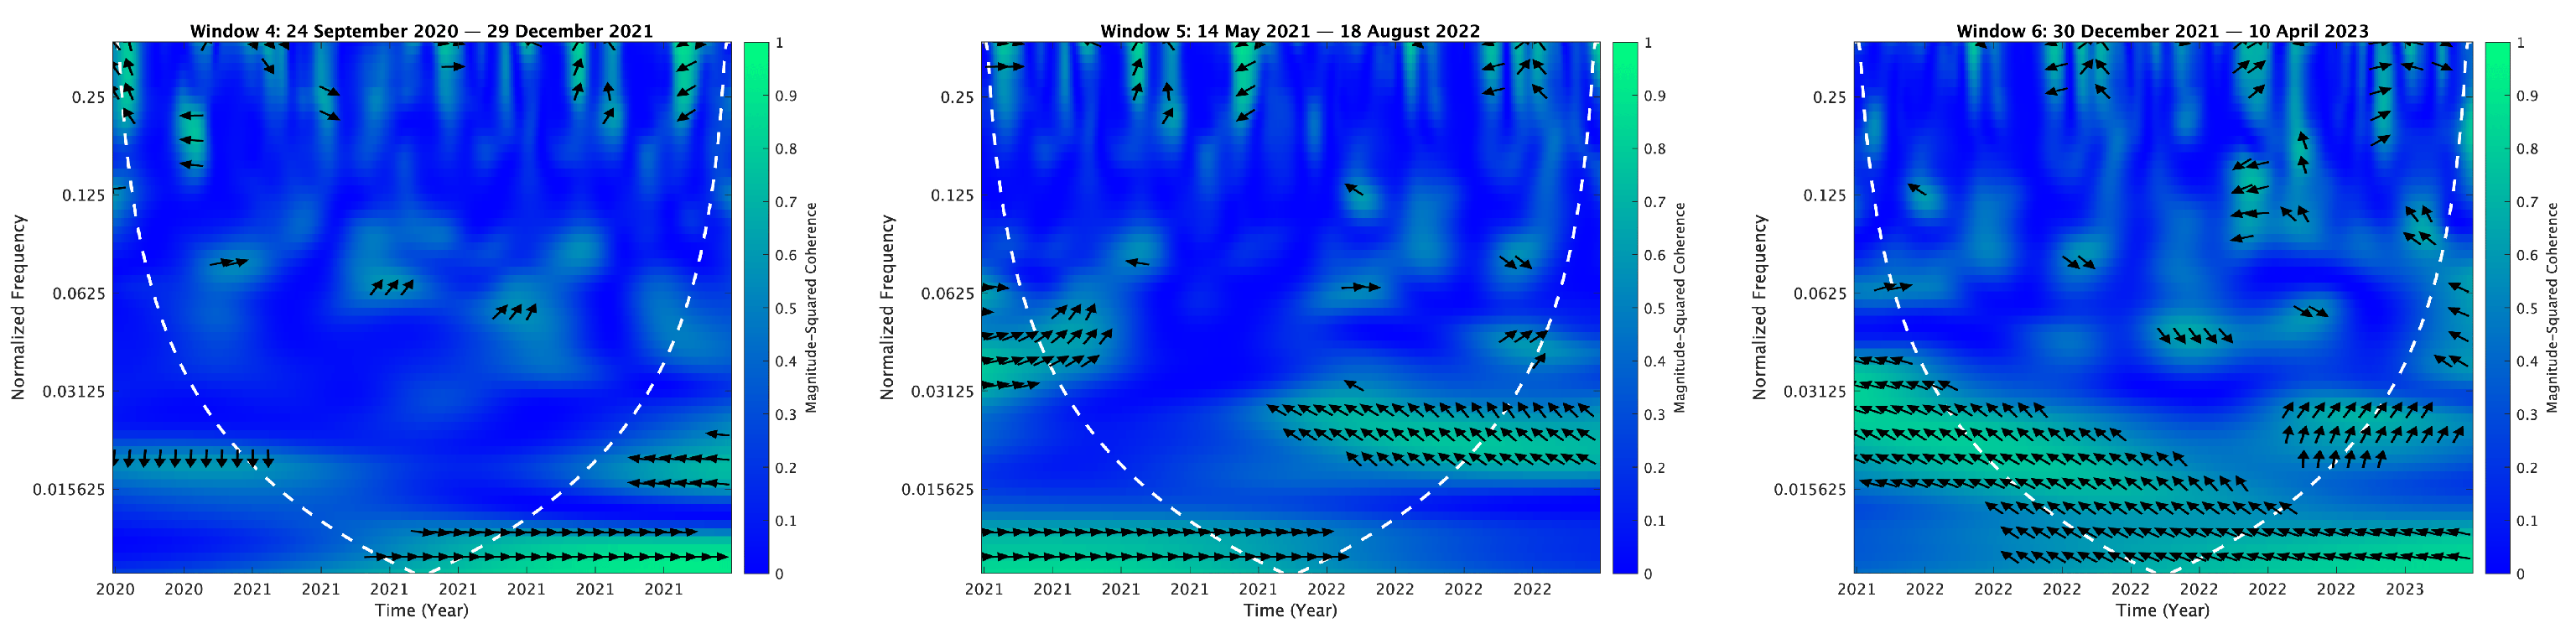
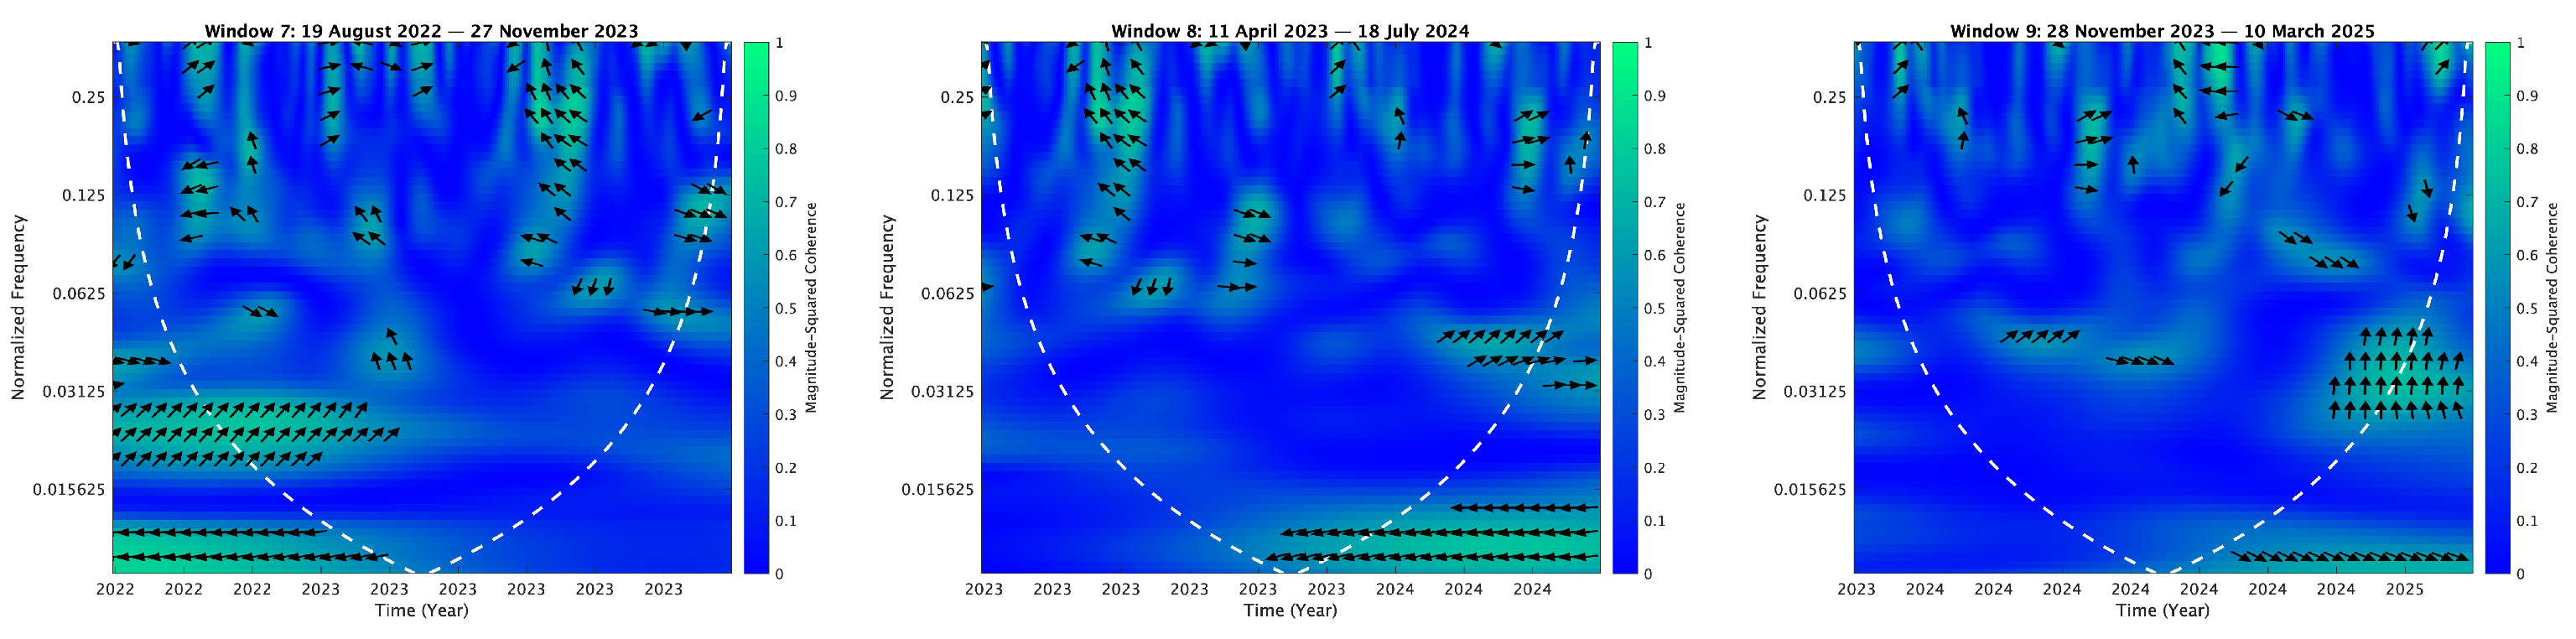
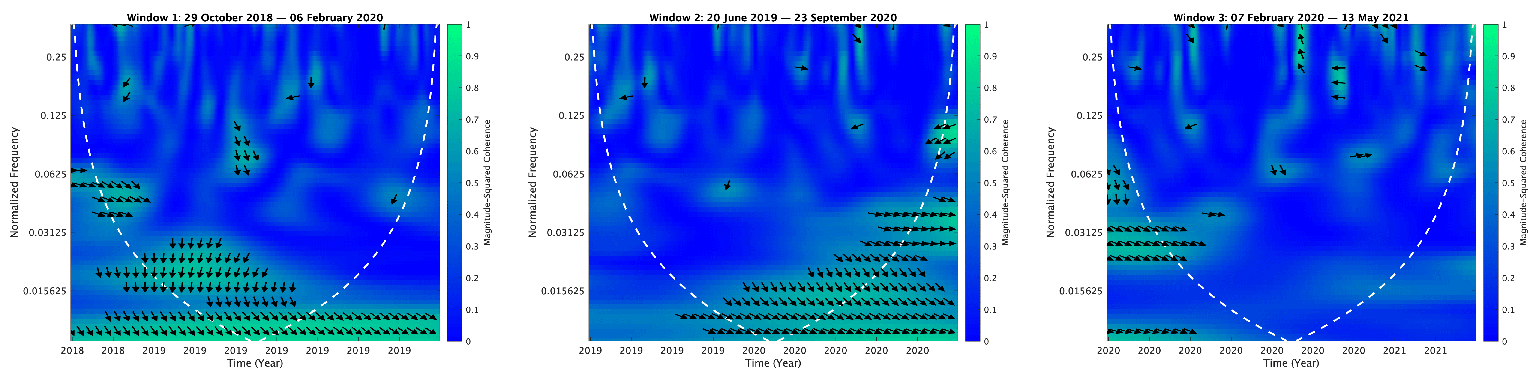
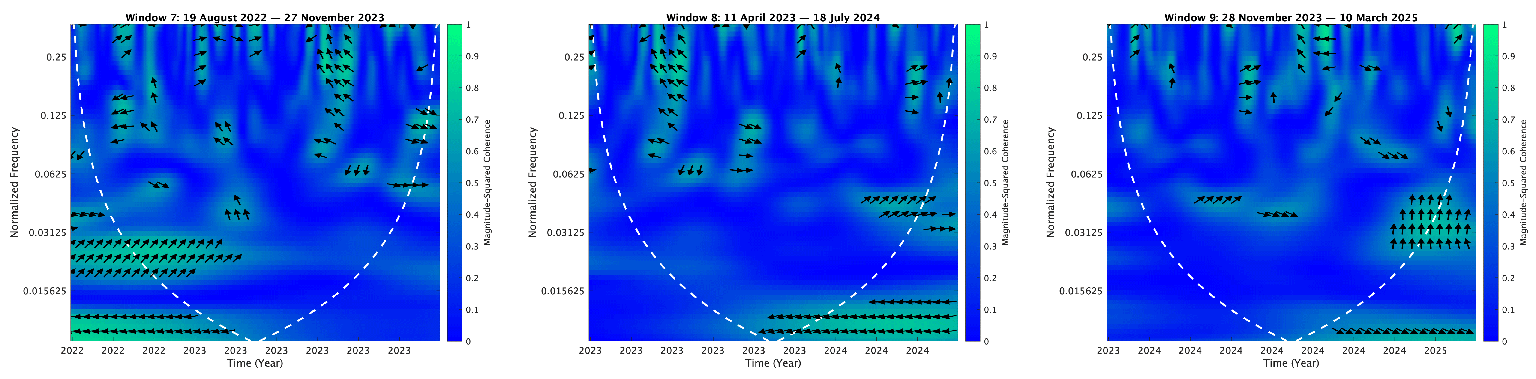
| Note: The appendix presents the interaction between cyberattacks, severity scores, and targeted critical infrastructure across different time windows. Colors represent the strength of the cross-wavelet spectrum, with cooler tones (light blue and cyan) indicating lower coherence and warmer tones (green) indicating higher coherence. | ||||
References
- He, Z.; Khazaei, J.; Moazeni, F.; Freihaut, J.D. Detection of false data injection attacks leading to line congestions using neural networks. Sustain. Cities Soc. 2022, 82, 103861. [Google Scholar] [CrossRef]
- Li, Y.; Ding, Y.; He, S.; Hu, F.; Duan, J.; Wen, G.; Geng, H.; Wu, Z.; Gooi, H.B.; Zhao, Y.; et al. Artificial intelligence-based methods for renewable power system operation. Nat. Rev. Electr. Eng. 2024, 1, 163–179. [Google Scholar] [CrossRef]
- Vinuesa, R.; Azizpour, H.; Leite, I.; Balaam, M.; Dignum, V.; Domisch, S.; Felländer, A.; Langhans, S.D.; Tegmark, M.; Fuso Nerini, F. The role of artificial intelligence in achieving the Sustainable Development Goals. Nat. Commun. 2020, 11, 233. [Google Scholar] [CrossRef] [PubMed]
- Tabansky, L.; Lichterman, E. Progress: The sectoral approach to cyber resilience. Int. J. Inf. Secur. 2025, 24, 18. [Google Scholar] [CrossRef]
- Wang, L.; Wang, S. Unusual investor behavior under tacit and endogenous market signals. Int. Rev. Econ. Financ. 2021, 73, 76–97. [Google Scholar] [CrossRef]
- Eisenbach, T.M.; Kovner, A.; Lee, M.J. Cyber risk and the U.S. financial system: A pre-mortem analysis. J. Financ. Econ. 2022, 145, 802–826. [Google Scholar] [CrossRef]
- Elsayed, A.H.; Naifar, N.; Nasreen, S.; Tiwari, A.K. Dependence structure and dynamic connectedness between green bonds and financial markets: Fresh insights from time-frequency analysis before and during COVID-19 pandemic. Energy Econ. 2022, 107, 105842. [Google Scholar] [CrossRef]
- Ding, Q.; Huang, J.; Chen, J. Time-frequency spillovers and the determinants among fossil energy, clean energy and metal markets. Energy J. 2023, 44, 259–286. [Google Scholar] [CrossRef]
- Akyildirim, E.; Conlon, T.; Corbet, S.; Hou, Y. HACKED: Understanding the stock market response to cyberattacks. J. Int. Financ. Mark. Inst. Money 2024, 97, 102082. [Google Scholar] [CrossRef]
- Tosun, O.K. Cyber-attacks and stock market activity. Int. Rev. Financ. Anal. 2021, 76, 101795. [Google Scholar] [CrossRef]
- Cybersecurity and Infrastructure Security Agency (CISA). The Attack on Colonial Pipeline: What We’ve Learned and What We’ve Done over the Past Two Years. Available online: https://www.cisa.gov (accessed on 16 December 2024).
- International Monetary Fund. Rising Cyber Threats Pose Serious Concerns for Financial Stability. Available online: https://www.imf.org/en/Blogs/Articles/2024/04/09/rising-cyber-threats-pose-serious-concerns-for-financial-stability (accessed on 18 January 2025).
- International Energy Agency. Annual Investment in Clean Energy by Selected Country and Region: 2019 and 2024. Available online: https://www.iea.org/data-and-statistics/charts/annual-investment-in-clean-energy-by-selected-country-and-region-2019-and-2024 (accessed on 11 January 2025).
- Alkathery, M.A.; Chaudhuri, K.; Nasir, M.A. Dependence between the GCC energy equities, global clean energy and emission markets: Evidence from wavelet analysis. Energy Econ. 2023, 121, 106659. [Google Scholar] [CrossRef]
- Chen, T.; Yin, X.; Wang, G. Securing communications between smart grids and real users; providing a methodology based on user authentication. Energy Rep. 2021, 7, 8042–8050. [Google Scholar] [CrossRef]
- Chatziantoniou, I.; Abakah, E.J.A.; Gabauer, D.; Tiwari, A.K. Quantile time–frequency price connectedness between green bond, green equity, sustainable investments and clean energy markets. J. Clean. Prod. 2022, 361, 132088. [Google Scholar] [CrossRef]
- Gunduz, M.Z.; Das, R. Cyber-security on smart grid: Threats and potential solutions. Comput. Netw. 2020, 169, 107094. [Google Scholar] [CrossRef]
- Markowitz, H. Portfolio selection. J. Financ. 1952, 7, 77–91. [Google Scholar] [CrossRef]
- Spence, M. Job market signaling. Q. J. Econ. 1973, 87, 355–374. [Google Scholar] [CrossRef]
- Fama, E.F. Efficient capital markets: A review of theory and empirical work. J. Financ. 1970, 25, 383–417. [Google Scholar] [CrossRef]
- Federal Energy Regulatory Commission (FERC). Solar Winds and Related Supply Chain Compromise [White Paper]. Available online: https://www.ferc.gov (accessed on 15 December 2024).
- OWASP. OWASP Risk Rating Methodology. Available online: https://owasp.org/www-community/OWASP_Risk_Rating_Methodology (accessed on 13 December 2024).
- Arfaoui, N.; Naeem, M.A.; Boubaker, S.; Mirza, N.; Karim, S. Interdependence of clean energy and green markets with cryptocurrencies. Energy Econ. 2023, 120, 106584. [Google Scholar] [CrossRef]
- El-Afifi, M.I.; Sedhom, B.E.; Padmanaban, S.; Eladl, A.A. A review of IoT-enabled smart energy hub systems: Rising, applications, challenges, and future prospects. Renew. Energy Focus 2024, 51, 100634. [Google Scholar] [CrossRef]
- Venkatesan, K.; Rahayu, S.B. Blockchain security enhancement: An approach towards hybrid consensus algorithms and machine learning techniques. Sci. Rep. 2024, 14, 1149. [Google Scholar] [CrossRef]
- Qin, M.; Zhang, X.; Li, Y.; Badarcea, R.M. Blockchain market and green finance: The enablers of carbon neutrality in China. Energy Econ. 2023, 118, 106501. [Google Scholar] [CrossRef]
- Lawal, O.A.; Teh, J.; Alharbi, B.; Lai, C.-M. Data-driven learning-based classification model for mitigating false data injection attacks on dynamic line rating systems. Sustain. Energy Grids Netw. 2024, 38, 101347. [Google Scholar] [CrossRef]
- Mitra, S.; Chakraborty, B.; Mitra, P. Smart meter data analytics applications for secure, reliable and robust grid system: Survey and future directions. Energy 2024, 289, 129920. [Google Scholar] [CrossRef]
- Hu, Q.; Bu, S.Q.; Su, W.; Terzija, V. A privacy-preserving energy management system based on homomorphic cryptosystem for IoT-enabled active distribution network. J. Mod. Power Syst. Clean Energy 2024, 12, 167–178. [Google Scholar] [CrossRef]
- Mishra, D.K.; Wang, J.; Li, L.; Zhang, J.; Hossain, M.J. Resilience-driven scheme in multiple microgrids with secure transactive energy system framework. IEEE Trans. Ind. Appl. 2024, 60, 2277–2289. [Google Scholar] [CrossRef]
- Lucey, B.; Ren, B. Time-varying tail risk connectedness among sustainability-related products and fossil energy investments. Energy Econ. 2023, 126, 106812. [Google Scholar] [CrossRef]
- Tiwari, A.K.; Kumar, S.; Abakah, E.J.A. Correlation and price spillover effects among green assets. Ann. Oper. Res. 2024, 1–26. [Google Scholar] [CrossRef]
- Boakye, D.; Sarpong, D.; Meissner, D.; Ofosu, G. How TalkTalk did the walk-walk: Strategic reputational repair in a cyber-attack. Inf. Technol. People 2024, 37, 1642–1673. [Google Scholar] [CrossRef]
- Husain, S.; Sohag, K.; Wu, Y.R. The responsiveness of renewable energy production to geopolitical risks, oil market instability and economic policy uncertainty: Evidence from United States. J. Environ. Manag. 2024, 350, 119647. [Google Scholar] [CrossRef]
- Demiralay, S.; Gencer, H.G.; Bayraci, S. Carbon credit futures as an emerging asset: Hedging, diversification and downside risks. Energy Econ. 2022, 113, 106196. [Google Scholar] [CrossRef]
- Yousaf, I.; Mensi, W.; Vo, X.V.; Kang, S.H. Dynamic spillovers and connectedness between crude oil and green bond markets. Resour. Policy 2024, 89, 104594. [Google Scholar] [CrossRef]
- Investing.com. Official Website. Available online: https://www.investing.com/ (accessed on 11 January 2025).
- Yahoo Finance. Official Website. Available online: https://finance.yahoo.com (accessed on 11 January 2025).
- Bloomberg Terminal. Official Website. Available online: https://www.bloomberg.com (accessed on 12 January 2025).
- Privacy Rights Clearinghouse. Official Website. Available online: https://privacyrights.org (accessed on 14 January 2025).
- Hackmageddon. Official Website. Available online: https://www.hackmageddon.com (accessed on 15 January 2025).
- Eurepoc. Official Website. Available online: https://eurepoc.eu (accessed on 15 January 2025).
- Center for Strategic and International Studies (CSIS). Official Website. Available online: https://www.csis.org (accessed on 16 January 2025).
- Koop, G.; Korobilis, D. A new index of financial conditions. Eur. Econ. Rev. 2014, 71, 101–116. [Google Scholar] [CrossRef]
- Gabauer, D.; Gupta, R. On the transmission mechanism of country-specific and international economic uncertainty spillovers: Evidence from a TVP-VAR connectedness decomposition approach. Econ. Lett. 2018, 171, 63–71. [Google Scholar] [CrossRef]
- Erenoğlu, A.K.; Sengor, I.; Erdinç, O. Power system resiliency: A comprehensive overview from implementation aspects and innovative concepts. Energy Nexus 2024, 15, 100311. [Google Scholar] [CrossRef]
- Song, Y.; Bouri, E.; Ghosh, S.; Kanjilal, K. Rare earth and financial markets: Dynamics of return and volatility connectedness around the COVID-19 outbreak. Resour. Policy 2021, 74, 102379. [Google Scholar] [CrossRef]
- Alomari, M.; Khoury, R.E.; Mensi, W.; Vo, X.V.; Kang, S.H. Extreme downside risk connectedness between green energy and stock markets. Energy 2024, 312, 133477. [Google Scholar] [CrossRef]
- Urom, C.; Ndubuisi, G.; Mzoughi, H.; Guesmi, K. Exploring the coherency and predictability between the stocks of artificial intelligence and energy corporations. Financ. Innov. 2024, 10, 128. [Google Scholar] [CrossRef]
- Antonakakis, N.; Chatziantoniou, I.; Gabauer, D. Refined measures of dynamic connectedness based on time-varying parameter vector autoregressions. J. Risk Financ. Manag. 2020, 13, 84. [Google Scholar] [CrossRef]
- Doğan, B.; Ben Jabeur, S.; Tiwari, A.K.; Abakah, E.J.A. Asymmetry in returns and volatility between green financial assets, sustainable investments, clean energy, and international stock markets. Res. Int. Bus. Financ. 2025, 73, 101212. [Google Scholar] [CrossRef]
- Vargas, P.; Tien, I. Impacts of 5G on cyber-physical risks for interdependent connected smart critical infrastructure systems. Int. J. Crit. Infrastruct. Prot. 2023, 42, 100617. [Google Scholar] [CrossRef]
- Pettersen, S.; Grøtan, T.O. Exploring the grounds for cyber resilience in the hyper-connected oil and gas industry. Saf. Sci. 2024, 171, 106384. [Google Scholar] [CrossRef]
- Sallos, M.-P.; Garcia Perez, A.; Bocanet, A. Organisational cyber resilience: A heuristic for bridging foundations and applications. J. Enterp. Inf. Manag. 2024, 37, 1926–1952. [Google Scholar] [CrossRef]
- Ziadat, S.A.; Mensi, W.; Al-Kharusi, S.H.; Vo, X.V.; Kang, S.H. Are clean energy markets hedges for stock markets? A tail quantile connectedness regression. Energy Econ. 2024, 136, 106286. [Google Scholar] [CrossRef]
- Gabriel, V.; Pinho, C. Are clean and black energy exchange-traded funds driven by climate risk? J. Sustain. Financ. Invest. 2024, 1–27. [Google Scholar] [CrossRef]
- Bloomberg NEF. Global Clean Energy Investment Jumps 17%, Hits $1.8 Trillion in 2023. Available online: https://about.bnef.com/blog/global-clean-energy-investment-jumps-17-hits-1-8-trillion-in-2023-according-to-bloombergnef-report (accessed on 11 January 2025).
- Yao, C.Z.; Mo, Y.N.; Zhang, Z.K. A study of the efficiency of the Chinese clean energy stock market and its correlation with the crude oil market based on an asymmetric multifractal scaling behavior analysis. N. Am. J. Econ. Financ. 2021, 58, 101520. [Google Scholar] [CrossRef]
- Arcuri, M.C.; Gai, L.; Ielasi, F.; Ventisette, E. Cyber attacks on hospitality sector: Stock market reaction. J. Hosp. Tour. Technol. 2020, 11, 277–290. [Google Scholar] [CrossRef]
- Xiao, X.Y.; Li, A.X.; Kchouri, B.; Shan, S. Tracing the dynamic impact of energy transitions on equity market volatility in an era of financial turbulence. Energy Econ. 2024, 133, 106652. [Google Scholar] [CrossRef]
- Lee, I. Cybersecurity: Risk management framework and investment cost analysis. Bus. Horiz. 2021, 64, 659–671. [Google Scholar] [CrossRef]
- Halgamuge, M.N. Leveraging deep learning to strengthen the cyber-resilience of renewable energy supply chains: A survey. IEEE Commun. Surv. Tutor. 2024, 26, 2146–2175. [Google Scholar] [CrossRef]
- Wu, R.R.; Liu, B.Y. Do climate policy uncertainty and investor sentiment drive the dynamic spillovers among green finance markets? J. Environ. Manag. 2023, 347, 119008. [Google Scholar] [CrossRef]
- Sharma, G.D.; Shahbaz, M.; Singh, S.; Chopra, R.; Cifuentes-Faura, J. Investigating the nexus between green economy, sustainability, bitcoin and oil prices: Contextual evidence from the United States. Resour. Policy 2023, 80, 103168. [Google Scholar] [CrossRef]
- Yadav, M.P.; Ashok, S.; Taghizadeh-Hesary, F.; Dhingra, D.; Mishra, N.; Malhotra, N. Uncovering time and frequency co-movement among green bonds, energy commodities and stock market. Stud. Econ. Financ. 2024, 41, 638–659. [Google Scholar] [CrossRef]
- Thi Xuan, H.; Thai Hung, N. Does green investment mitigate environmental degradation in Vietnam: The time-frequency effect of nonrenewable energy investment and globalization? Manag. Environ. Qual. 2024, 35, 1005–1027. [Google Scholar] [CrossRef]
- Zhang, L.; Wang, L.; Nguyen, T.T.; Ren, R. Volatility forecasting of clean energy ETF using GARCH-MIDAS with neural network model. Financ. Res. Lett. 2024, 70, 106286. [Google Scholar] [CrossRef]
- Abakah, E.J.A.; Wali Ullah, G.; Adekoya, O.B.; Osei Bonsu, C.; Abdullah, M. Blockchain market and eco-friendly financial assets: Dynamic price correlation, connectedness and spillovers with portfolio implications. Int. Rev. Econ. Financ. 2023, 87, 218–243. [Google Scholar] [CrossRef]
- Osman, R.; El-Gendy, S. Interconnected and resilient: A CGE analysis of AI-driven cyberattacks in global trade. Risk Anal. 2024, 1–17. [Google Scholar] [CrossRef]
- Farrand, B. The economy–security nexus: Risk, strategic autonomy and the regulation of the semiconductor supply chain. Eur. J. Risk Regul. 2024, 1–15. [Google Scholar] [CrossRef]

| Category | Variable | Summary | Variable Type | Unit |
|---|---|---|---|---|
| Dependent | ICLN (iShares Global Clean Energy ETF) | Represents the performance of CE companies | Continuous | Closing price (USD/unit) |
| Dependent | TAN (Invesco Solar ETF) | Represents the achievements of companies in the solar sector | Continuous | Closing price (USD/unit) |
| Dependent | QCLN (First Trust NASDAQ Clean Edge Green Energy ETF) | Tracks companies in the CE sector, including solar and wind | Continuous | Closing price (USD/unit) |
| Dependent | CNRG (SPDR Kensho Clean Power ETF) | Focuses on innovative CE companies | Continuous | Closing price (USD/unit) |
| Dependent | ACES (ALPS Clean Energy ETF) | Contains low-carbon and renewable energy companies | Continuous | Closing price (USD/unit) |
| Dependent | PBW (Invesco Wilder Hill Clean Energy ETF) | Diversified index for CE, including green technologies | Continuous | Closing price (USD/unit) |
| Dependent | RNRG (Global X Renewable Energy Producers ETF) | Index for global renewable energy producers | Continuous | Closing price (USD/unit) |
| Dependent | ACWI (iShares MSCI ACWI ETF) | Diversified global index with exposure to developed and emerging markets | Continuous | Closing price (USD/unit) |
| Dependent | IEUR (iShares Core MSCI Europe ETF) | Index for developed markets in Europe | Continuous | Closing price (USD/unit) |
| Dependent | EEMA (iShares MSCI Emerging Markets Asia ETF) | Index for emerging markets in Asia | Continuous | Closing price (USD/unit) |
| Dependent | EWZ (iShares MSCI Brazil ETF) | Index focused on the Brazilian equity market | Continuous | Closing price (USD/unit) |
| Dependent | EZA (iShares MSCI South Africa ETF) | Index focused on the South African equity market | Continuous | Closing price (USD/unit) |
| Dependent | AFK (VanEck Africa Index ETF) | Diversified index for African markets | Continuous | Closing price (USD/unit) |
| Independent | Number of cyberattacks | The total frequency of cyberattacks recorded on the days of their occurrence | Continuous | Number |
| Independent | Severity of cyberattacks | Impact scores or descriptions that assess the severity of cyberattacks | Continuous | Number |
| Independent | Cyberattack Intensity | The ratio between the number of attacks on a given day and the maximum observed in the dataset. | Continuous | Number (value between 0 and 1) |
| Index | Mean | Median | Max. | Min. | Std. Dev. | Skew. | Kurt. | Prob. | IQR |
|---|---|---|---|---|---|---|---|---|---|
| ICLN | 0.022 | 0.000 | 10.80 | −13.71 | 1.918 | −0.406 | 9.130 | 0.000 | 2.00 |
| TAN | 0.037 | −0.006 | 12.66 | −17.54 | 2.670 | −0.204 | 6.493 | 0.000 | 3.03 |
| QCLN | 0.031 | 0.105 | 13.64 | −13.91 | 2.461 | −0.168 | 5.602 | 0.000 | 2.84 |
| CNRG | 0.039 | 0.029 | 11.63 | −14.14 | 2.228 | −0.215 | 6.530 | 0.000 | 2.51 |
| ACES | −0.002 | 0.037 | 11.82 | −14.38 | 2.309 | −0.224 | 6.287 | 0.000 | 2.55 |
| PBW | −0.017 | 0.000 | 13.50 | −15.64 | 2.742 | −0.161 | 5.215 | 0.000 | 3.26 |
| RNRG | −0.017 | 0.000 | 8.784 | −10.38 | 1.383 | −0.597 | 10.46 | 0.000 | 1.40 |
| ACWI | 0.035 | 0.075 | 7.821 | −11.90 | 1.196 | −1.049 | 17.41 | 0.000 | 1.55 |
| IEUR | 0.022 | 0.088 | 8.714 | −12.39 | 1.289 | −1.251 | 17.81 | 0.000 | 1.26 |
| EEMA | 0.015 | 0.032 | 8.401 | −12.35 | 1.387 | −0.601 | 11.58 | 0.000 | 1.56 |
| EWZ | −0.027 | 0.070 | 16.23 | −26.26 | 2.340 | −1.436 | 20.56 | 0.000 | 2.34 |
| EZA | 0.003 | 0.040 | 9.613 | −16.04 | 2.010 | −0.740 | 10.45 | 0.000 | 2.21 |
| AFK | −0.010 | 0.050 | 8.460 | −12.33 | 1.437 | −1.119 | 13.37 | 0.000 | 1.51 |
| Index | ADF t-Stat. Level | Prob. * | t-Stat. 1st Diff | Prob. * | PP Adj. T-Stat Level | Prob. * | Adj. T-Stat 1st Diff | Prob. * | KPSS LM-Stat. Level | Prob. * | LM-Stat. 1st Diff | Prob. * |
|---|---|---|---|---|---|---|---|---|---|---|---|---|
| ICLN | −25.90 | 0.000 | −19.76 | 0.000 | −40.26 | 0.000 | −490.2 | 0.000 | 0.294 | 0.640 | 0.003 | 0.979 |
| TAN | −40.38 | 0.000 | −20.74 | 0.000 | −40.38 | 0.000 | −369.2 | 0.000 | 0.637 | 0.578 | 0.002 | 0.990 |
| QCLN | −40.43 | 0.000 | −20.31 | 0.000 | −40.43 | 0.000 | −433.5 | 0.000 | 0.471 | 0.614 | 0.001 | 0.990 |
| CNRG | −26.83 | 0.000 | −20.11 | 0.000 | −41.38 | 0.000 | −416.0 | 0.000 | 0.479 | 0.483 | 0.001 | 0.987 |
| ACES | −40.20 | 0.000 | −19.93 | 0.000 | −40.22 | 0.000 | −457.0 | 0.000 | 0.523 | 0.973 | 0.003 | 0.984 |
| PBW | −39.99 | 0.000 | −20.17 | 0.000 | −39.99 | 0.000 | −394.1 | 0.000 | 0.606 | 0.807 | 0.002 | 0.985 |
| RNRG | −26.37 | 0.000 | −18.88 | 0.000 | −41.02 | 0.000 | −631.4 | 0.000 | 0.293 | 0.619 | 0.014 | 0.997 |
| ACWI | −12.32 | 0.000 | −20.75 | 0.000 | −45.54 | 0.000 | −549.8 | 0.000 | 0.043 | 0.248 | 0.017 | 0.971 |
| IEUR | −14.50 | 0.000 | −18.85 | 0.000 | −43.35 | 0.000 | −628.7 | 0.000 | 0.036 | 0.494 | 0.015 | 0.979 |
| EEMA | −46.27 | 0.000 | −21.64 | 0.000 | −46.07 | 0.000 | −644.2 | 0.000 | 0.092 | 0.668 | 0.005 | 0.971 |
| EWZ | −27.95 | 0.000 | −21.45 | 0.000 | −46.82 | 0.000 | −739.8 | 0.000 | 0.023 | 0.640 | 0.006 | 0.957 |
| EZA | −43.36 | 0.000 | −22.00 | 0.000 | −43.30 | 0.000 | −930.9 | 0.000 | 0.031 | 0.947 | 0.001 | 0.971 |
| AFK | −16.31 | 0.000 | −22.34 | 0.000 | −43.71 | 0.000 | −1259.9 | 1.000 | 0.057 | 0.779 | 0.015 | 0.964 |
Disclaimer/Publisher’s Note: The statements, opinions and data contained in all publications are solely those of the individual author(s) and contributor(s) and not of MDPI and/or the editor(s). MDPI and/or the editor(s) disclaim responsibility for any injury to people or property resulting from any ideas, methods, instructions or products referred to in the content. |
© 2025 by the authors. Licensee MDPI, Basel, Switzerland. This article is an open access article distributed under the terms and conditions of the Creative Commons Attribution (CC BY) license (https://creativecommons.org/licenses/by/4.0/).
Share and Cite
Gheorghe, C.; Panazan, O. Quantifying Cybersecurity Impacts on Clean Energy Market Volatility: A Time-Frequency Approach. Mathematics 2025, 13, 1320. https://doi.org/10.3390/math13081320
Gheorghe C, Panazan O. Quantifying Cybersecurity Impacts on Clean Energy Market Volatility: A Time-Frequency Approach. Mathematics. 2025; 13(8):1320. https://doi.org/10.3390/math13081320
Chicago/Turabian StyleGheorghe, Catalin, and Oana Panazan. 2025. "Quantifying Cybersecurity Impacts on Clean Energy Market Volatility: A Time-Frequency Approach" Mathematics 13, no. 8: 1320. https://doi.org/10.3390/math13081320
APA StyleGheorghe, C., & Panazan, O. (2025). Quantifying Cybersecurity Impacts on Clean Energy Market Volatility: A Time-Frequency Approach. Mathematics, 13(8), 1320. https://doi.org/10.3390/math13081320