Article

A New Measure for an Acceptable Level of Homogeneity in Meta-Informatics

by
Ramalingam Shanmugam
1 and
Karan P. Singh
2,*
1
School of Health Administration, Texas State University, San Marcos, TX 78666, USA
2
Department of Epidemiology and Biostatistics, School of Medicine, Health Science Center, The University of Texas at Tyler Health Science Center, 11937 US Highway 271, Tyler, TX 75708, USA
*
Author to whom correspondence should be addressed.
Mathematics 2025, 13(9), 1364; https://doi.org/10.3390/math13091364
Submission received: 10 February 2025 / Revised: 10 April 2025 / Accepted: 12 April 2025 / Published: 22 April 2025
(This article belongs to the Special Issue Statistical Methods in Bioinformatics and Health Informatics)

Abstract

:
This paper addresses the challenges in assessing heterogeneity in meta-analytic studies. The specifics include mental health research work. Three key statistical scores in meta-analytics—Higgins’ I2, Birge’s H2, and the newly developed S2 score—are discussed and illustrated. The paper critiques the subjectivity of these scores and introduces elasticity to enhance the accuracy and objectivity in assessing heterogeneity. The integration of elasticity into the meta-informatic score measures how heterogeneity changes as new studies are added, improving the interpretation of meta-analytic results. Also, the authors compute and compare elasticity scores in the context of mental health research, offering a novel approach to visualizing and quantifying heterogeneity. The authors demonstrate how elasticity improves the assessment of heterogeneity. The paper recommends the use of the meta-informatic S2 score, integrated with elasticity, for more reliable and objective conclusions in mental health as well as in other meta-analyses. The new rectified score, S2, overcomes issues with the I2 score when the chi-squared distribution fails due to small sample sizes or negative values.

1. Introduction

A history of the introduction and practice of meta-analysis may be helpful. The term “meta-analysis” was coined in 1976 by a statistician [1] as an integrated measure of the effect size and variance. Numerous meta-analyses, including ones on medical, public health, and mental health, have been reported in the literature. A meta-informatics or meta-analysis cannot be considered without a systematic review. A systematic review is a process intended to examine the compatibility of findings in various studies on a topic of interest, such as the issue of mental health. Meta-analysis is an analytical tool used in systematic reviews [2,3,4,5,6]. Guidance on choosing qualitative evidence synthesis methods for use in health technology assessments of complex interventions is included in the systematic review. The meta-analysis integrates the findings of multiple quantitative studies. These findings are integrated to provide evidence from multiple studies. The two types of data generally used for meta-analysis in health research are individual participant data and aggregate data, such as odds ratios or relative risks [7] for the articulation of meta-analytic concepts. For additional information on systematic reviews and their shortcomings, the reader is referred to [8,9,10,11,12,13,14,15,16,17].
Note that the meta-analysis is performed using the following steps: (1) the research question is formulated; (2) a research protocol is devised for the literature review; (3) studies with a strategy pertinent to the research question are identified and collected; (4) the appropriate study results are imported; (5) whether a fixed-, mixed-, or random-effects analysis model is involved is determined for each study; (6) an assessment is made of the findings from those studies; and (7) the level of heterogeneity is assessed and a forest plot among the studies is constructed. The criticisms of meta-analyses include the following: (i) when the studies are heterogeneous, a single summary from the studies is too risky to confirm or deny each other; (ii) only significant studies have been published while other insignificant studies are not published; and (iii) comparing the findings in heterogeneous studies is like comparing “oranges and apples”. However, meta-analysis is too important to set aside.
The strength and consistency of the relationship between scientific collaboration and citation counts at the paper level using meta-analysis has been comprehensively examined [18]. Studies may differ because of different target populations, data collection designs, or exclusion criteria. However, there are challenges in conducting a meta-analysis. First, the literature search and evidence abstraction are often insufficient. Second, determining how similar (or dissimilar) the studies require a correct interpretation of heterogeneity using the Cochran Q , Higgins I 2   s c o r e ,   t h e   B i r g e   r a t i o     H 2   score, or the S 2 score [19,20]. Third, studies should be qualitative [21].
In the first part of this paper, the authors discuss three main scores—the Higgins I 2 score, the Birge ratio H 2   score, and the S 2 score—and conclude that there exists an acceptable measure for meta-analysis homogeneity. The scores examine homogeneity and their relative performance using the meta-analytic literature on mental health problems. In the second part, the incorporated meta-analytic elasticity scores are computed and used to evaluate and compare several groups of patients with mental health problems. In the Discussion section, potential health policy implications, clinical relevance, and future research directions are discussed.

Motivation

There is subjectivity in the judgement of heterogeneity in published literature with regard to the use of the Higgins score ( I 2 ) or the Birge ratio score ( H 2 ). One reason for this subjectivity is that these scores neglect the domain of the observable space in the chi-squared distribution. The recently developed S 2 score correctly rectifies this situation and corrects the bias using chi-square distributional properties. In this article, peer-reviewed meta-analytic articles on mental health in the literature are reviewed and examined for homogeneity using three main scores—the Higgins score ( I 2 ) , the Birge ratio score ( H 2 ) , and the S 2 score ( S 2 ) —and three incorporated elasticity scores— e θ , I θ 2 , e θ , H θ 2 , and e θ , S θ 2 . Elasticity is incorporated into each score to improve the relative performance of the scores and refers to how heterogeneity decreases due to an additional study of the topic of interest and its implications in the case of each score. More details are given as follows:
The incorporated elasticity scores, e θ , I θ 2 , e θ , H θ 2 , and e θ , S θ 2 , are derived, computed, and used to evaluate and compare several groups of patients with mental health. The dynamic nature of the Higgins score I θ 2 , the Birge ratio score H θ 2 , and the recently published S θ 2   s c o r e and their interrelationships are illustrated visually, where θ   i s the number of studies. In addition, the incorporated elasticity scores, e θ , I θ 2 , e θ , H θ 2 , and e θ , S θ 2 are illustrated visually. The proximity between the three elasticity scores and a path diagram grouping the elasticity scores into two groups are displayed. Correlations between the three elasticity scores are computed and two rotated principal components with coefficients are computed. The article concludes with a recommendation to perform meta-analytic studies on mental health issues using the S 2 score and the incorporated S 2 elasticity scores to objectively and correctly judge the existence of significant heterogeneity in the studies.
The paper introduces new concepts called the S2 score and elasticity. A brief mathematical derivation with the properties of elasticity is included. Also, the paper provides theoretical comparisons and calculations to help the meta-analytic professionals in their analysis of case studies. Finally, the paper proposes an improvement to existing meta-analytic methods. Our solid theoretical comparison is substantiated by revisiting several data-based meta-analytic results in the mental health literature. In many of these cases, the conclusion of homogeneity was reversed to heterogeneity. We have demonstrated in the revising of the published meta-analytic results that the S2 score outperforms the previous meta-analytic scores, I2 and H2. This has significantly enhanced the credibility of the S 2 score-based method. In addition, the introduction of elasticity-based heterogeneity measures is a novel contribution in this article.

2. Methods

Considering the number of studies θ , meta-analytic researchers have the option of using one of the three main scores, namely the Higgins I θ 2 score, the Birge H θ 2 score [22], and   t h e   r e c t i f i e d   S θ 2 score [19,20] to judge homogeneity among the published results in journals before strategizing to integrate their findings. However, it is difficult to clarify whether the three scores would confirm or contradict each other’s judgments. In the case of contradictions, meta-analytic researchers may want to rank them based on the selected principle of comparison. This issue has been addressed in this section. To assess the level of heterogeneity in meta-analytics, researchers computed the chi-squared score, Q , as suggested by Cochran [23], with d f = θ 1 , where Q is Cochran’s goodness-of-fit measure. The number of studies, θ ,   n e e d s   t o   b e   a t   l e a s t   2 in any meta-analytic topic. The value of θ may never be a conclusive end to any topic and may increase as new interests emerge. It is identified a technical issue using the Higgins method and addressed it using specific solutions [23]. The issue was the following: The Higgins I 2 score, a version of the Cochran Q value, is commonly used to assess heterogeneity. The Higgins score is an improvement on the Q value. The scores are supposed to follow a chi-squared distribution. However, the chi-squared distribution is invalid when the Q score is less than the degrees of freedom. This problem was recently rectified using an alternative method (the S 2  score). The illustration section in their article provides all the essential details about the studies involved in the analysis, such as the study population, sample sizes, and date ranges.

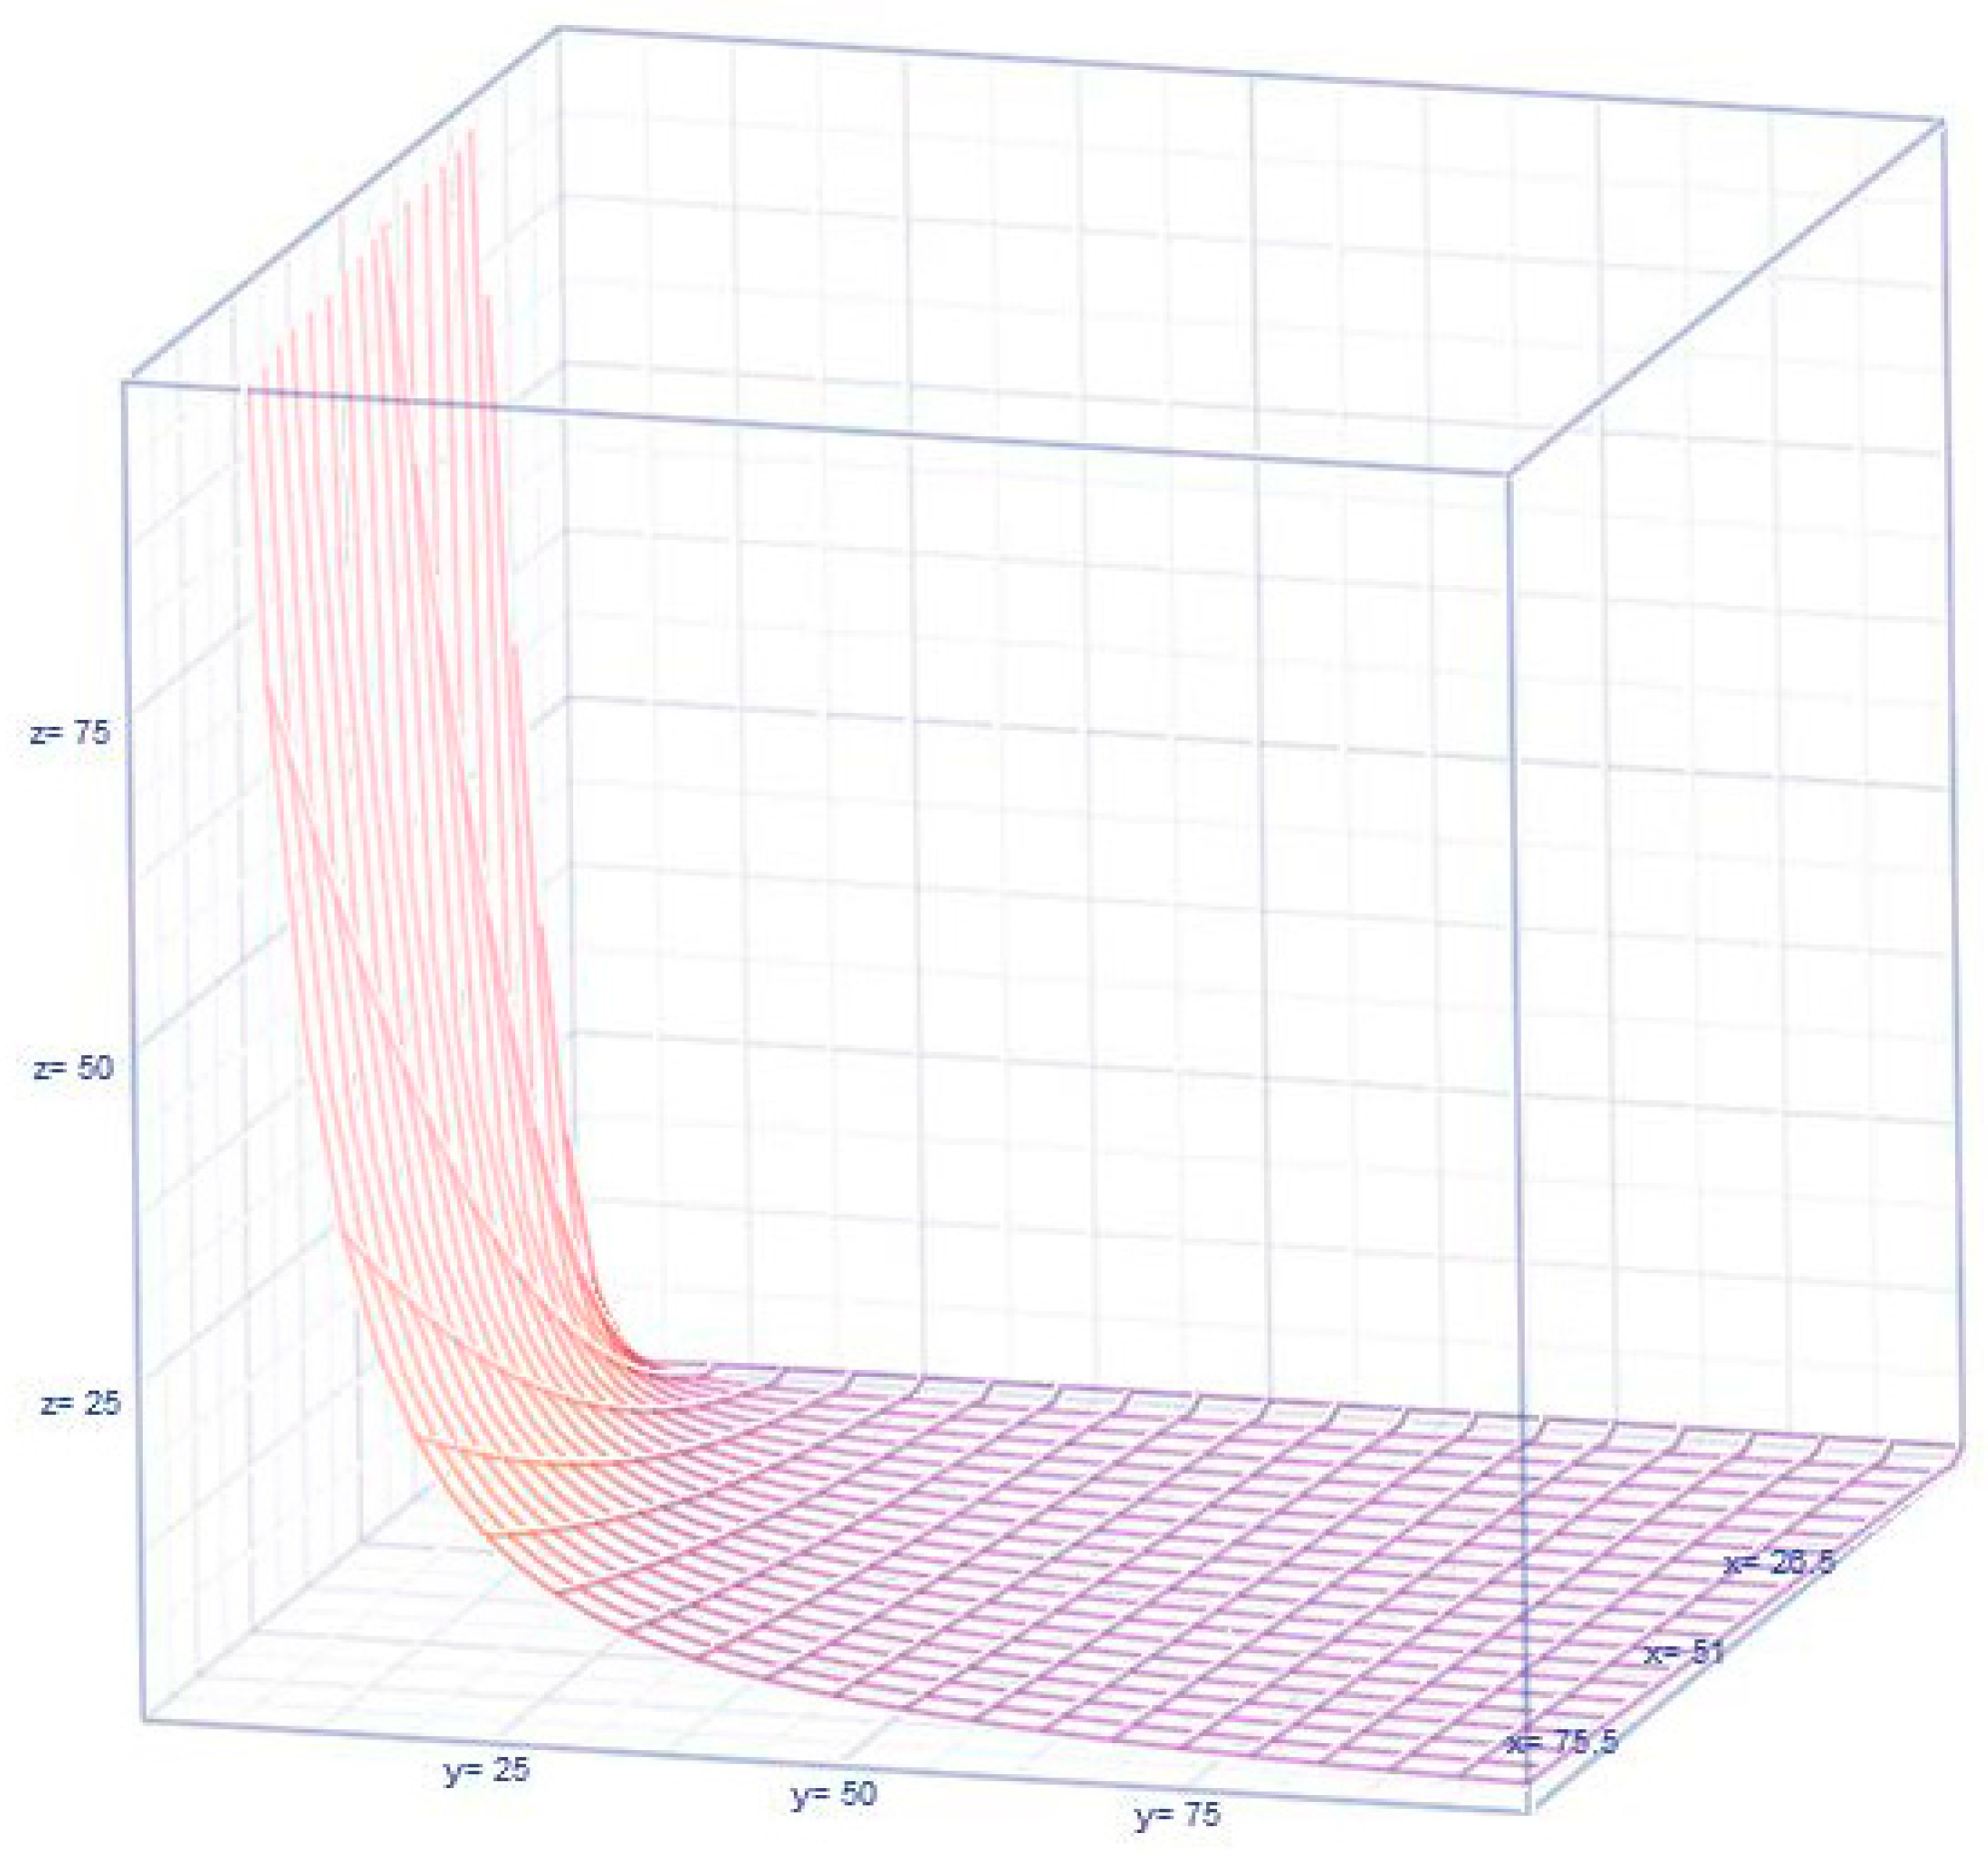
2.1. Visualization of the Dynamics of the Higgins I 2 Score

An improvement in Cochran’s Q score has also been suggested [24]. This is known as the Higgins I 2   s c o r e , ( Q ( θ 1 ) ( θ 1 ) ). It is assumed to follow a chi-squared distribution with ( θ 1 )   d e g r e e s   o f   f r e e d o m . The value of θ must be at least 2 for homogeneity to have any practical meaning. The I 2   s c o r e has been discussed in previous studies [23,25]. For the quadratic term I 2 to be nonnegative, θ must be less than Q + 1 . Therefore, I 2   the impractical constraint of 2 θ < Q + 1 . For a researcher interested in conducting a new meta-analytic study, it may not be possible to check the validation or break down the constraint in a new meta-analytic study, and the new meta-analytic study may result in a negative value for the I 2 score. This is a shortcoming of the I 2 score.
This score is not an absolute measure of heterogeneity among the studies in a meta-analysis. For example, a score of 0.5 does not necessarily mean that the effects range from 40 to 60, 10 to 90, or across other ranges [25]. Another way to interpret the score is to consider that it represents the ratio of the variation in the true effect to the observed variation in the effect. When the score is a proportion, it implicitly requires that the variation of the true effect be no greater than the observed variation owing to the sampling error. Caution is necessary when interpreting the Higgins I 2 scores. The value is near zero if the score echoes the closeness of the findings in the studies, whereas a near-one value implies non-harmonious findings. A visual representation of the dynamic nature of the score, as shown in Figure 1, has not been reported in the literature.
A shortcoming of this score is that it is not applicable when the Cochran score Q is less than the degrees of freedom d f = ( θ 1 ) . The score has a singularity problem in the sense that a finding of Q = d f may not necessarily mean homogeneous studies. The dynamics of the Higgins score in the Z-axis can be observed in Figure 1, where the Cochran’s Q score is on the X-axis and the number of studies, θ , is on the Y-axis.

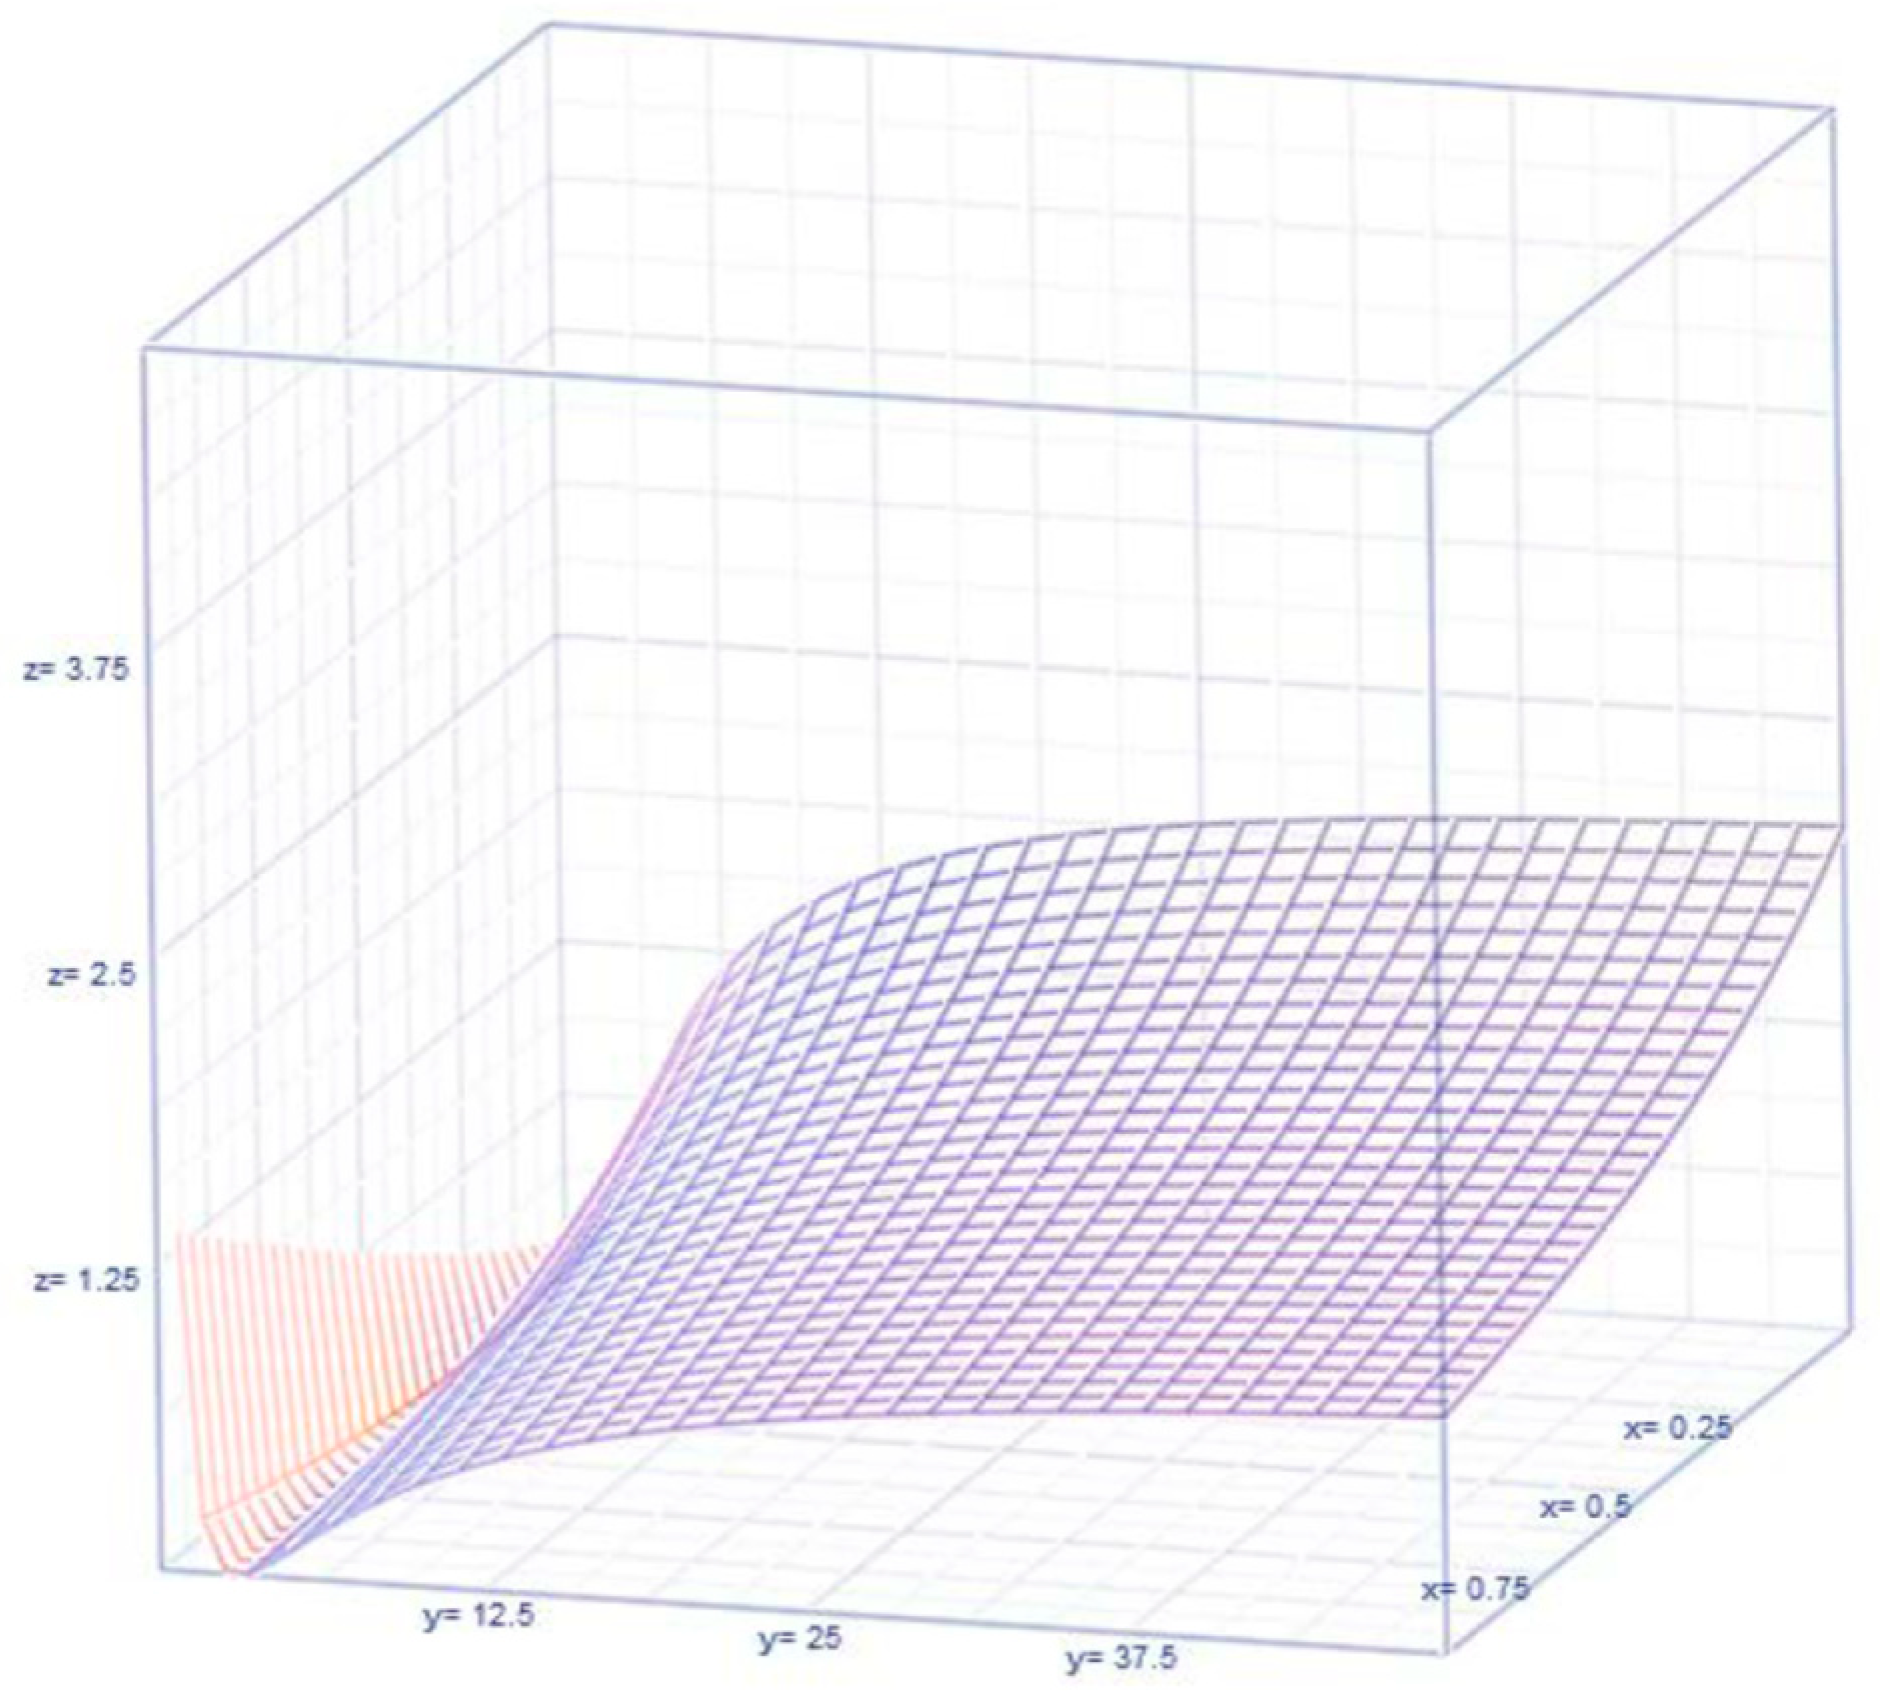
2.2. Visualization of the Dynamics of the Birge Ratio H 2   S c o r e

Subsequently, another competing score, H 2 , was introduced as a variation of the I 2   s c o r e   [22]. This is recognized as being similar to the Birge ratio [26], although the authors did not mention this. The Birge ratio is included in the least-squares principle of the regression method to iteratively compare and contrast internal versus external consistency using h n = h ( h 0 Δ e e 0 ) , where h is the true value of the regression parameter, h 0 is the initial value at step n 0 ,   Δ e is the increment in the experimental error e , and e 0 is the initial value of the experimental error. Visual Birge scores are shown in Figure 2. A comparison of Figure 1 and Figure 2 reveals that the I 2   and   H 2   s c o r e s are different. Similarly to the Higgins score, the Birge H 2   score also has shortcomings owing to the existence of more singularities.
We recall the interpretation that a value of I 2 closer to zero implies more homogeneity, while a value nearer to one refers to the percentage of heterogeneity among the selected studies in meta-topic discussions, excluding the negative values it takes on sometimes, as Q < θ 1 . Furthermore, the sample space for following a chi-squared distribution of the Higgins score I 2   must contain only non-negative values, which would be violated when Cochran’s measure, Q , is less than the d f = θ 1 . The dynamics of the Birge’s score in the Z-axis is observed in Figure 2, with the Cochran’s Q score on the X-axis and the number of studies, θ , on the Y-axis.

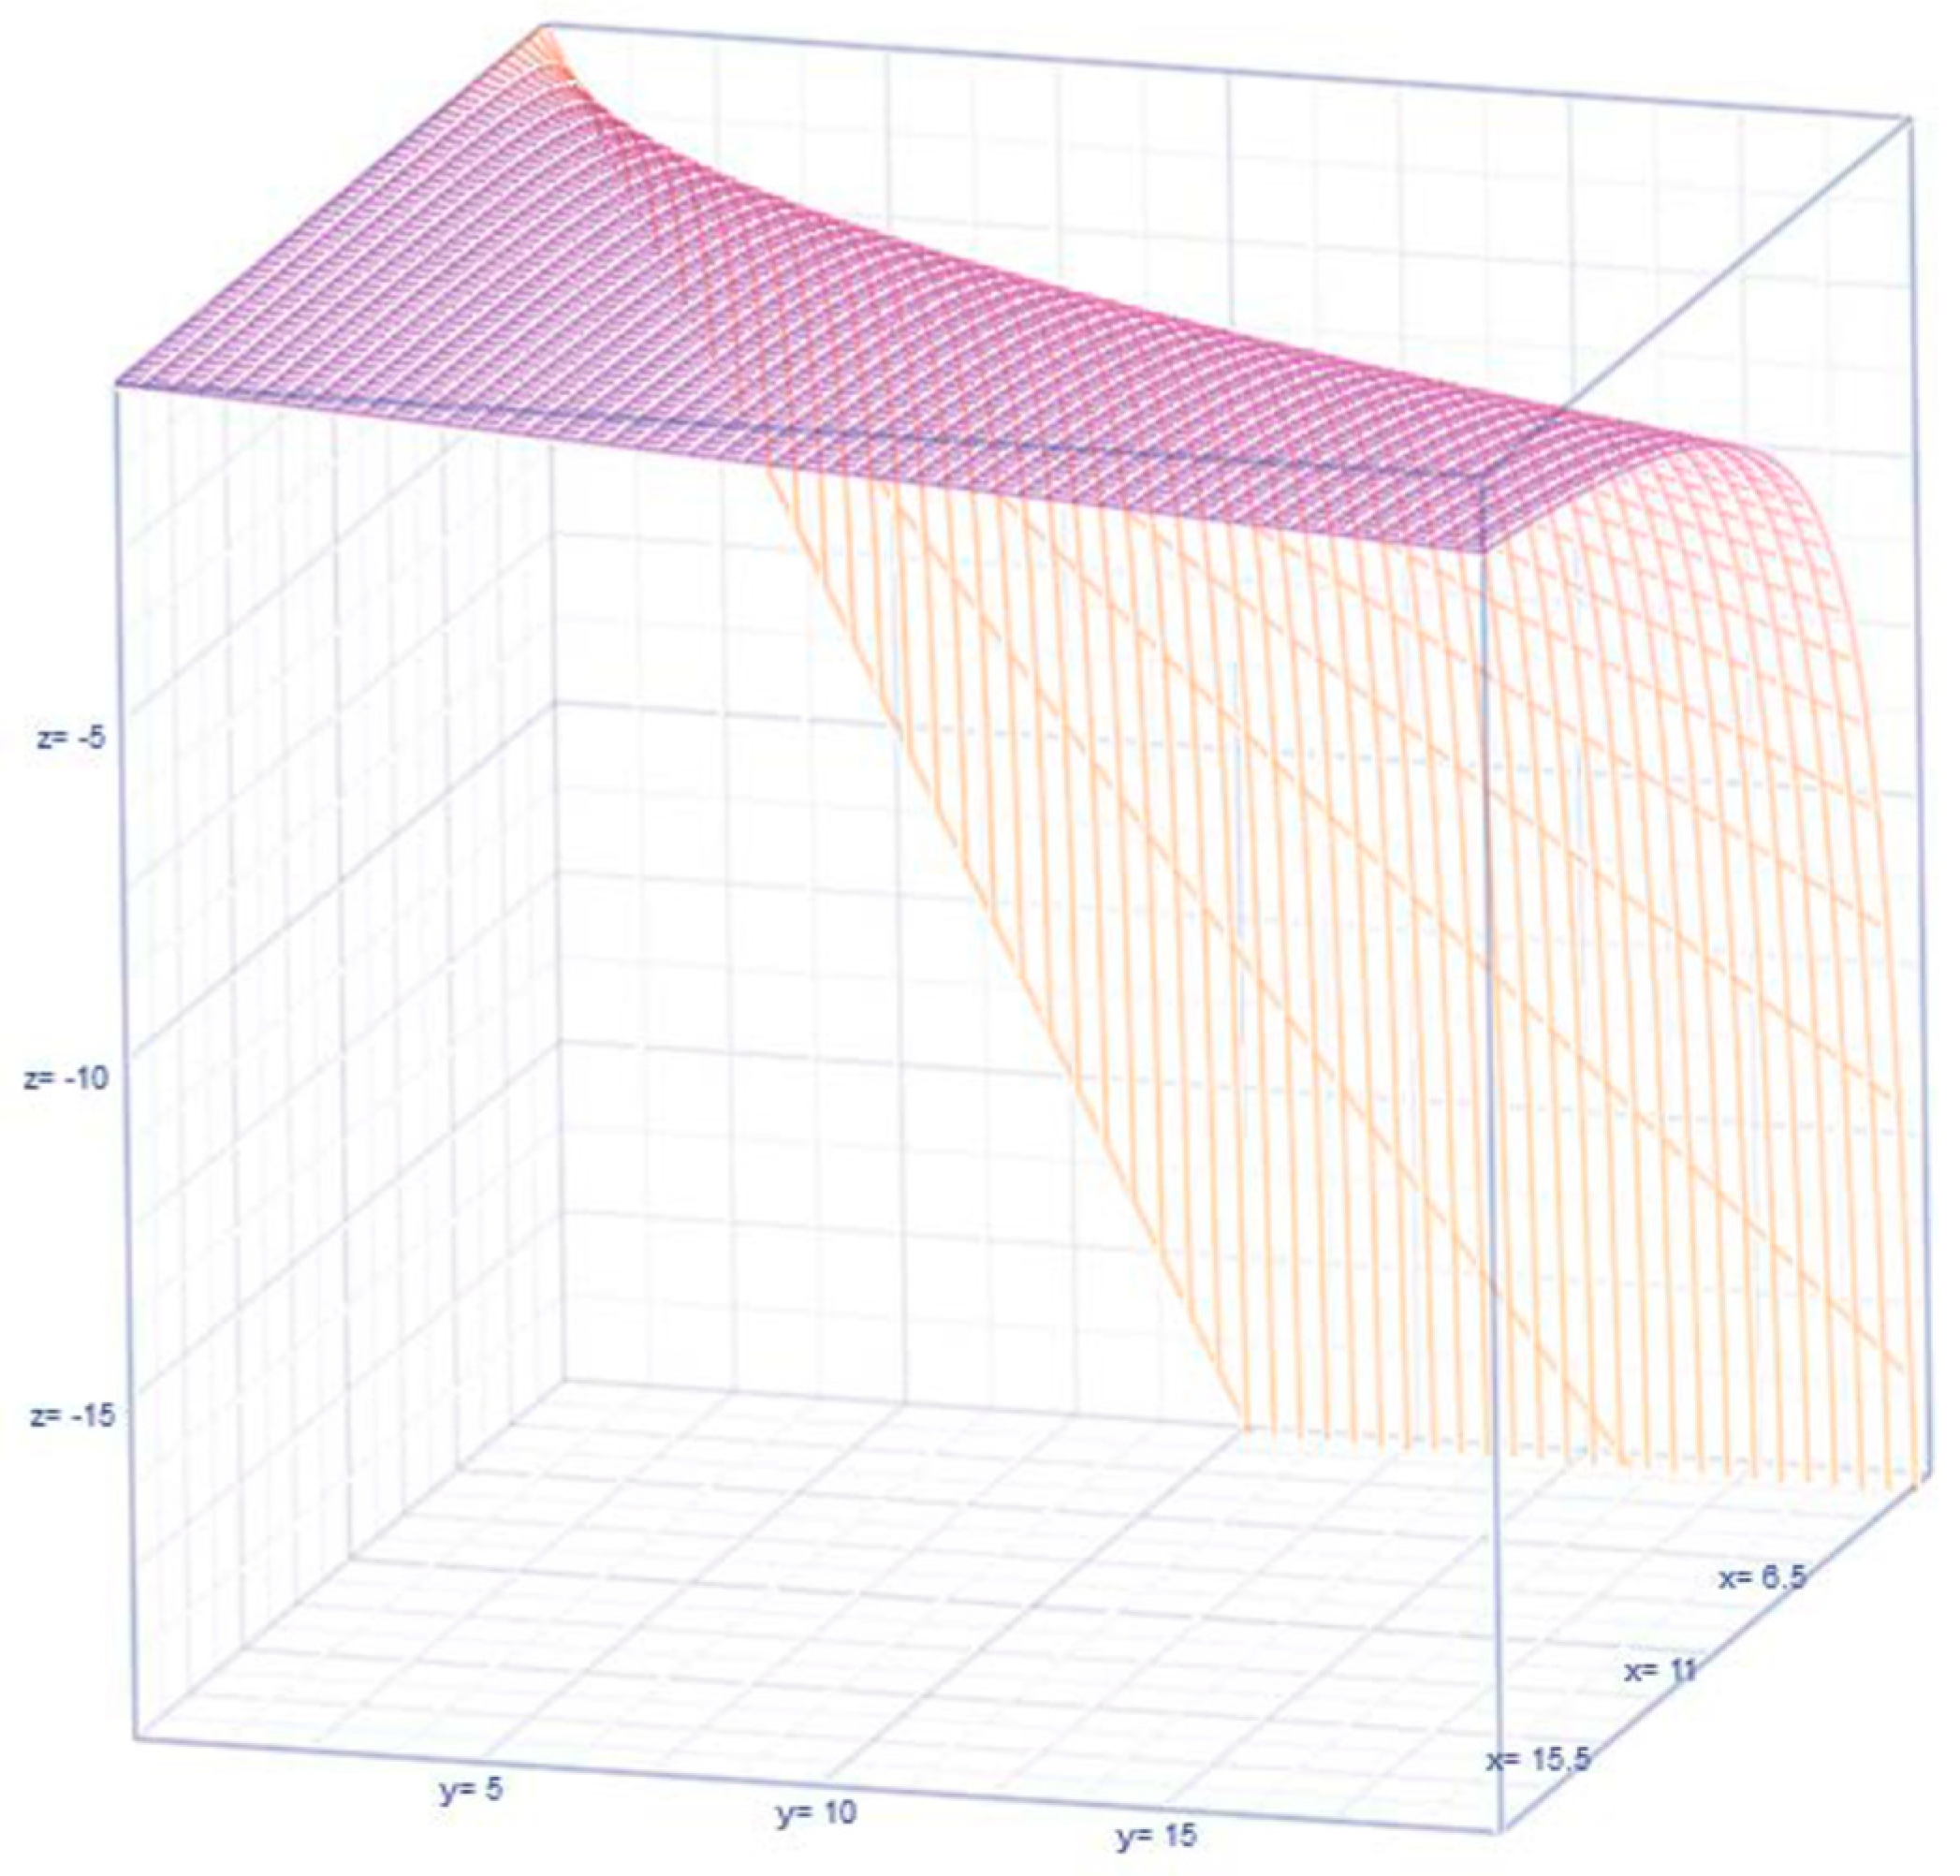
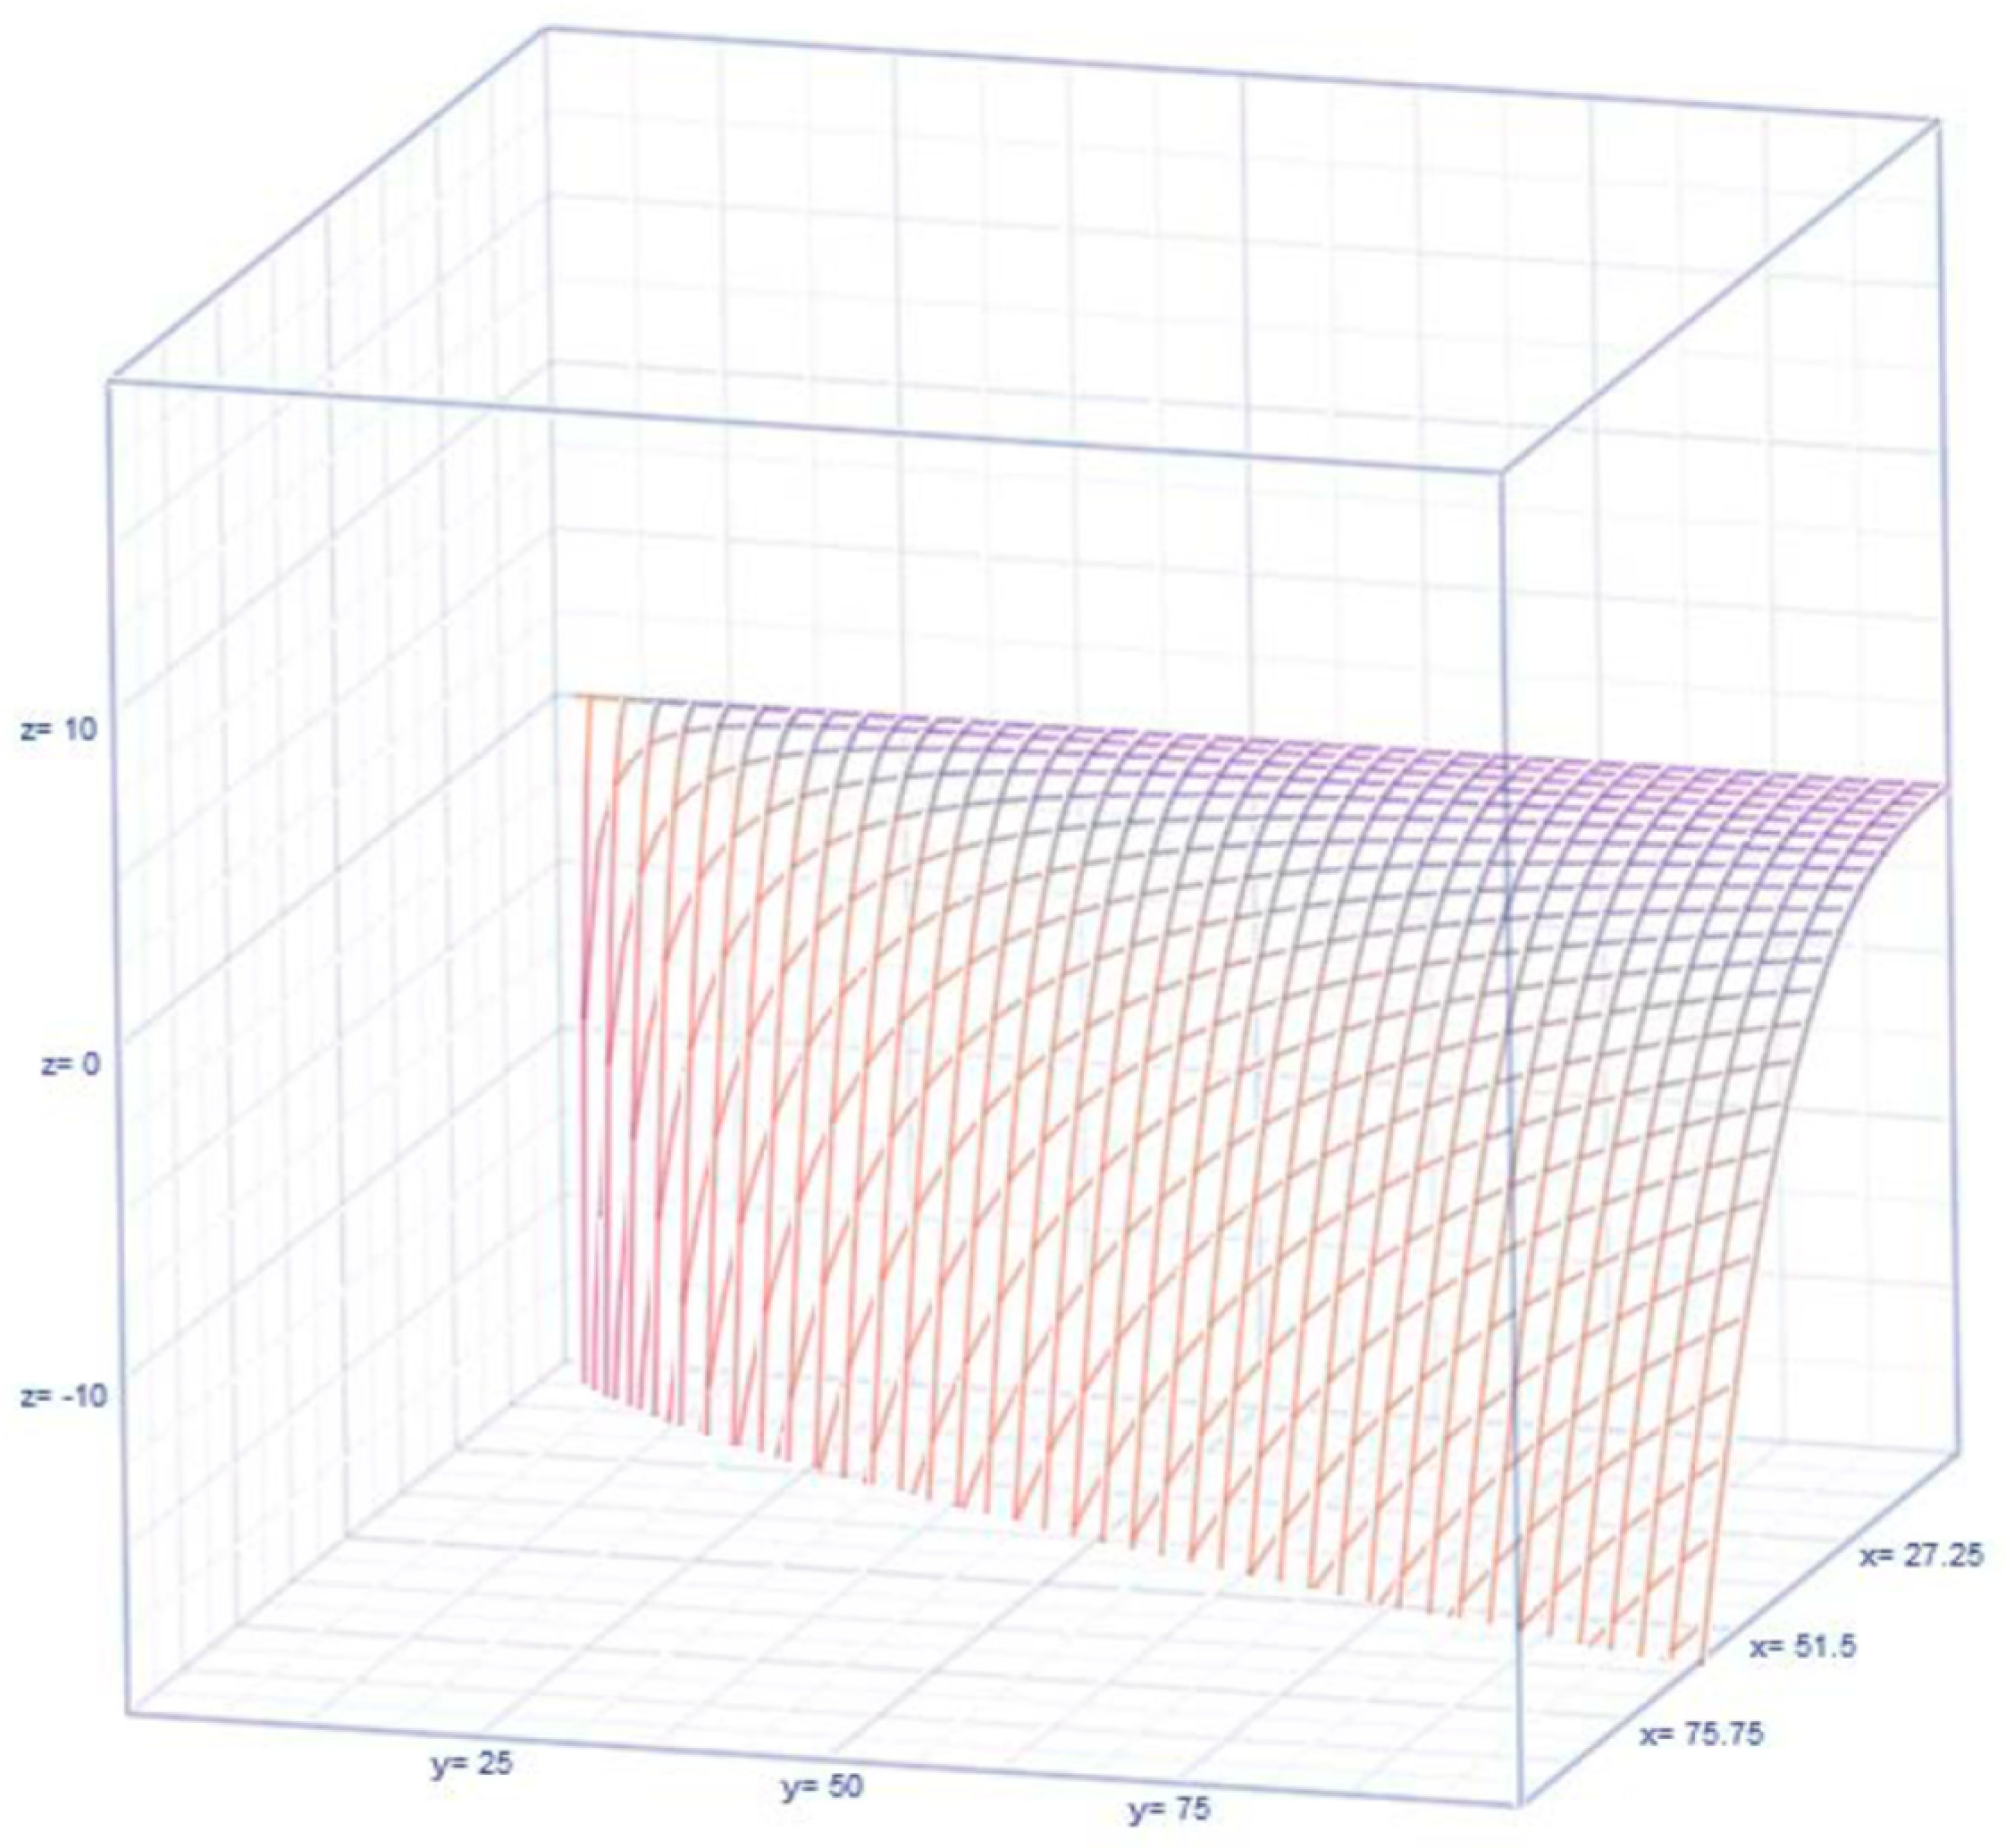
2.3. Visualization of the Dynamics of the S 2 Score

The S 2 score is a rectified score in the meta-analytic study framework to overcome the shortcomings of the Higgins score, I 2 ,   a n d   t h e   B i r g e   r a t i o   H 2   s c o r e [19,20]. Properties of the S 2 score are derived, including showing the correlation between two variables to be uncorrelated [19]. This new S 2 score also follows a chi-squared distribution with one degree of freedom ( θ = d f + 1 ) . Some of the derivations of the S 2 score [19], are briefly outlined as follows: It is known that two random variables U and V are independent.
E ( U V ) = [ E ( U ) E ( V ) ) ( 1 + V a r ( V ) [ E ( V ) ] 2 ) and   V a r ( U V ) = [ E ( U ) E ( V ) ] 2 [ V a r ( U ) [ E ( U ) ] 2 + V a r ( V ) [ E ( V ) ] 2 ) .
Letting U = d f and V = Q in Higgins I 2 , it is noted that
E ( I 2 ) = 1 + ( 1 V a r ( Q ) [ E ( Q ) ] 2 ) = 2 ( θ + 11 ) 6 ( θ 1 )
and
V a r ( I 2 ) = V a r ( d f Q ) = V a r ( d f ) [ E ( d f ) ] 2 + V a r ( Q ) [ E ( Q ) ] 2 = 1 3 [ 1 ( θ + 11 ) 2 ( θ 1 ) ]
Note that E ( d f ) = ( θ 1 ) 2 = E ( Q ) , implying that the S 2 score statistic
S 2 = [ I 2 E ( I 2 ) V a r ( I 2 ) ] 2 = χ 1 d f 2 = [ { ( θ + 11 ) 6 ( θ 1 ) ( 1 + d f Q ) } 3 1 ( θ + 1 ) 2 ( θ 1 ) ] 2
can be utilized as it follows a chi-squared distribution with one df. In other words, the p-value of a data base S 2 is Pr ( S 2 χ 1 , p v a l u e 2 ) = p-value. These results would help the practitioner to have more confidence in conducting the meta-analysis. The usefulness of the proposed methodology is illustrated by using two examples: mild cognitive impairment and COVID-19 vaccination [19,27,28,29,30]. Using this S 2 score method, 14 published articles representing 133 datasets were recently examined, and it was observed that many studies declared homogeneous by the Higgins method were, in fact, heterogeneous [20]. This article urges the research community to be cautious in making inferences using the Higgins method. A visual representation of the dynamic nature of the S 2 score is shown in Figure 3. The dynamics of the S 2 score on the Z-axis can be observed in Figure 1, with the Cochran’s Q score on the X-axis and the number of studies, θ , on the Y-axis.
Based on the visual comparisons of Figure 1, Figure 2 and Figure 3, the three scores, I 2 ,   H 2 , and S 2 , differ from each other. The interrelations between these three scores are illustrated in Figure 4, Figure 5 and Figure 6.

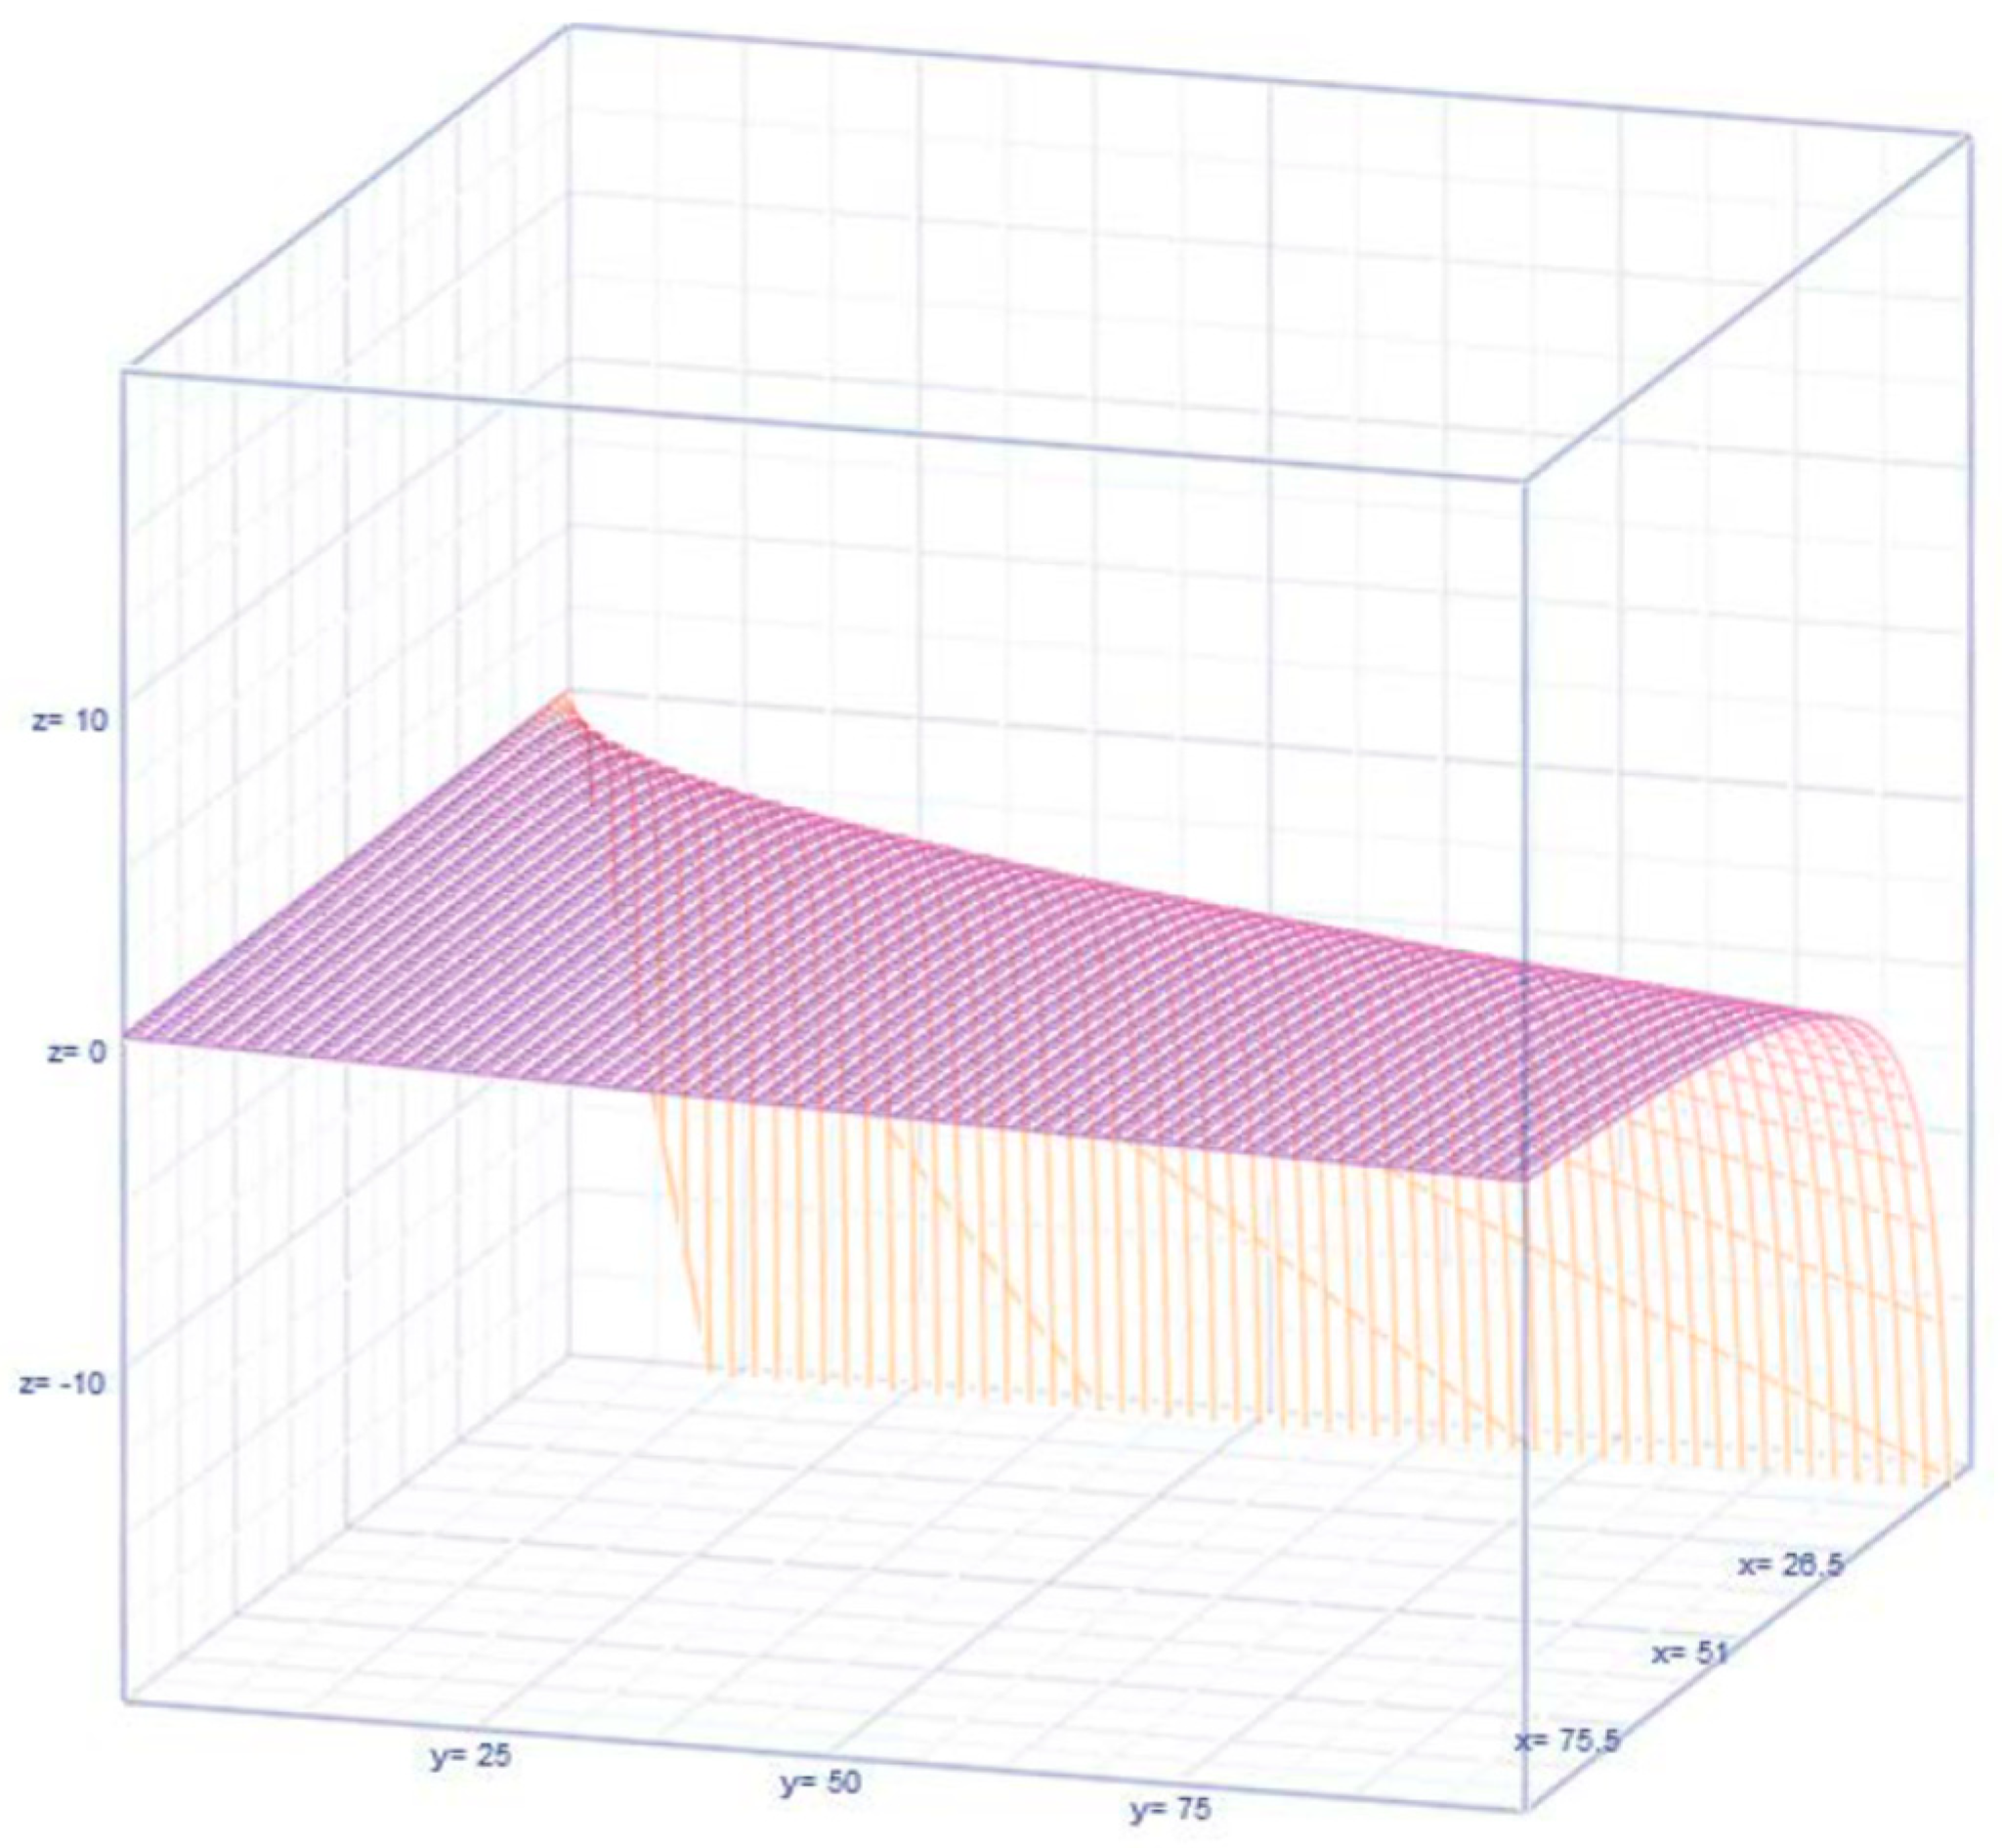
2.4. Visualization of the Dynamics of the Interrelations Among the Scores

The interrelation of the H 2   s c o r e on the Z-axis with the Cochran score, Q, on the Y-axis and the Higgins score on the X-axis is displayed in Figure 4. A similar interrelation of the S 2   s c o r e   on the Z-axis with the Cochran score, Q, on the Y-axis and the Higgins score on the X-axis is displayed in Figure 5. An interrelation the S 2   s c o r e   with the Cochran score, Q, on the Y-axis and the H 2   Score on the X-axis is displayed in Figure 6. Because the original Cochran’s Q score is improved by the H 2 score, which is then further refined by the S 2 score, it makes sense to compare the three methods (I2, H2, and S2), with more emphasis on Cochran’s Q. In Figure 4, we identified the score with Cochran’s Q score on the X-axis and the number of studies θ on the Y-axis. An interpretation of Figure 4 is that in light of both the Cochran Q score and the number of studies θ , the H 2 score is not quite consistent and linearly predictable (as the configuration is a nonlinear function). The implication is that further refinement of the score H 2 is a necessity in the approach to meta-analytics.
Figure 5 relates the nonlinear relationship of the new S 2   s c o r e   o n the Z-axis with the Cochran score, Q, on the Y-axis and the Higgins score on the X-axis. The cogency of the newness of our score to the existing Q and I 2 scores as well as the importance of our new approach and meta-analytic measures are indicated in Figure 5. Likewise, Figure 6 interrelates the nonlinear relation of our S 2   s c o r e with the Cochran score, Q, on the Y-axis and H 2   score on the X-axis. Our new score and approach are not redundant from the existing Q and H 2   s c o r e s .

3. Elasticity Score: A Measure of Comparison

The usefulness of elasticity is illustrated by comparing three heterogeneity scores. In physics, elasticity is the ability of a body to resist a distorting influence to return to its original size and shape when the cause is nullified. It is popular in economics, management, physics, and engineering disciplines but has also drawn the attention of researchers in the health and medicine disciplines. In economics, an increase in the price of a commodity decreases consumption/demand but increases supply/production. How much higher the production is compared to how much lower consumption is answered by elasticity [31]. In the discussion of epidemics or pandemics like COVID-19, healthcare professionals seek to capture the onset time, peak time, and inflexion time using the elasticity concept [32,33,34]. Mental and physical health elasticities were computed [35] at 0.05 and 0.06, respectively. These elasticities grew to 0.09 and 0.10 under dynastic persistence.
An elasticity value greater than one is indicative of an increasing risk of economic value, and it was pioneered by the social economist Alfred Marshall (1842–1924). Specifically, elasticity illustrates the implications of changes in purchases and production due to a one-unit change in price [36]. When the elasticity is greater than one, the purchase or production change is greater than the price change. When the elasticity is less than one, the change in production or purchase is smaller than the change in price. Elasticity is defined as a measure of the ratio e θ   of a nonsingular function of a changing parameter θ of the main interest in the existence of an auxiliary parameter of secondary interest. In human genetic studies of gene expression, an interplay occurs between biomolecular condensates and an elastic medium [37]. The parameter of interest, denoted as θ, represents the changing number of studies. The elasticity functions e θ , I θ 2 , e θ , H θ 2 , and e θ , S θ 2 of the Higgins I θ 2   s c o r e , the Birge H θ 2   s c o r e , and the S θ 2 score are derived and given as follows:
e θ , I θ 2 = θ ln I θ 2 θ ln θ ( θ θ 1 ) ( Q Q [ θ 1 ] ) ; θ 2
e θ , H θ 2 = θ ln H θ 2 θ ln θ ( θ θ 1 ) ( Q θ 1 ) ; θ 2 ,
e θ , S θ 2 = θ ln S θ 2 θ ln θ θ ( θ 1 ) ( θ 3 ) Q 2 ; θ 3 .
The elasticity of the S 2 score is always negative. In the case where the Higgins I 2   score is used, both factors ( θ θ 1 ) and ( Q θ 1 ) are greater than one, with a decreasing risk due to more studies, and the Cochran measure Q > 0 . When the Birge score is utilized, the first factor ( θ θ 1 ) is always greater than one, implying that the risk of heterogeneity increases as the number of studies θ increases. However, there are two scenarios in which the second factor, Q ( θ 1 ) , could cause the risk of heterogeneity. When Q < ( θ 1 ) , the heterogeneity is mild. On the contrary, when Q > ( θ 1 ) , the heterogeneity is strong. Such duality does not occur in the case of the Higgins I 2   score or the S 2 score.

Visualizations of the Dynamics of the Elasticities e θ , I θ 2 , e θ , H θ 2 , and e θ , S θ 2

The dynamics of the elasticities e θ , I θ 2 , e θ , H θ 2 ,   and e θ , S θ 2   are depicted in Figure 7, Figure 8 and Figure 9, respectively, for comparative purposes. A comparison of Figure 7 and Figure 8 indicates that the Higgins and Birge ratio scores are similar and comparable. Figure 9 suggests that the S 2 score is significantly different from the I 2   score and the H 2 scores. The elasticity e θ , I θ 2   on the Z-axis, the Higgins I 2   s c o r e on the Y-axis, and the number of studies θ on the X-axis are displayed in Figure 7. The elasticity e θ , H θ 2   on the Z-axis, the Birge score H 2   s c o r e on the Y-axis, and the number of studies θ on the X-axis are displayed in Figure 8. The elasticity e θ , S θ 2   on the Z-axis, the new score S 2   s c o r e on the Y-axis, and the number of studies θ on the X-axis are displayed in Figure 9. The specific supporting statistics to identify their differences are shown in the illustration section.

4. Application and Results

In this section, we present the results of various mental health studies from the literature. Lack of mental health reduces quality of life and increases healthcare costs [27,38,39,40,41,42,43,44,45]. The importance of understanding and rectifying mental health issues cannot be overlooked [46,47,48,49]. According to medical and health professionals, mental health is the state of mind that coordinates perception, reality, emotional intelligence, psychological cognition, and behavior, among other attributes. Mental health problems affect decision making and thereby create stressful non-harmonious interpersonal communications. Researchers have been working to identify the short- and long-term social and economic consequences of these. When the literature on mental health problems expands exponentially with results, healthcare professionals encounter difficulties in comparing confirmations or contradictions among published results, such as in the study populations, data collection methods, sample sizes, randomization principles, and inclusion or exclusion reasons may vary [28,37,50,51,52,53,54,55,56]. Unless any of these variations are small, the studies are not considered homogeneous, causing the findings not to be comparable according to meta-analytic techniques.
To help the reader, the following procedural steps were used in selecting the 287 peer-reviewed journal articles on mental health and meta-analysis:
Step 1.
Scan and select peer-reviewed mental-health journal meta-analysis articles in the literature using Google Scholar Search. Please note that the articles do not display the data.
Step 2.
Read the inference in each article and take notes on whether the meta-analysis indicates the existence of heterogeneity or homogeneity using the Higgins I2 score, the Cochran Q score, or the Birge H2 score.
Step 3.
Utilize the 287 inferences and their corresponding Higgins I2, Cochran Q, or H2 scores in calculating the S2 score and the integrated elasticity Higgins I2 score, Birge H2 score, and S2 score.
Please note that the reference section lists the authors’ names and the article year. If the reader is interested in checking/duplicating the results, the reader can copy a reference from the manuscript and paste it into “www.google.scholar.com”. There will be a link on the right-side panel for the article; click on the link to see the article on the screen. Now, read the article for the inference in the selected paper to check whether the article accepts heterogeneity or homogeneity using the Higgins score, the Cochran’s score, or the Birge H2 score. The last step is to calculate the S2 score and the integrated elasticity Higgins I2 score, the Birge H2 score, and the S2 score. The tables in our manuscript contain all other pertinent details.
Table 1 portrays all three elasticities: the Higgins I 2 score, the Birge ratio H 2 score, and the S 2 score, skewed with heavy (thick tailed) kurtosis. Based on the results in Table 2, only the elasticity of Higgins I 2 is significantly correlated with the elasticity of the Birge ratio   H 2 score. We analyzed the three elasticities using the SPSS 28 Principal Component (PC) program and obtained the results shown in Table 3. Because the PC scores might have different scales, we standardized them before applying PCA. Furthermore, we rotated the PC using Varimax to adjust for better interpretability.
There were only two significant PCs that explained 72.13% of the total variation. The Higgins and Birge score elasticities were picked up as important by the first PC, and the second PC picked up the S 2 score elasticity (Table 3). Figure 10 illustrates the proximity of the three elasticities. The Higgins and Birge elasticities are in the first and fourth quadrants, respectively, below the zero value of PC2. The path diagram of the grouping of the three elasticities in terms of two groups is shown in Figure 11.
Interestingly, the elasticity of the S 2 score is in the second quadrant, above the zero value of PC2 and the lower value of PC1. The three elasticities are organized into two groups in our factored results, as shown in Figure 11. The word “factor” in the above sentence does not refer to the factor analysis but rather in a common sense. In other words, the caption of Figure 11 echoes graphically the idea that the elasticities of H and I are versions of each other, but the elasticity of S stands apart as a different one on its merit. The Pearson correlation coefficients are appropriate for the elasticities; hence, they were utilized. Consider if heterogeneity affects all scores similarly and discuss the suitability of this measure in your analysis.

5. Discussion

Meta-analysis or meta-informatics identifies patterns of similarities and differences among studies with the same objectives. A meta-analysis is conducted to answer these questions. The model to integrate the studies should be of a fixed-, mixed-, or random-effects type and it should be determined whether the heterogeneity among the study populations is acceptable for the utility of meta-analysis in comprehending the findings regarding the impact of a treatment. In this study, three scores, the I 2 (Higgins score), H 2 (Birge ratio score), and S 2 scores, were used to judge the homogeneity among peer-reviewed published results in journals. A strategy for integrating these findings was also discussed. Visual comparisons of the scores are shown in Figure 1, Figure 2 and Figure 3, illustrating that the three scores, I 2 , H 2 , and S 2 , are different from each other.
In this article, the subjectivity in the judgement of heterogeneity that exists in published articles on mental health in the literature was replaced by an objective method using the S 2 score. One reason for this subjectivity in the Higgins score or Birge score is that these scores neglect the domain of the observable space in the chi-squared distribution. In the developed S 2 score, this error was rectified and corrected for bias using the chi-squared distributional properties. The difficulty was in clarifying whether all three scores would confirm or contradict each other’s judgement. In the case of contradictions, meta-analytic researchers may want to rank the scores based on chosen comparison principles. There should be such principles. This was addressed in this paper.
The concept of elasticity was introduced to compare the three scores of heterogeneity elasticity. In the discussion of epidemics or pandemics such as COVID-19, healthcare professionals seek to capture the onset time, peak time, and inflection time using the elasticity concept. The concept of elasticity is helpful in the reimbursement of a specified drug when its price is elastic [57,58]. Needless to say, this concept of elasticity and its properties are gaining attention in mental health research. Generally, elasticity is a quantitative measure of a distorted concept. In a report on science and economic geography in ResearchGate, an economist [59] applied inverse hyperbolic sine functions to normalize the highly right-skewed stochastic pattern of the health outcomes collected by robots to prevent the necessity of adding an arbitrary constant (usually one) under the traditional log transformation. This transformation usually excludes zero observations when computing and interpreting elasticities in mental health studies. In this research study on meta-analysis, elasticity refers to how heterogeneity decreases because of an additional study of the chosen topic of interest and its implications in the case of each score. Several future research directions have been identified within the practice of resolving mental health problems.
It has been known that evidence-based best treatments in clinical studies are effective for practitioners to treat patients with mental health problems. However, subtle but efficient treatments for mental disorders may not be available. The proposed meta-analytic approach compares the compatibility (or homogeneity) of the published results in clinical studies on mental health. Such compatibility paves the way for implementing knowledge into clinical practice in regard to patients’ diagnosis, prognosis, and suitable treatment recommendations from clinical studies.
In essence, we have discussed and developed a novel method for assessing heterogeneity in meta-analyses, with a focus on mental health studies. In the process, we critiqued two existing heterogeneity measures: the Higgins’ I2 score and Birge’s H2 ratio score, and pointed out their limitations, particularly their reliance on the chi-squared distribution and their potential biases. To alleviate these shortcomings, we introduce and advocate the use of a new S2 score, a rectified measure that improves upon I2 and H2 by better accounting for the domain of the chi-squared distribution. We compared these three measures using published meta-analytic literature on mental health studies. This method and these analytic expressions are significant for researchers conducting meta-analyses, especially in mental health, as they provide a refined method for judging homogeneity and integrating findings from multiple studies. Also, we provide a rigorous derivation of our approach. The argument for why S2 better accounts for the observable space in chi-squared distribution is formalized or mathematically justified. Furthermore, in a novel approach, we introduce the elasticity measure in meta-analysis as a useful metric for assessing heterogeneity. Elasticity measures provide insights for meta-analytic researchers to capture an unbiased assessment of the heterogeneity in studies. It should be noted that the new S2 score is preferable over I2 and H2 due to its versatility in detecting low, moderate, or high levels of heterogeneity. The reader is referred to [29,30,60,61,62,63,64,65,66] for other illustrations and interpretations of met-analytic results. Our illustrations in the last section using several published datasets from mental health studies attest to the versatility and impact of the new S 2 measure. The arguments comparing I2, H2, and S2 are strengthened by the demonstration of their interrelations in Figure 4, Figure 5 and Figure 6 and their elasticity dynamics in Figure 7, Figure 8 and Figure 9.

6. Conclusions

The sample space for the chi-squared distribution must contain only non-negative values. This shortcoming has been rectified in recently published papers [19,20]. This paper examined journal articles on mental health for homogeneity using three indices: the Higgins I 2 score, the Birge ratio H 2 score, and the S 2 score. The scores were computed, compared, and discussed in terms of their relative performances and implications. The concept of elasticity was introduced for each score, and its properties were discussed. Recently, this has been used to address various medical and health issues. Elasticity is the ability of a system to return to its original state after deformation. The concept of elasticity and its properties are gaining attention in mental health research. The article concludes with a recommendation to perform meta-analytic studies on mental health issues using the S 2 score to objectively and correctly judge the existence of significant heterogeneity in studies.

Author Contributions

Conceptualization—R.S. and K.P.S.; Methodology—R.S. and K.P.S.; Validation—R.S. and K.P.S.; Formal analysis—R.S.; Investigation—R.S. and K.P.S.; Writing—R.S. and K.P.S.; Writing—review and editing—R.S. and K.P.S.; Supervision—K.P.S.; Funding acquisition—K.P.S. All authors have read and agreed to the published version of the manuscript.

Funding

The authors received partial funding through an HCSC/BCBSTX Affordable Cures Grant #1122327 for the research, authorship, and/or publication of this article.

Data Availability Statement

The authors used data available in the public domain and from published journal articles. Further inquiries can be directed to the corresponding author.

Conflicts of Interest

The authors declare no conflicts of interest.

References

  1. Glass, G.V. Primary, secondary, and meta-analysis of research. Educ. Res. 1976, 5, 3–8. [Google Scholar] [CrossRef]
  2. Abuyadek, R.M.; Hammouda, E.A.; Elrewany, E.; Elmalawany, D.H.; Ashmawy, R.; Zeina, S.; Gebreal, A.; Ghazy, R.M. Acceptability of Tele-mental Health Services Among Users: A Systematic Review and Meta-analysis. BMC Public Health 2024, 24, 1143. [Google Scholar] [CrossRef]
  3. An, T.; Sun, H.; Yuan, L.; Wu, X.; Lu, B. Associations of anxiety and depression with restless leg syndrome: A systematic review and meta-analysis. Front. Neurol. 2024, 15, 1366839. [Google Scholar] [CrossRef]
  4. Ashraf, F.; Mustafa, M.S.; Shafique, M.A.; Haseeb, A.; Mussarat, A.; Noorani, A.; Iqbal, J. Association between depression and stroke risk in adults: A systematic review and meta-analysis. Front. Neurol. 2024, 15, 1331300. [Google Scholar] [CrossRef] [PubMed]
  5. Barry, R.; Anderson, J.; Tran, L.; Bahji, A.; Dimitropoulos, G.; Ghosh, S.M.; Kirkham, J.; Messier, G.; Patten, S.B.; Rittenbach, K.; et al. Prevalence of mental health disorders among individuals experiencing homelessness: A systematic review and Meta-analysis. JAMA Psychiatry 2024, 81, 691–699. [Google Scholar] [CrossRef] [PubMed]
  6. Booth, A.; Noyes, J.; Flemming, K.; Gerhardus, A.; Wahlster, P.; van der Wilt, G.J.; Mozygemba, K.; Refolo, P.; Sacchini, D.; Tummers, M.; et al. Guidance on Choosing Qualitative Evidence Synthesis Methods for Use in Health Technology Assessments of Complex Interventions. 2016. Available online: http://www.integrate-hta.eu/downloads/ (accessed on 11 April 2025).
  7. Grant, M.J.; Booth, A. A typology of reviews: An analysis of 14 review types and associated methodologies. Health Inf. Libr. J. 2009, 26, 91–108. [Google Scholar] [CrossRef] [PubMed]
  8. Fekadu Dadi, A.; Miller, E.R.; Mwanri, L. Antenatal depression and its association with adverse birth outcomes in low and middle-income countries: A systematic review and meta-analysis. PLoS ONE 2020, 15, e0227323. [Google Scholar] [CrossRef]
  9. Gao, P.; Cai, S.; Liu, Q.; Du, M.; Liu, J.; Liu, M. Effectiveness and safety of SARS-CoV-2 vaccines among children and adolescents: A systematic review and meta-analysis. Vaccines 2022, 10, 421. [Google Scholar] [CrossRef]
  10. Gao, P.; Kang, L.Y.; Liu, J.; Liu, M. Immunogenicity, effectiveness, and safety of COVID-19 vaccines among children and adolescents aged 2–18 years: An updated systematic review and meta-analysis. World J. Pediatr. 2023, 19, 1041–1054. [Google Scholar] [CrossRef]
  11. Gao, P.; Liu, J.; Liu, M. Effect of COVID-19 vaccines on reducing the risk of long COVID in the real world: A systematic review and meta-analysis. Int. J. Environ. Res. Public Health 2022, 19, 12422. [Google Scholar] [CrossRef]
  12. Ghafari, M.; Bahadivand-Chegini, S.; Nadi, T.; Doosti-Irani, A. The global prevalence of dental healthcare needs and unmet dental needs among adolescents: A systematic review and meta-analysis. Epidemiol. Health 2019, 41, e2019046. [Google Scholar] [CrossRef] [PubMed]
  13. Harris, C.; Hedges, L.; Valentine, J. Handbook of Research Synthesis and Meta-Analysis; Russell Sage Foundation: New York, NY, USA, 2009. [Google Scholar]
  14. Islam, M.M.; Yunus, M.Y.; Akib, M.S.; Iqbal, M.R.; Khan, M. Prevalence of COVID-19 vaccine hesitancy in South Asia: A systematic review and meta-analysis. J. Popul. Soc. Stud. 2023, 31, 587–611. [Google Scholar] [CrossRef]
  15. Petrocchi, N.; Ottaviani, C.; Cheli, S.; Matos, M.; Baldi, B.; Basran, J.K.; Gilbert, P. The impact of compassion-focused therapy on positive and negative mental health outcomes: Results of a series of meta-analyses. Clin. Psychol. Sci. Pract. 2023, 31, 230–247. [Google Scholar] [CrossRef]
  16. Pigott, T.D. Advances in Meta-Analysis; Springer: New York, NY, USA, 2012. [Google Scholar]
  17. Prabhod, K.J. The Role of Artificial Intelligence in Reducing Healthcare Costs and Improving Operational Efficiency. Q. J. Emerg. Technol. Innov. 2024, 9, 47–59. [Google Scholar]
  18. Shen, H.; Xie, J.; Li, J.; Cheng, Y. The correlation between scientific collaboration and citation counts at the paper level: A meta-analysis. Scientometrics 2021, 126, 3443–3470. [Google Scholar] [CrossRef]
  19. Shanmugam, R.; Singh, K.P. Practicing Meta-Analytics with Rectification. Publications 2025, 13, 2. [Google Scholar] [CrossRef]
  20. Shanmugam, R.; Tabatabai, M.; Wilus, D.; Singh, K.P. The bounds of meta-analytics and an alternative method. Epidemiol. Health 2024, 46, e2024016. [Google Scholar] [CrossRef] [PubMed]
  21. Gogtay, N.J.; Thatte, U.M. An introduction to meta-analysis. J. Assoc. Physicians India 2017, 65, 78–85. [Google Scholar]
  22. Higgins, J.P.; Thompson, S.G. Quantifying heterogeneity in a meta-analysis. Stat. Med. 2002, 21, 1539–1558. [Google Scholar] [CrossRef]
  23. Deeks, J.J.; Bossuyt, P.M.; Leeflang, M.M.; Takwoingi, Y. (Eds.) Cochrane Handbook for Systematic Reviews of Diagnostic Test Accuracy; John Wiley & Sons: Hoboken, NJ, USA, 2023. [Google Scholar]
  24. Higgins, J.P.; Thompson, S.G.; Deeks, J.J.; Altman, D.G. Measuring inconsistency in meta-analyses. BMJ 2003, 327, 557–560. [Google Scholar] [CrossRef]
  25. Borenstein, M.; Higgins, J.P.; Hedges, L.V.; Rothstein, H.R. Basics of meta-analysis: I2 is not an absolute measure of heterogeneity. Res. Synth. Methods 2017, 8, 5–18. [Google Scholar] [CrossRef] [PubMed]
  26. Birge, R.T. The calculation of errors by the method of least squares. Phys. Rev. 1932, 40, 207. [Google Scholar] [CrossRef]
  27. Isonne, C.; Iera, J.; Sciurti, A.; Renzi, E.; De Blasiis, M.R.; Marzuillo, C.; Villari, P.; Baccolini, V. How well does vaccine literacy predict intention to vaccinate and vaccination status? A systematic review and meta-analysis. Hum. Vaccines Immunother. 2024, 20, 2300848. [Google Scholar] [CrossRef] [PubMed]
  28. Naeimi, R.; Sepidarkish, M.; Mollalo, A.; Parsa, H.; Mahjour, S.; Safarpour, F.; Rostami, A. SARS-CoV-2 seroprevalence in children worldwide: A systematic review and meta-analysis. Eclinical Med. 2023, 56, 101786. [Google Scholar] [CrossRef]
  29. Özgüç, S.; Kaplan Serin, E.; Tanriverdi, D. Death anxiety associated with coronavirus (COVID-19) disease: A systematic review and meta-analysis. OMEGA-J. Death Dying 2024, 88, 823–856. [Google Scholar] [CrossRef]
  30. Pauley, D.; Cuijpers, P.; Papola, D.; Miguel, C.; Karyotaki, E. Two decades of digital interventions for anxiety disorders: A systematic review and meta-analysis of treatment effectiveness. Psychol. Med. 2023, 53, 567–579. [Google Scholar] [CrossRef]
  31. Agbokou, K. On the Nature of Elasticity Function: An Investigation and a Kernel Estimation. J. Appl. Math. 2023, 2023, 1346602. [Google Scholar] [CrossRef]
  32. Veres-Ferrer, E.J.; Pavía, J.M. Properties of the elasticity of a continuous random variable. A special look at its behavior and speed of change. Commun. Stat.-Theory Methods 2017, 46, 3054–3069. [Google Scholar] [CrossRef]
  33. Veres-Ferrer, E.J.; Pavía, J.M. Elasticity as a measure for online determination of remission points in ongoing epidemics. Stat. Med. 2021, 40, 865–884. [Google Scholar] [CrossRef]
  34. Veres-Ferrer, E.J.; Pavía, J.M. The Elasticity of a Random Variable as a Tool for Measuring and Assessing Risks. Risks 2022, 10, 68. [Google Scholar] [CrossRef]
  35. Bütikofer, A.; Ginja, R.; Karbownik, K.; Landaud, F. (Breaking) intergenerational transmission of mental health. J. Hum. Resour. 2024, 59, S108–S151. [Google Scholar] [CrossRef]
  36. Chandra, R. Alfred Marshall (1842–1924). In Reflections on the Future of Capitalism: From Karl Marx to Amartya Sen; Springer International Publishing: Cham, Switzerland, 2024; pp. 217–256. [Google Scholar]
  37. Meng, L.; Mao, S.; Lin, J. Heterogeneous elasticity drives ripening and controls bursting kinetics of transcriptional condensates. Proc. Natl. Acad. Sci. USA 2024, 121, e2316610121. [Google Scholar] [CrossRef] [PubMed]
  38. Jin, Y.; Sun, T.; Zheng, P.; An, J. Mass quarantine and mental health during COVID-19: A meta-analysis. J. Affect. Disord. 2021, 295, 1335–1346. [Google Scholar] [CrossRef]
  39. Li, J.; Yin, J.; Waqas, A.; Huang, Z.; Zhang, H.; Chen, M.; Li, X. Quality of life in mothers with perinatal depression: A systematic review and meta-Analysis. Front. Psychiatry 2022, 13, 734836. [Google Scholar] [CrossRef] [PubMed]
  40. Li, S.N.; Chien, W.T.; Lam, S.K.K.; Chen, Z.Y.; Ma, X. Effectiveness of parent-focused interventions for improving the mental health of parents and their children with autism spectrum disorder: A systematic review and meta-analysis. Res. Autism Spectr. Disord. 2024, 114, 102389. [Google Scholar] [CrossRef]
  41. Rajkumar, E.; Julia, G.J.; Sri Lakshmi, K.N.V.; Ranjana, P.K.; Manjima, M.; Devi, R.R.; Jacob, A.M. Prevalence of mental health problems among rural adolescents in India: A systematic review and meta-analysis. Sci. Rep. 2022, 12, 16573. [Google Scholar] [CrossRef]
  42. Restoy, D.; Oriol-Escudé, M.; Alonzo-Castillo, T.; Magán-Maganto, M.; Canal-Bedia, R.; Díez-Villoria, E.; Lugo-Marín, J. Emotion regulation and emotion dysregulation in children and adolescents with autism spectrum disorder: A meta-analysis of evaluation and intervention studies. Clin. Psychol. Rev. 2024, 109, 102410. [Google Scholar] [CrossRef]
  43. Rodrigues, B.; Encantado, J.; Franco, S.; Silva, M.N.; Carraça, E.V. Psychosocial correlations of physical activity in cancer survivors: A systematic review and meta-analysis. J. Cancer Surviv. 2024; 1–18, Online ahead of print. [Google Scholar] [CrossRef]
  44. Rosenbaum, D.A. The Cinderella of psychology: The neglect of motor control in the science of mental life and behavior. In Cognitive Control of Action; Routledge: London, UK, 2024; pp. 136–155. [Google Scholar]
  45. Wang, L.; Liang, C.; Chen, P.; Cao, Y.; Zhang, Y. Effect of antidepressants on psychological comorbidities, disease activity, and quality of life in inflammatory bowel disease: A systematic review and meta-analysis. Ther. Adv. Gastroenterol. 2023, 16, 17562848231155022. [Google Scholar] [CrossRef]
  46. Xiong, W.; Wang, D.; Ren, W.; Liu, X.; Wen, R.; Luo, Y. The global prevalence of and risk factors for fear of falling among older adults: A systematic review and meta-analysis. BMC Geriatr. 2024, 24, 321. [Google Scholar] [CrossRef]
  47. Yeo, G.; Tan, C.; Ho, D.; Baumeister, R.F. How do aspects of selfhood relate to depression and anxiety among youth? A meta-analysis. Psychol. Med. 2023, 53, 4833–4855. [Google Scholar] [CrossRef]
  48. Zhang, Q.; Wu, G.; Chen, J.; Fang, K.; Liu, Q.; Zhang, P.; Zhang, C. Factors influencing depressive symptoms in Chinese female breast cancer patients: A meta-analysis. Front. Psychol. 2024, 15, 1332523. [Google Scholar] [CrossRef]
  49. Zhang, Z.; Hu, Y.; Liu, S.; Feng, X.; Yang, J.; Cheng, L.J.; Wu, X.V. The effectiveness of e-mental health interventions on stress, anxiety, and depression among healthcare professionals: A systematic review and meta-analysis. Syst. Rev. 2024, 13, 144. [Google Scholar] [CrossRef] [PubMed]
  50. Mansouri, M.; Naghshi, S.; Parsaeian, M.; GSepanlou, S.; Poustchi, H.; Momayez Sanat, Z.; Pourshams, A. Opium Use and Cancer Risk: A Comprehensive Systematic Review and Meta-Analysis of Observational Studies. Int. J. Clin. Pract. 2022, 2022, 5397449. [Google Scholar] [CrossRef] [PubMed]
  51. Niu, C.; Li, P.; Du, X.; Zhao, M.; Wang, H.; Yang, D.; Jing, W. Risk factors for anxiety in patients with epilepsy: A meta-analysis. Epilepsy Behav. 2024, 153, 109665. [Google Scholar] [CrossRef]
  52. O’Dea, G.A.; Youssef, G.J.; Hagg, L.J.; Francis, L.M.; Spry, E.A.; Rossen, L.; Macdonald, J.A. Associations between maternal psychological distress and mother-infant bonding: A systematic review and meta-analysis. Arch. Women’s Ment. Health 2023, 26, 441–452. [Google Scholar] [CrossRef] [PubMed]
  53. Siskind, D.; Gallagher, E.; Winckel, K.; Hollingworth, S.; Kisely, S.; Firth, J.; Marteene, W. Does switching antipsychotics ameliorate weight gain in patients with severe mental illness? A systematic review and meta-analysis. Schizophr. Bull. 2021, 47, 948–958. [Google Scholar] [CrossRef]
  54. Soheili, M.; Khateri, S.; Moradpour, F.; Mohammadzedeh, P.; Zareie, M.; Mortazavi, S.M.M.; Moradi, Y. The efficacy and effectiveness of COVID-19 vaccines around the world: A mini-review and meta-analysis. Ann. Clin. Microbiol. Antimicrob. 2023, 22, 42. [Google Scholar] [CrossRef]
  55. Tng, G.Y.; Koh, J.; Soh, X.C.; Majeed, N.M.; Hartanto, A. Efficacy of digital mental health interventions for PTSD symptoms: A systematic review of meta-analyses. J. Affect. Disord. 2024, 357, 23–36. [Google Scholar] [CrossRef]
  56. Varghese, A.; George, G.; Kondaguli, S.V.; Naser, A.Y.; Khakha, D.C.; Chatterji, R. Decline in the mental health of nurses across the globe during COVID-19: A systematic review and meta-analysis. J. Glob. Health 2021, 11, 05009. [Google Scholar] [CrossRef]
  57. Ye, Z.; Li, W.; Zhu, R. Online psychosocial interventions for improving mental health in people during the COVID-19 pandemic: A systematic review and meta-analysis. J. Affect. Disord. 2022, 316, 120–131. [Google Scholar] [CrossRef]
  58. Zhu, X.; Chen, Y. Does price negotiation in China bring high-value novel drugs to the national medical insurance beneficiaries. Health Policy Technol. 2025, 14, 100963. [Google Scholar] [CrossRef]
  59. Perrot, A.; Compagnucci, F.; Veneri, P. Science & Economic Geography; ResearchGate: Berlin, Germany, 2025. [Google Scholar]
  60. Bonett, D.G. An Introduction to Meta-Analysis; University of California: Santa Cruz, CA, USA, 2017. [Google Scholar]
  61. Caffieri, A.; Gómez-Gómez, I.; Barquero-Jimenez, C.; De-Juan-Iglesias, P.; Margherita, G.; Motrico, E. Global prevalence of perinatal depression and anxiety during the COVID-19 pandemic: An umbrella review and meta-analytic synthesis. Acta Obstet. Gynecol. Scand. 2024, 103, 210–224. [Google Scholar] [CrossRef] [PubMed]
  62. Chen, J.; Li, C.; An, K.; Dong, X.; Liu, J.; Wu, H. Effectiveness of Telemedicine on Common Mental Disorders: An Umbrella Review and Meta-Meta-Analysis. Comput. Hum. Behav. 2024, 159, 108325. [Google Scholar] [CrossRef]
  63. Chen, Y.; Zhang, J.; Yuan, L.; Hu, H.; Li, T.; Zhao, Y.; Wu, Y.; Wang, M.; Huo, W.; Gao, Y.; et al. Obesity and risk of depressive disorder in children and adolescents: A meta-analysis of observational studies. Child Care Health Dev. 2024, 50, e13237. [Google Scholar] [CrossRef]
  64. de Vargas, D.; Volpato, R.J.; Dos Santos, L.C.; Pereira, C.F.; de Oliveira, S.R.; da Silva, R.R.; Maciel, M.E.D.; Fernandes, I.L.; de Oliveira Santana, K.; Aguilar, T.F. Prevalence of psychological and mental health symptoms among nursing professionals during the COVID-19 pandemic in the Americas: Systematic review and meta-analysis. Int. J. Ment. Health Nurs. 2024, 33, 582–599. [Google Scholar] [CrossRef]
  65. Pahari, S.; Barman, D.; Talukdar, R. Tobacco usage in India: A meta-analysis of evidence drawn from regional studies between 2010 and 2022. Trop. Med. Int. Health 2023, 28, 699–709. [Google Scholar] [CrossRef]
  66. Patwary, M.M.; Alam, M.A.; Bardhan, M.; Disha, A.S.; Haque, M.Z.; Billah, S.M.; Kabir, R. COVID-19 vaccine acceptance among low-and lower-middle-income countries: A rapid systematic review and meta-analysis. Vaccines 2022, 10, 427. [Google Scholar] [CrossRef]
Figure 1. Visualization of the Higgins I 2   s c o r e .
Mathematics 13 01364 g001
Figure 2. Visualization of the Birge ratio H 2   s c o r e .
Mathematics 13 01364 g002
Figure 3. Visualization of the S 2   s c o r e .
Mathematics 13 01364 g003
Figure 4. Interrelation of the H 2   s c o r e   o n   t h e  Z-axis with the Cochran Q score on the X-axis and the Higgins score on the Y-axis.
Mathematics 13 01364 g004
Figure 5. Interrelation of the S 2   s c o r e   on the Z-axis with the Cochran score, Q, on the Y-axis and the Higgins score on the X-axis.
Mathematics 13 01364 g005
Figure 6. Interrelation the S 2   score   with the Cochran score, Q, on the Y-axis and the H 2   score on the X-axis.
Mathematics 13 01364 g006
Figure 7. Elasticity e θ , I θ 2   of the Higgins I 2   s c o r e .
Mathematics 13 01364 g007
Figure 8. Elasticity e θ , H θ 2 of the Birge H 2   s c o r e .
Mathematics 13 01364 g008
Figure 9. Elasticity e θ , S θ 2 of S 2 score.
Mathematics 13 01364 g009
Figure 10. Proximity among the three elasticities.
Mathematics 13 01364 g010
Figure 11. Path diagram grouping the three elasticities into two groups.
Mathematics 13 01364 g011
Table 1. Descriptive statistics based on 287 datasets.
Descriptive Statistics
ElasticityNMeanStd. DeviationSkewnessKurtosis
StatisticStatisticStatisticStatisticStd ErrorStatisticStd Error
E l a s t i c i t y   e θ , I θ 2 287−3.26223.46361−9.0740.144103.1640.287
E l a s t i c i t y   e θ , H θ 2 287−2.10670.72007−9.1640.144119.0020.287
E l a s t i c i t y   e θ , S θ 2 287−115.08291009.33736−14.1020.144215.8310.287
Table 2. Correlations among the three elasticities.
Correlations
Elasticity E l a s t i c i t y   e θ , I θ 2 E l a s t i c i t y   e θ , H θ 2 E l a s t i c i t y   e θ , S θ 2
Elasticity e θ , I θ 2 Pearson Correlation1−0.153 **−0.040
Sig. (2-tailed) 0.0100.503
Elasticity e θ , H θ 2 Pearson Correlation−0.153 **1−0.022
Sig. (2-tailed)0.010 0.715
Elasticity e θ , S θ 2 Pearson Correlation−0.040−0.0221
Sig. (2-tailed)0.5030.715
** Correlation is significant at the 0.01 level (2-tailed).
Table 3. Two rotated PCs with their coefficients. a a method in PCA.
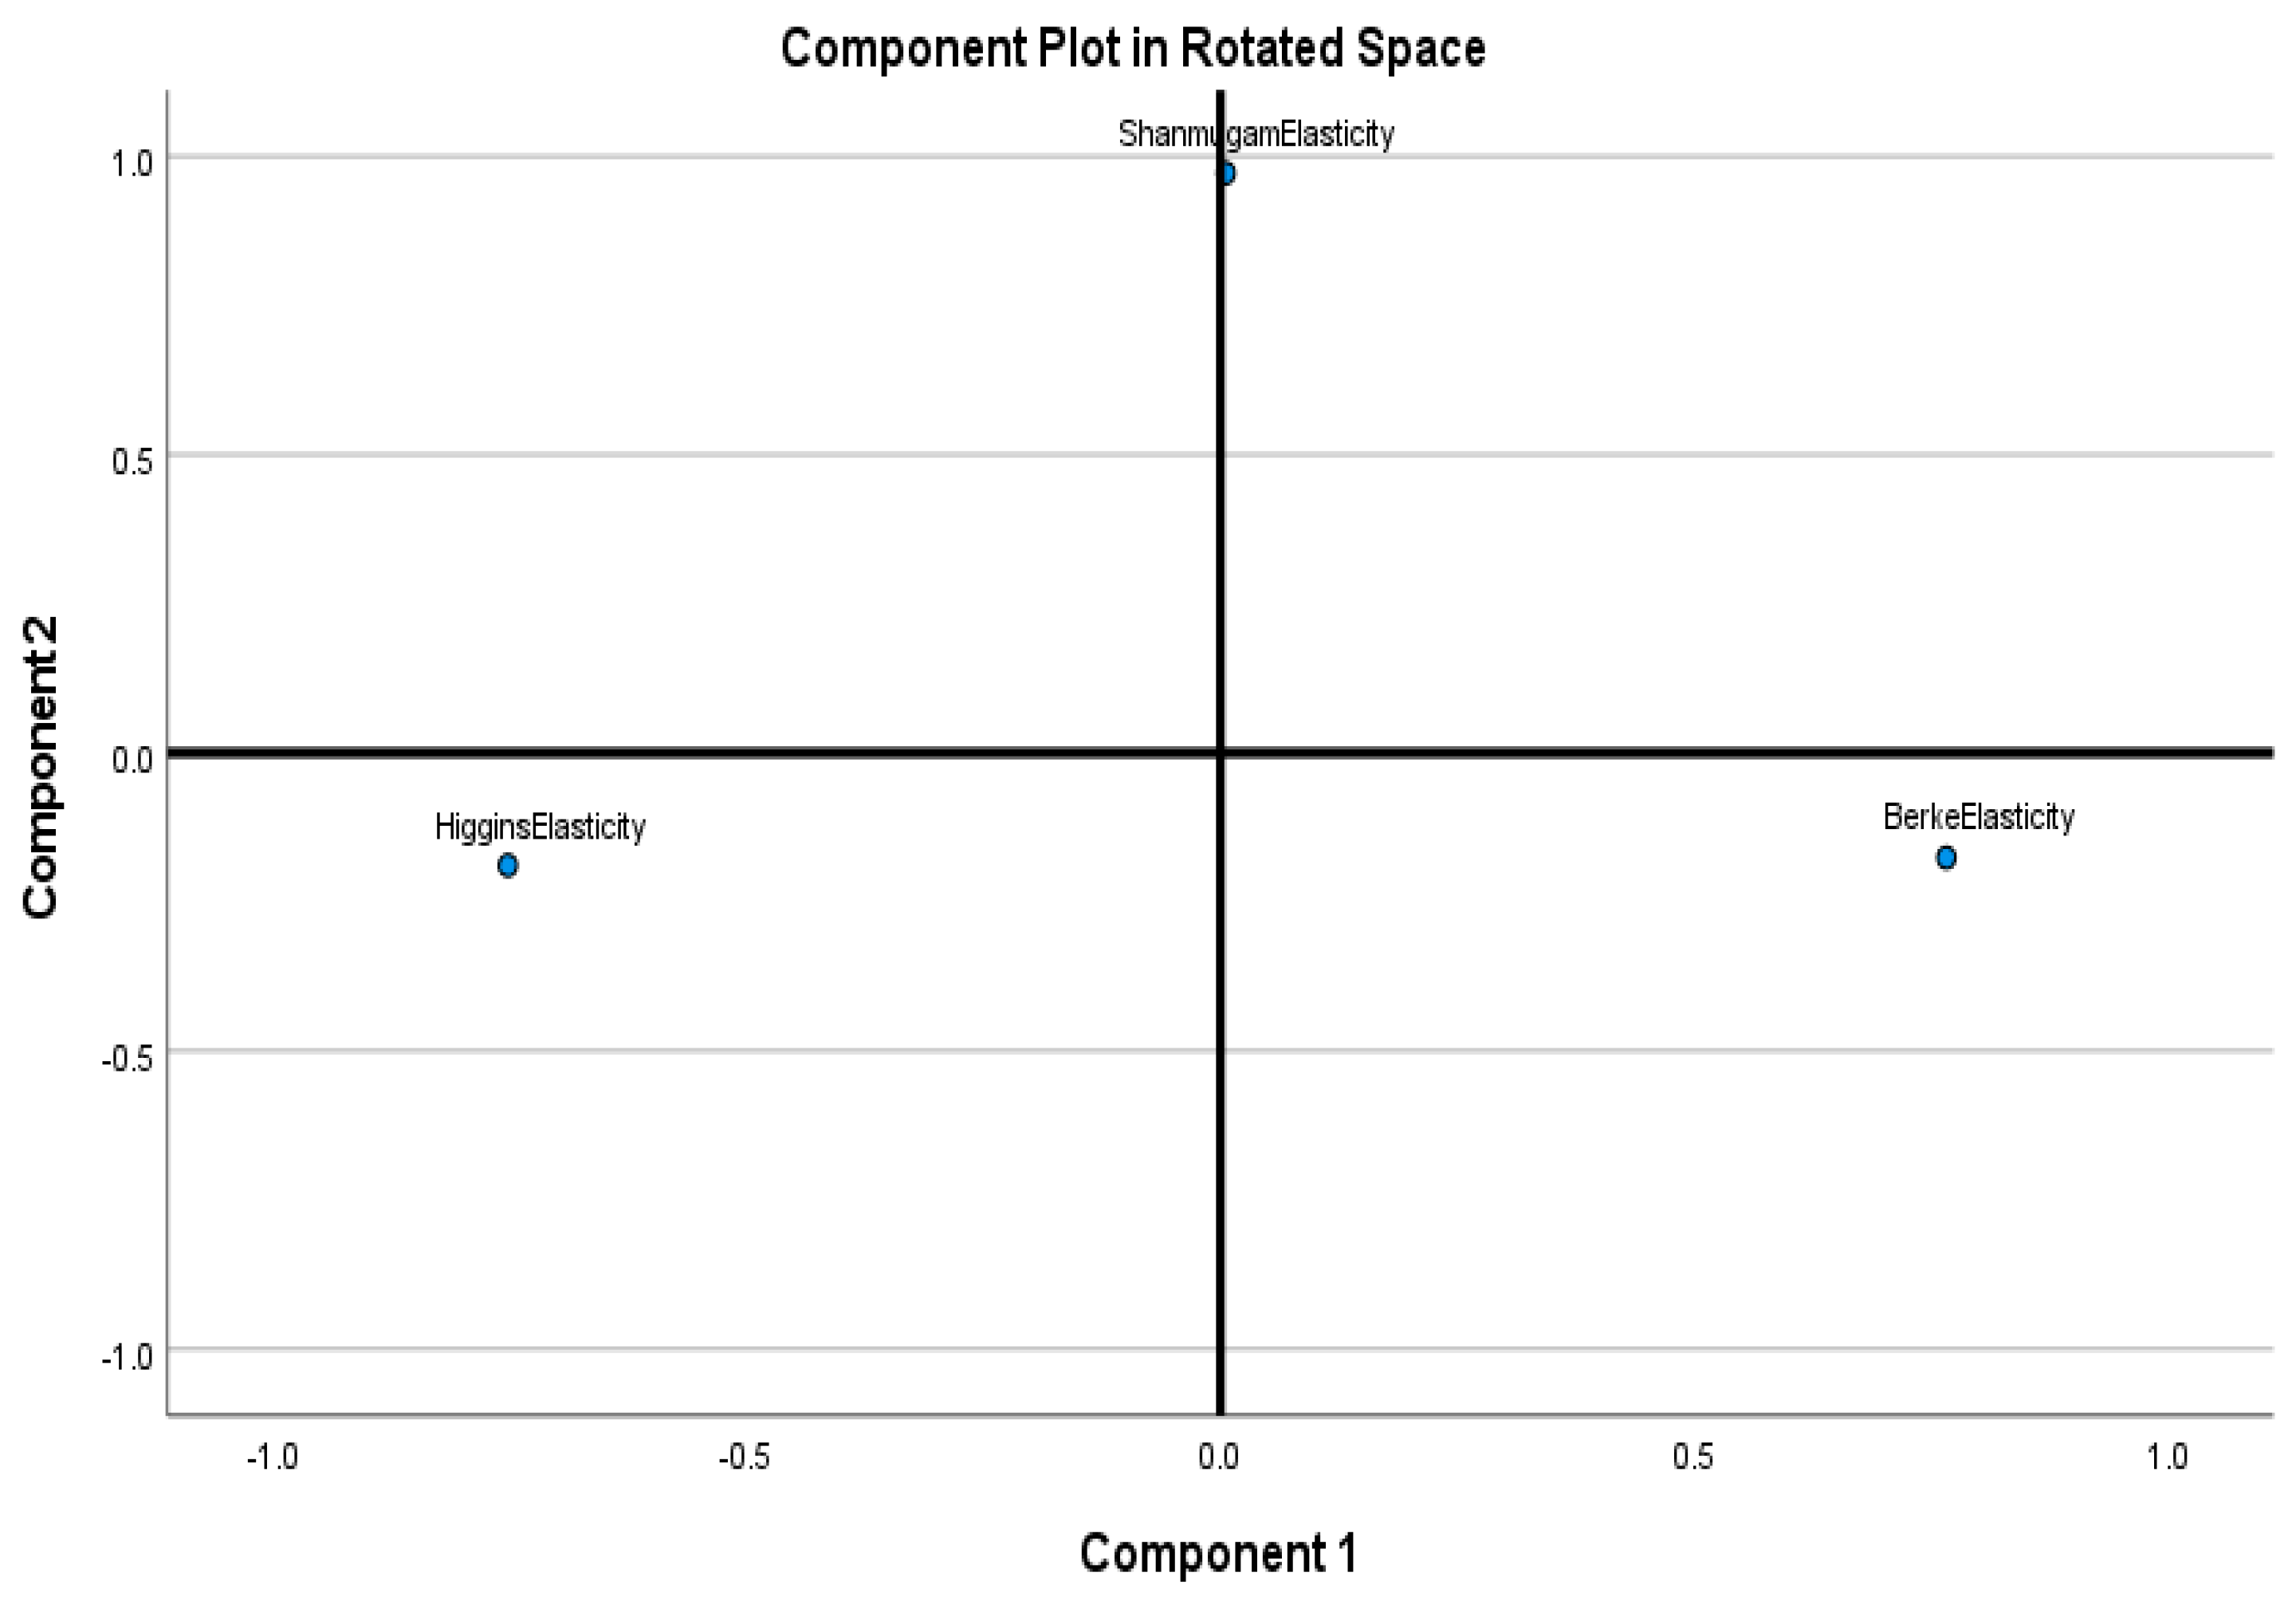
Rotated Component Matrix a
Component
12
Elasticity for I score−0.752−0.189
Elasticity for H score0.766−0.176
Elasticity for S score0.0060.972
Disclaimer/Publisher’s Note: The statements, opinions and data contained in all publications are solely those of the individual author(s) and contributor(s) and not of MDPI and/or the editor(s). MDPI and/or the editor(s) disclaim responsibility for any injury to people or property resulting from any ideas, methods, instructions or products referred to in the content.

