Computation of Probability Associated with Anderson–Darling Statistic


Abstract
:1. Introduction
2. Materials and Methods
2.1. Anderson–Darling Order Statistic
2.2. Monte Carlo Experiment for Anderson–Darling Statistic
2.3. Stratified Random Strategy
2.4. Model for Anderson–Darling Statistic
3. Simulation Results
3.1. Stratified vs. Random
3.2. Analysis of Residuals
4. Case Study
Author Contributions
Acknowledgments
Conflicts of Interest
References
- Nimon, K.F. Statistical assumptions of substantive analyses across the General Linear model: A Mini-Review. Front. Psychol. 2012, 3, 322. [Google Scholar] [CrossRef] [PubMed]
- Hoekstra, R.; Kiers, H.A.; Johnson, A. Are assumptions of well-known statistical techniques checked, and why (not)? Front. Psychol. 2012, 3, 137. [Google Scholar] [CrossRef] [PubMed]
- Kolmogorov, A. Sulla determinazione empirica di una legge di distribuzione. Giornale dell’Istituto Italiano degli Attuari 1933, 4, 83–91. [Google Scholar]
- Smirnov, N. Table for estimating the goodness of fit of empirical distributions. Ann. Math. Stat. 1948, 19, 279–281. [Google Scholar] [CrossRef]
- Anderson, T.W.; Darling, D.A. Asymptotic theory of certain “goodness-of-fit” criteria based on stochastic processes. Ann. Math. Stat. 1952, 23, 193–212. [Google Scholar] [CrossRef]
- Anderson, T.W.; Darling, D.A. A Test of Goodness-of-Fit. J. Am. Stat. Assoc. 1954, 49, 765–769. [Google Scholar] [CrossRef]
- Pearson, K. Contribution to the mathematical theory of evolution. II. Skew variation in homogenous material. Philos. Trans. R. Soc. Lond. 1895, 91, 343–414. [Google Scholar] [CrossRef]
- Cramér, H. On the composition of elementary errors. Scand. Actuar. J. 1928, 1, 13–74. [Google Scholar] [CrossRef]
- Von Mises, R.E. Wahrscheinlichkeit, Statistik und Wahrheit; Julius Springer: Berlin, Germany, 1928. [Google Scholar]
- Shapiro, S.S.; Wilk, M.B. An analysis of variance test for normality (complete samples). Biometrika 1965, 52, 591–611. [Google Scholar] [CrossRef]
- Jarque, C.M.; Bera, A.K. Efficient tests for normality, homoscedasticity and serial independence of regression residuals. Econ. Lett. 1980, 6, 255–259. [Google Scholar] [CrossRef]
- Jarque, C.M.; Bera, A.K. Efficient tests for normality, homoscedasticity and serial independence of regression residuals: Monte Carlo evidence. Econ. Lett. 1981, 7, 313–318. [Google Scholar] [CrossRef]
- Jarque, C.M.; Bera, A.K. A test for normality of observations and regression residuals. Int. Stat. Rev. 1987, 55, 163–172. [Google Scholar] [CrossRef]
- D’Agostino, R.B.; Belanger, A.; D’Agostino, R.B., Jr. A suggestion for using powerful and informative tests of normality. Am. Stat. 1990, 44, 316–321. [Google Scholar] [CrossRef]
- Lilliefors, H.W. On the Kolmogorov-Smirnov test for normality with mean and variance unknown. J. Am. Stat. Assoc. 1967, 62, 399–402. [Google Scholar] [CrossRef]
- Van Soest, J. Some experimental results concerning tests of normality. Stat. Neerl. 1967, 21, 91–97. [Google Scholar] [CrossRef]
- Jänstchi, L.; Bolboacă, S.D. Performances of Shannon’s entropy statistic in assessment of distribution of data. Ovidius Univ. Ann. Chem. 2017, 28, 30–42. [Google Scholar] [CrossRef]
- Noughabi, H.A. Two Powerful Tests for Normality. Ann. Data Sci. 2016, 3, 225–234. [Google Scholar] [CrossRef]
- Zamanzade, E.; Arghami, N.R. Testing normality based on new entropy estimators. J. Stat. Comput. Simul. 2012, 82, 1701–1713. [Google Scholar] [CrossRef]
- Peng, H.; Tan, F. Jackknife empirical likelihood goodness-of-fit tests for U-statistics based general estimating equations. Bernoulli 2018, 24, 449–464. [Google Scholar] [CrossRef]
- Shah, R.D.; Bühlmann, P. Goodness-of-fit tests for high dimensional linear models. Journal of the Royal Statistical Society. Ser. B Stat. Methodol. 2018, 80, 113–135. [Google Scholar] [CrossRef]
- Balakrishnan, K.; Sooriyarachchi, M.R. A goodness of fit test for multilevel survival data. Commun. Stat. Simul. Comput. 2018, 47, 30–47. [Google Scholar] [CrossRef]
- Perera, A.A.P.N.M.; Sooriyarachchi, M.R.; Wickramasuriya, S.L. A Goodness of Fit Test for the Multilevel Logistic Model. Commun. Stat. Simul. Comput. 2016, 45, 643–659. [Google Scholar] [CrossRef]
- Villaseñor, J.A.; González-Estrada, E.; Ochoa, A. On Testing the inverse Gaussian distribution hypothesis. Sankhya B 2017. [CrossRef]
- MacKenzie, D.W. Applying the Anderson-Darling test to suicide clusters: Evidence of contagion at U. S. Universities? Crisis 2013, 34, 434–437. [Google Scholar] [CrossRef] [PubMed]
- Müller, C.; Kloft, H. Parameter estimation with the Anderson-Darling test on experiments on glass. Stahlbau 2015, 84, 229–240. [Google Scholar] [CrossRef]
- İçen, D.; Bacanlı, S. Hypothesis testing for the mean of inverse Gaussian distribution using α-cuts. Soft Comput. 2015, 19, 113–119. [Google Scholar] [CrossRef]
- Ghasemi, A.; Zahediasl, S. Normality tests for statistical analysis: A guide for non-statisticians. Int. J. Endocrinol. Metab. 2012, 10, 486–489. [Google Scholar] [CrossRef] [PubMed]
- Hwe, E.K.; Mohd Yusoh, Z.I. Validation guideline for small scale dataset classification result in medical domain. Adv. Intell. Syst. Comput. 2018, 734, 272–281. [Google Scholar] [CrossRef]
- Ruxton, G.D.; Wilkinson, D.M.; Neuhäuser, M. Advice on testing the null hypothesis that a sample is drawn from a normal distribution. Anim. Behav. 2015, 107, 249–252. [Google Scholar] [CrossRef]
- Lang, T.A.; Altman, D.G. Basic statistical reporting for articles published in biomedical journals: The “Statistical Analyses and Methods in the Published Literature” or The SAMPL Guidelines. In Science Editors’ Handbook; European Association of Science Editors, Smart, P., Maisonneuve, H., Polderman, A., Eds.; EASE: Paris, France, 2013; Available online: http://www.equator-network.org/wp-content/uploads/2013/07/SAMPL-Guidelines-6-27-13.pdf (accessed on 3 January 2018).
- Curran-Everett, D.; Benos, D.J. American Physiological Society. Guidelines for reporting statistics in journals published by the American Physiological Society.
- Curran-Everett, D.; Benos, D.J. Guidelines for reporting statistics in journals published by the American Physiological Society: The sequel. Adv. Physiol. Educ. 2007, 31, 295–298. [Google Scholar] [CrossRef] [PubMed]
- Razali, N.M.; Wah, Y.B. Power comparison of Shapiro-Wilk, Kolmogorov-Smirnov, Lilliefors and Anderson-Darling tests. J. Stat. Model. Anal. 2011, 2, 21–33. [Google Scholar]
- Tui, I. Normality Testing—A New Direction. Int. J. Bus. Soc. Sci. 2011, 2, 115–118. [Google Scholar]
- Saculinggan, M.; Balase, E.A. Empirical Power Comparison of Goodness of Fit Tests for Normality in the Presence of Outliers. J. Phys. Conf. Ser. 2013, 435, 012041. [Google Scholar] [CrossRef]
- Sánchez-Espigares, J.A.; Grima, P.; Marco-Almagro, L. Visualizing type II error in normality tests. Am. Stat. 2017. [CrossRef]
- Yap, B.W.; Sim, S.H. Comparisons of various types of normality tests. J. Stat. Comput. Simul. 2011, 81, 2141–2155. [Google Scholar] [CrossRef]
- Patrício, M.; Ferreira, F.; Oliveiros, B.; Caramelo, F. Comparing the performance of normality tests with ROC analysis and confidence intervals. Commun. Stat. Simul. Comput. 2017, 46, 7535–7551. [Google Scholar] [CrossRef]
- Mbah, A.K.; Paothong, A. Shapiro-Francia test compared to other normality test using expected p-value. J. Stat. Comput. Simul. 2015, 85, 3002–3016. [Google Scholar] [CrossRef]
- Arshad, M.; Rasool, M.T.; Ahmad, M.I. Anderson Darling and Modified Anderson Darling Tests for Generalized Pareto Distribution. Pak. J. Appl. Sci. 2003, 3, 85–88. [Google Scholar]
- Stephens, M.A. Goodness of fit for the extreme value distribution. Biometrika 1977, 64, 585–588. [Google Scholar] [CrossRef]
- D’Agostino, R.B.; Stephens, M.A. Goodness-of-Fit Techniques; Marcel-Dekker: New York, NY, USA, 1986; pp. 123, 146. [Google Scholar]
- Shin, H.; Jung, Y.; Jeong, C.; Heo, J.-H. Assessment of modified Anderson–Darling test statistics for the generalized extreme value and generalized logistic distributions. Stoch. Environ. Res. Risk Assess. 2012, 26, 105–114. [Google Scholar] [CrossRef]
- De Micheaux, P.L.; Tran, V.A. PoweR: A Reproducible Research Tool to Ease Monte Carlo Power Simulation Studies for Goodness-of-fit Tests in R. J. Stat. Softw. 2016, 69. Available online: https://www.jstatsoft.org/article/view/v069i03 (accessed on 10 April 2018).
- 6ixSigma.org—Anderson Darling Test. Available online: http://6ixsigma.org/SharedFiles/Download.aspx?pageid=14&mid=35&fileid=147 (accessed on 2 June 2017).
- Spcforexcel. Anderson-Darling Test for Normality. 2011. Available online: http://www.spcforexcel.com/knowledge/basic-statistics/anderson-darling-test-for-normality (accessed on 2 June 2017).
- Qimacros—Data Normality Tests Using p and Critical Values in QI Macros. © 2015 KnowWare International Inc. Available online: http://www.qimacros.com/hypothesis-testing//data-normality-test/#anderson (accessed on 2 June 2017).
- Jäntschi, L.; Bolboacă, S.D. Distribution Fitting 2. Pearson-Fisher, Kolmogorov-Smirnov, Anderson-Darling, Wilks-Shapiro, Kramer-von-Misses and Jarque-Bera statistics. Bull. Univ. Agric. Sci. Vet. Med. Cluj-Napoca Hortic. 2009, 66, 691–697. [Google Scholar]
- Mosteller, F. Questions and Answers—Combining independent tests of significance. Am. Stat. 1948, 2, 30–31. [Google Scholar] [CrossRef]
- Bolboacă, S.D.; Jäntschi, L.; Sestraş, A.F.; Sestraş, R.E.; Pamfil, D.C. Pearson-Fisher Chi-Square Statistic Revisited. Information 2011, 2, 528–545. [Google Scholar] [CrossRef]
- Rahman, M.; Pearson, L.M.; Heien, H.C. A Modified Anderson-Darling Test for Uniformity. Bull. Malays. Math. Sci. Soc. 2006, 29, 11–16. [Google Scholar]
- Matsumoto, M.; Nishimura, T. Mersenne twister: A 623-dimensionally equidistributed uniform pseudo-random number generator (PDF). ACM Trans. Model. Comput. Simul. 1998, 8, 3–30. [Google Scholar] [CrossRef]
- Ciocan, A.; Ciocan, R.A.; Gherman, C.D.; Bolboacă, S.D. Evaluation of Patients with Lower Extremity Peripheral Artery Disease by Walking Tests: A Pilot Study. Not. Sci. Biol. 2017, 9, 473–479. [Google Scholar] [CrossRef]
- Răcătăianu, N.; Bolboacă, S.D.; Sitar-Tăut, A.-V.; Marza, S.; Moga, D.; Valea, A.; Ghervan, C. The effect of Metformin treatment in obese insulin-resistant patients with euthyroid goiter. Acta Clin. Belg. Int. J. Clin. Lab. Med. 2018. [CrossRef] [PubMed]
- Hășmășanu, M.G.; Baizat, M.; Procopciuc, L.M.; Blaga, L.; Văleanu, M.A.; Drugan, T.C.; Zaharie, G.C.; Bolboacă, S.D. Serum levels and ApaI polymorphism of insulin-like growth factor 2 on intrauterine growth restriction infants. J. Matern.-Fetal Neonatal Med. 2018, 31, 1470–1476. [Google Scholar] [CrossRef] [PubMed]
- Ciocan, R.A.; Drugan, C.; Gherman, C.D.; Cătană, C.-S.; Ciocan, A.; Drugan, T.C.; Bolboacă, S.D. Evaluation of Chitotriosidase as a Marker of Inflammatory Status in Critical Limb Ischemia. Ann. Clin. Lab. Sci. 2017, 47, 713–719. [Google Scholar] [PubMed]
- Bulboacă, A.E.; Bolboacă, S.D.; Stănescu, I.C.; Sfrângeu, C.-A.; Bulboacă, A.C. Preemptive Analgesic and Anti-Oxidative Effect of Curcumin for Experimental Migraine. BioMed Res. Int. 2017, 2017, 4754701. [Google Scholar] [CrossRef]
- Bulboacă, A.E.; Bolboacă, S.D.; Bulboacă, A.C.; Prodan, C.I. Association between low thyroid-stimulating hormone, posterior cortical atrophy and nitro-oxidative stress in elderly patients with cognitive dysfunction. Arch. Med. Sci. 2017, 13, 1160–1167. [Google Scholar] [CrossRef] [PubMed]
- Nistor, D.-V.; Caterev, S.; Bolboacă, S.D.; Cosma, D.; Lucaciu, D.O.G.; Todor, A. Transitioning to the direct anterior approach in total hip arthroplasty. Is it a true muscle sparing approach when performed by a low volume hip replacement surgeon? Int. Orthopt. 2017, 41, 2245–2252. [Google Scholar] [CrossRef] [PubMed]
- Bolboacă, S.D.; Jäntschi, L. Comparison of QSAR Performances on Carboquinone Derivatives. Sci. World J. 2009, 9, 1148–1166. [Google Scholar] [CrossRef] [PubMed]
- Harsa, A.M.; Harsa, T.E.; Bolboacă, S.D.; Diudea, M.V. QSAR in Flavonoids by Similarity Cluster Prediction. Curr. Comput.-Aided Drug Des. 2014, 10, 115–128. [Google Scholar] [CrossRef] [PubMed]
- Jäntschi, L.; Bolboacă, S.D.; Sestraş, R.E. A Study of Genetic Algorithm Evolution on the Lipophilicity of Polychlorinated Biphenyls. Chem. Biodivers. 2010, 7, 1978–1989. [Google Scholar] [CrossRef] [PubMed]
- Chirilă, M.; Bolboacă, S.D. Clinical efficiency of quadrivalent HPV (types 6/11/16/18) vaccine in patients with recurrent respiratory papillomatosis. Eur. Arch. Oto-Rhino-Laryngol. 2014, 271, 1135–1142. [Google Scholar] [CrossRef] [PubMed]
- Lenghel, L.M.; Botar-Jid, C.; Bolboacă, S.D.; Ciortea, C.; Vasilescu, D.; Băciuț, G.; Dudea, S.M. Comparative study of three sonoelastographic scores for differentiation between benign and malignant cervical lymph nodes. Eur. J. Radiol. 2015, 84, 1075–1082. [Google Scholar] [CrossRef] [PubMed]
- Bolboacă, S.D.; Jäntschi, L. Nano-quantitative structure-property relationship modeling on C42 fullerene isomers. J. Chem. 2016, 2016, 1791756. [Google Scholar] [CrossRef]
- Botar-Jid, C.; Cosgarea, R.; Bolboacă, S.D.; Șenilă, S.; Lenghel, M.L.; Rogojan, L.; Dudea, S.M. Assessment of Cutaneous Melanoma by Use of Very- High-Frequency Ultrasound and Real-Time Elastography. Am. J. Roentgenol. 2016, 206, 699–704. [Google Scholar] [CrossRef] [PubMed]
- Jäntschi, L.; Balint, D.; Pruteanu, L.L.; Bolboacă, S.D. Elemental factorial study on one-cage pentagonal face nanostructure congeners. Mater. Discov. 2016, 5, 14–21. [Google Scholar] [CrossRef]
- Micu, M.C.; Micu, R.; Surd, S.; Girlovanu, M.; Bolboacă, S.D.; Ostensen, M. TNF-a inhibitors do not impair sperm quality in males with ankylosing spondylitis after short-term or long-term treatment. Rheumatology 2014, 53, 1250–1255. [Google Scholar] [CrossRef] [PubMed]
- Sestraş, R.E.; Jäntschi, L.; Bolboacă, S.D. Poisson Parameters of Antimicrobial Activity: A Quantitative Structure-Activity Approach. Int. J. Mol. Sci. 2012, 13, 5207–5229. [Google Scholar] [CrossRef] [PubMed]
- Bolboacă, S.D.; Jäntschi, L.; Baciu, A.D.; Sestraş, R.E. Griffing’s Experimental Method II: Step-By-Step Descriptive and Inferential Analysis of Variances. JP J. Biostat. 2011, 6, 31–52. [Google Scholar]
- EasyFit. MathWave Technologies. Available online: http://www.mathwave.com (accessed on 25 March 2018).
- Arena, P.; Fazzino, S.; Fortuna, L.; Maniscalco, P. Game theory and non-linear dynamics: The Parrondo Paradox case study. Chaos Solitons Fractals 2003, 17, 545–555. [Google Scholar] [CrossRef]
- Ergün, S.; Aydoğan, T.; Alparslan Gök, S.Z. A Study on Performance Evaluation of Some Routing Algorithms Modeled by Game Theory Approach. AKU J. Sci. Eng. 2016, 16, 170–176. [Google Scholar]
- Hossin, M.; Sulaiman, M.N. A review on evaluation metrics for data classification evaluations. Int. J. Data Min. Knowl. Manag. Process 2015, 5, 1–11. [Google Scholar] [CrossRef]
- Gopalakrishna, A.K.; Ozcelebi, T.; Liotta, A.; Lukkien, J.J. Relevance as a Metric for Evaluating Machine Learning Algorithms. In Machine Learning and Data Mining in Pattern Recognition; Perner, P., Ed.; Lecture Notes in Computer Science; Springer: Berlin/Heidelberg, Germany, 2013; Volume 7988. [Google Scholar]


| Test Name | Abbreviation | Procedure |
|---|---|---|
| Kolmogorov–Smirnov | KS | Proximity analysis of the empirical distribution function (obtained on the sample) and the hypothesized distribution (theoretical) |
| Anderson–Darling | AD | How close the points are to the straight line estimated in a probability graphic |
| chi-square | CS | Comparison of sample data distribution with a theoretical distribution |
| Cramér–von Mises | CM | Estimation of the minimum distance between theoretical and sample probability distribution |
| Shapiro–Wilk | SW | Based on a linear model between the ordered observations and the expected values of the ordered statistics of the standard normal distribution |
| Jarque–Bera | JB | Estimation of the difference between asymmetry and kurtosis of observed data and theoretical distribution |
| D’Agostino–Pearson | AP | Combination of asymmetry and kurtosis measures |
| Lilliefors | LF | A modified KS that uses a Monte Carlo technique to calculate an approximation of the sampling distribution |
| Distribution [Ref] | α = 0.10 | α = 0.05 | α = 0.01 |
|---|---|---|---|
| Normal & lognormal [43] | 0.631 | 0.752 | 1.035 |
| Weibull [43] | 0.637 | 0.757 | 1.038 |
| Generalized extreme value [44] | - | - | - |
| n = 10 | 0.236 | 0.276 | 0.370 |
| n = 20 | 0.232 | 0.274 | 0.375 |
| n = 30 | 0.232 | 0.276 | 0.379 |
| n = 40 | 0.233 | 0.277 | 0.381 |
| n = 50 | 0.233 | 0.277 | 0.383 |
| n = 100 | 0.234 | 0.279 | 0.387 |
| Generalized logistic [44] | - | - | - |
| n = 10 | 0.223 | 0.266 | 0.374 |
| n = 20 | 0.241 | 0.290 | 0.413 |
| n = 30 | 0.220 | 0.301 | 0.429 |
| n = 40 | 0.254 | 0.306 | 0.435 |
| n = 50 | 0.258 | 0.311 | 0.442 |
| n = 100 | 0.267 | 0.323 | 0.461 |
| Uniform [52] * | 1.936 | 2.499 | 3.903 |
| Anderson–Darling Statistic | Formula for p-Value Calculation |
|---|---|
| AD ≥ 0.6 | exp (1.2937 − 5.709∙(AD*) + 0.0186∙(AD*)2) |
| 0.34 < AD* < 0.6 | exp (0.9177 − 4.279∙(AD*) − 1.38∙(AD*)2) |
| 0.2 < AD* < 0.34 | 1 − exp (−8.318 + 42.796∙(AD*) − 59.938∙(AD*)2) |
| AD* ≤ 0.2 | 1 − exp (−13.436 + 101.14∙(AD*) − 223.73∙(AD*)2) |
| Class | t1 | t2 | t3 | Case |
|---|---|---|---|---|
| “0” if ti < 0.5 “1” if ti ≥ 0.5 | 0 | 0 | 0 | 1 |
| 0 | 0 | 1 | 2 | |
| 0 | 1 | 0 | 3 | |
| 0 | 1 | 1 | 4 | |
| 1 | 0 | 0 | 5 | |
| 1 | 0 | 1 | 6 | |
| 1 | 1 | 0 | 7 | |
| 1 | 1 | 1 | 8 |
| |{ti|ti < 0.5}| | |{ti|ti ≥ 0.5}| | Frequency (Case in Table 4) |
|---|---|---|
| 3 | 0 | 1 (case 1) |
| 2 | 1 | 3 (case 2, 3, 5) |
| 1 | 2 | 3 (case 4, 6, 7) |
| 0 | 3 | 1 (case 8) |
| Coefficient | Value (95% CI) | SE | t-Value |
|---|---|---|---|
| a0 | 4.160 (4.126 to 4.195) | 0.017567 | 237 |
| a1 | −10.327 (−10.392 to −10.263) | 0.032902 | −314 |
| a2 | 9.357 (9.315 to 9.400) | 0.02178 | 430 |
| a3 | −6.147 (−6.159 to −6.135) | 0.00601 | −1023 |
| a4 | 3.4925 (3.4913 to 3.4936) | 0.000583 | 5993 |
| SST = 1550651, SSRes = 0.0057, SSE = 0.0034, r2adj = 0.999999997 | |||
| bi,j (ti,j) | j = 0 | j = 1 | j = 2 | j = 3 | j = 4 |
|---|---|---|---|---|---|
| i = 0 | 5.6737 (710) | −38.9087 (4871) | 88.7461 (11111) | −179.5470 (22479) | 199.3247 (24955) |
| i = 1 | −13.5729 (1699) | 83.6500 (10473) | −181.6768 (22746) | 347.6606 (43526) | −367.4883 (46009) |
| i = 2 | 12.0750 (1512) | −70.3770 (8811) | 139.8035 (17503) | −245.6051 (30749) | 243.5784 (30496) |
| i = 3 | −7.3190 (916) | 30.4792 (3816) | −49.9105 (6249) | 76.7476 (9609) | −70.1764 (8786) |
| i = 4 | 3.7309 (467) | −6.1885 (775) | 7.3420 (919) | −9.3021 (1165) | 7.7018 (964) |
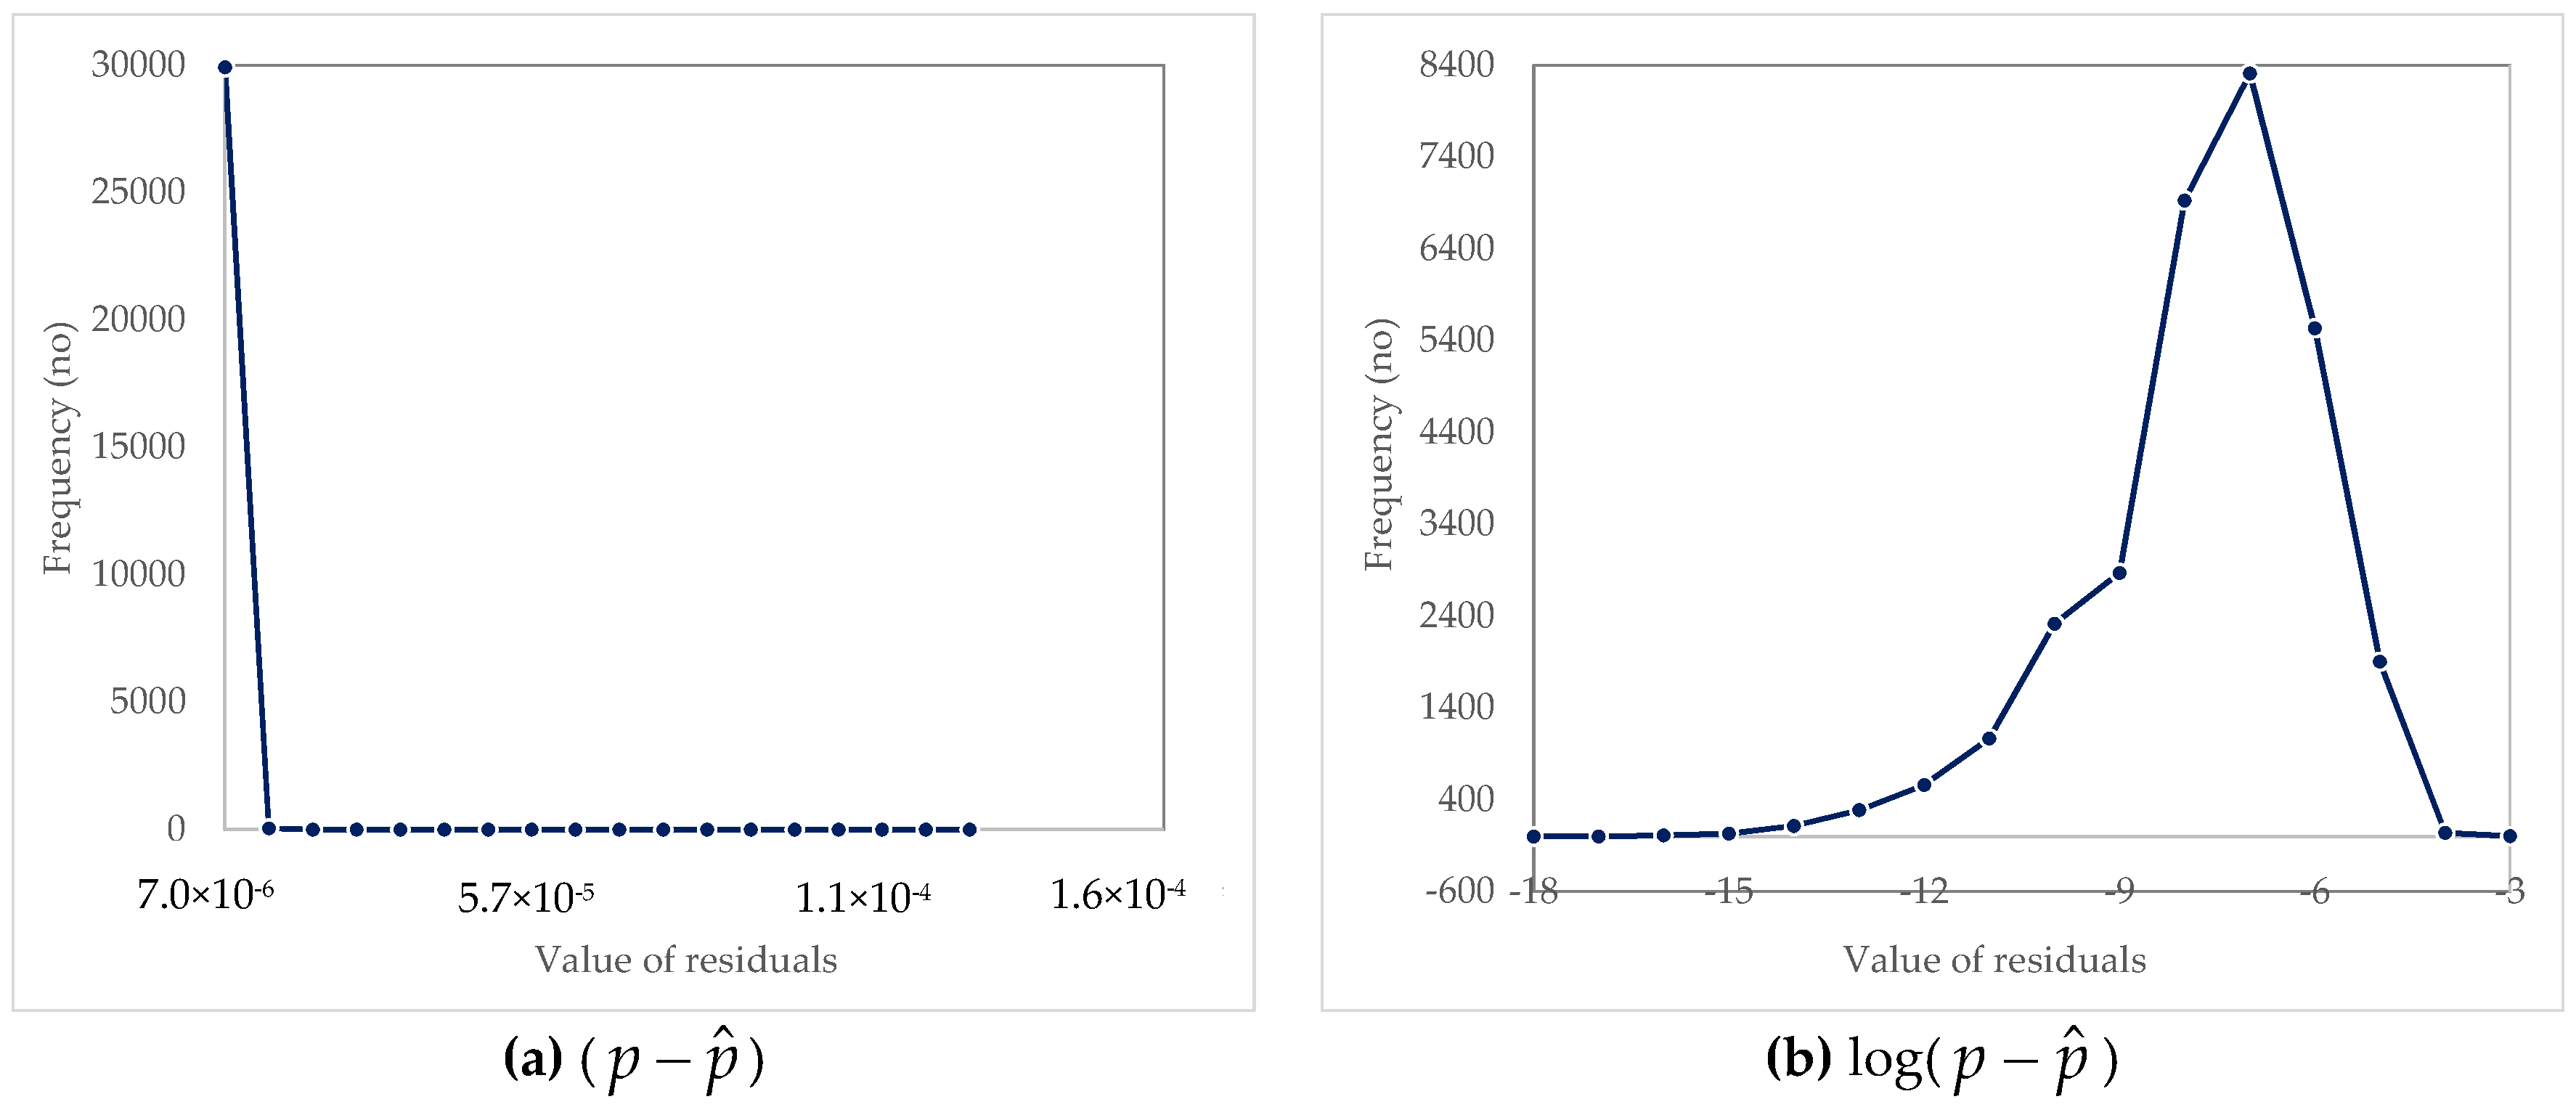
| Parameter | (p − ) | ln(p − ) | log(p − ) |
|---|---|---|---|
| Arithmetic mean | 3.04 × 10⁻⁷ | −18.8283 | −8.17703 |
| Standard deviation | 2.55 × 10⁻⁶ | 3.9477 | 1.7144 |
| Standard error | 1.47 × 10⁻⁸ | 0.02279 | 0.009898 |
| Median | 1.5 × 10⁻⁸ | −18.0132 | −7.82304 |
| Mode | 9.52 × 10⁻⁸ | −16.1677 | −7.02156 |
| Minimum | 1.32 × 10⁻¹⁸ | −41.167 | −17.8786 |
| Maximum | 0.000121 | −9.02296 | −3.9186 |
| Set ID | What the Data Represent? | Sample Size | Reference |
|---|---|---|---|
| 1 | Distance (m) on treadmill test, applied on subject ts with peripheral arterial disease | 24 | [54] |
| 2 | Waist/hip ratio, determined in obese insulin-resistant patients | 53 | [55] |
| 3 | Insulin-like growth factor 2 (pg/mL) on newborns | 60 | [56] |
| 4 | Chitotriosidase activity (nmol/mL/h) on patients with critical limb ischemia | 43 | [57] |
| 5 | Chitotriosidase activity (nmol/mL/h) on patients with critical limb ischemia and on controls | 86 | [57] |
| 6 | Total antioxidative capacity (Eq/L) on the control group | 10 | [58] |
| 7 | Total antioxidative capacity (Eq/L) on the group with induced migraine | 40 | [53] |
| 8 | Mini mental state examination score (points) elderly patients with cognitive dysfunction | 163 | [59] |
| 9 | Myoglobin difference (ng/mL) (postoperative–preoperative) in patients with total hip arthroplasty | 70 | [60] |
| 10 | The inverse of the molar concentration of carboquinone derivatives, expressed in logarithmic scale | 37 | [61] |
| 11 | Partition coefficient expressed in the logarithmic scale of flavonoids | 40 | [62] |
| 12 | Evolution of determination coefficient in the identification of optimal model for lipophilicity of polychlorinated biphenyls using a genetic algorithm | 30 | [63] |
| 13 | Follow-up days in the assessment of the clinical efficiency of a vaccine | 31 | [64] |
| 14 | Strain ratio elastography to cervical lymph nodes | 50 | [65] |
| 15 | Total strain energy (eV) of C42 fullerene isomers | 45 | [66] |
| 16 | Breslow index (mm) of melanoma lesions | 29 | [67] |
| 17 | Determination coefficient distribution in full factorial analysis on one-cage pentagonal face C40 congeners: dipole moment | 44 | [68] |
| 18 | The concentration of spermatozoids (millions/mL) in males with ankylosing spondylitis | 60 | [69] |
| 19 | The parameter of the Poisson distribution | 31 | [70] |
| 20 | Corolla diameter of Calendula officinalis L. for Bon-Bon Mix × Bon-Bon Orange | 28 | [71] |
| Set | EasyFit | Our Method | SPC for Excel | |||
|---|---|---|---|---|---|---|
| AD Statistic | Reject H0? | p-Value | Reject H0? | p-Value | Reject H0? | |
| 1 | 1.18 | No | 0.2730 | No | 0.0035 | Yes |
| 2 | 1.34 | No | 0.2198 | No | 0.0016 | Yes |
| 3 | 15.83 | Yes | 3.81 × 10⁻⁸ | Yes | 0.0000 | Yes |
| 4 | 1.59 | No | 0.1566 | No | 4.63 × 10⁻¹⁵ | Yes |
| 5 | 6.71 | Yes | 0.0005 | Yes | 1.44 × 10⁻¹⁶ | Yes |
| 6 | 0.18 | No | o.o.r. | 0.8857 | No | |
| 7 | 3.71 | Yes | 0.0122 | Yes | 1.93 × 10⁻⁹ | Yes |
| 8 | 11.70 | Yes | 2.49 × 10⁻⁶ | Yes | 3.45 × 10⁻²⁸ | Yes |
| 9 | 0.82 | No | 0.4658 | No | 0.0322 | Yes |
| 10 | 0.60 | No | 0.6583 | No | 0.1109 | No |
| 11 | 0.81 | No | 0.4752 | No | 0.0334 | Yes |
| 12 | 0.34 | No | o.o.r. | 0.4814 | No | |
| 13 | 4.64 | Yes | 0.0044 | Yes | 0.0000 | Yes |
| 14 | 1.90 | No | 0.1051 | No | 0.0001 | Yes |
| 15 | 0.39 | No | 0.9297 | No | 0.3732 | No |
| 16 | 0.67 | No | 0.5863 | No | 0.0666 | No |
| 17 | 5.33 | Yes | 0.0020 | Yes | 2.23 × 10⁻¹³ | Yes |
| 18 | 2.25 | No | 0.0677 | No | 9.18 × 10⁻⁶ | Yes |
| 19 | 1.30 | No | 0.2333 | No | 0.0019 | Yes |
| 20 | 0.58 | No | 0.6774 | No | 0.1170 | No |
© 2018 by the authors. Licensee MDPI, Basel, Switzerland. This article is an open access article distributed under the terms and conditions of the Creative Commons Attribution (CC BY) license (http://creativecommons.org/licenses/by/4.0/).
Share and Cite
Jäntschi, L.; Bolboacă, S.D. Computation of Probability Associated with Anderson–Darling Statistic. Mathematics 2018, 6, 88. https://doi.org/10.3390/math6060088
Jäntschi L, Bolboacă SD. Computation of Probability Associated with Anderson–Darling Statistic. Mathematics. 2018; 6(6):88. https://doi.org/10.3390/math6060088
Chicago/Turabian StyleJäntschi, Lorentz, and Sorana D. Bolboacă. 2018. "Computation of Probability Associated with Anderson–Darling Statistic" Mathematics 6, no. 6: 88. https://doi.org/10.3390/math6060088
APA StyleJäntschi, L., & Bolboacă, S. D. (2018). Computation of Probability Associated with Anderson–Darling Statistic. Mathematics, 6(6), 88. https://doi.org/10.3390/math6060088