Article

Product Channeling in an O2O Supply Chain Management as Power Transmission in Electric Power Distribution Systems

1
Department of Industrial & Management Engineering, Hanyang University, Ansan, Gyeonggi-do 155 88, Korea
2
Department of International Business, Cheju Halla University, Jeju-do 63092, Korea
*
Author to whom correspondence should be addressed.
Mathematics 2019, 7(1), 4; https://doi.org/10.3390/math7010004
Submission received: 14 November 2018 / Revised: 14 December 2018 / Accepted: 18 December 2018 / Published: 20 December 2018

Abstract

:
With the aim of delivering goods and services to customers, optimal delivery channel selection is a significant part of supply chain management. Several heuristics have been developed to solve the variants of distribution center allocation and vehicle routing problems. In reality, small-scale suppliers cannot afford research and development departments to optimize their distribution networks. In this context, this research work develops a model for an online to offline (O2O) supply chain management network of a small-scale household electric components manufacturer for delivering goods to its distribution centers and retailers. Retailers are acquired by the company through investment in the O2O channel of e-commerce. Electric power transmission and distribution is considered as representative of the product distribution network. A model is developed using a combination of the supply chain management technique and power transmission terminologies. The constrained linear programming model is solved through the linear programming tool of the LINGO optimization software and the global optimum results for the proposed quantity allocation problem are achieved. A numerical experiment is provided to illustrate the practical applicability of the model and the optimal results are analyzed for model robustness.

1. Introduction

Logistics management is a major contributor to reduce operational costs as well as enhance the competitiveness and service level of the industries where the facilitation and acceleration of efficient logistics management depends on the design of the distribution network (DN) [1]. Location allocation, routing, and inventory are the three major decisions in a distribution network design problem (DNDP). Facility location and customer allocation to facilities are constituents of the location allocation. Meanwhile, vehicle routing problems (VRPs) and inventory control problems are considered sub-areas of routing and inventory, respectively.
VRPs are extensively studied by researchers to support the planning of city logistics patterns [2]. Most of the industries are located outside metro cities, from where line-haul vehicles need to transport huge amounts of commodities to the cities. Large-sized vehicles are used to serve this purpose, which are generally forbidden to deliver the goods inside cities due to the risk of accidents. For this purpose, the transshipment of cargo between line-haul vehicles and inside city delivery vehicles is mandatory [3], creating the necessity of supply chain modeling for the distribution of products in cities. At the first level, cargo is transported to specific points in the outskirts of cities, and from there it is transported to the distribution centers at various places within those cities.
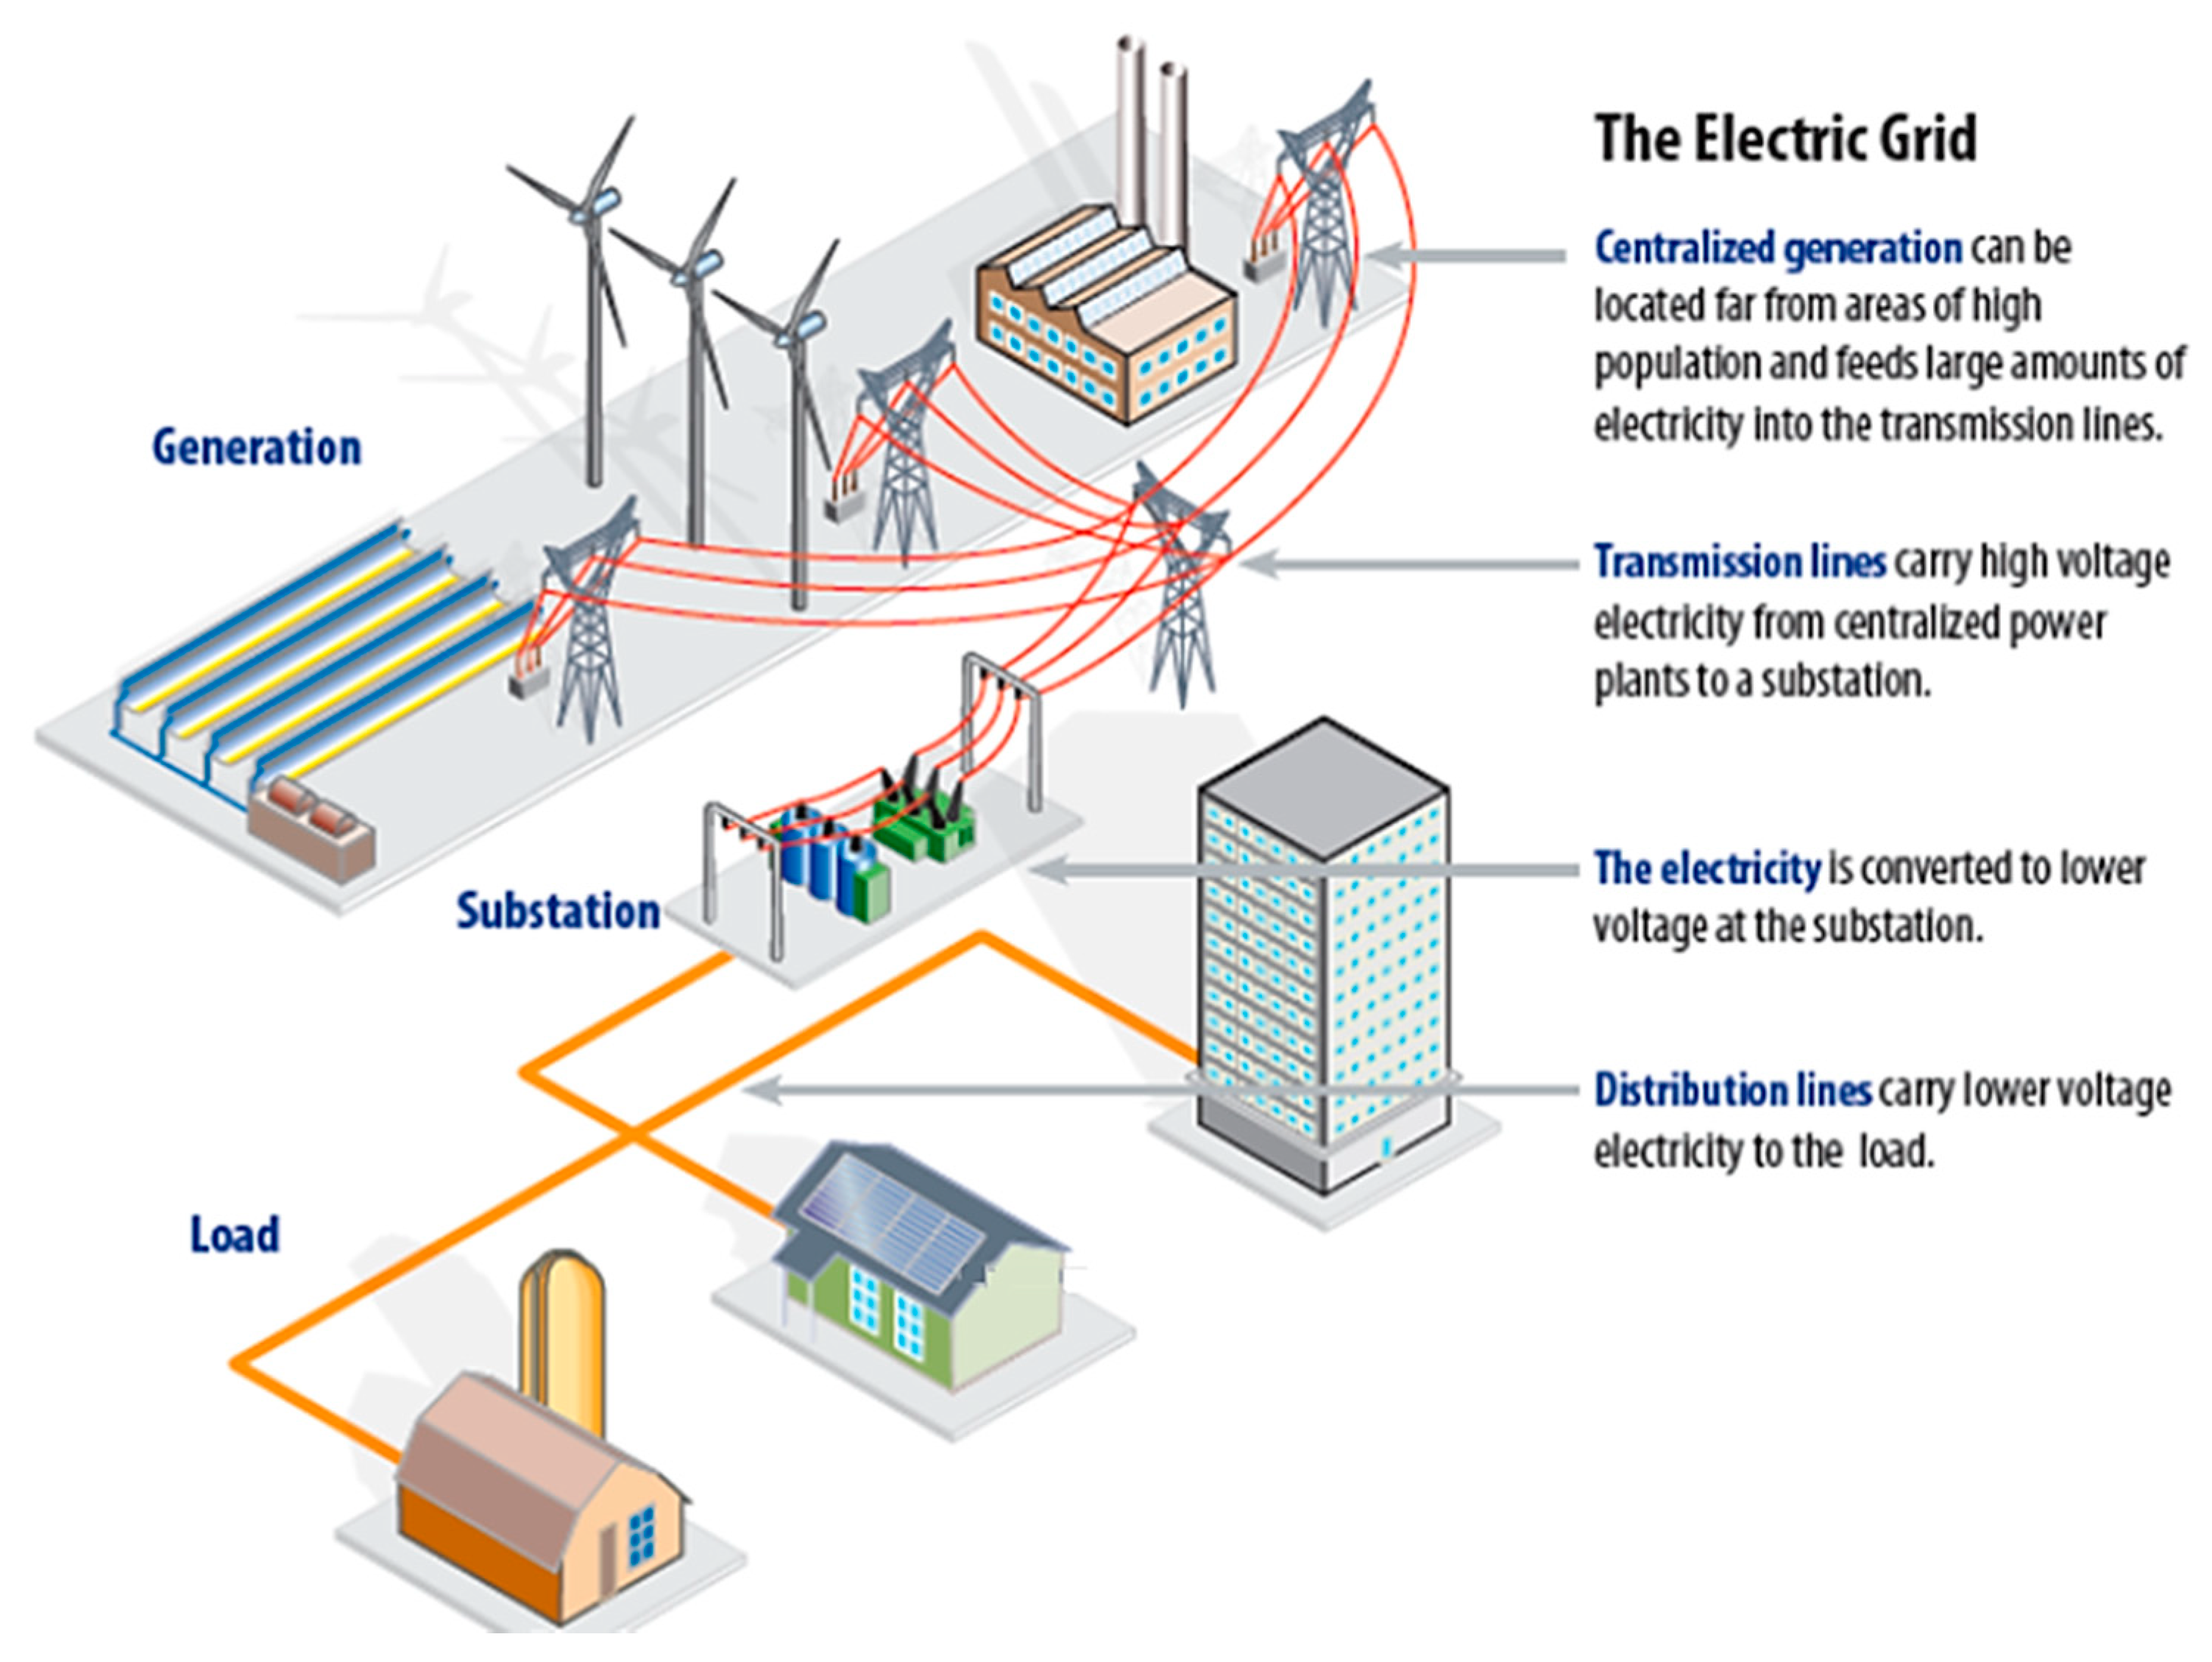
A similar concept is used for electric power transmission within cities. Electric power transmission and distribution systems are applied for the supply of electric power to end users. The transmission of the electricity from power generation sites to consumers is conducted through transmission lines, which traverse long distances [4]. Figure 1 shows the general transmission and distribution flow of electric power from power generation stations to consumer locations. High-voltage electric power cables transmit electric power to grid stations which are located at the outskirts of cities, and from there the stepped-down electric power is distributed to different zones of those cities.
This phenomenon can be thought of as a two-tier distribution network, as heavy transportation vehicles deliver goods to the depots located outside cities, and light vehicles subsequently carry the products to the distribution centers or retailers located in different areas of those cities. Several heuristics to solve the variants of vehicle routing and distribution center location problems are available in the supply chain literature, most of which bear limited generic application. In addition, every manufacturing or distribution organization cannot necessarily afford research and development centers to design optimal routes and supply chain cost minimization procedures. For instance, some manufacturers of small electrical components (household bulbs and tube-lights) may not be able to afford a research and development segment in their hierarchical structure.
The accelerated development and extended usage of the internet and e-commerce has drawn the attention of businesses towards the integration of online and offline sales channels. The integration of offline and online channels is often termed as a multichannel context [5]. Traditional enterprises can deliver diverse types of products and services by the incorporation of online sales channels in their businesses. The number of companies taking advantage of this opportunity is growing rapidly. This enables potential customers to browse the product catalogs, price information, availability of the product, and even order the products prior to visiting the physical stores. Therefore, online sales channels can positively improve the sales of physical (offline) stores. This effective mode of sales is titled as online to offline (O2O) commerce [6]. Recently, a case study conducted by Chang et al. [7] provided factual proof of the effectiveness of the integration of offline and online sales channels to increase the sales order.
Further, for the O2O sales channel, the customer acquisition cost is required to convince the potential consumer or customer to purchase a specific product; this cost is considered a primary business metric. It determines the worth of the end customer to the business and, through it, the return on investment from the customers can be obtained. This enables businesses to evaluate their investment decisions on a single customer in order to improve profitability [8]. Organizations make investments for online marketing as well as offline marketing of their products. Then, to compute the customer acquisition cost, each customer who buys the product or service is asked about the channel of information through which he came to know about that product. A handful of data is collected for a specific period, and customer acquisition cost for both types of channels is obtained as follows:
Customer   acquisition   cost   for   channel   A = Total   marketing   investment   in   channel   A Number   of   customers   acquired   through   channel   A .
Empirical evidence has proved that the customer acquisition cost plays a vital role for value creation in the business strategy. This cost has several components including online and offline marketing, subsidies, dealer commissions, administration costs, and bonuses. Most importantly, successful investment in the customer acquisition cost is directly associated with future corporate profits. It determines the customer retention, technology adoption, and improved market shares [9]. To incorporate an e-commerce strategy, this study considers a supply chain management model that acquires customers through the O2O channel and takes into account a certain customer acquisition cost for its O2O channel to enhance the future profitability of the system.
In this context, this paper develops a modified product distribution approach towards cost optimization through delivery network design for a small-scale electrical components manufacturer. The proposed model considers that the firm’s target O2O market is available retailers in specific cities, and their manufacturing facilities are located at a distance from those cities. The company owns a fleet of large transport vehicles (trucks) for delivering goods to its main distribution center located near the outskirts of the cities, from where company-owned small-sized transportation vehicles distribute the commodities to sub-distribution centers (retailers) located inside various zones of those cities. This paper provides a solution to this supply chain model by considering it as an electric power transmission and distribution network. Terminologies of the electric power distribution are used to model the situation in order to provide ease in its applicability by the management of companies that have limited knowledge of supply chain management (SCM) techniques.
The structure of the paper is as follows: Section 2 presents a brief review of the relevant literature. The mathematical model is developed in Section 3, and Section 4 provides a numerical illustration of the model. Finally, Section 5 highlights the important concluding remarks and further research directions for the proposed model.

2. Literature Review

All the activities included in the flow of commodities from vendors/suppliers to the end users are part of the supply chain management (SCM). Developing an efficient flow of products in a supply chain with acceptable service level and minimum costs requires optimization plans falling in the category of SCM [10]. Various quantitative methods to manage multi-echelon SCM have been reported in the literature since the seminal work by Clark and Scarf [11]. Sabri and Beamon [12] developed an SCM model by the combination of planning decisions and strategic design using an iterative solution procedure. Nozick and Turnquist [13] used a linear function to determine the safety stock and then combined it with a facility location problem. Sarrafha et al. [14] provided a network design for a multi-echelon supply chain by integrating procurement, production, and deliveries in their model.
Transshipments in SCM helps to reduce risks due to shortages and stock-out conditions. Much of the literature takes transshipment into consideration. Most researchers have focused on optimal control strategies of transshipments without capacity constraints. Common supplier multi-retailer supply chain models with transshipments between retailers were considered by Rudi et al. [15], Olsson [16], and Tang and Yen [17] with the consideration of infinite capacity of the central supplier. Axsäter et al. [18] developed a transshipment model for n retailers with stock out case, when the transshipments are made from the outside backup warehouse. Liao et al. [19] as well as Noham and Tzur [20] considered emergency orders and multiple items without capacity constraints, whereas Lee and Park [21] studied some incentives for each retailer to inflate the order in equilibrium in the presence of transshipments opportunity.
A major objective of VRPs found in the literature is the distance minimization, where the distance among each pair of retailers is kept constant in a classical VRP, and the total distance of the supply chain is calculated as the sum of all inter-customer distances on the route of a designated vehicle [22]. Crainic et al. [3] developed a VRP variant with time windows at the corresponding customers. Perboli et al. [23] presented three sets of two-echelon VRPs with four satellites and 50 customers. Their branch and cut algorithm can solve instances up to 21 customers to near-optimal solutions. Jepsen et al. [24] formulated a branch and cut procedure to solve VRPs with the constraint of a limited number of vehicles per satellite, and solved 47 out of 93 instances to their near-optimal solutions. Martínez-Salazar et al. [25] formulated a routing problem with the objective of minimizing customer waiting time. Breunig et al. [26] proposed a hybrid metaheuristic for two-echelon location routing and two-echelon vehicle routing problems.
Generally, distribution centers (DCs) function as inventory storage as well as transfer locations. Thus, the optimization of DC locations and their capacities under the influence of market demands is among the vital decisions of SCM [27]. Apte and Viswanathan [28] discussed some techniques to improve the overall efficiencies of logistics and distribution networks. Murali et al. [29] integrated the pre-positioning of the relief goods and facility location to determine the number of humanitarian aid centers needed, and their locations, after a disaster has occurred. Chaiwuttisak et al. [30] presented an integer programming model considering the allocation problem to improve the supply of blood products by reducing distribution centers and transportation cost.
The electric power system consists of a large-scale network of several electrical components to transmit and utilize electric power, where the optimal power flow (OPF) to obtain a steady-state operation point with minimum cost is the area of interest for researchers [31]. The classical method of OPF has the basics provided by power flow solutions in Newton’s method [32] and the interior point method [33]. Several studies in recent years have used non-conventional approaches to obtain the OPF. Bose et al. [34] solved the convex dual OPF problem through tree networks. Sivasubramani and Swarup [35] presented a differential evolution algorithm and sequential quadratic programming for efficient solutions of OPF. Divshali et al. [36] used a particle swarm optimization technique to solve OPF with dynamic security constraints in deregulated power systems.

3. Mathematical Model

The following assumptions are considered in the model formulation.

3.1. Assumptions

  • The model considers a supply chain management network to deliver a single type of product from the manufacturing facilities of a company to the acquired multi-retailers.
  • For a robust supply chain management, flow of goods between various nodes should be smooth. Accordingly, this research work considers that all the connections between the sending and receiving nodes remain active throughout.
  • Line losses are assumed to be negligible, which indicates that the non-deteriorating product type is considered to design the proposed supply chain management model.
  • Different types of delivery vehicles are required for product transportation between the involved parties. This paper considers that the delivery vehicles capacity is sufficient.
  • This paper considers multi-retailers as the ultimate product-receiving parties in the supply chain management model and their annual demand of product is assumed to be known and constant.

3.2. Model Formulation

Keeping in view the abovementioned assumptions, a mathematical model is developed in this section. Consider a household electric switches manufacturing group having various manufacturing plants in industrial zones outside a specific city. From these manufacturing facilities, the commodities are transported to the company-owned warehouses in the outskirts of the city. Commodities are then delivered to various retail stores within the city area through small trucks. The model considers the manufacturing capacity of each manufacturing facility as the power generation capacity, the distance between nodes as the length of electric power transmission wires, the shipment cost as the resistance per unit length of the power transmission lines, the product quantity transferred from one node to another as the amount of power to be transmitted in energy packets, the fixed resistance at each customer as the customer acquisition cost for the O2O channel, and the retail store demand as the load of a consumer zone. Figure 2 illustrates the flow of power transmission among different nodes.
The objective function of the proposed supply chain model is formulated as below.
M i n i m i z e j k R j k d j k w j k x k + k m R k m d k m w k m x k + k n Z k n ,
subject to:
k w j k W j ,   j
j w j k W k ,   k
m w k m W k ,   k
k w k m = W m ,   m
j w j k m w k m = 0 ,   k
x k { 0 , 1 } ,   k
w j k , w k m 0 .
The objective function in Equation (1) is a resistance minimization objective of the supply chain. First term of the objective function indicates the resistance faced by the power flow from power plants to grid stations (representative of the shipment cost from a supplier to distribution centers), the second term indicates the resistance faced by the power flow from grid stations to consumer zones (representative of the shipment cost from the distribution centers to the consumer zones), and the third term shows the fixed resistance at each individual customer (indicating the customer acquisition cost for the O2O channel). Constraint (2) verifies that the total supply from plants does not exceed their supply capacity, and constraint (3) confirms that the total supply from plants to grid stations does not exceed the distribution center’s capacity of grid stations. Similarly, constraints (4) and (5) are supply and demand constraints for the second part (grids to consumer zones) of the supply chain network. Constraint (6) is a transshipment constraint, and constraints (7) and (8) are binary and non-negativity constraints, respectively.

4. Numerical Experiment

An experimental study is performed to illustrate the practical applicability of the model with four power plants, three distribution centers, and five consumer zones with 50 consumers each. Resistance to the power flow from the power station to the grid stations and from the grid station to the consumer zones is considered as 0.05 ohm/MW/km. The fixed resistance at each customer is 1.5 ohm. Table 1 shows the demand of the consumer zones. Table 2 and Table 3 show the capacities of the power generation plants and grid stations, respectively. Table 4 shows the length of the transmission wires between the power generation plants and the grid stations, and Table 5 summarizes the length of the transmission wires between the grid stations and consumer zones.

4.1. Computational Results

The objective function of the proposed model is a mixed integer linear programming model (MILP) to minimize the resistance to the power flow of the power distribution system (shipment cost of the supply chain). The model was solved in LINGO 16.0 with computer specifications of 4 GB RAM and 2.30 GHz processor speed. The optimal results were achieved in 5.71 seconds, where the minimum resistance, i.e., the cost of the proposed supply chain network, was obtained as 56,044.71 ohm = $56,044.71. Figure 3 shows the optimal channel in the proposed supply chain. Table 6 and Table 7 show the optimal values of binary variables and Table 8 and Table 9 show the optimal quantity allocation to each selected channel of the supply chain.

4.2. Results Analysis and Discussion

Results of the numerical experiment verify that the proposed model successfully achieved a wise selection and quantity transmission channel in the supply chain. Figure 3 shows a diagrammatic view of the optimal selection and allocation for the experimental analysis of the model.

Supply Chain Demand Satisfaction

The robustness of the supply chain model lies in its accurate demand satisfaction. Figure 3 confirms that the optimal transmission possibility obtained through this research work precisely satisfied the demand of all the consumer zones. For instance, the total demand of consumer zone 4 was 450 MW, which was fulfilled by transmitting 150 MW from grid station 1 and 300 MW from grid station 3 (Figure 4). One can observe the same for all other consumer zones from the optimal transmission policy of the proposed model.

5. Concluding Remarks

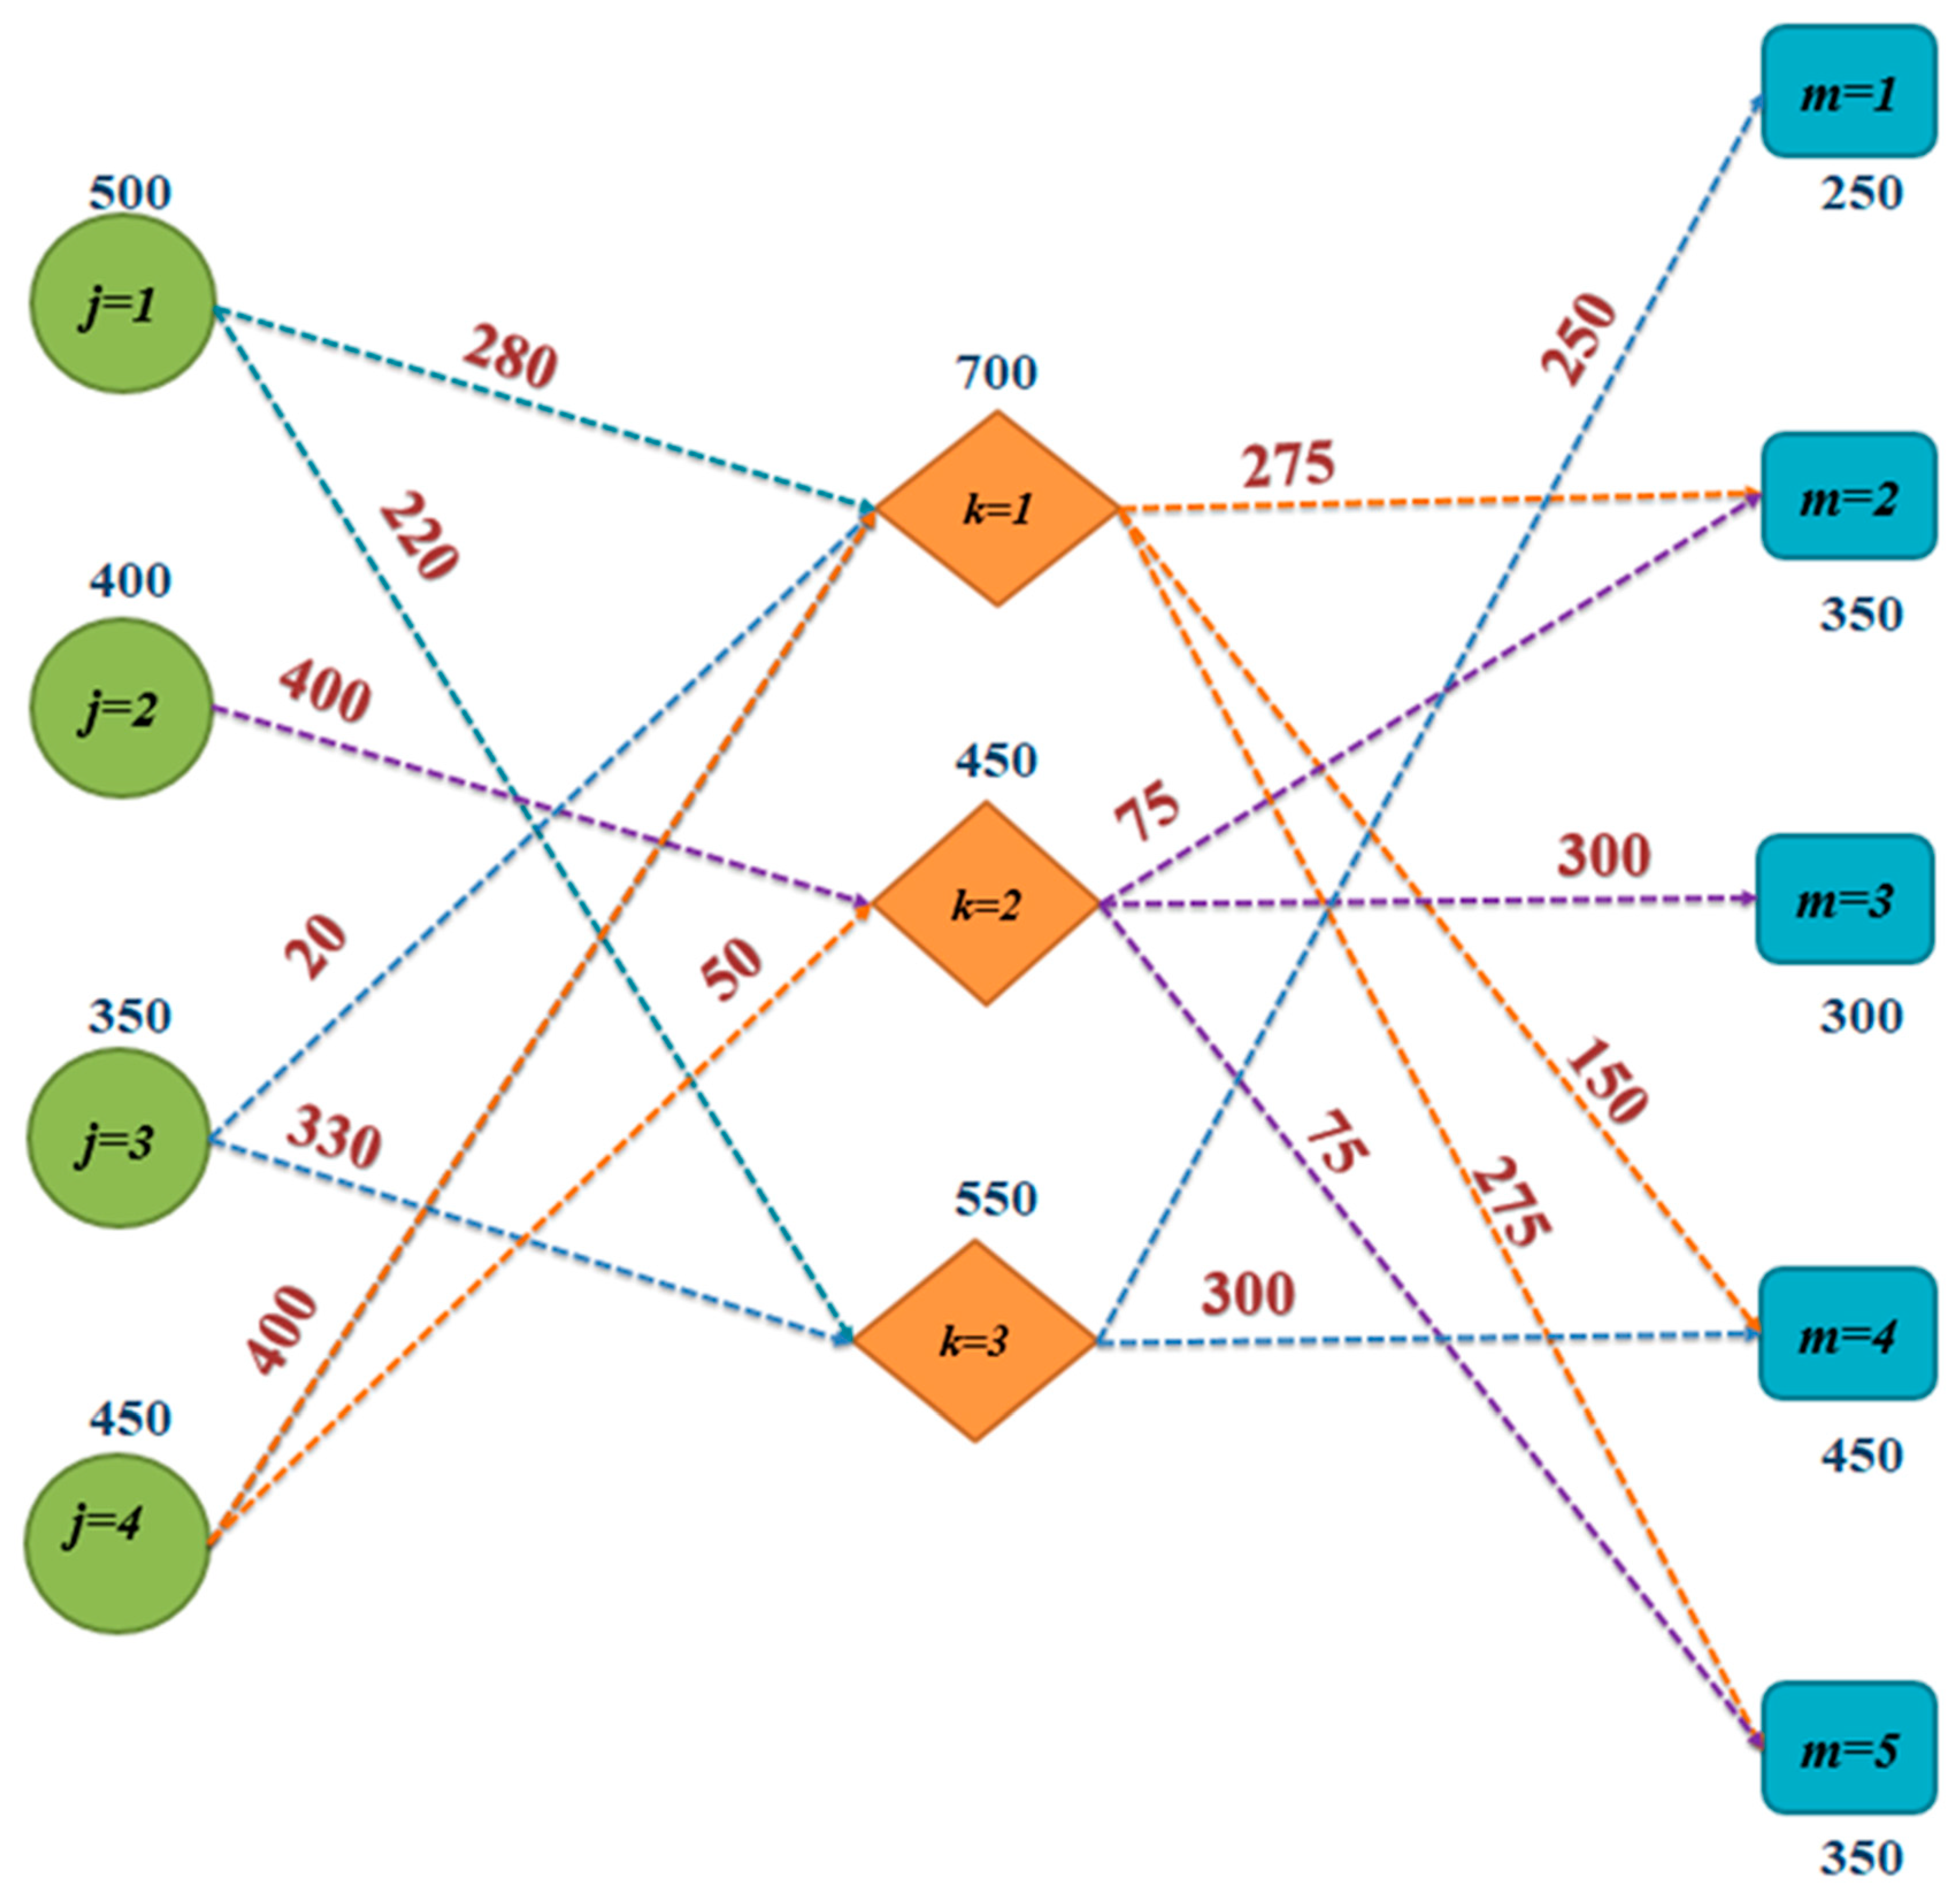
This research work developed a model for the O2O supply chain management of a household electric components manufacturer for delivering goods to its distribution centers and retailers. In the proposed model, electric power transshipment and distribution is considered as product distribution network and is solved using power transmission terminologies. A supply chain management model for a household electric switches manufacturing group having various manufacturing plants in industrial zones outside a specific city was proposed. From these manufacturing facilities, the commodities are shipped to company-owned warehouses in the outskirts of the city. Commodities are then delivered to various retail stores within the city area through small trucks. These multi-retailers are the clients of the product that are acquired by making investments in O2O e-commerce. The model considers the manufacturing capacity of each facility as the power generation capacity, the distance between nodes as the length of the electric power transmission wires, the product quantity transferred from one node to another as the amount of power transmitted, and the retail store demand as the load of a consumer zone.
A numerical experiment for the mixed integer linear programming model was carried out using LINGO optimization software. Analysis of the results verified that the model successfully satisfied the retailer demand of each consumer zone while also minimizing the total cost of the supply chain. The model can be extended to several different scenarios, including the consideration of shortages that are backordered [37,38,39,40], controllable production rate [41,42,43,44,45], optimal trade credit policies [46,47,48,49], quantity allocation problems [50,51], different defective rework options [46], and variable deterioration [47]. An immediate possible extension to this paper could be the incorporation of an uncertain defective rate [52,53] in the supply chain.

Author Contributions

Conceptualization, B.S. and M.T.; Methodology, B.S. and M.T.; Software, B.S. and M.T.; Validation, B.S.; Formal analysis, B.S. and M.T.; Investigation, B.S. and M.T.; Resources, B.S. and M.T.; Data curation, B.S. and M.T.; Writing—original draft preparation, B.S. and M.T.; Writing—review and editing, B.S. and S.-B.C.; Visualization, B.S. and M.T.; Supervision, S.-B.C.

Funding

This work was supported by the National Research Foundation Grant funded by the Korean Government. (NRF-2017S1A2A2036758).

Conflicts of Interest

The authors declare no conflict of interest.

Nomenclature

Indices
jpower generation facility ( j = 1 , 2 , 3 J )
kgrid station ( k = 1 , 2 , 3 K )
mpower consumer zone ( m = 1 , 2 , 3 M )
nnumber of customers in consumer zone k ( n = 1 , 2 , 3 N k )
Decision variables
w j k power transmission from power plant j to grid station k (MW)
w k m power transmission from grid station k to consumer zone m (MW)
x k selection parameter for grid station k (binary variable)
Parameters
R j k resistance to power flow between node j and node k (ohm)
R k m resistance to power flow between node k and node m (ohm)
d j k length of power transmission wire between node j and node k (km)
d k m length of power transmission wire between node k and node m (km)
Z k n fixed resistance to power flow at each customer (ohm)
W j power generation capacity of plant j (MW)
W k power transmittal capacity of grid station k (MW)
W m load requirement of consumer group m (MW)

Abbreviations

The abbreviations listed below are used for the development of this model.
O2OOnline to offline commerce
DNDistribution network
DNDPDistribution network design problem
VRPVehicle routing problem
SCMSupply chain management
DCDistribution center
OPFOptimal power flow

References

  1. Ghorbani, A.; Jokar, M.R.A. A hybrid imperialist competitive-simulated annealing algorithm for a multisource multi-product location-routing-inventory problem. Comput. Ind. Eng. 2016, 101, 116–127. [Google Scholar] [CrossRef]
  2. Van Duin, J.H.R.; Tavasszy, L.A.; Taniguchi, E. Real time simulation of auctioning and re-scheduling processes in hybrid freight markets. Transport. Res. B Meth. 2007, 41, 1050–1066. [Google Scholar] [CrossRef]
  3. Crainic, T.G.; Ricciardi, N.; Storchi, G. Models for evaluating and planning city logistics systems. Transp. Sci. 2009, 43, 432–454. [Google Scholar] [CrossRef]
  4. Rosa, G.; Costa, M.A. Robust functional analysis for fault detection in power transmission lines. Appl. Math. Model. 2016, 40, 9067–9978. [Google Scholar] [CrossRef]
  5. Yang, S.; Lu, Y.; Chau, P.Y. Why do consumers adopt online channel? An empirical investigation of two channel extension mechanisms. Decis. Support Syst. 2013, 54, 858–869. [Google Scholar] [CrossRef]
  6. Cassab, H.; MacLachlan, D.L. Interaction fluency: A customer performance measure of multichannel service. Int. J. Prod. Perform. Manag. 2006, 55, 555–568. [Google Scholar] [CrossRef]
  7. Chang, Y.W.; Hsu, P.Y.; Yang, Q.M. Integration of online and offline channels: A view of O2O commerce. Internet Res. 2018, in press. [Google Scholar] [CrossRef]
  8. Chen, P.S.; Hitt, L.M. Switching cost and brand loyalty in electronic markets: Evidence from on-line retail brokers. In Proceedings of the Twenty First International Conference on Information Systems, Brisbane, Australia, 10–13 December 2000; pp. 134–144. [Google Scholar]
  9. Livne, G.; Simpson, A.; Talmor, E. Do customer acquisition cost, retention and usage matter to firm performance and valuation? J. Bus. Financ. Account. 2011, 38, 334–363. [Google Scholar] [CrossRef]
  10. Simchi-Levi, D.; Kaminsky, P.; Simchi-Levi, E. Managing the Supply Chain: Definitive Guide; Tata McGraw-Hill Education: New York, NY, USA, 2004. [Google Scholar]
  11. Clark, A.J.; Scarf, H. Optimal policies for a multi-echelon inventory problem. Manag. Sci. 1960, 6, 475–490. [Google Scholar] [CrossRef]
  12. Sabri, E.H.; Beamon, B.M. A multi-objective approach to simultaneous strategic and operational planning in supply chain design. Omega 2000, 28, 581–598. [Google Scholar] [CrossRef] [Green Version]
  13. Nozick, L.K.; Turnquist, M.A. Inventory, transportation, service quality and the location of distribution centers. Eur. J. Oper. Res. 2001, 129, 362–371. [Google Scholar] [CrossRef]
  14. Sarrafha, K.; Rahmati, S.H.; Niaki, S.T.; Zaretalab, A. A bi-objective integrated procurement, production, and distribution problem of a multi-echelon supply chain network design: A. new tuned MOEA. Comput. Oper. Res. 2015, 54, 35–51. [Google Scholar] [CrossRef]
  15. Rudi, N.; Kapur, S.; Pyke, D.F. A two-location inventory model with transshipment and local decision making. Manag. Sci. 2001, 47, 1668–1680. [Google Scholar] [CrossRef]
  16. Olsson, F. Optimal policies for inventory systems with lateral transshipments. Int. J. Prod. Econ. 2009, 118, 175–184. [Google Scholar] [CrossRef]
  17. Tang, S.L.; Yan, H. Pre-distribution vs. post-distribution for cross-docking with transshipments. Omega 2010, 38, 192–202. [Google Scholar] [CrossRef]
  18. Axsäter, S.; Howard, C.; Marklund, J. A distribution inventory model with transshipments from a support warehouse. IIE Trans. 2013, 45, 309–322. [Google Scholar] [CrossRef]
  19. Liao, Y.; Shen, W.; Hu, X.; Yang, S. Optimal responses to stockouts: Lateral transshipment versus emergency order policies. Omega 2014, 49, 79–92. [Google Scholar] [CrossRef]
  20. Noham, R.; Tzur, M. The single and multi-item transshipment problem with fixed transshipment costs. Nav. Res. Log. 2014, 61, 637–664. [Google Scholar] [CrossRef]
  21. Lee, C.; Park, K.S. Inventory and transshipment decisions in the rationing game under capacity uncertainty. Omega 2016, 65, 82–97. [Google Scholar] [CrossRef]
  22. Cinar, D.; Gakis, K.; Pardalos, P.M. A 2-phase constructive algorithm for cumulative vehicle routing problems with limited duration. Expert. Syst. Appl. 2016, 56, 48–58. [Google Scholar] [CrossRef]
  23. Perboli, G.; Tadei, R.; Vigo, D. The two-echelon capacitated vehicle routing problem: Models and math-based heuristics. Transport. Sci. 2011, 45, 364–380. [Google Scholar] [CrossRef]
  24. Jepsen, M.; Spoorendonk, S.; Ropke, S. A branch-and-cut algorithm for the symmetric two-echelon capacitated vehicle routing problem. Transport. Sci. 2013, 47, 23–37. [Google Scholar] [CrossRef]
  25. Martínez-Salazar, I.; Angel-Bello, F.; Alvarez, A. A customer-centric routing problem with multiple trips of a single vehicle. J. Oper. Res. Soc. 2015, 66, 1312–1323. [Google Scholar] [CrossRef]
  26. Breunig, U.; Schmid, V.; Hartl, R.F.; Vidal, T. A large neighbourhood based heuristic for two-echelon routing problems. Comput. Oper. Res. 2016, 76, 208–225. [Google Scholar] [CrossRef] [Green Version]
  27. Zhuge, D.; Yu, S.; Zhen, L.; Wang, W. Multi-period distribution center location and scale decision in supply chain network. Comput. Ind. Eng. 2016, 101, 216–226. [Google Scholar] [CrossRef]
  28. Apte, U.M.; Viswanathan, S. Effective cross docking for improving distribution efficiencies. Int. J. Log. 2000, 3, 291–302. [Google Scholar] [CrossRef]
  29. Murali, P.; Ordóñez, F.; Dessouky, M.M. Facility location under demand uncertainty: Response to a large-scale bio-terror attack. Soc. Econ. Plan. Sci. 2012, 46, 78–87. [Google Scholar] [CrossRef]
  30. Chaiwuttisak, P.; Smith, H.; Wu, Y.; Potts, C.; Sakuldamrongpanich, T.; Pathomsiri, S. Location of low-cost blood collection and distribution centres in Thailand. Oper. Res. Health Care 2016, 9, 7–15. [Google Scholar] [CrossRef] [Green Version]
  31. Chen, M.J.; Hsu, Y.F.; Wu, Y.C. Modified penalty function method for optimal social welfare of electric power supply chain with transmission constraints. Int. J. Electr. Power 2014, 57, 90–96. [Google Scholar] [CrossRef]
  32. Tinney, W.F.; Hart, C.E. Power flow solution by Newton’s method. IEEE Trans. Power. Appl. Syst. 1967, PAS-86, 1449–1460. [Google Scholar] [CrossRef]
  33. Singh, B.; Mahanty, R.; Singh, S.P. Optimal rescheduling of generators for congestion management and benefit maximization in a decentralized bilateral multi-transactions power network. Int. J. Emerg. Electr. Power Syst. 2013, 14, 25–32. [Google Scholar] [CrossRef]
  34. Bose, S.; Gayme, D.F.; Low, S.; Chandy, K.M. Optimal power flow over tree networks. In Proceedings of the IEEE 49th Annual Allerton Conference on Communication, Control, and Computing (Allerton), Monticello, IL, USA, 28–30 September 2011; pp. 1342–1348. [Google Scholar]
  35. Sivasubramani, S.; Swarup, K.S. Sequential quadratic programming based differential evolution algorithm for optimal power flow problem. IET Gener. Transm. Dis. 2011, 5, 1149–1154. [Google Scholar] [CrossRef]
  36. Divshali, P.H.; Hosseinian, S.H.; Azadani, E.N.; Abedi, M. Application of bifurcation theory in dynamic security constrained optimal dispatch in deregulated power system. Elect. Eng. 2011, 93, 157. [Google Scholar] [CrossRef]
  37. Sarkar, B.; Moon, I. Improved quality, setup cost reduction, and variable backorder costs in an imperfect production process. Int. J. Prod. Econ. 2014, 155, 204–213. [Google Scholar] [CrossRef]
  38. Sarkar, B. A production-inventory model with probabilistic deterioration in two-echelon supply chain management. Appl. Math. Model. 2013, 37, 3138–3151. [Google Scholar] [CrossRef]
  39. Sarkar, B. An inventory model with reliability in an imperfect production process. Appl. Math. Comput. 2012, 218, 4881–4891. [Google Scholar] [CrossRef]
  40. Sarkar, B.; Sana, S.S.; Chaudhuri, K. Optimal reliability, production lotsize and safety stock: An economic manufacturing quantity model. Int. J. Manag. Sci. Eng. Manag. 2010, 5, 192–202. [Google Scholar] [CrossRef]
  41. Moon, I.; Shin, E.; Sarkar, B. Min–max distribution free continuous-review model with a service level constraint and variable lead time. Appl. Math. Comput. 2014, 229, 310–315. [Google Scholar] [CrossRef]
  42. Shin, D.; Guchhait, R.; Sarkar, B.; Mittal, M. Controllable lead time, service level constraint, and transportation discounts in a continuous review inventory model. RAIRO Oper. Res. 2016, 50, 921–934. [Google Scholar] [CrossRef]
  43. Sarkar, B.; Mahapatra, A.S. Periodic review fuzzy inventory model with variable lead time and fuzzy demand. Int. Trans. Oper. Res. 2017, 24, 1197–1227. [Google Scholar] [CrossRef]
  44. Sarkar, B.; Cárdenas-Barrón, L.E.; Sarkar, M.; Singgih, M.L. An economic production quantity model with random defective rate, rework process and backorders for a single stage production system. J. Manuf. Syst. 2014, 33, 423–435. [Google Scholar] [CrossRef]
  45. Sarkar, B.; Ahmed, W.; Kim, N. Joint effects of variable carbon emission cost and multi-delay-in-payments under single-setup-multiple-delivery policy in a global sustainable supply chain. J. Clean. Prod. 2018, 185, 421–445. [Google Scholar] [CrossRef]
  46. Sarkar, B.; Sana, S.S.; Chaudhuri, K. An inventory model with finite replenishment rate, trade credit policy and price-discount offer. J. Ind. Eng. 2013, 2013. [Google Scholar] [CrossRef]
  47. Sarkar, B.; Sarkar, S. An improved inventory model with partial backlogging, time varying deterioration and stock-dependent demand. Econ. Model. 2013, 30, 924–932. [Google Scholar] [CrossRef]
  48. Kang, C.W.; Ullah, M.; Sarkar, B.; Hussain, I.; Akhtar, R. Impact of random defective rate on lot size focusing work-in-process inventory in manufacturing system. Int. J. Prod. Res. 2017, 55, 1748–1766. [Google Scholar] [CrossRef]
  49. Ahmed, W.; Sarkar, B. Impact of carbon emissions in a sustainable supply chain management for a second generation biofuel. J. Clean. Prod. 2018, 186, 807–820. [Google Scholar] [CrossRef]
  50. Cárdenas-barrón, L.E.; Sarkar, B.; Treviño-garza, G. Easy and improved algorithms to joint determination of the replenishment lot size and number of shipments for an EPQ model with rework. Math. Comput. Appl. 2013, 18, 132–138. [Google Scholar] [CrossRef]
  51. Sarkar, B. An EOQ model with delay in payments and time varying deterioration rate. Math. Comput. Model. 2012, 55, 367–377. [Google Scholar] [CrossRef]
  52. Tayyab, M.; Sarkar, B. Optimal batch quantity in a cleaner multi-stage lean production system with random defective rate. J. Clean. Prod. 2016, 139, 922–934. [Google Scholar] [CrossRef]
  53. Kim, M.S.; Sarkar, B. Multi-stage cleaner production process with quality improvement and lead time dependent ordering cost. J. Clean. Prod. 2017, 144, 572–590. [Google Scholar] [CrossRef]
Figure 1. General flow of transmission and distribution network for electric power supply.
Mathematics 07 00004 g001
Figure 2. Flow of power transmission process.
Mathematics 07 00004 g002
Figure 3. Optimal transmission policy.
Mathematics 07 00004 g003
Figure 4. Demand satisfaction for consumer zone 4.
Mathematics 07 00004 g004
Table 1. Demand of consumer zones (MW).
Consumer ZoneDemand
1250
2350
3300
4450
5350
Table 2. Power generation capacity of power plants (MW).
Power PlantCapacity
1500
2400
3350
4450
Table 3. Capacity of grid stations (MW).
Grid StationCapacity
1700
2450
3550
Table 4. Length of power transmission lines between plants and grid stations (km).
Grid Station 1Grid Station 2Grid Station 3
Power plant 1160240180
Power plant 2148011201220
Power plant 31802360180
Power plant 4200220240
Table 5. Length of power transmission lines between grid stations and consumer zones (km).
Grid Station 1Grid Station 2Grid Station 3
Consumer zone 126036060
Consumer zone 2280380280
Consumer zone 3300200500
Consumer zone 4320420240
Consumer zone 5340440340
Table 6. Optimal values of binary variables for the first part of the supply chain.
Grid Station 1Grid Station 2Grid Station 3
Power plant 1101
Power plant 2010
Power plant 3101
Power plant 4110
Table 7. Optimal values of binary variables for the second part of the supply chain.
Grid Station 1Grid Station 2Grid Station 3
Consumer zone 1001
Consumer zone 2110
Consumer zone 3010
Consumer zone 4101
Consumer zone 5110
Table 8. Optimal transmission quantities from generation plants to grid stations (MW).
Grid Station 1Grid Station 2Grid Station 3
Power plant 12800220
Power plant 204000
Power plant 3200330
Power plant 4400500
Table 9. Optimal transmission quantities from grid stations to consumer zones (MW).
Grid Station 1Grid Station 2Grid Station 3
Consumer zone 100250
Consumer zone 2275750
Consumer zone 303000
Consumer zone 41500300
Consumer zone 5275750

