1. Introduction
The dynamic nature of the Saudi economy stems from the fluctuating oil prices and the balancing force of the huge foreign exchange reserves, with
$734,500 million [
1]. Despite the efforts of the Saudi Industrial Property Authority (MODON) to boost industrial production in the country, the oil sector remains the pivot sector in driving the Saudi economy ahead of others. Hence, it is essential that the country adopt bold steps to boost industries related to the oil sector and its spin-off sectors. Although the developments in the oil market are slow-paced currently, there are opportunities to come up with new plans. During an imbalance of supply and demand, any country with low-cost production will have an edge over other countries. In this regard, the petroleum sector of Saudi Arabia is likely to be the most benefited. The petroleum companies need to adopt a steady approach and focus on enhancing their productivity skills [
2].
In view of the recent developments reflected and the literature regarding the petroleum sector of the Kingdom of Saudi Arabia (KSA), it is paramount to monitor the performance of the companies within the sector and investigate ways to improve their performances. This is due to the role of the sector being played within the economy of the KSA, which is one of the foremost contributors to the economic growth of the nation. The motivation for this research was founded on these facts. Furthermore, as the KSA is all set for a big leap towards industrialization and globalization, the role of the petroleum sector companies in upholding the already established ranking of the Saudi share market is vital. One effective way of achieving this is the continuous monitoring and controlling of the financial performance of companies.
Realizing the importance of the role of energy efficiency and its measurement in the petroleum and petrochemical industries, many researchers have studied their efficiency problems with the aid of various approaches. However, compared to other sectors, it appears that the number of research attempts is much lower. In a comprehensive literature survey on DEA applications in various sectors [
3], the authors comment that only about 15 were found to be related to petroleum companies, out of 4015 research publications surveyed. Probably, this was due to the inaccessibility or unavailability of data on petrochemical industries.
Oliveira et al. [
4] applied DEA to study the vulnerability of oil market variations in Venezuela, Brazil, Ecuador, Argentina, Colombia, and Peru, based on 2005 data from the British Petroleum (BP) Statistical Review of World Energy. The efficiency is computed based on usage and dependency of the resources using inputs and outputs (I/Os) variables such as production, consumption, and proved reserves of oil and natural gas. Ranjbar et al. [
5] applied window analysis, a dynamic method in DEA, to measure the relative performance of petrochemical industries listed active during the 2003–2010 period at the Tehran Stock Exchange. They used the financial ratios such as current assets, fixed assets, and cost of goods sold as input and return on assets, return on investment, sale, and profit-to-sales ratio as output variables.
Alsahlawi [
6], studied the energy efficiency status of six GCC countries using DEA to set the appropriate policies without adverse effects on their economic development strategies. They claim that it is the first attempt in this direction. They used economic-thermodynamic indicators like energy GDP ratio to compare the level of relative efficiency of each GCC country. Another notable research attempt in this area is by Shaverdia et al. [
7] on the Iranian petrochemical industries. Jandaghi and Ramshini [
8] applied fuzzy AHP (FAHP) and DEA to rank and separate efficient from non-efficient petrochemical companies in Iran. Recently, a few prominent studies have been conducted on the efficiency of the Chinese power industry, as indicated in [
9,
10,
11].
The main aim of the research reported in this paper is to analyze the financial performance of petrochemical industries in Saudi Arabia to set reference points that would help companies to benchmark their performance. The research includes studying the performances of functioning petrochemical companies via the Saudi share market, where the relevant financial data are collected, including the key economic performance indicators (KPIs) related to petrochemical sector companies for the last five years. The data are studied using variants of data envelopment analysis (DEA) to determine the relative performance efficiencies of the companies, and multidimensional scaling (MDS) is applied to find the relative positions of these companies and enhance the confidence in the results from DEA. This leads to measuring the relative performance of the petroleum companies for the last five years using windows analysis to help readjustment by each company.
The use of DEA in this work is due to its solid and strong mathematical basis, being one of strongest quantitative technique in performance measurement of companies. The use of qualitative approaches such as analytical hierarchy processes are usually due to the lack of relevant numerical data and the complexities emerging from existing data. It is also crucial to select the best-fitting DEA model in order to get high accuracy and soundness in the measurements and the concluded knowledge. Multidimensional scaling (MDS) is another useful distance-based approach that helps draw a baseline of the performances for validation and verification purposes. It also helps visualize the outputs of DEA, making it more comprehensive.
The rest of this paper is organized as follows.
Section 2 introduces data envelopment analysis and the models used in this study, alongside an introduction of MDS, while
Section 3 explains data analysis using DEA and MDS to reveal the performances.
Section 4 provides relevant discussions and recommendations as a result of the study, while
Section 5 includes the conclusions.
2. Data Envelopment Analysis (DEA)
The basic technique behind data envelopment analysis was originally conceived by Farrell [
12] in his pioneering work on the measurement of the productive efficiency of industries. A basic feature of his method was the distinction between price and technical efficiency. Price measures a firm’s success in choosing an optimal set of inputs, while technical efficiency is its success in producing maximum outputs for a given set of inputs, where the performance (the output–input ratio) of a perfectly efficient firm is expected to be 100%. If the input per unit of output is large, the efficiency is indefinitely small. An increase in the input per unit of output of one factor will indicate a lower technical efficiency.
The performance evaluation technique used in [
12] comes under the genre of fractional linear programming methods. A DEA model identifies the most efficient decision-making unit (DMU), assigning a score of unity to it, and attributes a measure of inefficiency relative to it for all others. The less efficient organizations are assigned scores between 0 and 1. Thus, DEA does not measure optimal efficiency. Instead, it differentiates the least efficient organization from among the set of all companies. DEA has gained more acceptability in recent years for the evaluation and measurement of the relative efficiency of any type of system with an input and output, including organizations, educational institutions, industrial organizations, etc., provided quality data is available. The theoretical understanding of DEA requires a working knowledge of economics and mathematical programming, and the results are objective, unlike traditional partial productivity measures. Later DEA, as it is known now, was introduced by Charnes et al. [
13] based on Farrell’s pioneering work [
14]. They generalized the single-output-to-single-input ratio definition of efficiency to multiple inputs and outputs. The original DEA model called Charnes, Cooper, and Rhodes (CCR model) suggested that the efficiency of a DMU can be obtained as the maximum of a ratio of weighted outputs to weighted inputs, subject to the condition that the same ratio for all DMUs must be less than or equal to 1. The DEA model must be run
n times, once for each unit, to get the relative efficiency of all DMUs. As indicated in [
15], the efficiency scores provided by DEA correspond to the economic concept of technical efficiency (TE) instead of the conventional partial efficiency (PE) of the output-to-input ratio.
The framework of DEA is adapted from multi-input, multi-output production functions and applied in industries. The method differs from the statistical least squares technique, which bases comparisons relative to an average producer. DEA identifies a “frontier” on which the relative performance of all utilities in the sample can be compared. Bafail et al. [
16] comment that DEA identifies efficient and inefficient units where results are considered in contexts unique to the set of DMUs considered. Furthermore, DEA facilitates the comparison of each unit with the most efficient among them. Many researchers such as Thanassoulis [
17] consider DEA more appropriate and result-oriented for measuring the efficiency of organizations than multivariate analysis techniques.
When used in a benchmarking environment, the efficient DMUs may not necessarily form a “production frontier”, but rather lead to a “best-practice frontier” [
18]. According to [
19], DEA is a “balanced benchmarking” method. Ranking, scaling, AHP, MDS, TOPSIS, etc. can be used either independently or in conjunction with each other for performance evaluation and benchmarking. The authors of [
20] suggested the application of a DEA model for ranking companies at the initial stage, followed by AHP, while Jandaghi and Ramshini [
8] applied fuzzy AHP and CCR methods to measure the performance of Iranian petroleum industries. Similarly, Mohaghar et al. [
21] used a special version of DEA in comparison to the fuzzy VICAR method for a supplier selection problem, while authors of [
22] have used a fuzzy version of DEA in comparison with fuzzy AHP for a facility layout design problem.
2.1. DEA Models
In the DEA model initially developed by Charnes et al. [
13], a score of 1 is assigned to a decision-making unit (DMU) only when comparisons with other relevant DMUs do not provide evidence of inefficiency for the same sets of inputs and outputs. DEA assigns an efficiency score less than 1 to (relatively) inefficient units. A score less than 1 means a linear combination of other DMUs. The score reflects the radial distance from the estimated production frontier to the DMU under consideration. There are a number of equivalent formulations for DEA. The most direct formulation of the exposition given above is as follows: Let
be the vector of inputs into
. Let
be the corresponding vector of outputs. Let
be the inputs and
be the outputs. The best combination of
s determines
. This problem can be written as the measure of efficiency for
given by the following fractional program:
subject to:
where
is the weight given to
in its efforts to determine
, and
is the efficiency of
. In general, it should include
on the left-hand side of the equations. Then, the optimal
cannot possibly be more than 1. When someone solves this linear program, the efficiency (
) of
, meaning that the unit is efficient.
The efficiency of a DMU is simply the relationship of the outputs to inputs and is constrained to be less than 1. The goal is to find a set of prices and values that puts the target DMU in the best possible light. So the simple LP maximization model is
subject to:
Here, and are vectors of prices and values, respectively, which have nothing to do with real prices and values: they are artificial constructs.
2.2. Methodological Extension of DEA
Originally, Charnes et al. [
13] developed the DEA technique for evaluating the relative efficiency of production systems of a similar nature. The basic DEA models discuss the way the returns-to-scale, the geometry of the envelopment surface, and the efficient projections are identified. Flexibility is the main advantage of this generic model. If new variables and weights are added, DEA can be refined to reflect managerial or organization factors, sharpen efficiency estimates, and/or overcome inconsistencies. Many researchers, including the authors of [
23], through empirical analyses found new applications for DEA in banking, industry, and higher education systems, as well as facility layouts, etc. The main problem was that when the number of inputs and outputs was large, the DEA analysis yielded a large number of most efficient DMUs. Moreover, there were a large number of DMUs attached with 0 weights. In view of the limitations of the original model, investigators attempted to develop more versatile models to suit constant returns and variable returns, namely constant return to scale (CRS) and variable returns to scale (VRS) models. In addition, Talluri [
24] discusses some methodological extensions of the original DEA model by [
13]. For more literature, see [
25,
26]. Alternative DEA models such as the multiplicative [
27] and the additive [
28] models of Charnes et al. [
13] were developed later to suit different applications. Banker et al. [
29] developed the Banker, Charnes, Cooper (BCC) model to estimate the pure technical efficiency of DMUs with reference to the efficient frontier. It also identifies whether a DMU is operating in increasing, decreasing, or constant returns to scale. Charnes, Cooper, and Rhodes (CCR) models are a specific type of BCC model. Bafail et al. [
30] used BCC models to evaluate the relative efficiency of Saudi banks. Their analyses were supported by results obtained from cluster analysis on the data sets.
The choice of a particular DEA model is dependent upon the objective of the study and the expected results. The goal of DEA arises from situations where the productive efficiency of a system or DMU is of importance. DEA measures how well the DMUs convert inputs into outputs, while multiple criteria decision making (MCDM) models have arisen from problems of ranking when there are alternatives that have conflicting criteria. A methodological connection between MCDM is to define maximizing criteria (benefits) as outputs and minimizing criteria (costs) as inputs. A very useful literature survey is provided in [
25,
26] on the use of selected DEA models for various problem domains. Many other approaches combining DEA with AHP, maximum efficiency ratio models, and a multi-objective linear program are found in literature [
8].
2.3. Tie-Breaking Models for Super Efficiency
A major limitation of the basic models is that when the number of inputs and outputs is large, the DEA analysis yields a large number of most efficient or 100% efficient DMUs. The CCR super-efficiency DEA model, the so-called AP model, was first developed under constant returns to scale (CRS) by Andersen and Petersen [
31]. The problem with the AP model was unfeasibility and instability when some inputs are close to 0. The authors of [
32] discuss super-efficiency models, which were first introduced as a “tie-breaking procedure” for ranking units rated as 100% efficient in conventional DEA models. When a DMU being evaluated is excluded from the reference set of DEA, the resulting DEA model is called a super-efficiency DEA model. It is concluded by [
33] that the super-efficiency scores of DMUs enables us to distinguish between the efficient observations. On the other hand, another approach for ranking inefficient DMUs is proposed in [
34] to overcome the issues caused by unfeasibility, as a modification of the earlier super-efficiency models. In addition, Ebadi [
35] proposes variable returns to scale (VRS) super-efficiency models using input–output orientation, while Salhieh and Al-Harris [
36] recommend a super-efficiency model for further discrimination between product concepts. The super-efficiency metric can be calculated for the efficient concepts based on the following model:
subject to
A professional software package that makes use of these super-efficiency models to estimate super-efficiencies under various optimization modes is used for support in this work. Technical/ standard efficiencies were also computed using the same software.
2.4. Multidimensional Scaling (MDS)
DEA is commonly used to evaluate the performance efficiency of firms. It is worth mentioning here that MDS finds wide applications in marketing research for market positioning. Recent studies have presented hybrid methods involving DEA in combination with multivariate analysis techniques such as principal component analysis (PCA), multidimensional scaling (MDS), discriminant analysis, multiple regression, and cluster analysis to solve such problems. It has been proven by researchers that such an integrated approach for performance evaluation leads to an enhancement of confidence in the DEA.
Furthermore, based on this the DEA results can be used to illustrate the similarities and differences between various models and firms. The use of MDS is reported in [
37] to interpret DEA results obtained as efficiency scores. The measure of dissimilarities between two companies is considered as Euclidean distances based on 35 variables. The authors of [
38] applied DEA to study healthcare management in 23 Taiwanese cities and counties. They suggested two-dimensional scatter plots from MDS analysis as a reference plane for planning and adjusting improvements. Cho and Park [
39] applied a hybrid approach of DEA-PCA to measure the efficiency of mobile content firms to analyze the efficiency and the relative performance of firms. PCA and discriminant analysis (DA) have been used to validate the relationship between the DEA models and mobile content types. The results have been visulized with MDS and analyzed with respect to the data structures. Sagarra et al. [
40] have analyzed 55 universities-based data on 33 variables for a seven-year period from 2007 to 2012. Scatter plots for efficiency–teaching–research against subject mix were analyzed. They applied cluster analysis with the aid of a dendrogram to handle the six-dimensional projection on to a two dimensional plane.
In this study, we use the multidimensional scaling approach (MDS) simultaneously with DEA to counter-check the DEA analysis results. From a non-technical point of view, MDS provides a visual representation of proximities in the form of similarities or dissimilarities (distances) among objects of the same type. The method implies working out a matrix of perceived similarities between 10 petrochemical industries, given in the form of financial performance data or KPIs. The variable values represent similarities or distances. Thus, the data to be analyzed is a collection of 10 variables based on which a distance function is defined,
, as the distance between the
and
companies. These distances are the entries of the dissimilarity matrix as given here:
where the main aim is, given
, to find
I vectors
such that
for
, where
is a vector norm or Euclidean distance. In MDS, this norm is normally the Euclidean distance, but in a broader sense, it may also be a metric or arbitrary distance function.
3. Data Analysis
DEA being a data-oriented, non-parametric method, to evaluate relative efficiency based on pre-selected inputs and outputs, it is important that the most appropriate inputs and outputs (I/Os) are chosen for the models. The researchers indicate that the effectiveness of using parametric methods in measuring and comparing the efficiencies of macroeconomic systems, such as stock markets, is debatable because they may not yield comprehensive results. In fact, it is extremely difficult to measure the performance of the petrochemical sector in simple terms such as capital structure, volume of business or investments, total assets or share equities, etc. Furthermore, using multivariate analysis techniques to analyze, classify, or rank different entities based on multiple criteria without consideration for the variability and randomness of influencing factors may result in erratic conclusions. Therefore, DEA is a very useful set of techniques where multiple inputs and outputs are considered to measure the relative performance of organizational units. The efficiency of an organization is computed using DEA by transforming the inputs into the outputs in relation to the several influential I/O factors.
3.1. Data Preparation and Selecting I/O Variables
Data preparation is a crucial stage of experimental and empirical studies, where the data is scanned and pre-assessed for proper use. While collecting data, many times a large number of possible combinations of variables might be accessible. Morita and Avkiran [
41] proposed an I/O selection method that uses diagonal layout experiments, which is a statistical approach to find an optimal combination. To assess data from the NIKKEI 500 index, they demonstrate their model using a few discriminating techniques such as ANOVA.
Ten petrochemical companies in the Kingdom of Saudi Arabia were considered for analysis in this proof-of-concept study. The primary reason to select these companies is that they are the only petrochemical companies listed in the Saudi Stock Exchange Market and are found to be the most prominent and leading companies in the sector. Data on the performance measures were collected from Saudi Stock Exchange sources. Obviously, the data needs to be pre-processed in order to suit the DEA input format before performing the DEA. Many generic and sector-specific issues related to data preparation for DEA are summarized by Dyson et al. [
42]. The first concern is about the number of DMUs’ inputs and outputs. It is believed that the selection of I/O variables for analysis using DEA remains as one of the most challenging issues. The choice of I/O variables depends on how well each can contribute to reveal the discrimination between efficient and inefficient units. There is a clear trade-off at this stage. If a large number of DMUs is chosen, there is a greater probability of capturing high performance units that would improve the discriminatory power. In contrast, a large data set may decrease the homogeneity of the data, where larger data sets demand more computational effort. Many researchers, including the authors of [
42,
43,
44], have given thumb rules to estimate the number of inputs and outputs and the number of DMUs. According to these recommendations, the number of DMUs to be chosen vary from 10 to 24. In this work, the number of DMUs is decided to be 10 due to technical constraints and difficulties in data access.
The discriminatory power of the analysis can be enhanced by reducing the number of input and output factors. If there are inputs or outputs that correlate highly with one another, the discriminatory power of the model will be lost [
31]. Furthermore, many potential errors in data sets prepared after data collection may lead to erratic results. The effects of frequently noticed insufficiencies like imbalances in data sets, presence of negative data values or absence of the positivity requirement of DEA, data scaling or translation errors, missing data, etc. were eliminated or reduced by normalizing the entire data sets. A number of normalization methods in this regard are proposed and discussed by [
44,
45,
46,
47,
48,
49], which propose a fuzzy mathematical approach.
In this work, we used data on key financial performance measures collected from 10 top Saudi petrochemical companies within the time period of 2010 to 2015, and a snapshot of 2013 data is presented in
Table 1. Out of 15 measures collected, 5 input variables and 5 output variables were selected for the purpose of analysis. These were decided upon following the correlation analysis performed to eliminate replication of highly correlated I/O variables.
3.2. Super-Efficiency Model (SEM)
The weakness of the basic DEA model is its inability to discriminate highly efficient DMUs. The efficiency plot displays many 100% DMUs crowded at the DEA frontier, rendering the task of ranking difficult. So it was decided to apply super-efficiency models using the slack-based measures (SBM). While computing super-efficiency, the LP solution is relaxed so that the observed DMU is not used as its own peer, which results in efficiency scores greater than 100%.
and
are dropped from the left-hand side of the input and output inequalities correspondingly, to eliminate the peer effect of DMU1. Hence, the analyst is now able to compare efficient firms with efficiency scores of 100% (
) that operate at the frontier. The changes in the low efficiency scores are observed to be less [
51].
Data analysis was done with the support of Frontier Analyst (Ver. 4.0, Banxia Software Ltd., Kandel, UK) software. Alternative formulations were also used with the help of the “advanced” tab of the analysis options in the software. Standard formulation, so-called BCC/CCR technical efficiency, and super-efficiency formulations were used in this work, with one optimization mode (minimize input) and two scaling modes (constant returns and variable returns). The software Frontier Analyst also offers additive formulations, allocative (cost-based) formulations, and Malmquist formulations. Each mode allows certain options. With the help of super-efficiency analysis, efficiency improvements for efficient units can be estimated, where interpretation of the results turns out to be more complicated when super-efficiency is enabled.
4. Results and Discussions
A large number of DMUs is effective in improving the discriminatory power of the DEA model. However, we have decided to consider 10 DMUs in this study due to technical constraints and the practical difficulties in data collection and compilation. Similarly, the number of variables used was limited to 10. As argued in [
43]), large data sets are likely to reduce the homogeneity of the data. Therefore, following the thumb rules suggested by researchers presented in the previous section, 5 different evaluation models were decided using different input/output combinations out of 5 input and 5 output variables. Since the variables considered/selected are all financial performance measures, the analysis is expected to provide the efficiency scores for the financial performance of the companies. As there were 10 financial measures of petrochemical companies from Saudi Arabia, model variations could be achieved by changing the I/O combinations. Standard efficiency (BCC/CCR technical efficiency) and super-efficiencies for the 10 petrochemical industries were obtained using the DEA approach with the software support, and results are tabulated in
Table 2. The technical efficiency has been calculated through the BCC/CCR model introduced above, where the scores fit in the scale of
, while the super-efficiency scores overflow this scale and hence, are normalized as
of calculated scores.
Model 1 uses all of the 5 input and 5 output variables, where it is observed that 9 out of the 10 petrochemical companies have scored technical efficiency levels of 100% at the DEA frontier, which does not help to discriminate the performances. On the other hand, the super-efficiency computation managed to significantly separate them from one another, noting that the scores in % overflow the scale of 0–100 due to the calculations provided through the super-efficiency models used. However, the results in
Table 2 are normalized to fit them in the scale of 0–100%. The Saudi Arabian Fertilizer Company (SAFCO) (Jubail, Saudi Arabia) and Saudi Arabian Basic Industries (SABIC) (Riyadh, Saudi Arabia) achieved 100.0% technical efficiency and super-efficiency with normalized scores. The Yanbu National Petrochemical Company (YANSAB) (Yanbu, Saudi Arabia) and the Sahara Petrochemical Company (SPCO) (Jubail, Saudi Arabia) come next with super-efficiency scores of 73.52% and 50.08%, respectively, followed by PETROCHEM (Jubail, Saudi Arabia) with score of 22.03% and the Saudi International Petrochemical Company (SIPCHEM) (Jubail, Saudi Arabia) with score of 21.82%. The remaining 4 companies performed more or less the same. The Saudi Industrial Investment Group (SIIG) (Riyadh, Saudi Arabia) achieved technical efficiency of 85% and super-efficiencies of 8.5% only. DMUs away from the DEA frontier are expected to show low super-efficiency scores, as clearly indicated in [
51]. In
Model 1, all input variables, including depreciation, were considered to be controlled. When it was considered as an uncontrolled input variable, the performance efficiency scores of YANSAB and SPCO also rose to 100.00%. Thus, it is very clear that under controlled input scenarios, the discrimination of DMUs becomes vague, as a large number of DMUs tends to cluster around the nearest ones.
Models 2, 3, 4, and
5 were constructed by changing the input/output combinations. In all of the model combinations, SAFCO was found to exhibit the highest super-efficiency scores, ranging from 23.74% to 100.00%. The technical and super-efficiency scores of SABIC in
Model 4 were found to be 47.10% and 4.71% only, respectively. In
Models 2 and
5, the performance of SABIC and YANSAB were found to be very close. In
Model 5, SABIC achieved an efficiency of 100.00%. and YANSAB performed at 20.89%, compared to 73.52% in
Model 1. The performance of The Rabigh Refining and Petrochemical Company (PETRORABIGH) (Rabigh, Saudi Arabia) and SIIG remain very low in all the models, and the National Industrialization Company (NIC) (Riyadh, Saudi Arabia) was found to be slightly above them. Meanwhile, the performance of SIPCHEM, PETROCHEM, and the Saudi Kayan Petrochemical Company (KAYAN) (Jubail, Saudi Arabia) were found to be very close together in all models, though SIPCHEM is a little bit ahead of the other two, with super-efficiency scores ranging from 3.56% to 21.82%. It was found that at low technical efficiency levels, when DMUs are far away from the DEA frontier, both the technical and super-efficiency scores tend to be the same or closer. For example, in the case SIIG, technical efficiency is lowest at 1.52% in
Model 4, and the maximum is 8.5% in
Model 1 and
Model 5. It may be noted that the super-efficiency scores of SIIG before normalization are the same as those of the technical efficiency scores. The estimated level of improvement that can be achieved for DMUs based on the I/O configuration is tabulated in
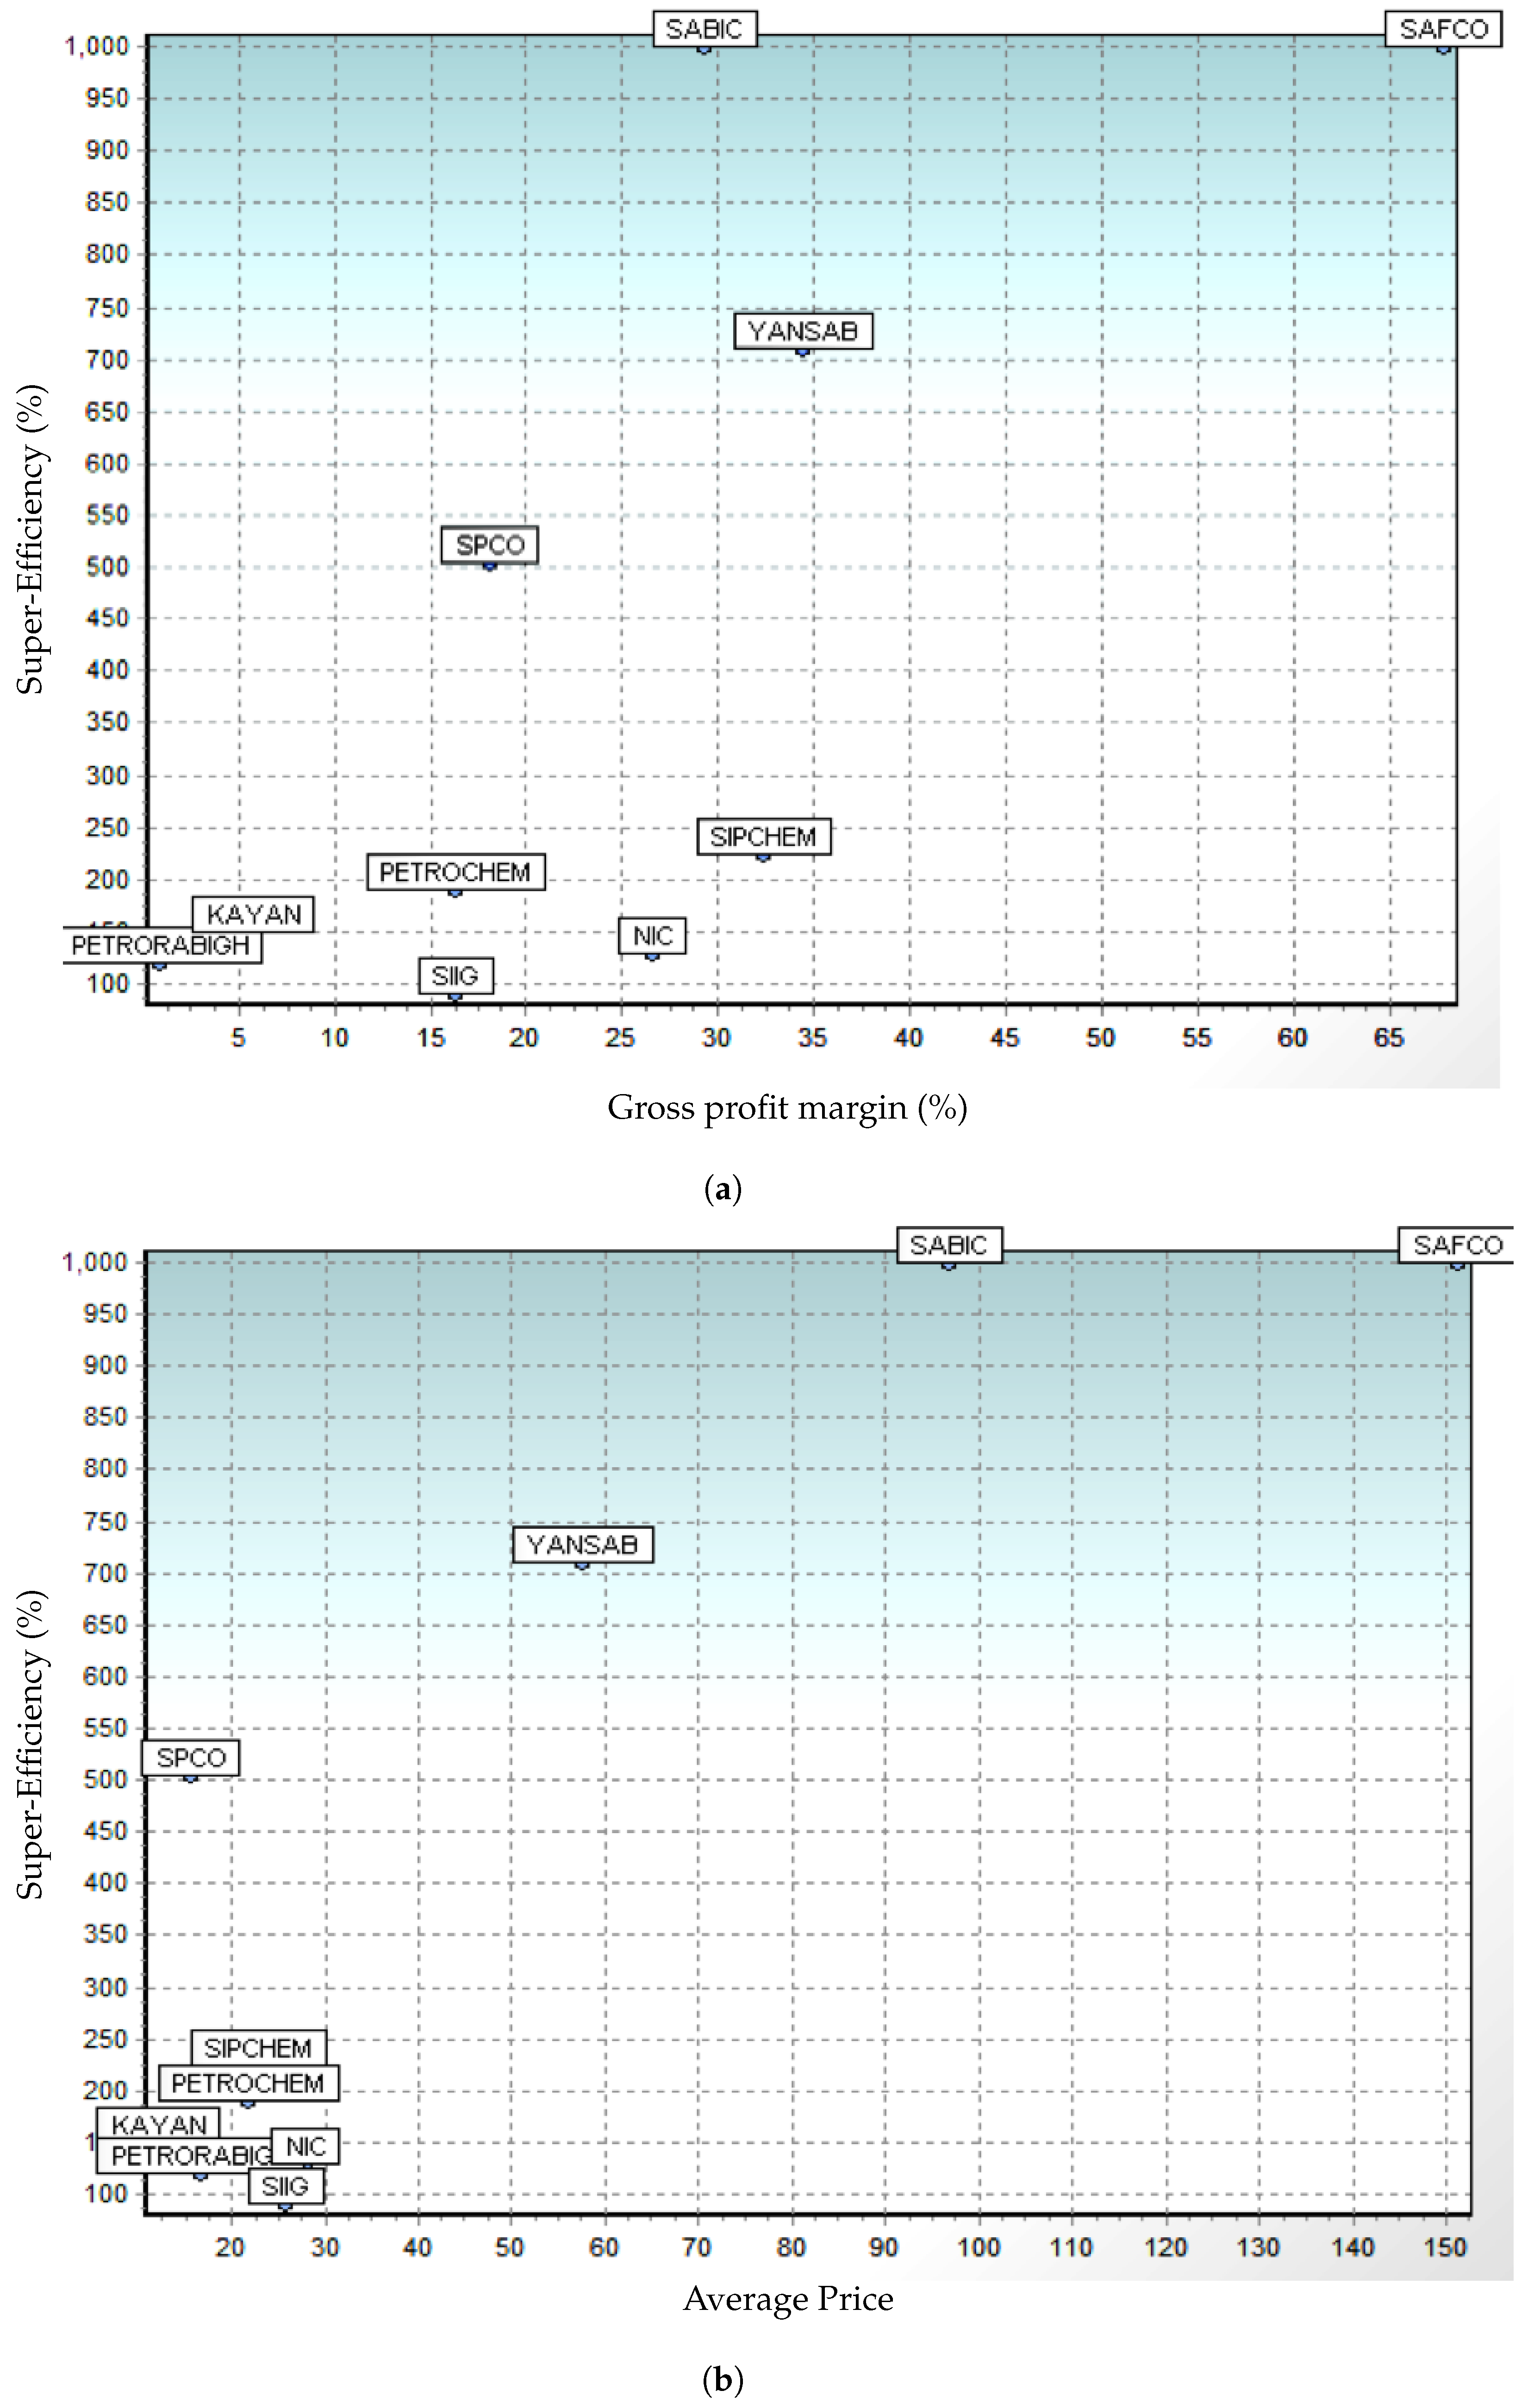
Table 3; about 35.3% improvement is possible in the gross profit margin %. Average price, an input variable, has a potential of 11.57%. Depreciation records the minimum possibility of improvement, with only 0.83%. Efficiency plots for the 10 companies, with “Gross Profit Margin %”, and “Average price” indicated on the x- and y-axes of the plots, respectively, are given in
Figure 1a,b. Such efficiency plots from the software demonstrate the relative positioning of the companies with respect to the variables chosen. SAFCO, with a gross profit margin of 64.70%, sits at the top of the list for efficiency and hence is placed at the top right-hand corner of the plot.
Based on the financial performance data, MDS plots the companies on a map such that they are seen as similar organizations to each other and are placed near to each other on the 2-dimensional map in
Figure 1, where the companies perceived to be different from each other are placed far away from each other. Referring to
Figure 1a,b, the efficiency scores in the DEA efficiency plots reflects the radial distance from the estimated production frontier to the DMU under consideration. Similarly, the MDS plot in
Figure 2 displays the distances (or proximities) among companies, which are positioned accordingly. We applied the ALSCAL algorithm within the MDS module of SPSS software to all financial data used in DEA in order to exhibit the positioning of the 10 companies in the scatter plot (Euclidean distance model).
The most challenging task in MDS is the interpretation of dimensions of the 2-dimensional scatter plot. The default orientations of the axes in the scatter plots are arbitrary, and they can be rotated in any direction. To facilitate realistic interpretations of the plot, meaningful dimensions, clusters of points, or patterns need to be added. The most reasonable approach in interpreting dimensions is to use multiple regression to regress significant variables on the coordinates for different dimensions. We used the potential improvement (%) of the I/O variables as obtained from the DEA frontier plot (
Table 2) to determine the axes of the MDS plot. Out of the inputs and outputs, gross profit margin (%) and average price have the maximum potential for improvement, 35.3% and 11.57%, respectively. These key variables leading to higher performance efficiency and potential improvement are used as the axes dimensions and for positioning the companies in the DEA efficiency plots. SAFCO, SABIC, YANSAB, and SPCO were found to lead in performance efficiency as well as potential improvement (
Figure 1).
In the MDS plot, SAFCO, SABIC, YANSAB, and SPCO lie in the first and second quadrants defined by the new dimensions. The companies KAYAN and SIPCHEM lie in the third quadrant, and PETROCHEM, SIG, NIC, and PETRORABIGH lie in the fourth quadrant.
Table 4 displays a comparative analysis of output from both DEA and MDS.
5. Conclusions
The primary contribution of this work is to identify a performance evaluation approach for the unbiased positioning of Saudi Arabian petrochemical companies. Considering the importance of the petrochemical industry in the Saudi economy, it is vital to continuously monitor the efficiency and the performance of the companies in the sector, for the success of the economy. Given the boundaries of data access and the technical constraints of this prototype study, a framework is successfully established based on the DEA–MDS hybrid approach for assessing the efficiency of petrochemical industries. Despite these findings, certain limitations remain. This evaluation is based only on the financial data of the firms considered; non-financial data was not taken into account. In recent years, non-financial data, such as social involvement, environmental interfaces, and employee relations etc., have been increasingly included in the efficiency evaluations of companies.
In view of the intrinsic nature of the energy market and industry, and the vital role of the petrochemical sector in alleviating the related issues, further research needs to be conducted in this direction. The authors feel that this work could be continued with all possible combinatorial approaches. The hybrid approach of DEA–MDS presented here can be extended with more data and in combination with multiple regressions. Other multivariate techniques such as principal component analysis, logistic regression, and discriminant analysis will be extremely useful.
The most challenging task in DEA is discriminating the efficient and inefficient companies in an unambiguous way. The authors expect that econometric model variations and the new method of multi-component DEA can provide better performance measurement models. Since in this study, financial indicators were used for evaluating the performance of companies, the authors suggest that qualitative indicators also be considered in evaluating the performance of companies. The results can be compared. The use of more market indices based on expert opinion to provide performance appraisal models is also recommended.

 ,
, 


