Article

Complete Ensemble Empirical Mode Decomposition on FPGA for Condition Monitoring of Broken Bars in Induction Motors

by
Martin Valtierra-Rodriguez
1,
Juan Pablo Amezquita-Sanchez
1,
Arturo Garcia-Perez
2 and
David Camarena-Martinez
2,*
1
ENAP-Research Group, CA-Sistemas Dinámicos, Facultad de Ingeniería, Campus San Juan del Río, Universidad Autónoma de Querétaro (UAQ), Río Moctezuma 249, Col. San Cayetano, San Juan del Río, Querétaro 76807, Mexico
2
CA Procesamiento Digital de Señales, Departamento de Electrónica, División de Ingenierías Campus Irapuato-Salamanca (DICIS), Salamanca, Guanajuato 36885, Mexico
*
Author to whom correspondence should be addressed.
Mathematics 2019, 7(9), 783; https://doi.org/10.3390/math7090783
Submission received: 29 June 2019 / Revised: 9 August 2019 / Accepted: 19 August 2019 / Published: 25 August 2019
(This article belongs to the Special Issue Information Theory, Cryptography, Randomness and Statistical Modeling)

Abstract

:
Empirical mode decomposition (EMD)-based methods are powerful digital signal processing techniques because they do not need a priori information of the target signal due to their intrinsic adaptive behavior. Moreover, they can deal with non-linear and non-stationary signals. This paper presents the field programmable gate array (FPGA) implementation for the complete ensemble empirical mode decomposition (CEEMD) method, which is applied to the condition monitoring of an induction motor. The CEEMD method is chosen since it overcomes the performance of EMD and EEMD (ensemble empirical mode decomposition) methods. As a first application of the proposed FPGA-based system, the proposal is used as a processing technique for feature extraction in order to detect and classify broken rotor bar faults in induction motors. In order to obtain a complete online monitoring system, the feature extraction and classification modules are also implemented on the FPGA. Results show that an average effectiveness of 96% is obtained during the fault detection.

1. Introduction

In recent years, the development of new systems for monitoring the condition of rotating machines has become an important issue for different fields such as academia and industry. In particular, inductions motors have received more attention since they constitute about the 85% of the employed power in industrial processes [1]. The presence of a fault in an induction motor can lead to setbacks and substantial economic losses, therefore, early detection of faults becomes an important task. One of the most common faults in induction motors is a broken bar, representing about 10% of the total failures on induction motors [2]. The problem with the broken bar fault is that the motor can keep operating with apparent normality, however this fault can cause different problems: changes in the current consumption, unwanted vibrations, and damages to other bars [3,4,5].
A great number of methods are available in the literature for condition monitoring of induction motors, and many of them have been focused on early fault detection through vibration analysis and motor current signature analysis (MCSA) [6]. A simple way to make a frequency analysis is to use Fourier transform, but it is only useful for stationary signals [7]. In order to analyze non-stationary signals, short-time Fourier transform (STFT) can be employed; yet, its frequency resolution depends mainly on the selected time window, which in some cases cannot be adequate for transient signals. As an alternative for the analysis of transient signals, methods based on wavelet transform have been presented [8,9,10,11]. Wavelet transform (WT) is a windowing technique with variable regions in both time and frequency. It increases time resolution at higher frequencies and frequency resolution at lower frequencies [12,13,14]. Although promising results have been obtained, several aspects have to be taken into account; for instance, WT performance can be affected under noisy conditions and adequate selection or choice of the level of decomposition and the mother wavelet have to be performed according to the input signal in order to carry out a suitable analysis [15].
In order to avoid the configuration of different parameters in WT, recent works have presented the use of the empirical mode decomposition (EMD) method [16,17,18,19], which is an adaptive decomposition algorithm or method capable of evaluating non-linear and non-stationary signals. Due to the potential of the EMD method as a signal processing technique, several works have tried to make a hardware implementation for online processing. In [20], the EMD in a C program is processed by a field programmable gate array (FPGA). Another hardware implementation of EMD by fusing an FPGA and a digital signal processor (DSP) is proposed by [21]. The FPGA implementation of EMD using sawtooth transform instead of the spline cubic is presented in [22]. The EMD method using the spline cubic interpolation into an FPGA is presented in [23]. Recently, in [24], another design for EMD on an FPGA platform is presented, where the user can change different aspects of the implementation (e.g., data lengths, extrema extraction methods, envelope generation methods, and stopping criterion methods).
Despite the great capabilities of the EMD method, several studies have shown that this method suffers from a problem named mode mixing [25], compromising the correct analysis of the modes of a signal. To overcome this problem, the ensemble empirical mode decomposition (EEMD) and, subsequently, an improved technique called complete ensemble empirical mode decomposition (CEEMD) were proposed. In general, the CEEMD method requires less iterations than the EEMD method and reconstructs correctly the input signal from the extracted modes [26]. This fact has promoted the development of several methodologies based on CEEMD for condition monitoring in many areas from health care monitoring [27,28,29,30] to fault detection in induction motors [31,32,33]. Although better results have been obtained with the CEEMD method, special attention has to be put into the computation cost since this method requires many iterative calculations, which can compromise online condition monitoring, and even more for applications that require continuous monitoring [34]. In this regard, a hardware implementation that allows carrying out online processing based on the CEEMD method would be desirable for many research areas, where a promising implementation platform is the FPGA technology thanks to its natural parallelism and high-performance to implement complicated algorithms [35].
The main contribution of this work is the development and implementation of the CEEMD method in a low-cost FPGA and its application for condition monitoring of broken bars in induction motors. In order to provide a complete system on a chip (SoC) solution, two indices, i.e., energy and Shannon entropy, along with a neural network are also implemented into the FPGA for automatic fault diagnosis. The proposal can detect half, one, and two broken rotor bars from the current signal during the startup transient of a 1-hp induction motor. Results show that the proposal implemented on a DE2 CYCLONE IV from ALTERA can achieve an average effectiveness of 96% during fault detection.

2. Theoretical Background

As abovementioned, the CEEMD method results from different improvements of the EMD and EEMD methods. Therefore, in order to have a clear background for CEEMD implementation, the EMD and EEMD methods are also introduced in this section.

2.1. EMD

EMD is characterized by being an adaptive method to analyze or decompose transient, non-linear, and non-stationary time signals into a set of frequencies of band-limited quasistationary functions called intrinsic mode functions (IMFs) according to its frequency components [36]. For considering an IMF, it must satisfy the following two conditions: (1) for the data analyzed, the number of extrema and the number of zero crossings have to be equal or differ at most by one; and (2) the mean value of envelopes has to be zero.
The procedure to determinate each IMF is known as the “sifting process”, which is described below:
  • Detect all the extrema of the target signal x(t).
  • Join the minima and maxima points by employing a cubic spline to get the lower envelope emin(t) and the upper envelope emax(t), respectively.
  • Estimate the mean mj(t) with j = 1 as the average of upper and lower envelopes.
    m 1 ( t ) = e max ( t ) e min ( t ) 2
  • Determinate the local oscillation mode c1(t).
    x ( t ) m 1 ( t ) = c 1 ( t )
  • Evaluate if c1(t) satisfies the two criteria to be an IMF; if it does not satisfy the criteria, steps (1–4) by setting x(t) = c1(t) must be repeated; on the contrary, if c1(t) is an IMF save it as IMFk, where k = 1, …, K represents the modes.
  • Calculate the residue r(t) = x(t) − ck(t) and
  • Evaluate if r(t) is a monotonic function; if it is not, repeat the overall process by setting x(t) = r(t) and increase j by one. On the contrary, if r(t) is a monotonic function the signal analysis or decomposition is complete.
There are different stop criteria for the sifting process, the most common one is a Cauchy type of convergence test, called standard deviation criterion (SD criterion) [36]. This stopping condition requires the normalized squared difference to be calculated between two consecutive sifting results, quantifying the amount of variation or dispersion. This criterion is defined by the following equation:
S D k = t = 0 T | c j 1 ( t ) c j ( t ) | c j 1 2 ( t )
where cj−1(t) is the previous local oscillation mode. The sifting process will stop when SD is smaller than a pre-given value. The election of this value is important, the smaller this value is, the more rigorous is the sifting process, creating more decompositions (IMFs). If SD is a big value, the required decompositions could not be obtained. From a previous study, a suitable value for SD is 0.1 [34].

2.2. EEMD

EMD has demonstrated to be a good method for analyzing/decomposing signals with nonstationary characteristics into a set finite of frequency bands or IMFs; but it presents a main problem called mode mixing, which means that waves with the same frequency are assigned to different IMFs. To lessen this problem, Wu and Huang [37] introduced a noise-assisted method called ensemble EMD (EEMD), which is described briefly below:
  • Generate xj(t) = x(t) + wj(t), where wj(t), for j = 1, …, N, are different white noise series.
  • Decompose each time signal xj(t) by using the EMD method for estimating its frequency bands or I M F k j ( t ) , where k = 1, …, K indicates the modes.
  • Define the “true” IMFs, I M F ¯ k ( t ) , for the k-th mode of x(t) as the average of their corresponding I M F k j ( t )
    I M F ¯ k ( t ) = 1 N i = 1 N I M F k i ( t )
For obtaining suitable results using the EEMD method, the number of trials or ensemble number N has to be as large as possible, generally about a few hundred.

2.3. CEEMD

The CEEMD method is a variation of the EEMD method. This method requires less than half the sifting iterations of classical EEMD. Hence, the analyzed signal can be rightly reconstructed by summing the frequency bands or IMFs estimated [26]. The procedure can be described by the following algorithm:
  • Decompose N realizations of x [ n ] + ε 0 w i [ n ] , i = 1,…, N using EMD, where ε 0 and w i represent the noise standard deviation and the white noise, respectively; then, ensemble all of the first modes to obtain a true I M F ˜ 1 [ n ] as:
    I M F ˜ 1 [ n ] = 1 N i = 1 N I M F 1 i [ n ]
  • Calculate a unique first residue at the first stage (k = 1) as:
    r 1 [ n ] = x [ n ] I M F ˜ 1 [ n ]
  • Decompose N realizations of r 1 [ n ] + ε 1 E 1 ( w i [ n ] ) , i = 1, …, N. E j ( ) is an operator that for a given signal produces the j-th mode obtained by EMD. Next use EMD to obtain the second mode:
    I M F ˜ 2 [ n ] = i = 1 N E 1 ( r 1 [ n ] + ε 1 E 1 ( w i [ n ] ) )
  • For the next stages (k = 2, …, K), keep computing the k-th residue and obtain the next IMFs by:
    r k [ n ] = r ( k 1 ) [ n ] I M F ˜ k [ n ]
    I M F ˜ ( k = 1 ) [ n ] = i = 1 N E 1 ( r k [ n ] + ε k E k ( w i [ n ] ) )
    Steps 3 to 4 continues until the residue r k [ n ] does not have at least two extrema.
  • The final residue can be calculated with K equal to the total number of modes as:
    R [ n ] = x [ n ] k = 1 K I M F ˜ k [ n ]
    Hence, the original signal x [ n ] can be expressed as:
    x [ n ] = k = 1 K I M F ˜ k [ n ] + R [ n ]

3. Proposed Methodology and Its FPGA Implementation

In this section the steps used in the proposed methodology and its FPGA implementation to provide a condition monitoring system of broken roto bars are presented, see Figure 1. Firstly, the proposal employs a current clamp and a data-acquisition system (DAS) for measuring and acquiring one phase of the stator current, respectively. Then, the measured signal is sent to the FPGA processor for diagnosis of automatic way the induction motor condition, where an overall control unit coordinates the DAS driver for data acquisition, the three stages of signal processing, and the display of the induction motor condition. In general, the signal processing performs the CEEMD method to decompose the signal into narrow frequency bands, then two indices (Entropy and Energy) are computed as fault indicators, and a feed forward neural network (FFNN) carries out the automatic diagnosis. In this work, four conditions are tested: the healthy condition (HLT), half broken bar (HBB), one broken bar (1BB), and two broken bars (2BB).
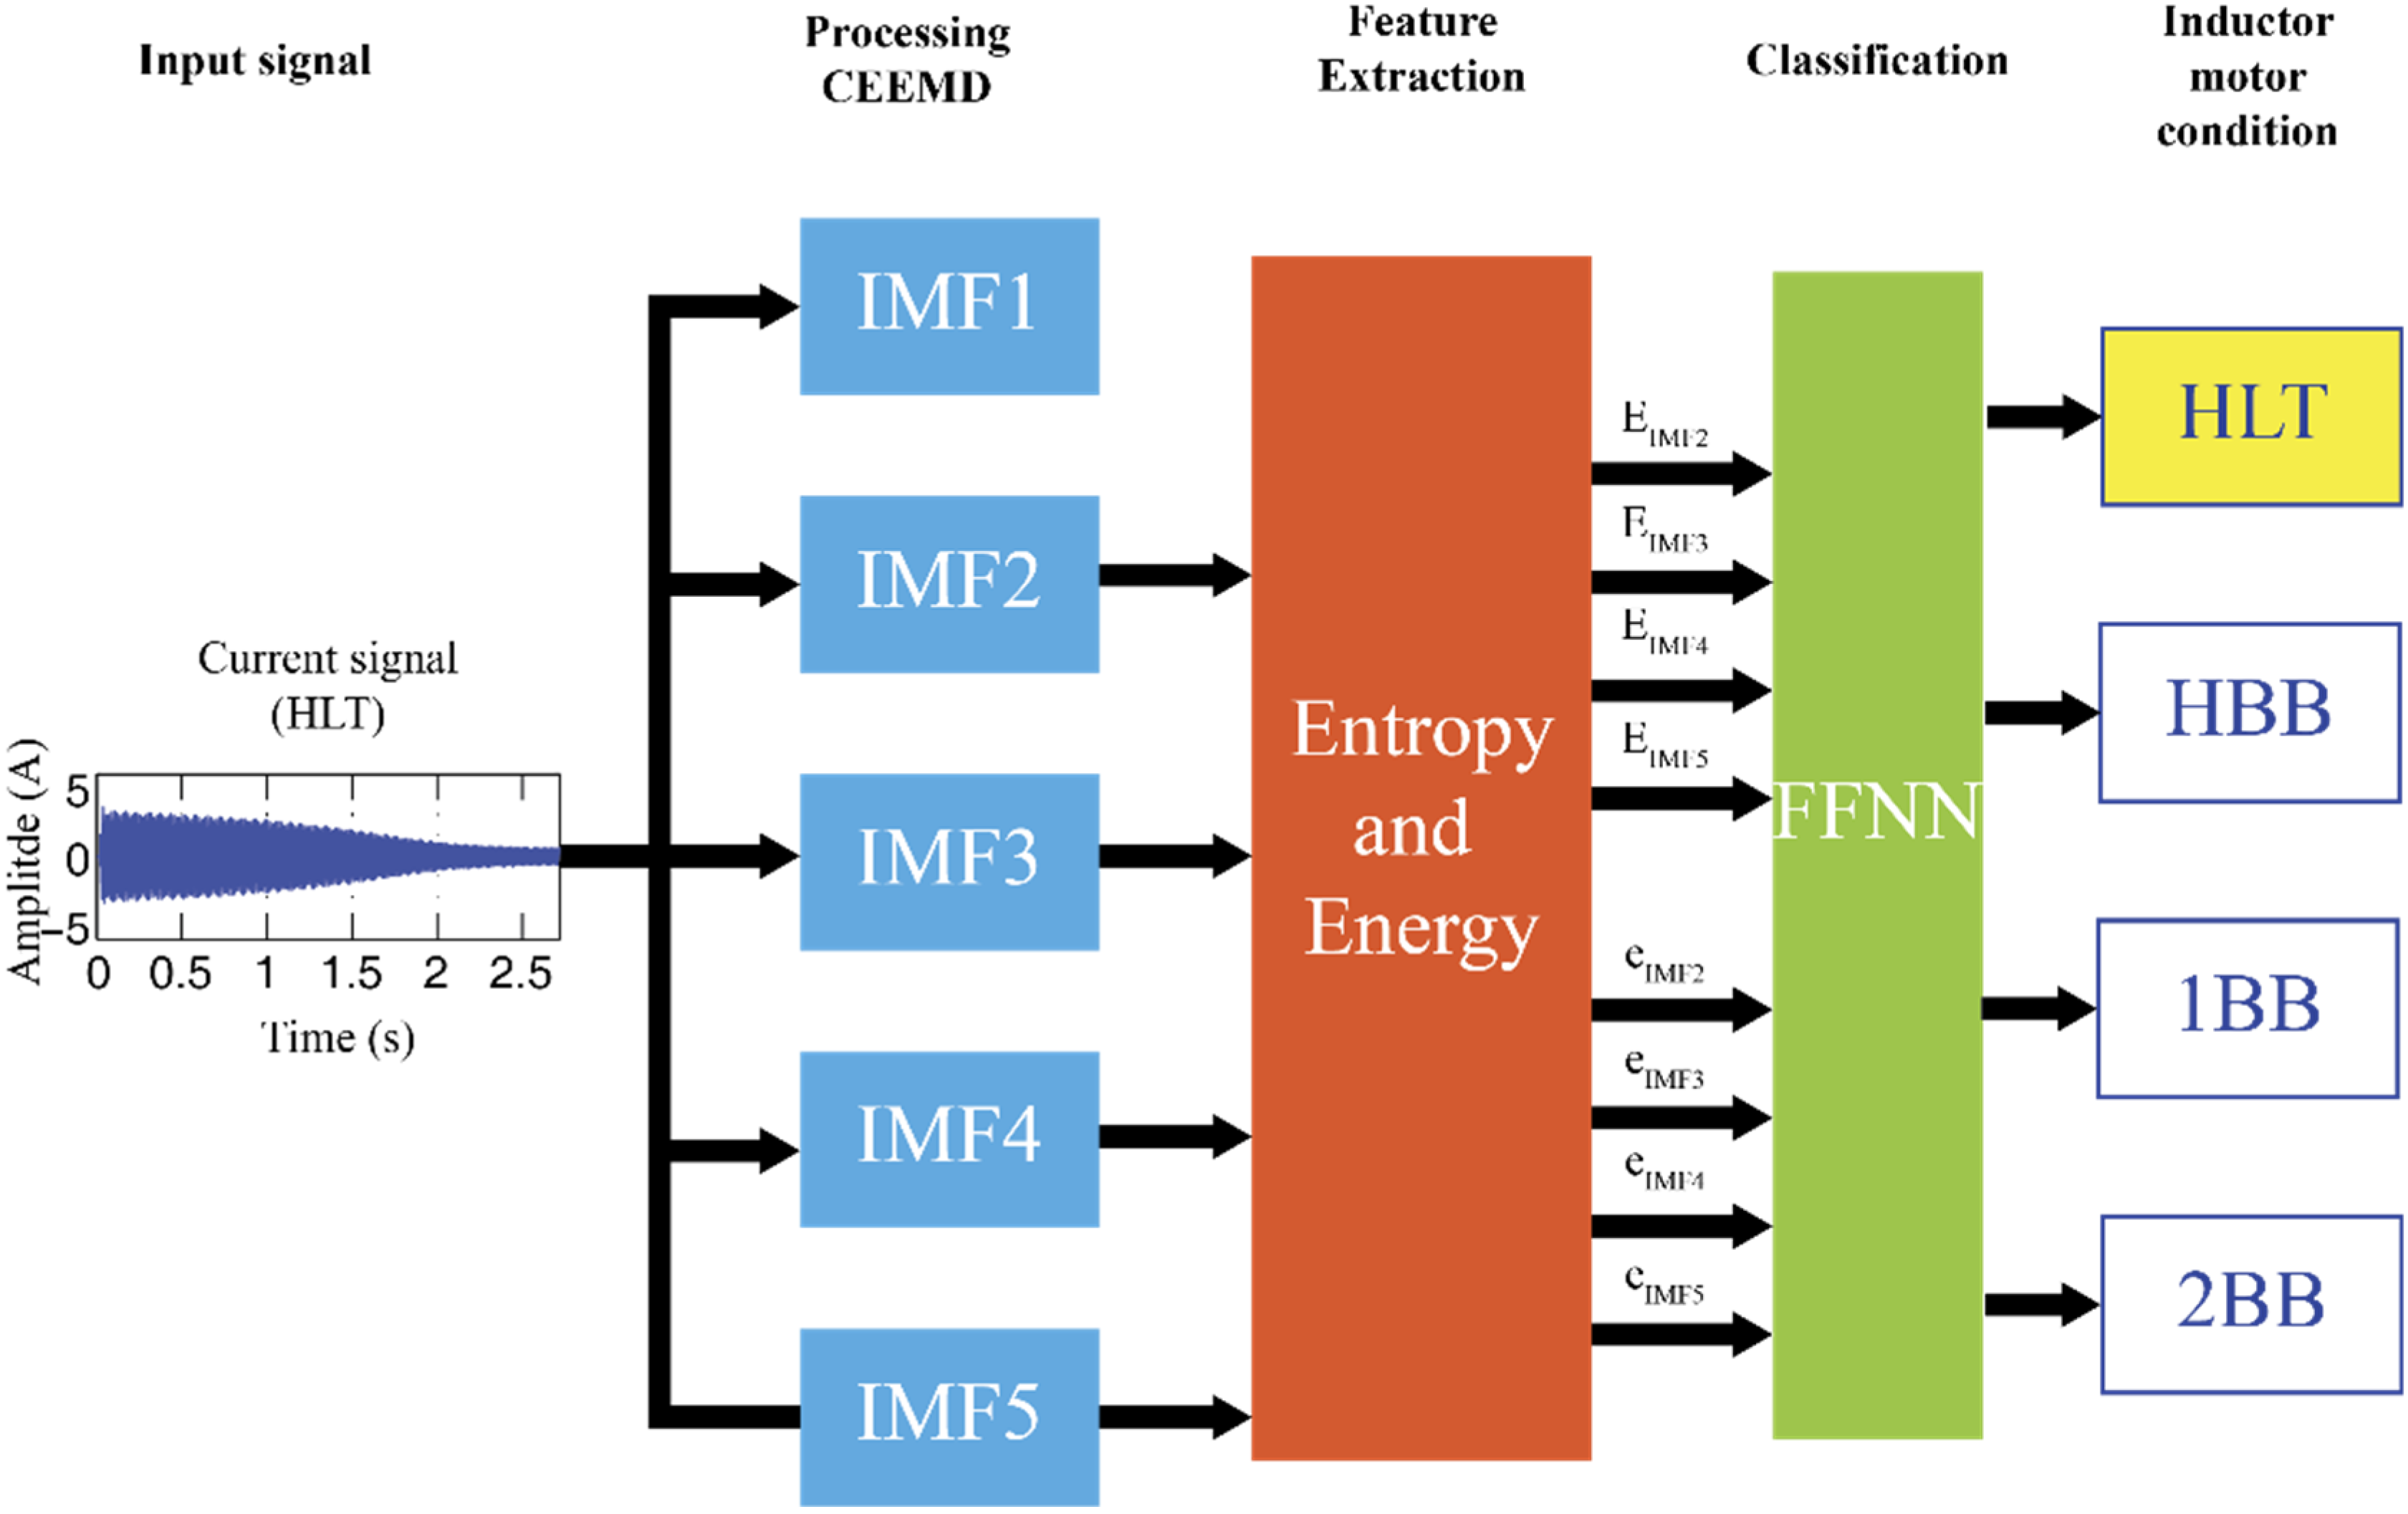
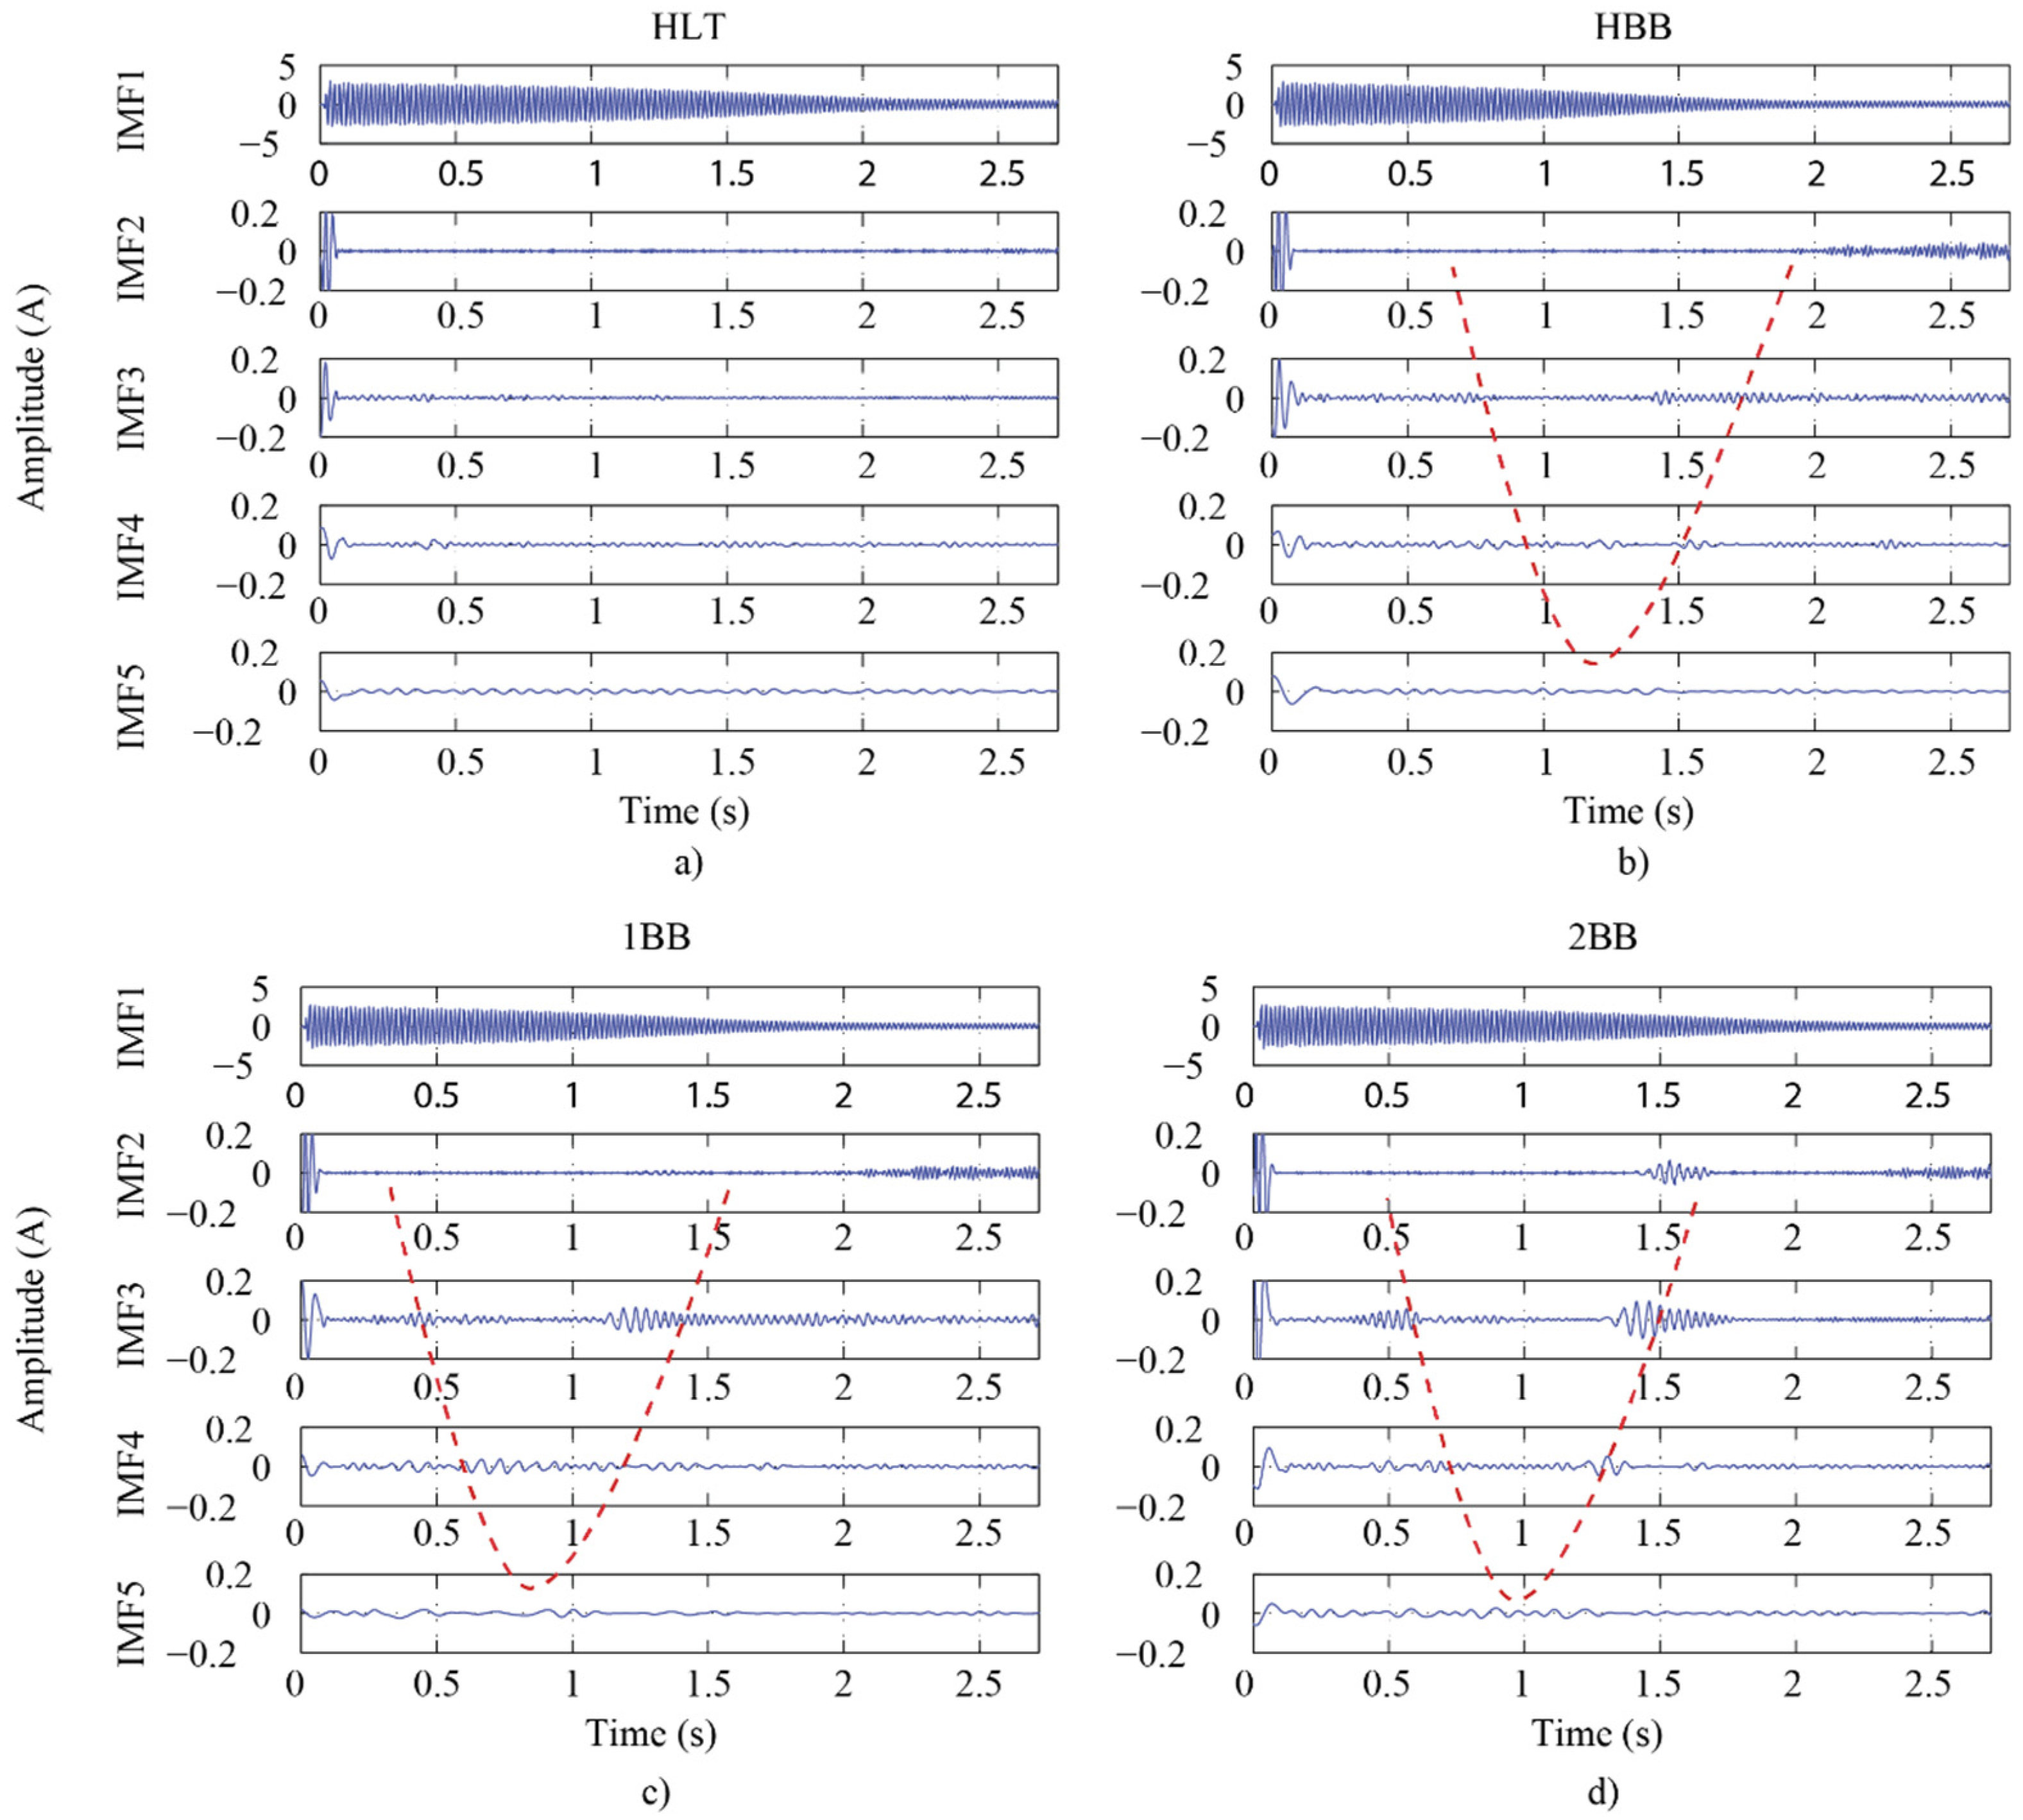
Figure 2 shows the flowchart of the proposed methodology for its hardware implementation. Firstly, the input current signal is decomposed by the CEEMD method into five IMFs, which are enough to depict the evolution of the characteristic left side band (LSB) frequency component during the startup transient of a motor with a broken bar, as can be seen in Figure 3 where the evolution of the LSB is highlighted by a dashed red line for each treated condition. These results are consistent with the ones obtained by the analytic and finite element (FE) models [15,38]. Evidently, there is no frequency information in the IMFs for an HLT condition. After calculating the first five IMFs, their energy and entropy (EIMF_K and eIMF_K, respectively) are calculated and, then, they are used as inputs for the FFNN, which automatically will classify the induction motor condition. IMF1 is discarded as it contains the information associated to the fundamental component (see Figure 3).
To test the FPGA implementation, an experimental setup was carried out, which was composed by a 1-hp three-phase induction motor (model WEG00136APE48T) with induced fault conditions. The in-test motor is constituted by 28 bars, two poles and an ordinary alternator to provide the mechanical load. It received a power supply of 220 Vac, 60 Hz. One phase of the stator current is acquired with an i200 Fluke current clamp. The DAS has a sampling frequency of 375 samples/s (enough to acquire the LSB component), resulting in 1024 samples during the startup transient monitoring. The measured data is sent to the FPGA processor for assessing the motor condition. To generate the broken bar conditions, the motor bar was gradually broken by drilling a hole of 5 mm for the HBB condition, a hole of 10 mm for the 1BB condition, and two holes of 10 mm for the 2BB condition (see Figure 4).

4. FPGA Processor

Figure 5 displays the proposed FPGA processor, which is based on three main parts: (1) Processing CEEMD, (2) Feature Extraction, and (3) Classification FFNN. They are described in the following sections.
In general, the flowchart is as follows: firstly, the measured signal is analyzed by the CEEMD module for obtaining the first five IMFs. As above-mentioned, the IMF1 in this application contains only the fundamental frequency component referent to the supply system (60 Hz); therefore, IMF1 is discarded from the analysis. IMF2, IMF2, IMF4, and IMF5 contain the information about the evolution of the LSB related to the broken rotor bar faults (see Figure 3). The signals Start and End supervise the incoming data to the CEEMD unit that computes the IMFs sequentially, and then transfers the result to the Feature Extraction module, where the energy and entropy of each IMF are calculated. These results are storage in Reg_FE. After that, the Classification FFNN module takes the feature values (energy and entropy) of the four IMFs (E_IMF and e_IMF, respectively) as inputs and performs the automatic diagnosis, indicating through four outputs the motor condition, i.e., HLT, HBB, 1BB, or 2BB.
The next subsections describe in detail the above-mentioned modules.

4.1. CEEMD Module

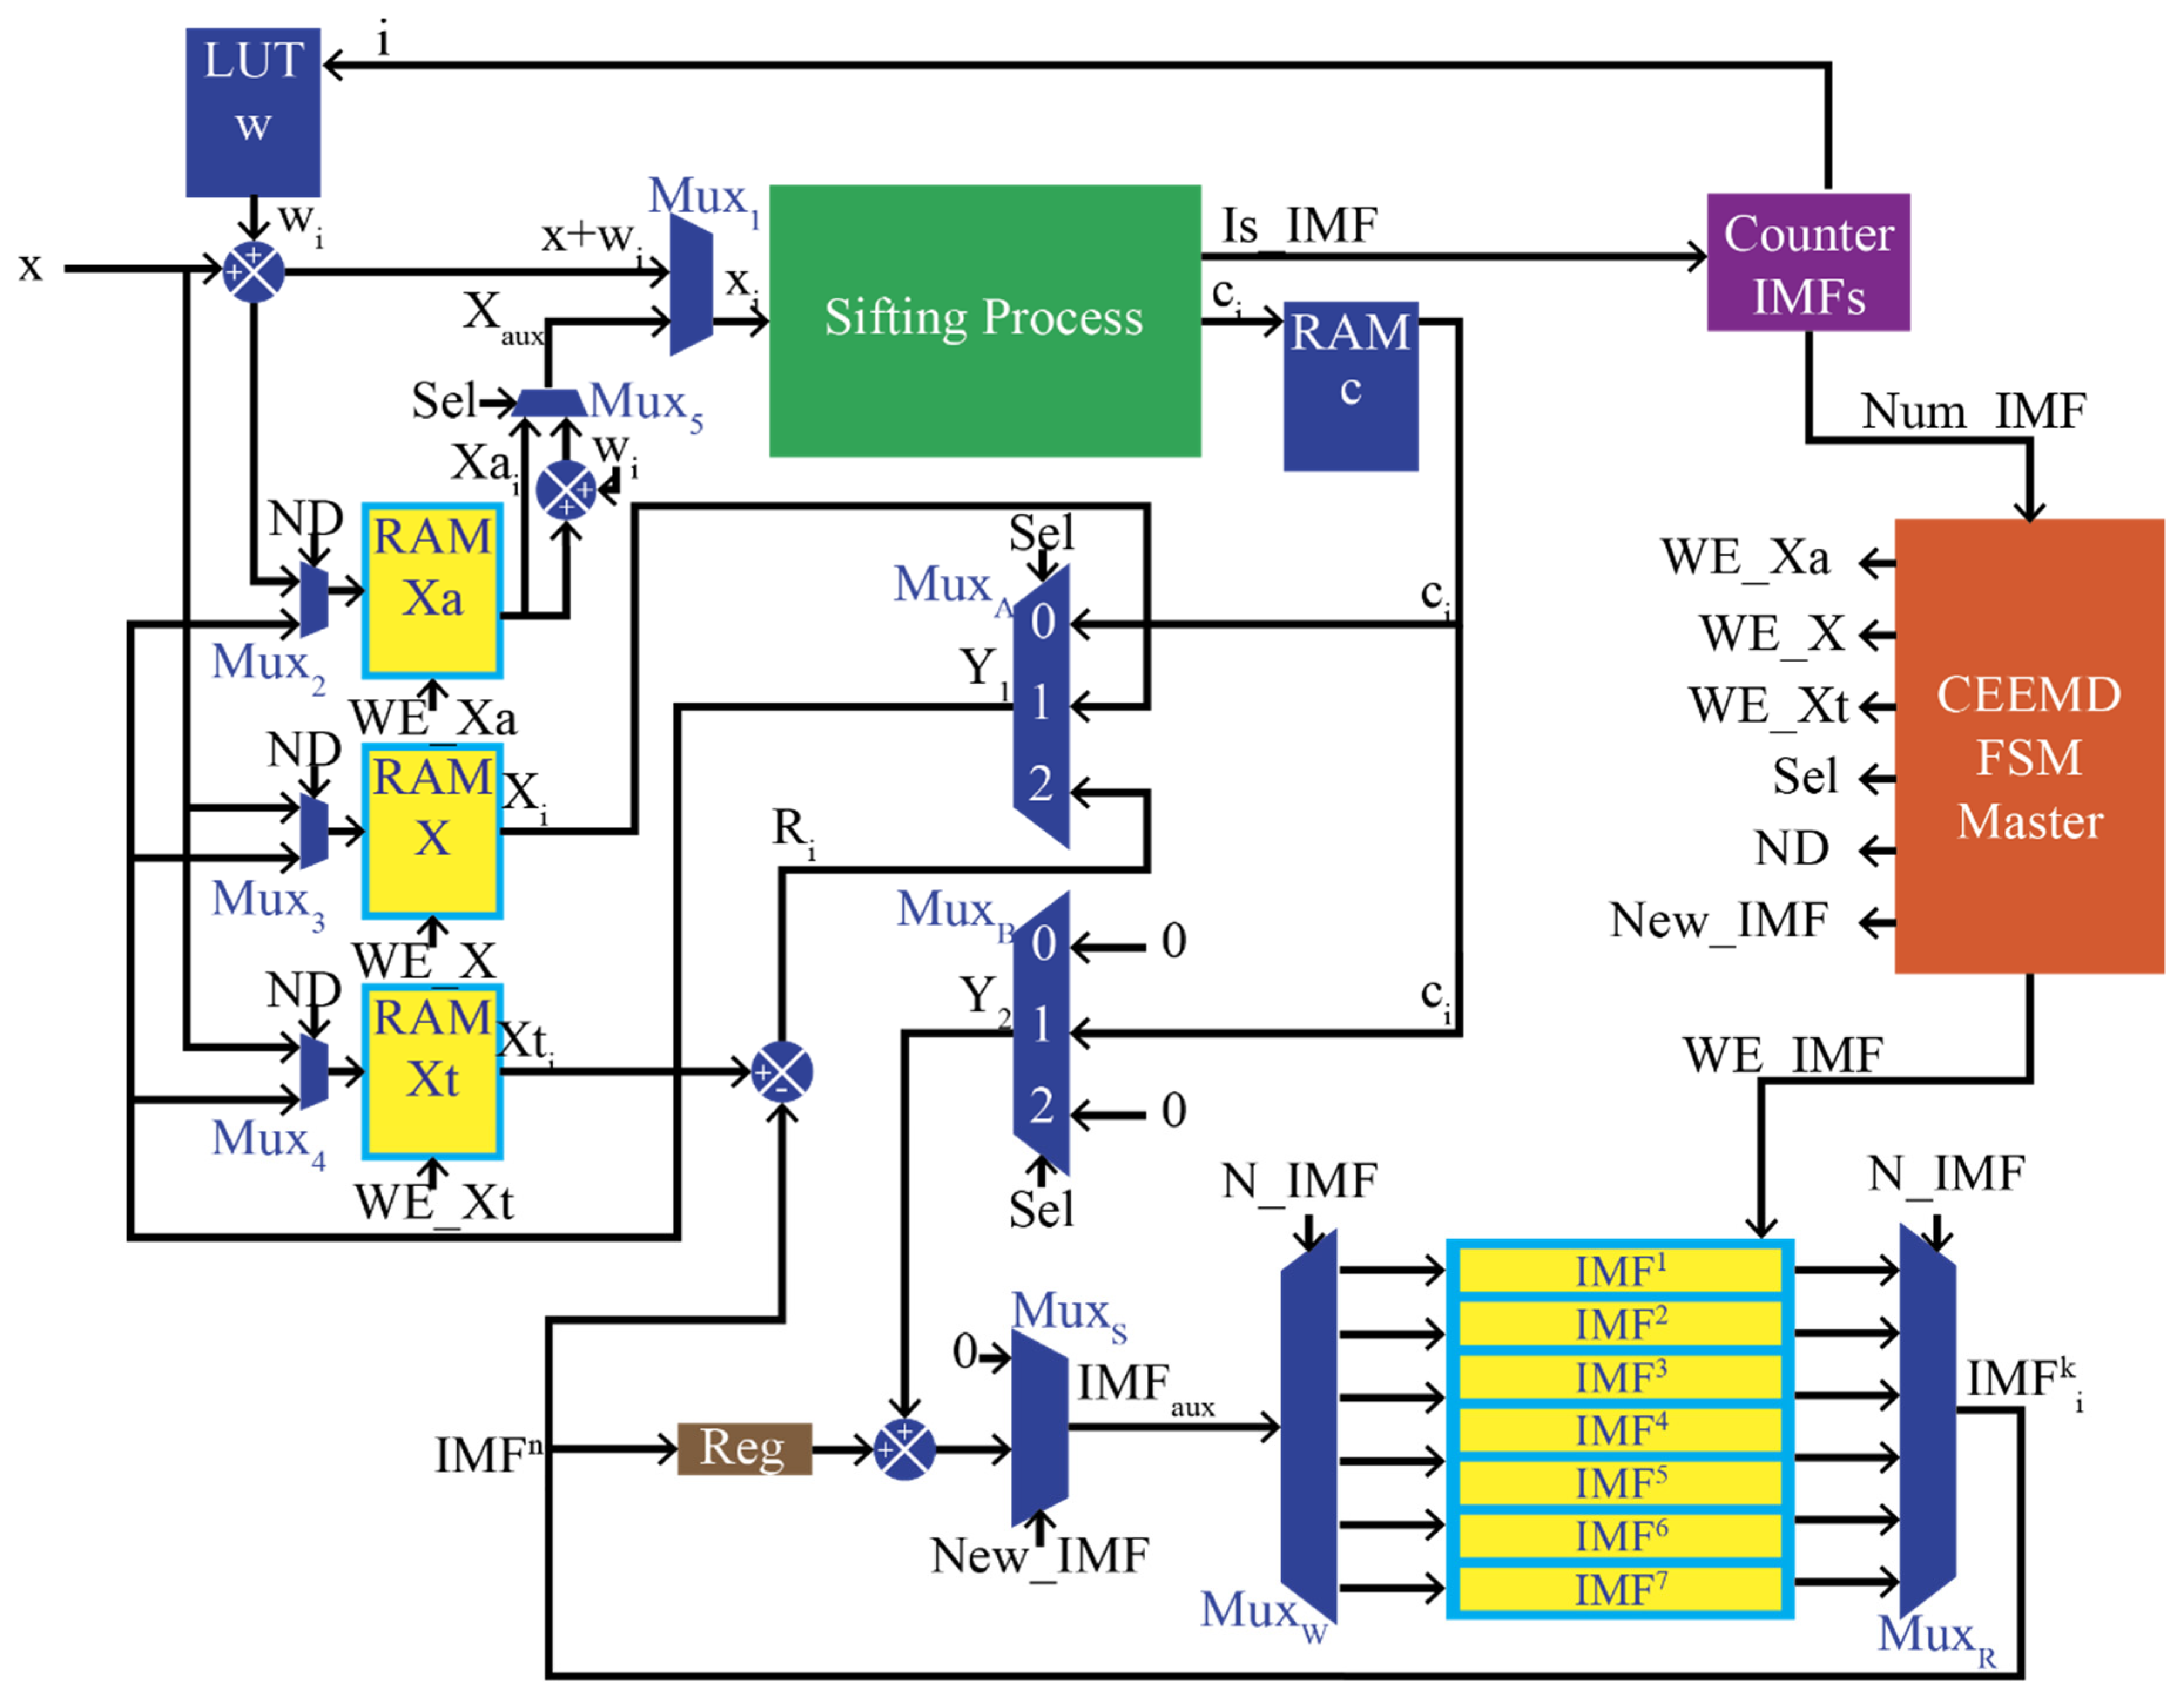
The CEEMD module is described in Figure 6. The process begins adding a pseudo-aleatory noise wi from a look up table (LUT), which was previously generated in Matlab with a normal distribution of Ν(0, 0.1), to the input signal x. For a new value of i, a new direction of the LUT is chosen to select a new sequence of noise data. The addition of the input signal and noise is defined as x + wi. Simultaneously, x is stored in RAM_X and RAM_Xt, and x + ni is stored in RAM_Xa. Mux1 selects from two different signals, x + ni or Xaux; the first time x + ni is selected as input to the Sifting Process module, which has two outputs, ci and Is_IMF. The output ci represents a possible IMF and the signal Is_IMF is used with two purposes: (1) to know is ci is an IMF and (2) to know how many realizations have been carried out. Counter_IMFs registers the number of realizations and triggers the signal Num_IMF to the control unit (CEEMD FSM Master) in order to continue with the iterative process. MuxA and MuxB play an important role. They choose from three different cases: case 0 is selected if the signal ci is not an IMF, case 1 is selected if the signal ci is an IMF, and case 2 is selected if the number of realizations is over. If the case 0 is selected, the output Y1 takes the values of ci. These values are stored in the RAM Xa, then they are sent to Mux5. In this multiplexor, if the first case is selected (ci is not an IMF), Xai is sent directly through the overall system; but if the second case is selected (ci is an IMF), a new realization begins. For the case 1, i.e., ci is an IMF, the output Y1 takes the value of Xi to be stored as Xai; then, a new noise is added to Xai and the Sifting process module starts again the decomposition of a new realization; on the other hand, the output Y2 from MuxB takes the values of ci (an IMF). This signal is sent to an adder to be combined with a previous IMF, which is stored in I M F i k . MuxS selects the zero input when a new “true IMF” is being calculated; thus, the RAM block of the respective current “true IMF” is initialized. After the RAM block is initialized, the output IMFaux is divided by the number of realizations as (5), N = 512, and stored in the block RAM of the current IMF to be combined with the next IMF. This procedure is repeated until the number of realizations is over with a true IMF stored in the RAM. In the last case, case 2, it means both the number of realizations is over and the calculation of a new “true IMF” is started. MuxA selects the signal Ri (the difference between Xti and the previous true I M F i k (8)) which is sent to be stored as X, Xa, and Xt. The whole process to calculate a new true IMF starts again by selecting in Mux5 the values of Xai + wi. Finally, the CEEMD FSM Master module provides the overall synchronization to write in the RAM blocks, control the multiplexors, and load the registers of the system.

4.2. Sifting Module

The sifting process is the key step for EMD methodologies. The CEEMD method needs several iterations of this module to carry out a correct decomposition. Figure 7 shows the three required steps to implement this algorithm. The first step is the extrema identification, where a similar process is performed to find either the minima or maxima of the input signal; therefore, the input xi (where i is 1, 2, 3, …, 1024 and represents the number of sample) is sent and processed into a 2-level pipeline register, to store xi−1 in RegA, and xi−2 in RegB. The signal xi−1 is compared with xi and xi−2 using four comparators to know if xi−1 is greater or lower than xi and xi−2. If xi−1 is the greatest value, it is taken as a maximum and stored in Reg M as Maxj (j represents the number of maxima); similarly, if xi−1 is the lowest value, it is defined as a minimum and stored in Reg m as mink. (k represents the number of minima). The AND gates help to verify if the comparison condition is satisfied. Its output habilitates the registers Reg M, Reg RM, and Reg PM for the maxima values and the registers Reg m, Reg Rm, and Reg Pm form the minima values. The output of Register R (RDMax) specifies the appearance of a new maximum. In parallel, a Counter increases by one in every incoming sample, when the output of the AND gate in Maxima block enables Reg PM, the position of the maximum value as PMj is stored. The same process occurs in the minima block where the AND gate enables Reg Pm to store the position of the minimum value as Pmk. The second step is to calculate the upper and lower envelopes (Su and Sl) of the input signal, through spline cubic interpolation. The structure of this block is described in [23]. The last step is to calculate a “possible IMF”; to perform this, the mean mi of the two envelopes is calculated, then mi is subtracted from xi and the result is defined as hi, which is used in the block Standard Deviation Criterion. This block computes the Equation (3) to know if ci is an IMF. The output of the Sifting Process module is ci, the “possible IMF”, and Is_IMF to indicate if ci is an IMF.

4.3. Feature Extraction Module

This module calculates the features that help to identify each of the treated conditions in this work. That is, these indices provide a quantity (number) associated to the shape of each IMF; therefore, if the shape of the IMF changes according to the induction motor condition, these indices could change their value, leading to a pattern recognition problem. The features used in this work are Shannon entropy and the energy for each IMF.

4.3.1. Entropy

In this module, the Shannon entropy for the IMF2, IMF3, IMF4, and IMF5, where the evolution of LSB appears (see Figure 3), are calculated. The Shannon entropy, a nonlinear feature, measures the amount of randomness found in a time signal. Hence, the information entropy H(X) of a random event X, with n possible outcomes x1, x2, x3, …, xn, and every xi with a probability p(xi), is denoted by [39,40]:
H ( X ) = i = 1 n p ( x i ) log 2 [ p ( x i ) ] f o r 1 < i n .
The probability p(xi) of a random event X with N samples is defined by:
p ( x i ) = r i N
where ri is the incidence rate of each possible data xi. The total number of samples, N, is computed using:
N = i = 1 n r i f o r 1 < i n .
Re-writing (12) to an expression more adequate for hardware implementation, the H(X) can be computed through:
H ( X ) = log 2 ( N ) ( 1 N ) i = 1 n r i log 2 ( r i ) f o r 1 < i n .
The entropy defined in (15) provides an appropriated and simplified mathematical expression for being implemented in an FPGA, which uses a base-2 logarithm because the entropy for binary information is considered. For estimating the base-2 logarithm, the Mitchell algorithm is employed due to its advantages during hardware implementation. Figure 8 shows a schematic diagram of the architecture proposed for entropy calculation according to (15).

4.3.2. Energy

The energy, E(x), of a discrete-time signal x(i) for i = 1, …, n is defined as:
E = i = | x ( i ) | 2 .
The Energy module for PFGA implementation is shown in Figure 9. The Reg module represents an accumulator register.

4.4. FFNN Module

In the literature, different artificial intelligence-based methods such as artificial neural networks (ANNs), fuzzy logic systems (FLSs), and support vector machines (SVMs), among others, for detecting broken rotor bars have been reported [41,42,43], with the ANNs being one of the most widely used methods [41]. ANNs are considered computing systems or models capable of simulating the neurological structure of the human brain for learning, classifying, and solving problems. From a great variety of architectures for an ANN, the feed forward neural network (FFNN) is the most employed for classification problems [39]; hence, this architecture is employed in this work. Figure 10 illustrates the architecture of a FFNN, where it is possible to observe that it is based on a layered architecture with single or multiple neurons in each layer.
FFNN architecture is based on the sum of products between the inputs and their associated weights, plus a bias, which are evaluated by means of a non-linear function for providing the capability of modeling non-linear relationships. To find the network weights, pairs of input–output data are presented; then, a training algorithm is employed to adjust these weights until the error between the desired output and the calculated output is considered acceptable.
In this paper the digital structure for a FFNN is previously developed and trained in Matlab and then is implemented on the FPGA. In order to do so, twenty real signals are acquired for each motor condition as described in Section 3. In order to train and validate the FFNN, a dataset of 100 values (70% for training and 30% for validation) for each condition is synthetically constructed (400 values in total, 100 for each condition: HLT, HBB, 1BB, and 2BB). The dynamic range of these values is [µσ, µ + σ], where µ and σ are the mean and the standard deviation, respectively, for the twenty real signals. The testing set is composed by the real signals only (see later in Section 5.1). The overfitting problem is avoided through the use of both the k-fold cross validation process and three different datasets (one for training, one for validation and one for testing).
Following the FFNN structure shown in Figure 10, the proposed FFNN architecture has eight inputs (four energy values and four Shannon entropy values from the IMF2 to IMF5), 15 neurons in the hidden layer, which are selected by means of trial and error for obtaining the error minimum of classification, and four outputs, which are employed as flags to specify the induction motor condition (HLT, HBB, 1BB, and 2BB). Once trained and validated the FFNN, its final weights and biases for each layer neuron are employed for FPGA implementation based on the digital structure presented in Figure 11, which calculates (17) for each neuron.
y = f ( i = 1 I ω i x i + b )
where y is the output, ωi are the weights, xi represents the inputs, b is the bias, f (·) is the activation function, and i stands for the total number of inputs, respectively. In Figure 11, the proposed FFNN structure can be seen: eight inputs (E_IMF2, E_IMF3, E_IMF3, E_IMF4, e_IMF2, e_IMF3, e_IMF4, E_IMF5), 15 neurons in the hidden layer (RegY1, RegY2, …, RegY15) and 4 outputs (HLT, HBB, 1BB, and 2BB). The FFNN processor follows and takes advantage of the digital structure presented previously by the authors in [44].
Observing Figure 11, the information exchange synchronization between the hidden and output layers is provided by both control units called “Control Unit Hidden Layer” and “Control Unit Output Layer”, through StartH/EndH and StartO/EndO, respectively. The registers load and multiplexers are controlled by the signals Ii and Li for i = 1 and 2. The hidden layer shown in Figure 11a receives the two features computed for each IMF (eighth values in total). Then, they are weighted by the corresponding values Wi. The Wi registers contains eight different weighted values, one for each input. The weighted values for each input value are summed up and added sequentially to a bias value stored in a LUT (LUT Bias). The result obtained by the previous operation is employed to activate the respective output Yi by means of a log-sigmoid (LS) transfer function, implemented as a LUT (LUT log-sig). Similarly, the output layer shown in Figure 11b repeats the same process, which employs the previous outputs Y1, Y2, …, Y15 provided by the hidden layer as inputs to its four outputs or neurons, estimating the outputs Z1, Z2, …, Z4 that define HLT, HBB, 1BB and 2BB conditions through a threshold comparison of 0.5. Thus, the display module shows the induction motor condition according to the activated output neuron.

5. Results

This section presents the performance results for the CEEMD processor and the results obtained for the detection and classification of the treated faults into the induction motor.

5.1. FPGA Results

The proposed FPGA implementation for monitoring the induction motor condition employs 18-bit fixed-point arithmetic. This type of numeration produces truncation and rounding errors. Hence, for evaluating and comparing its performance, the results obtained by using the proposal (fixed-point) and Matlab software (floating-point), respectively, are computed by using the same measured data sets. Table 1 presents the results obtained of the comparison between the FPGA-based proposal (fixed-point) and Matlab software (floating-point), where the mean, the standard deviation, and the maximum value for the relative errors of the 20 tested for each condition are presented, resulting that the worst values are obtained for the 1BB condition (highlighted in bold). In all the cases, the 1% of error is never exceeded, demonstrating its accuracy and effectiveness.
Table 2 resumes the resources employed by the FPGA-based monitoring system as well as the number of clock cycles required by the main structures to carry out their calculation. It is important to mention that the time or duration employed by the CEEMD depends on the signal characteristics; hence, the number of cycles presented for the CEEMD corresponds to an average of the performed tests. The employed platform is the ALTERA DE2 CYCLONE IV E running at 50 MHz.
Figure 12a shows the FPGA results for the extracted IMFs using the CEEMD processor. As can be observed, the IMFs extracted show the evolution of the characteristic LSB frequency component during the startup transient of a motor with a broken rotor bar. The effectiveness in this step facilitates the application of any artificial intelligence-based method. The software used for the VHSIC Hardware Description Language (VHDL) coding, where VHSIC stands for very high speed integrated circuit, and its simulation is in ModelSim-Intel FPGA. This language is standardized by the IEEE, which allows its implementation and portability in different FPGA platforms such as Altera Quartus and Xilinx ISE, among others. Further, VHDL code allows the development of IP cores (IP stands for intellectual property). Figure 12b shows the FPGA platform and a result of “One Broken Bar 1BB”.
An important parameter to know the performance of the CEEMD implementation is the computation time required to compute a full input data set with N samples. Therefore, remembering that the sifting process uses the spline cubic to calculate the envelope of the signal, the spline cubic module needs that the data set is fully acquired to avoid edge errors that affect the effectiveness of the decomposition. Hence, once the dataset is fully acquired, the N points of the envelope are obtained, resulting in 2NTm clock cycles for calculating a candidate IMF, where Tm represents the number of clock cycles necessary for calculating each sample. The time required by Tm is limited by two consecutive sequential division operations, which take 168 clock cycles, indicating that for its hardware implementation the sampling frequency can reach a peak of 297,619 samples/s for a 50 MHz master clock. For the designed sifting process, the measured signal has a log of 1024 samples, requiring 173,132 clock cycles or 3.46 ms at 50 MHz to complete a sifting process iteration. The number of interactions of the sifting process used by the CEEMD method depends on the complexity of the signal; for the signals treated in this work, the average number of iterations was 31,140, requiring 107.74 s to calculate five true IMFs.
Results shown in Table 2 indicate the viability of implementing the CEEMD structure as a low-cost SoC solution for condition monitoring of induction motors since the resources used in the FPGA do not exceed the 25% of the available ones; in fact, a smaller FPGA could be used. Furthermore, the FPGA-based proposed methodology takes 5,391,415,057 clock cycles for estimating the induction motor condition, which means that the implementation is 1.4 times faster than the Matlab software implementation, which takes 151.8 s on a 2.2 GHz Intel Core i7 processor.

5.2. Fault Diagnosis

The testing set composed by 80 real trials, i.e., 20 trials for each induction motor condition (HLT, HBB, 1BB, and 2BB), was analyzed using the proposed methodology. Once the five IMFs are obtained (see Figure 3), the Shannon entropy and energy are computed. Table 3 and Table 4 show the statistic values, mean (µ) and standard deviation (s), for the trials of each induction motor condition, respectively. These values are used to train and validate the FFNN as described in Section 4.4. After training, the FFNN is tested with the dataset composed by the 80 real tests, the obtained results are shown in Table 5 as a confusion matrix. It is observed that 20 trials of the HLT condition are classified as 20 trials of the HLT condition; therefore, it has an effectiveness of 100%. On the other hand, for the 20 trials of the HBB condition, the system classifies two trials as 1BB and 18 trials as HBB; so, it has an effectiveness of 90%. For the 1BB condition, 19 trials are classified as 1BB and one trial as HBB, which represents an effectiveness of 95%. It is important to mention if any false positive is obtained. With the above-mentioned results, a total average effectiveness of 96.25% is obtained, indicating that the proposed methodology and its FPGA implementation can be a reliable condition monitoring system.

6. Conclusions

This paper presents the FPGA implementation for the CEEMD method and its use as a SoC solution for condition monitoring of broken bars (HBB, 1BB, and 2BB) in induction motors. The overall fault detection system consists of the CEEMD method, the feature extraction module to calculate the entropy and energy of each IMF, and the FFNN to perform an automatic diagnosis.
Classification results show an average effectiveness superior to 96%, indicating that the proposal is a reliable solution for broken bar detection in induction motors, even in an early fault stage since the HBB condition can be diagnosed with an effectiveness of 100%.
Regarding the proposed FPGA structure, obtained results shown a high accuracy (relative error < 1% between floating-point and fixed-point formats) and a minimum resource usage (<25%), which makes it a suitable and attractive SoC solution for condition monitoring systems; in fact, a smaller FPGA can be used, reducing costs and power consumption. As VHDL code is used, the hardware structures are portable between FPGA platforms and vendor-independent since they are completely developed by the authors.
It is important to mention that the sifting module implements the spline cubic interpolation, i.e., no simplification in the CEEMD method is carried out; therefore, the proposed implementation can be used for the analysis of any signal in many other applications. It should be pointed out that the IP core developed can be integrated into other methodologies and systems with the aim to develop SoC solutions for different applications.

Author Contributions

Conceptualization, D.C.-M. and M.V.-R.; Hardware Implementation, D.C.-M. and M.V.-R.; Validation, M.V.-R. and J.P.A.-S.; Supervision; D.C.-M., M.V.-R., A.G.-P. and J.P.A.-S.; Original Draft Preparation, D.C.-M., M.V.-R., A.G.-P. and J.P.A.-S.; Review and Editing, D.C.-M., M.V.-R., A.G.-P. and J.P.A.-S.

Funding

This research received no external funding.

Acknowledgments

This work was supported by SEP PFCE-2019 Universidad de Guanajuato grant.

Conflicts of Interest

The authors declare no conflict of interest.

References

  1. Rangel-Magdaleno, J.D.J.; Romero-Troncoso, R.D.J.; Osornio-Rios, R.A.; Cabal-Yepez, E.; Contreras-Medina, L.M. Novel methodology for online half-broken-bar detection on induction motors. IEEE Trans. Instrum. Meas. 2009, 58, 1690–1698. [Google Scholar] [CrossRef]
  2. Garcia-Perez, A.; Romero-Troncoso, R.J.; Cabal-Yepez, E.; Osornio-Rios, R.A.; Rangel-Magdaleno, J.D.J.; Miranda, H. Startup current analysis of incipient broken rotor bar in induction motors using high-resolution spectral analysis. In Proceedings of the SDEMPED 2011 8th IEEE Symposium Diagnostics Electrical Machines Power Electronics and Drives, Bologna, Italy, 5–8 September 2011; pp. 657–663. [Google Scholar]
  3. Kurek, J.; Osowski, S. Support vector machine for fault diagnosis of the broken rotor bars of squirrel-cage induction motor. Neural Comput. Appl. 2010, 19, 557–564. [Google Scholar] [CrossRef]
  4. da Silva, A.M.; Povinelli, R.J.; Demerdash, N.A.O. Rotor bar fault monitoring method based on analysis of air-gap torques of induction motors. IEEE Trans. Ind. Inform. 2013, 9, 2274–2283. [Google Scholar] [CrossRef]
  5. Nemec, M.; Ambrožič, V.; Fišer, R.; Nedeljković, D.; Drobnič, K. Induction Motor Broken Rotor Bar Detection Based on Rotor Flux Angle Monitoring. Energies 2019, 12, 794. [Google Scholar] [CrossRef]
  6. Faiz, J.; Ghorbanian, V.; Ebrahimi, B.M. A survey on condition monitoring and fault diagnosis in line-start and inverter-fed broken bar induction motors. In Proceedings of the PEDES 2012 IEEE International Conference Power Electronics Drives Energy Systems, Bengaluru, India, 16–19 December 2012; pp. 1–5. [Google Scholar] [CrossRef]
  7. Antonino-Daviu, J.; Riera-Guasp, M.; Pons-Llinares, J.; Park, J.; Lee, S.B.; Yoo, J.; Kral, C. Detection of broken outer cage bars for double cage induction motors under the startup transient. In Proceedings of the SDEMPED 2011 8th IEEE Symposium Diagnostics Electrical Machines Power Electron. Drives, Bologna, Italy, 5–8 September 2011; pp. 1–8. [Google Scholar]
  8. Wei, Y.; Shi, B.; Cui, G.; Yin, J. Broken rotor bar detection in induction motors via wavelet ridge. In Proceedings of the 2009 International Conference Measuring Technology Mechatronics Automatronics ICMTMA, Hunan, China, 11–12 April 2009; Volume 2, pp. 625–628. [Google Scholar] [CrossRef]
  9. Pineda-Sanchez, M.; Riera-Guasp, M.; Perez-Cruz, J.; Puche-Panadero, R. Transient motor current signature analysis via modulus of the continuous complex wavelet: A pattern approach. Energy Convers. Manag. 2013, 73, 26–36. [Google Scholar] [CrossRef]
  10. Riera-Guasp, M.; Antonino-Daviu, J.A.; Pineda-Sanchez, M.; Puche-Panadero, R.; Perez-Cruz, J. A general approach for the transient detection of slip-dependent fault components based on the discrete wavelet transform. IEEE Trans. Ind. Electron. 2008, 55, 4167–4180. [Google Scholar] [CrossRef]
  11. Kechida, R.; Menacer, A. DWT wavelet transform for the rotor bars faults detection in induction motor. In Proceedings of the 2011 2nd International Conference Electrical Power Energy Conversion System EPECS, Sharjah, UAE, 15–17 November 2011. [Google Scholar] [CrossRef]
  12. Daubechies, I.; Lu, J.; Wu, H.T. Synchrosqueezed wavelet transforms: An empirical mode decomposition-like tool. Appl. Comput. Harmon. Anal. 2011, 30, 243–261. [Google Scholar] [CrossRef] [Green Version]
  13. Kankar, P.K.; Sharma, S.C.; Harsha, S.P. Rolling element bearing fault diagnosis using wavelet transform. Neurocomputing 2011, 74, 1638–1645. [Google Scholar] [CrossRef]
  14. Manjula, M.; Sarma, A.V.R.S. Comparison of Empirical Mode Decomposition and Wavelet Based Classification of Power Quality Events. Energy Procedia 2012, 14, 1156–1162. [Google Scholar] [CrossRef] [Green Version]
  15. Antonino-Daviu, J.A.; Riera-Guasp, M.; Pineda-Sanchez, M.; Perez, R.B. A critical comparison between DWT and Hilbert-Huang-based methods for the diagnosis of rotor bar failures in induction machines. IEEE Trans. Ind. Appl. 2009, 45, 1794–1803. [Google Scholar] [CrossRef]
  16. Antonino-Daviu, J.; Aviyente, S.; Strangas, E.G.; Riera-Guasp, M.; Roger-Folch, J. An EMD-based invariant feature extraction algorithm for rotor bar condition monitoring. In Proceedings of the SDEMPED 2011 8th IEEE Symposium Diagnostics Electrical Machines Power Electronics Drives, Bologna, Italy, 5–8 September 2011; pp. 669–675. [Google Scholar]
  17. Valles-Novo, R.; Rangel-Magdaleno, J.D.J.; Ramirez-Cortes, J.M.; Peregrina-Barreto, H.; Morales-Caporal, R. Empirical Mode Decomposition Analysis for Broken-Bar Detection on Squirrel Cage Induction Motors. IEEE Trans. Instrum. Meas. 2015, 64, 1118–1128. [Google Scholar] [CrossRef]
  18. Hong, X.Z.; Yong, H.S. Method of EMD and ZOOM-FFT to Detect the Broken Bars Fault in Induction Motor. In Proceedings of the 2010 International Conference on Electrical Machines and Systems, Incheon, Korea, 10–13 October 2010. [Google Scholar]
  19. Camarena-Martinez, D.; Osornio-Rios, R.A.; Romero-troncoso, R.D.J.; Garcia-Perez, A. Fused Empirical Mode Decomposition and MUSIC algorithms for detecting multiple combined faults in induction motors. J. Appl. Res. Technol. 2015, 13, 160–167. [Google Scholar] [CrossRef]
  20. Wang, L.; Vai, M.I.; Mak, P.U.; Ieong, C.I. Hardware-Accelerated Implementation of EMD Hardware and Software Co-design Evalution for HHT; University of Macau: Macau, China, 2010; pp. 912–915. [Google Scholar]
  21. Lee, S.; Member, M.; Shyu, K.; Lee, P. Hardware Implementation of EMD Using DSP and FPGA for Online Signal Processing. IEEE Trans. Ind. Electr. 2011, 58, 2473–2481. [Google Scholar] [CrossRef]
  22. Hong, Y.Y.; Bao, Y.Q. FPGA Implementation for Real-Time Empirical Mode Decomposition. IEEE Trans. Instrum. Meas. 2012, 61, 1–10. [Google Scholar] [CrossRef]
  23. Camarena-Martinez, D.; Valtierra-Rodriguez, M.; Garcia-Perez, A.; Osornio-Rios, R.A.; Romero-Troncoso, R.D.J. Empirical Mode Decomposition and Neural Networks on FPGA for Fault Diagnosis in Induction Motors. Sci. World J. 2014, 1–17. [Google Scholar] [CrossRef] [PubMed]
  24. Chen, P.Y.; Lai, Y.C.; Zheng, J.Y. Hardware Design and Implementation for Empirical Mode Decomposition. IEEE Trans. Ind. Electron. 2016, 63, 3686–3694. [Google Scholar] [CrossRef]
  25. Zheng, J.; Cheng, J.; Yang, Y. Partly ensemble empirical mode decomposition: An improved noise-assisted method for eliminating mode mixing. Signal Process. 2014, 96, 362–374. [Google Scholar] [CrossRef]
  26. Flandrin, P.; Torres, E.; Colominas, M.A. A Complete Ensemble Empirical Mode Decomposition Laboratorio de Se˜ nales y Din’ amicas no Lineales, Universidad Nacional de Entre R´ Laboratoire de Physique (UMR CNRS 5672); Ecole Normale Sup erieure de Lyon: Lyon, France, 2011; pp. 4144–4147. [Google Scholar]
  27. Satija, U.; Ramkumar, B.; Manikandan, M.S. Automated ECG noise detection and classification system for unsupervised healthcare monitoring. IEEE J. Biomed. Health Inform. 2018, 22, 722–732. [Google Scholar] [CrossRef]
  28. Hassan, A.R.; Bhuiyan, M.I.H. Computer-aided sleep staging using Complete Ensemble Empirical Mode Decomposition with Adaptive Noise and bootstrap aggregating. Biomed. Signal Process. Control 2016, 24, 1–10. [Google Scholar] [CrossRef]
  29. Das, A.B.; Bhuiyan, M.I.H. Discrimination of focal and non-focal EEG signals using entropy-based features in EEMD and CEEMDAN domains. In Proceedings of the 2016 9th International Conference on Electrical and Computer Engineering (ICECE), Dhaka, Bangladesh, 20–22 December 2017; pp. 435–438. [Google Scholar] [CrossRef]
  30. Guarascio, M.; Puthusserypady, S. Automatic minimization of ocular artifacts from electroencephalogram: A novel approach by combining Complete EEMD with Adaptive Noise and Renyi’s Entropy. Biomed. Signal Process. Control 2017, 36, 63–75. [Google Scholar] [CrossRef]
  31. Bian, J.; Wang, P.; Mei, Q.; Lei, M. Fault Detection of Rolling Bearings through Vibration Analysis via the hybrid CEEMD-EMD Approach. In Proceedings of the 2014 Prognostics and System Health Management Conference (PHM-2014 Hunan), Zhangjiajie, China, 24–27 August 2014; pp. 245–250. [Google Scholar]
  32. Abdelkader, R.; Kaddour, A.; Derouiche, Z.; Bendiabdellah, A. Rolling Bearing Fault Diagnosis based on an Improved Denoising Method Using the Complete Ensemble Empirical Mode Decomposition and the Optimized Thresholding Operation. IEEE Sens. J. 2018, 18, 7166–7172. [Google Scholar] [CrossRef]
  33. Lee, C.; Huang, K.; Hsieh, Y.; Chen, P. Optimal Intrinsic Mode Function Based Detection of Motor Bearing Damages. Appl. Sci. 2019, 9, 2587. [Google Scholar] [CrossRef]
  34. Camarena-Martinez, D.; Valtierra-Rodriguez, M.; Perez-Ramirez, C.A.; Amezquita-Sanchez, J.P.; Romero-Troncoso, R.d.; Garcia-Perez, A. Novel Downsampling Empirical Mode Decomposition Approach for Power Quality Analysis. IEEE Trans. Ind. Electron. 2016, 63, 2369–2378. [Google Scholar] [CrossRef]
  35. Rangel-Magdaleno, J.D.J.; Peregrina-Barreto, H.; Ramirez-Cortes, J.M.; Member, S.; Gomez-Gil, P.; Morales-Caporal, R. FPGA-Based Broken Bars Detection on Induction Motors Under Different Load Using Motor Current Signature Analysis and Mathematical Morphology. IEEE Trans. Instrum. Meas. 2014, 63, 1032–1040. [Google Scholar] [CrossRef]
  36. Huang, N.E.; Zheng, S.; Long, S.R.; Wu, M.C.; Shih, H.H.; Zheng, Q.; Yen, N.C.; Tung, C.C.; Liu, H.H. The empirical mode decomposition and the Hilbert spectrum for nonlinear and non-stationary time series analysis. Proc. R. Soc. Lond. Ser. A Math. Phys. Eng. Sci. 1998, 454, 903–995. [Google Scholar] [CrossRef]
  37. Wu, Z.; Huang, N.E. Ensemble Empirical Mode Decomposition: A noise-assisted data analysis method. Adv. Adapt. Data Anal. 2009, 1, 1–41. [Google Scholar] [CrossRef]
  38. Panagiotou, P.A.; Arvanitakis, I.; Lophitis, N.; Antonino-Daviu, J.A.; Gyftakis, K.N. FEM approach for diagnosis of induction machines’ non-adjacent broken rotor bars by short-time Fourier transform spectrogram. J. Eng. 2019, 2019, 4566–4570. [Google Scholar] [CrossRef]
  39. Cabal-Yepez, E.; Valtierra-Rodriguez, M.; Romero-Troncoso, R.J.; Garcia-Perez, A.; Osornio-Rios, R.A.; Miranda-Vidales, H.; Alvarez-Salas, R. FPGA-based entropy neural processor for online detection of multiple combined faults on induction motors. Mech. Syst. Signal Process. 2012, 30, 123–130. [Google Scholar] [CrossRef]
  40. Mejia-Barron, A.; Valtierra-Rodriguez, M.; Granados-Lieberman, D.; Olivares-Galvan, J.C.; Escarela-Perez, R. The application of EMD-based methods for diagnosis of winding faults in a transformer using transient and steady state currents. Measurement 2018, 117, 371–379. [Google Scholar] [CrossRef]
  41. Liu, R.; Yang, B.; Zio, E.; Chen, X. Artificial intelligence for fault diagnosis of rotating machinery: A review. Mech. Syst. Signal Process. 2018, 108, 33–47. [Google Scholar] [CrossRef]
  42. Liu, Y.; Bazzi, A.M. A review and comparison of fault detection and diagnosis methods for squirrel-cage induction motors: State of the art. ISA Trans. 2017, 70, 400–409. [Google Scholar] [CrossRef] [PubMed]
  43. Choudhary, A.; Goyal, D.; Shimi, S.L.; Akula, A. Condition Monitoring and Fault Diagnosis of Induction Motors: A Review. Arch. Comput. Methods Eng. 2018, 1–18. [Google Scholar] [CrossRef]
  44. Cabal-Yepez, E.; Saucedo-Gallaga, R.; Garcia-Ramirez, A.G.; Fernandez-Jaramillo, A.A.; Pena-Anaya, M.; Valtierra-Rodriguez, M. FPGA-based online detection of multiple-combined faults through information entropy and neural networks. In Proceedings of the 2010 International Conference on Reconfigurable Computing and FPGAs, Quintana Roo, Mexico, 13–15 December 2010; pp. 244–249. [Google Scholar]
Figure 1. Proposed methodology for fault diagnosis in induction motors. DAS—data-acquisition system; FPGA—field programmable gate array; CEEMD—complete ensemble empirical mode decomposition; FFNN—feed forward neural network.
Mathematics 07 00783 g001
Figure 2. Proposed flowchart for signal processing, showing a healthy induction motor condition. IMF—intrinsic mode function; HLT—healthy condition; HBB—half broken bar
Mathematics 07 00783 g002
Figure 3. IMFs obtained by CEEMD technique of (a) HLT, (b) HBB, (c) 1BB and (d) 2BB conditions.
Mathematics 07 00783 g003
Figure 4. Rotor conditions: (a) HLT, (b) HBB, (c) 1BB, and (d) 2BB.
Mathematics 07 00783 g004
Figure 5. FPGA processor.
Mathematics 07 00783 g005
Figure 6. CEEMD module.
Mathematics 07 00783 g006
Figure 7. Sifting module.
Mathematics 07 00783 g007
Figure 8. Entropy module.
Mathematics 07 00783 g008
Figure 9. Energy module.
Mathematics 07 00783 g009
Figure 10. FFNN architecture.
Mathematics 07 00783 g010
Figure 11. FFNN processor: (a) input and hidden layers, and (b) output layer.
Mathematics 07 00783 g011
Figure 12. FPGA results: (a) IMFs extraction and (b) Diagnosis.
Mathematics 07 00783 g012
Table 1. FPGA-based implementation performance.
Relative Error (%)
MeanStandard DeviationPeak Error
HLT0.31910.06130.4476
HBB0.38250.06030.4506
1BB0.45460.09600.7902
2BB0.23800.04220.3083
Table 2. Resource usage of the FPGA platform.
Resource UtilizationLogic ElementsMemory BitsRegistersMultipliersClock Cycles
CEEMD7089372,73640611225,391,330,480
Feature extraction4324340210284,340
FFNN141038153262237
Total8931378,89145971265,391,415,057
Available resources into the FPGA114,4803,983,312114,480532
Usage (%)7.809.514.0123.68
Table 3. Mean (µ) and standard deviation (σ) for the entropy values.
Entropy (µ, σ)
IMF2IMF3IMF4IMF5
HLT4.2517, 0.02674.4336, 0.06844.9468, 0.05655.0074, 0.0778
HBB5.0001, 0.03235.3585, 0.05805.1019, 0.04505.0424, 0.0829
1BB4.9307, 0.03135.9221, 0.04575.2000, 0.06334.7444, 0.0875
2BB4.9466, 0.04355.7725, 0.04525.3938, 0.04724.9526, 0.0737
Table 4. Mean (µ) and standard deviation (σ) for the energy values.
Energy (µ, σ)
IMF2IMF3IMF4IMF5
HLT0.1899, 0.03890.1022, 0.02530.1208, 0.02110.1267, 0.0248
HBB0.5026, 0.03020.2248, 0.04180.2050, 0.04590.1684, 0.0251
1BB0.4179, 0.03970.3772, 0.02940.1431, 0.02660.1164, 0.0324
2BB0.3767, 0.02820.4663, 0.04390.2222, 0.03030.1291, 0.0289
Table 5. Effectiveness percentage for the proposed methodology (Confusion matrix).
HLTHBB1BB2BBEffectiveness (%)
HLT20000100
HBB0182090
1BB0119095
2BB00020100
Average96.25