Abstract
The acceptance sampling plan and process capability index (PCI) are critical decision tools for quality control. Recently, numerous research papers have examined the acceptance sampling plan in combination with the PCI. However, most of these papers have not considered the aspect of rectifying inspections. In this paper, we propose a quality cost model of repetitive sampling to develop a rectifying acceptance sampling plan based on the one-sided PCI. This proposed model minimizes the total quality cost (TQC) of sentencing one lot, including inspection cost, internal failure cost, and external failure cost. In addition, sensitivity analysis is conducted to investigate the behavior of relevant parameters against TQC. To demonstrate the advantages of the proposed methodology, a comparison is implemented with the existing rectifying sampling plan in terms of TQC and average outgoing quality limit. This comparison reveals that our proposed methodology exhibits superior performance.
1. Introduction
The acceptance sampling plan and process capability index (PCI) are critical for quality control in manufacturing. The acceptance sampling plan is used to determine the acceptance or rejection of one lot based on information obtained from a sample and is applied extensively in the inspection of raw materials, semifinished products, final products, and shipments. Acceptance sampling plan can be divided into two types, attributes and variables sampling plans. In comparison with attributes sampling plan, variables sampling plans provide a less sample size to attain the same protection for producer and purchaser as well as give more information about lots. Such saving of sample size may be especially marked if inspection is destructive and the item is expensive [1,2,3]. By contrast, the PCI establishes the relationship between the actual manufacturing process performance and manufacturing specifications, which quantifies the effectiveness of the production process. This process capability information measures the effectiveness of the production process. Since the use of the PCI and acceptance sampling plans became popular, numerous papers have combined the two to develop variables in sampling plans for lot sentencing [4,5,6,7,8,9,10,11,12,13,14]. These papers are designed for different purposes or sampling skills. Yen et al. [4,12], Aslam et al. [6,13], Lee et al. [9], and Wu and Wang [11] used PCI to develop variables sampling plans which consider the quality of ongoing lot and preceding lots for lot sentencing. Wu and Liu [5] designed a single variables sampling plan based on process yield index. Wu et al. [7] proposed a PCI-based sampling plan for resubmitted lots which examined the situation where resampling is permitted on lots not accepted on original inspection. Yen et al. [8] and Fallah-Nezhad and Seifi [10] used PCI to design repetitive group sampling (RGS) plans for determination of lot.
Research combining acceptance sampling plans and the PCI has seldom focused on rectifying inspection, where 100% inspection will be carried out if one lot is rejected. Rectifying inspection is frequently implemented because of supplier monopoly or urgent buyer demand. Rectifying inspection means that if one lot is accepted, then only defective units detected from n units are replaced with nondefective units. However, if the lot is rejected, 100% of the remaining units are inspected and all defective units are replaced with nondefective units. After this process is completed, the lot rejected can be accepted. Three quality costs are incurred in rectifying inspection: inspection cost, internal failure cost, and external failure cost. Inspection cost occurs when products are inspected. Internal failure cost occurs when products fail to meet the minimum quality requirements prior to delivery to consumers. External cost occurs when products fail to meet the minimum quality requirements after delivery to consumers. More detailed information regarding quality cost is presented in the study conducted by Feigenbaum [14], Juarn [15], and Shank and Govindarajan [16].
These statements in the previous paragraph imply that the application of rectifying inspection is a practical problem for lot sentencing. Yen et al. [17] used a single sampling scheme to develop a rectifying sampling plan based on a one-sided PCI. However, other flexible sampling schemes, such as repetitive sampling [18], multiple dependent state sampling [19], and multiple dependent state repetitive sampling [20], have been presented with smaller sample sizes than that of the single sampling scheme. Therefore, we develop a rectifying sampling plan that has a lower total quality cost (TQC) than that reported by Yen et al. [17]. An exploration of the relevant literature reveals that research on rectifying sampling plans with flexible sampling schemes, such as repetitive group sampling, multiple dependent state sampling, and multiple dependent state repetitive sampling have not yet been conducted. Thus, in this paper, we apply a repetitive sampling scheme to design a rectifying sampling plan based on the concept of Yen et al. [17], which is called a repetitive rectifying sampling plan. The remainder of this paper is organized as follows. PCIs are introduced in Section 2. The design of our proposed sampling plan is presented in Section 3. Parameters for the rectifying sampling plan and the results of the sensitivity analysis are provided in Section 4. Finally, this paper’s conclusions are presented in Section 5.
2. Process Capability Indices
PCIs have been proposed to provide numerical measures of process performance in the manufacturing industry. These indices establish the relationship between the actual process performance and manufacturing specifications, and they have been a focus of recent research in statistical and quality assurance. The most popular capability indices, Cp [21], Cpk [22] and Cpm [23], are widely used in the manufacturing industry to evaluate process performance for cases with two-sided specification limits. The index Cp measures the overall process variation relative to specification tolerance. The index Cpk takes into account the magnitude of process variation as well as the degree of process centering. The index Cpm measures the ability of the process to cluster around the target, which reflects the degrees of the process target. The explicit forms of indices are defined as follows.
where USL and LSL are the upper and lower specification limits, respectively, T is the target value, is the process mean, and is the process standard deviation.
For normally distributed processes with one-sided specification limits, Cpu and Cpl indices are used to evaluate process capability where characteristics are smaller-to-better and larger-to-better, respectively, defined as follows.
From a practical perspective, the parameter or is typically unknown. Thus, we must use sample statistics to estimate it. For the estimations of the indices Cpu and Cpl, we consider the following natural estimators.
where is the sample mean and is the sample standard deviation. Chou and Owen [24] revealed that both and are noncentral t distributions with n − 1 degrees of freedom and noncentral parameter (). For convenience of presentation, both Cpu and Cpl are denoted as CS in the subsequent sections.
3. Proposed Sampling Plan
In this section, we will describe the design of proposed sampling plan whose relevant contents are presented as follows.
3.1. Procedure and Probability of Acceptance of the Repetitive Sampling Plan Based on the One-Sided PCI
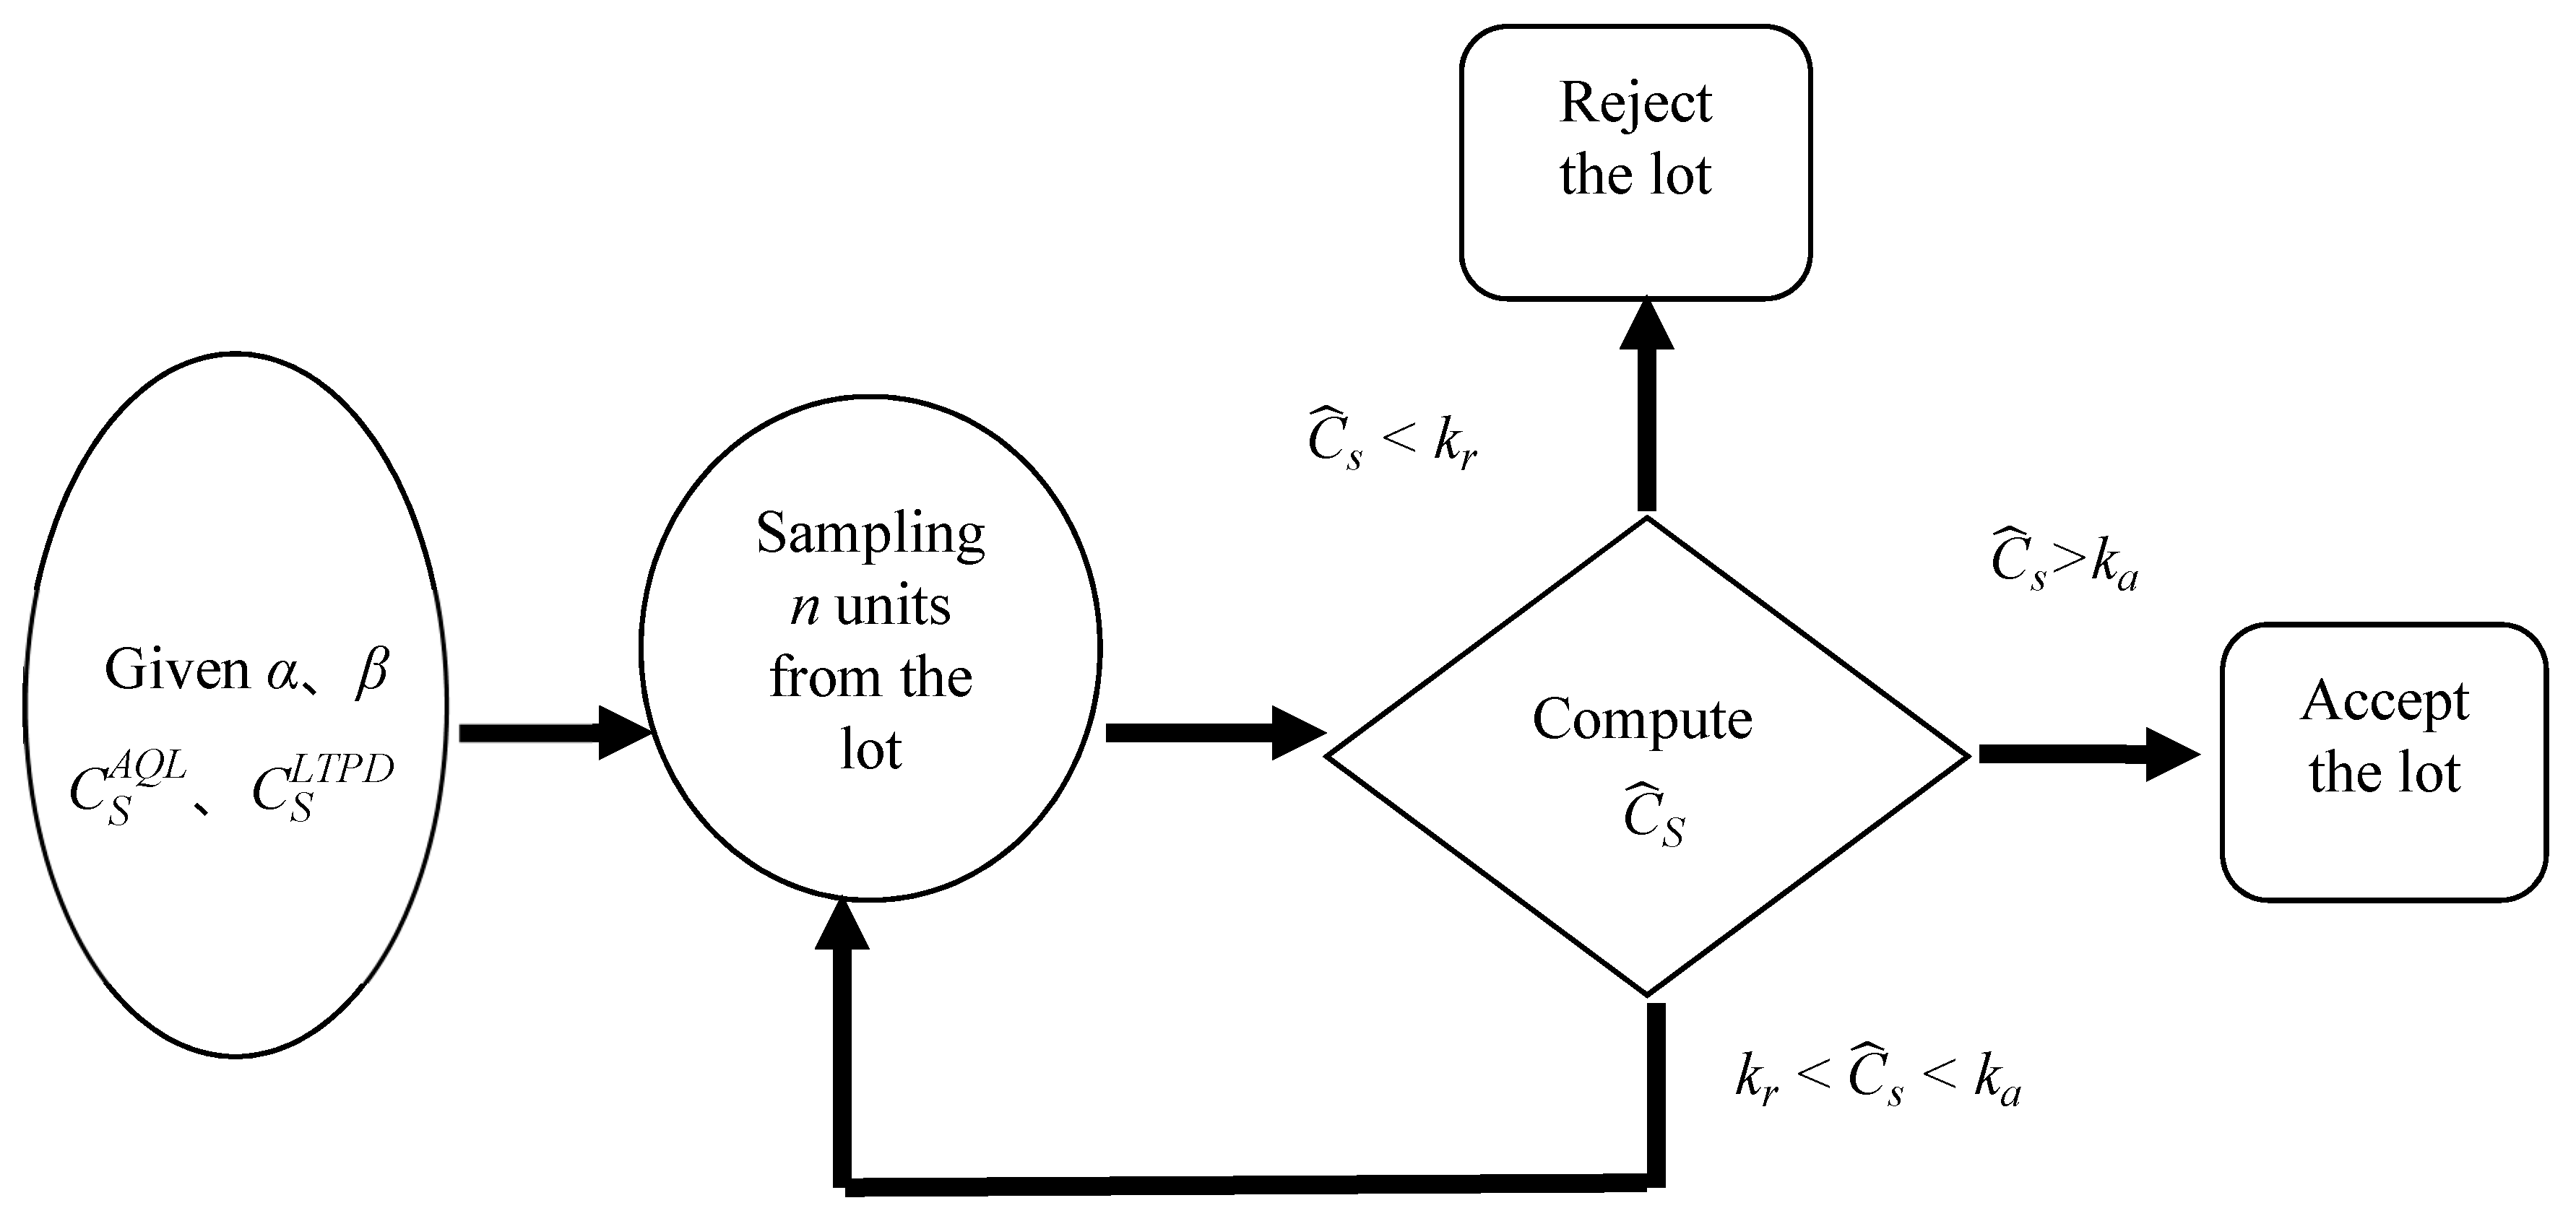
According to Sherman [18], the procedure of a repetitive sampling plan based on the one-sided PCI can be stated as follows.
Step 1: Determine the producer’s risk α, the consumer’s risk β, and the corresponding process capability requirements ( and ).
Step 2: Obtain a random sample of size n (>1) and compute .
Step 3: Formulate a decision on the lot as follows.
- (1)
- Accept the lot if > ka.
- (2)
- Reject the lot if < kr.
- (3)
- Otherwise, repeat Step 2 by obtaining a new sample of size n.
Figure 1 presents a flow chart of a repetitive sampling plan based on the PCI.
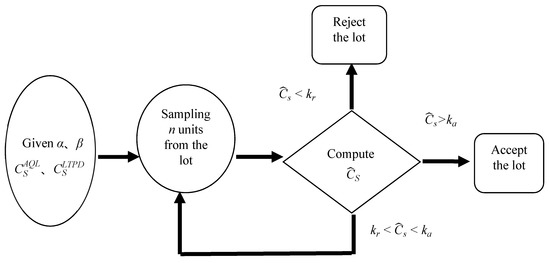
Figure 1.
Flow chart of a repetitive sampling plan based on CS.
According to Yen et al. [8], the probability of acceptance of repetitive sampling based on one-sided PCI can be expressed as
where 1 − − , and is a noncentral t distribution with n − 1 degrees of freedom and noncentral parameter .
3.2. Derivation of Relevant Indices for the TQC Model
With reference to Yen et al. [17], the quality cost model, , is adopted in this study. The TQC is a total quality cost including total inspection cost, total internal failure cost and total external failure cost while implementing the rectifying inspection, of which total inspection cost is equal to , total internal failure cost is equal to and total external failure cost is equal to . Under repetitive sampling, the average total inspection (ATI), , , and average outgoing quality (AOQ) of rectifying inspection can be derived respectively as follows.
3.3. Mathematical Model of the Proposed Sampling Plan
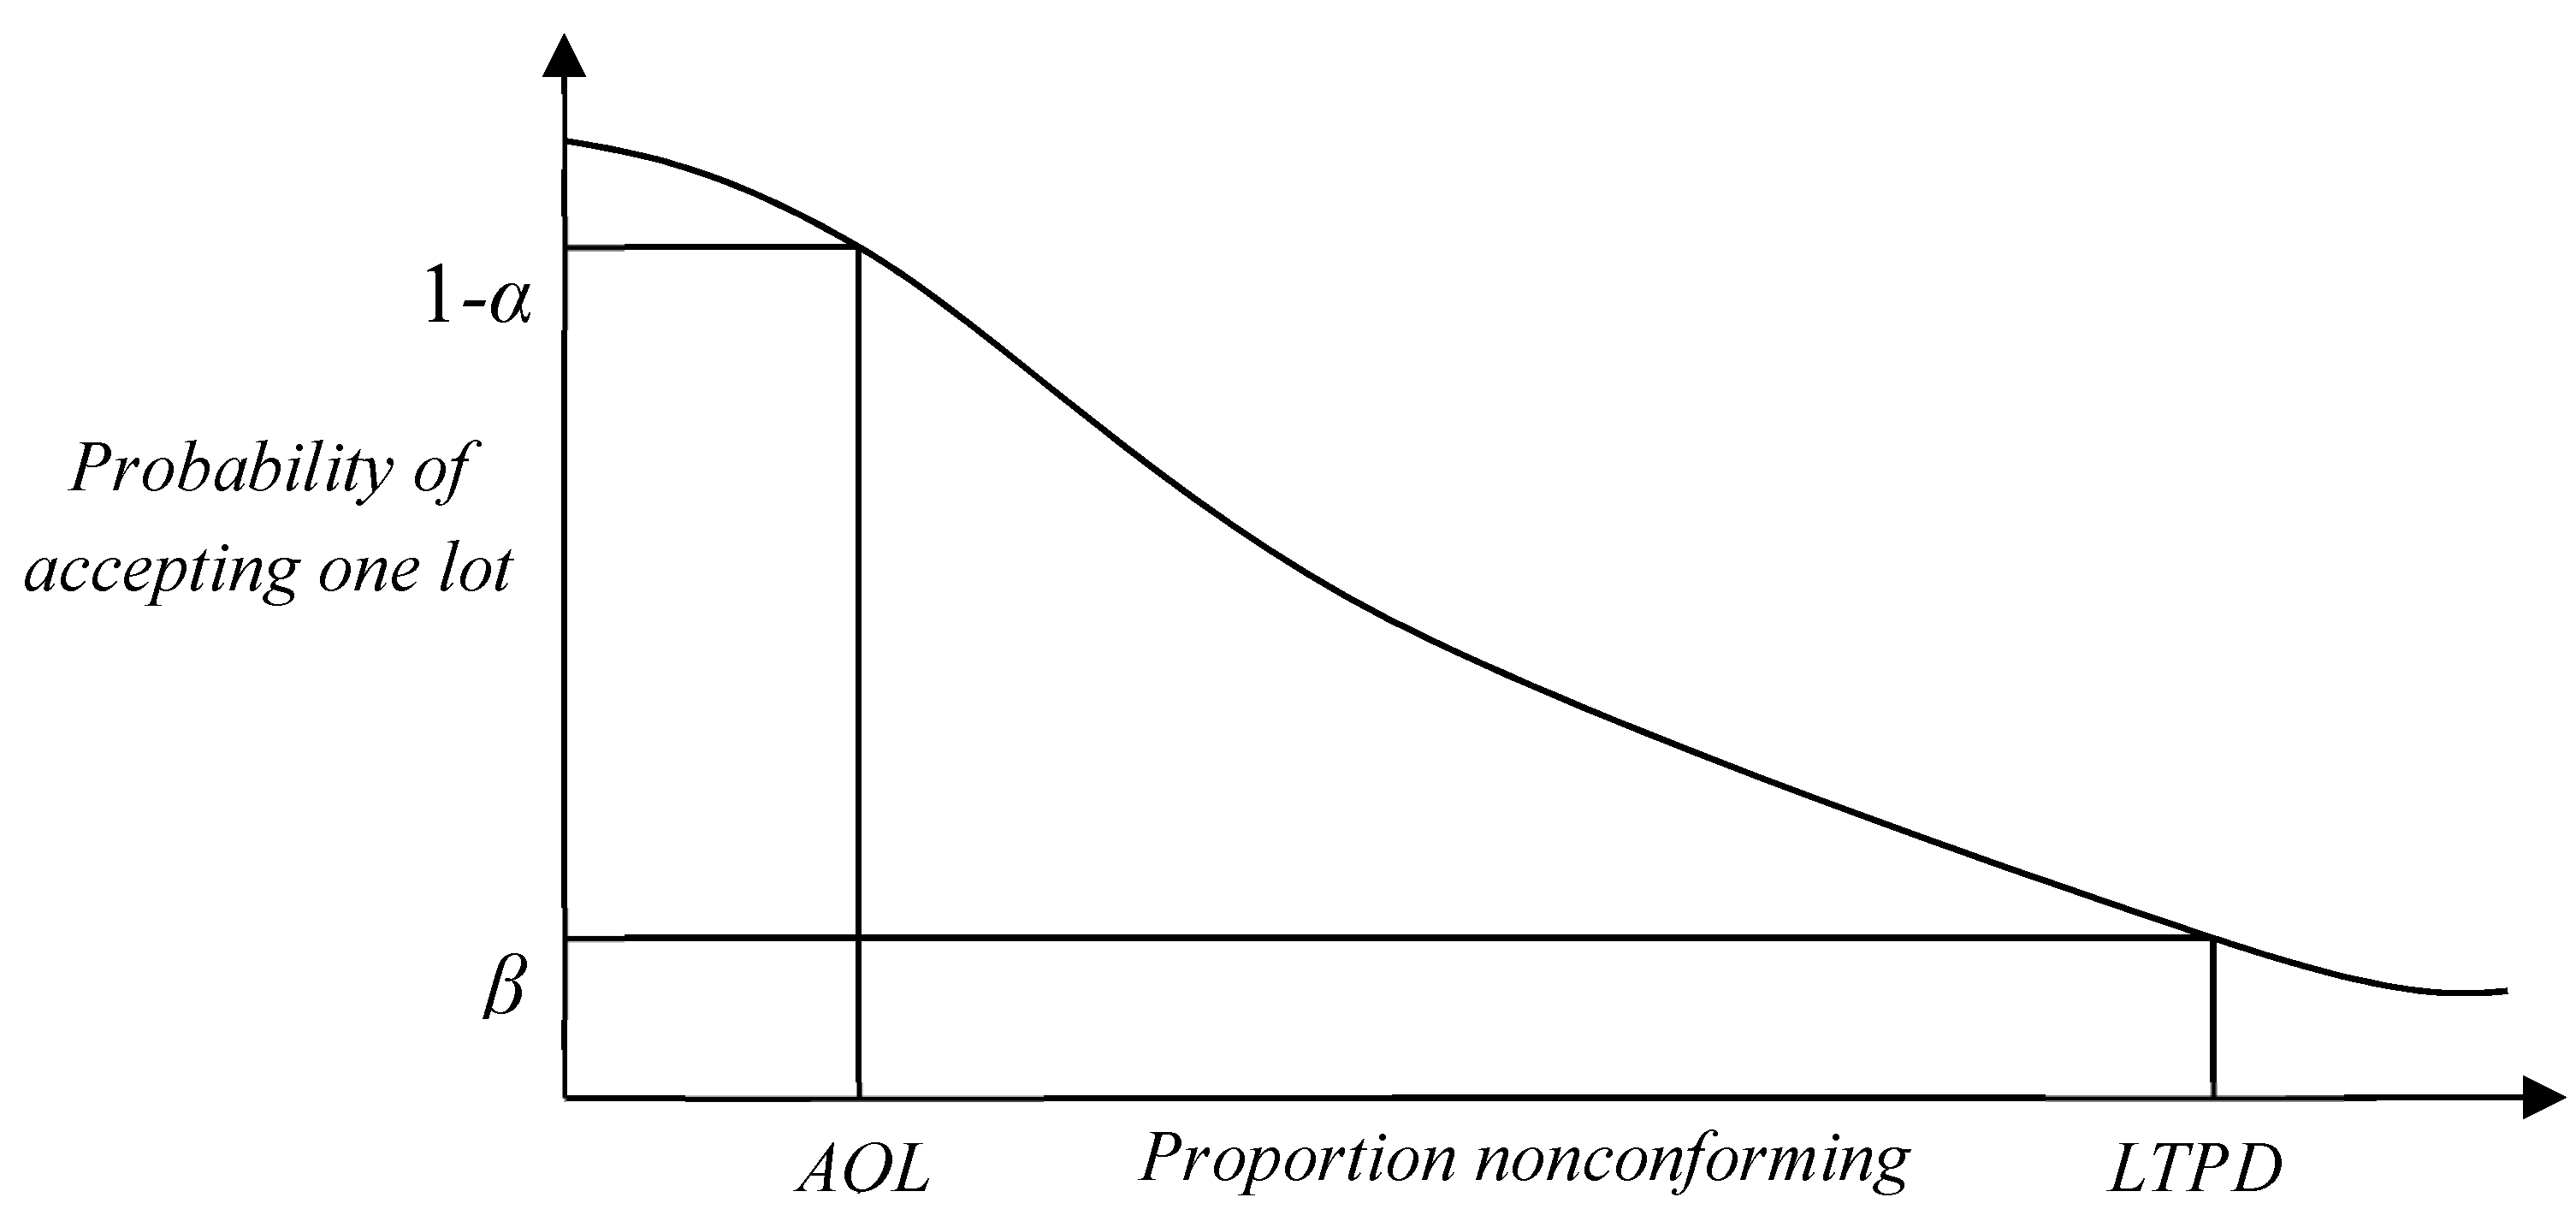
To evaluate the performance of the sampling plan, the operating characteristic (OC) curve is used to exhibit the discriminatory power. The OC curve plots the probability of accepting one lot versus the various proportion nonconforming. A typical OC curve is depicted in Figure 2. A supplier typically focuses on a specific product quality level, which is termed acceptable quality level (AQL), with a high probability 1 − α of accepting a lot. By contrast, a buyer typically focuses on a point at the other end of the OC curve that is termed lot tolerance percent defective (LTPD), with a low probability β of accepting a lot. Thus, a well-designed sampling plan should provide a probability of at least 1 − α of accepting a lot if the product quality level achieves AQL and a probability of no more than β if the level of the product quality is at the LTPD level. As such, the OC curve of the acceptance sampling plan passes through the two designated points (AQL, 1 − α) and (LTPD, β). To construct a PCI-based acceptance sampling plan, the corresponding two designated points of OC would be (, 1 − α) and (, β).
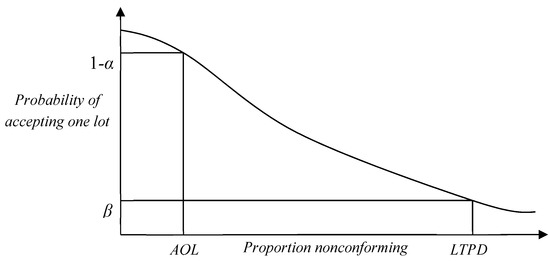
Figure 2.
Conventional OC curve.
Consequently, the proposed sampling plan is developed based on the minimization of TQC while satisfying the two points of the OC curve. Therefore, a mathematical model of a repetitive rectifying sampling plan based on the one-sided PCI can be constructed as follows.
Based on Equations (1)–(4), the mathematical model can be expressed as follows.
4. Analysis and Discussion
In this section, we provide numerical examples to illustrate the performance of the proposed sampling plan based on Equations (6)–(8) compared with that reported by Yen et al. [17].
The parameters of sampling plan and AOQ graph
For illustration, the relevant parameters of the numerical example are set at N = 1000, = 1.33, = 1.0, CS = 1.165, Ci = 10, Cif = 20, and Cef = 50. The sample sizes, critical values, and TQC for both sampling plans with various combinations of α and β are summarized in Table 1. From results in Table 1, we observe the following.

Table 1.
Parameters of the rectifying sampling plans and their corresponding total quality cost (TQC).
- (i)
- The parameters of the two sampling plans are determined by consumer risk β instead of producer risk α.
- (ii)
- For the two sampling plans, the sample size and the acceptance value both reveal a decreasing trend when consumer risk β increases along with the fixed producer risk. Also, the sample size number of the repetitive rectifying sampling plan is significantly lower than that of the single rectifying sampling plan.
- (iii)
- When the producer risk α is fixed and the consumer risk β increases, the TQC variables of both sampling plans decrease; the TQC of the repetitive sampling plan is significantly lower than that of the single sampling plan for all combinations.
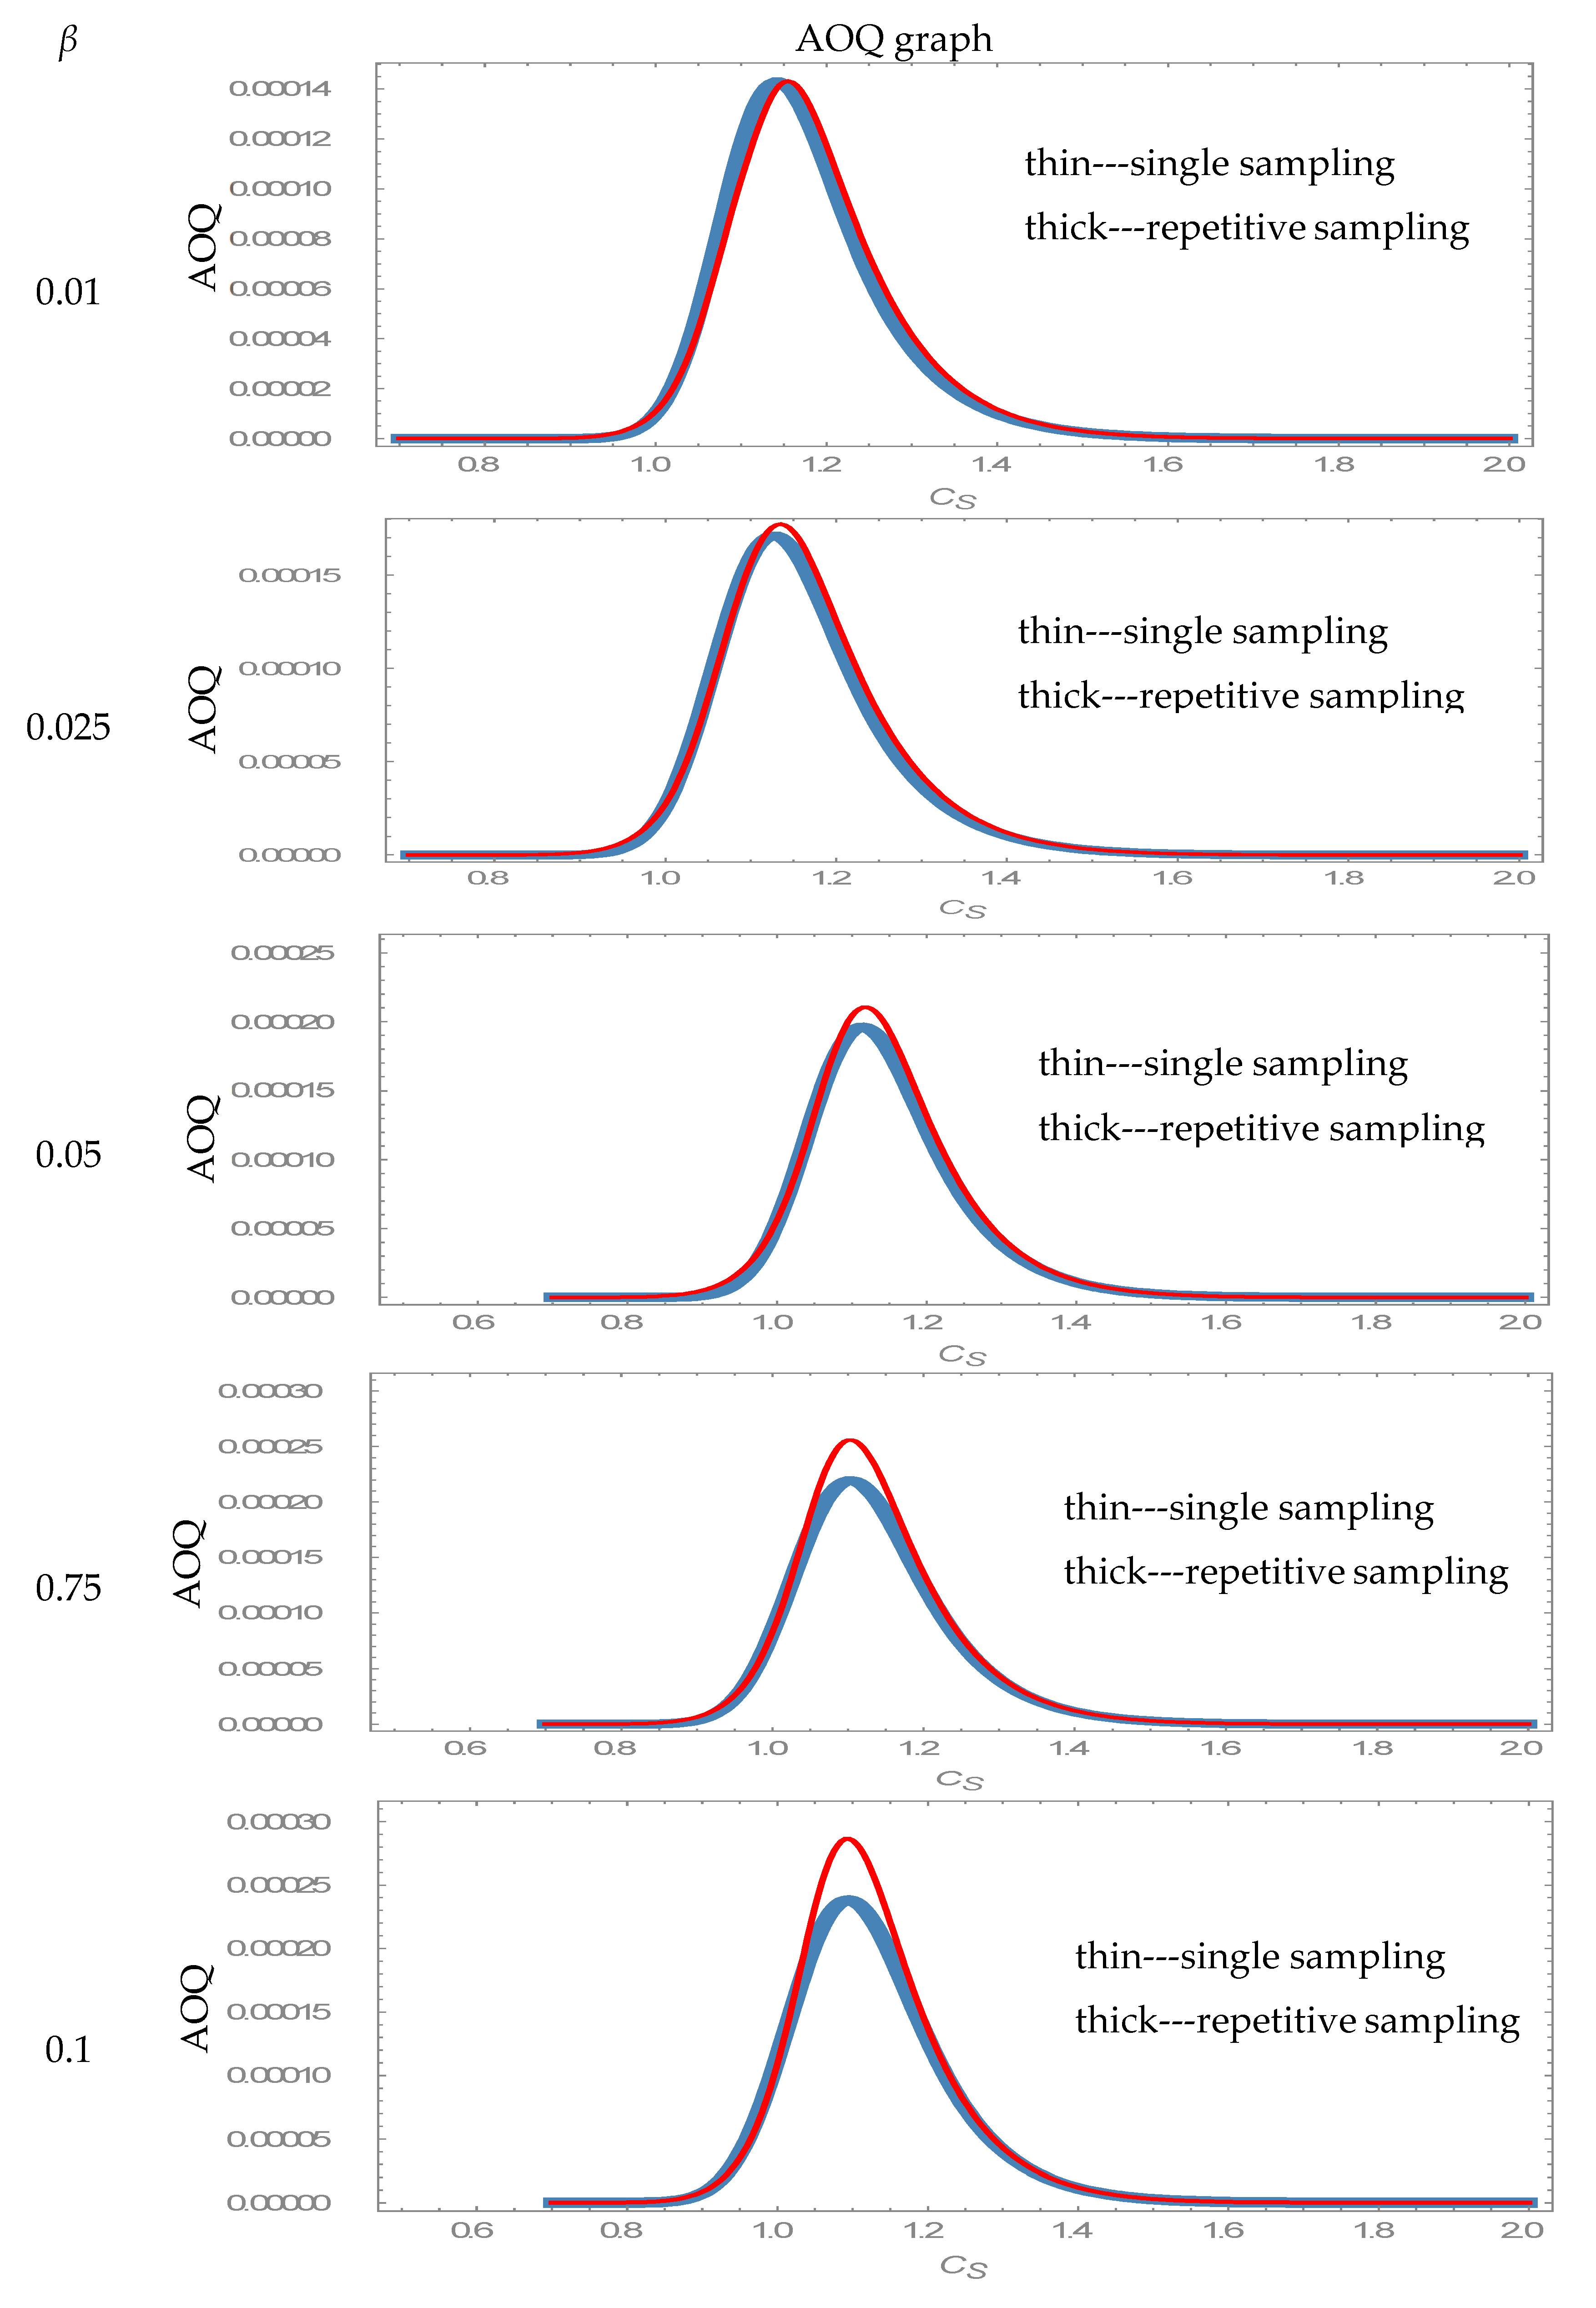
In addition, based on parameters in Table 1, we plot the graphs of AOQ for both of the sampling plans, as displayed in Figure 3. From Figure 3, we can see that the two sampling plans appear to be very similar, whereas the average outgoing quality limit (AOQL) of the repetitive sampling plan is slightly lower than that of the single sampling plan.
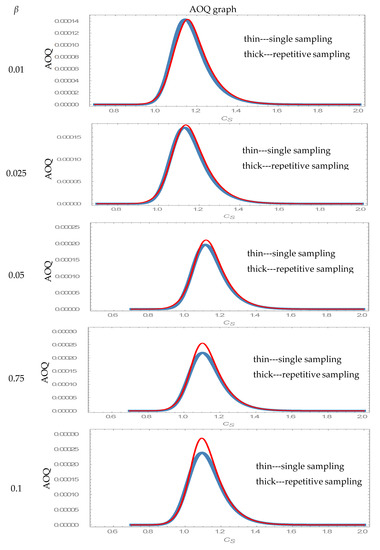
Figure 3.
Graphs of average outgoing quality (AOQ) versus Cs for the two rectifying sampling plans.
4.1. Sensitivity Analysis
To illustrate the sensitivity analysis, the values of the specific parameters are set at N = 1000, = 1.33, = 1.0, α = 0.05, and β = 0.1.
4.2. Sensitivity Analysis on TQC for Individual Parameters
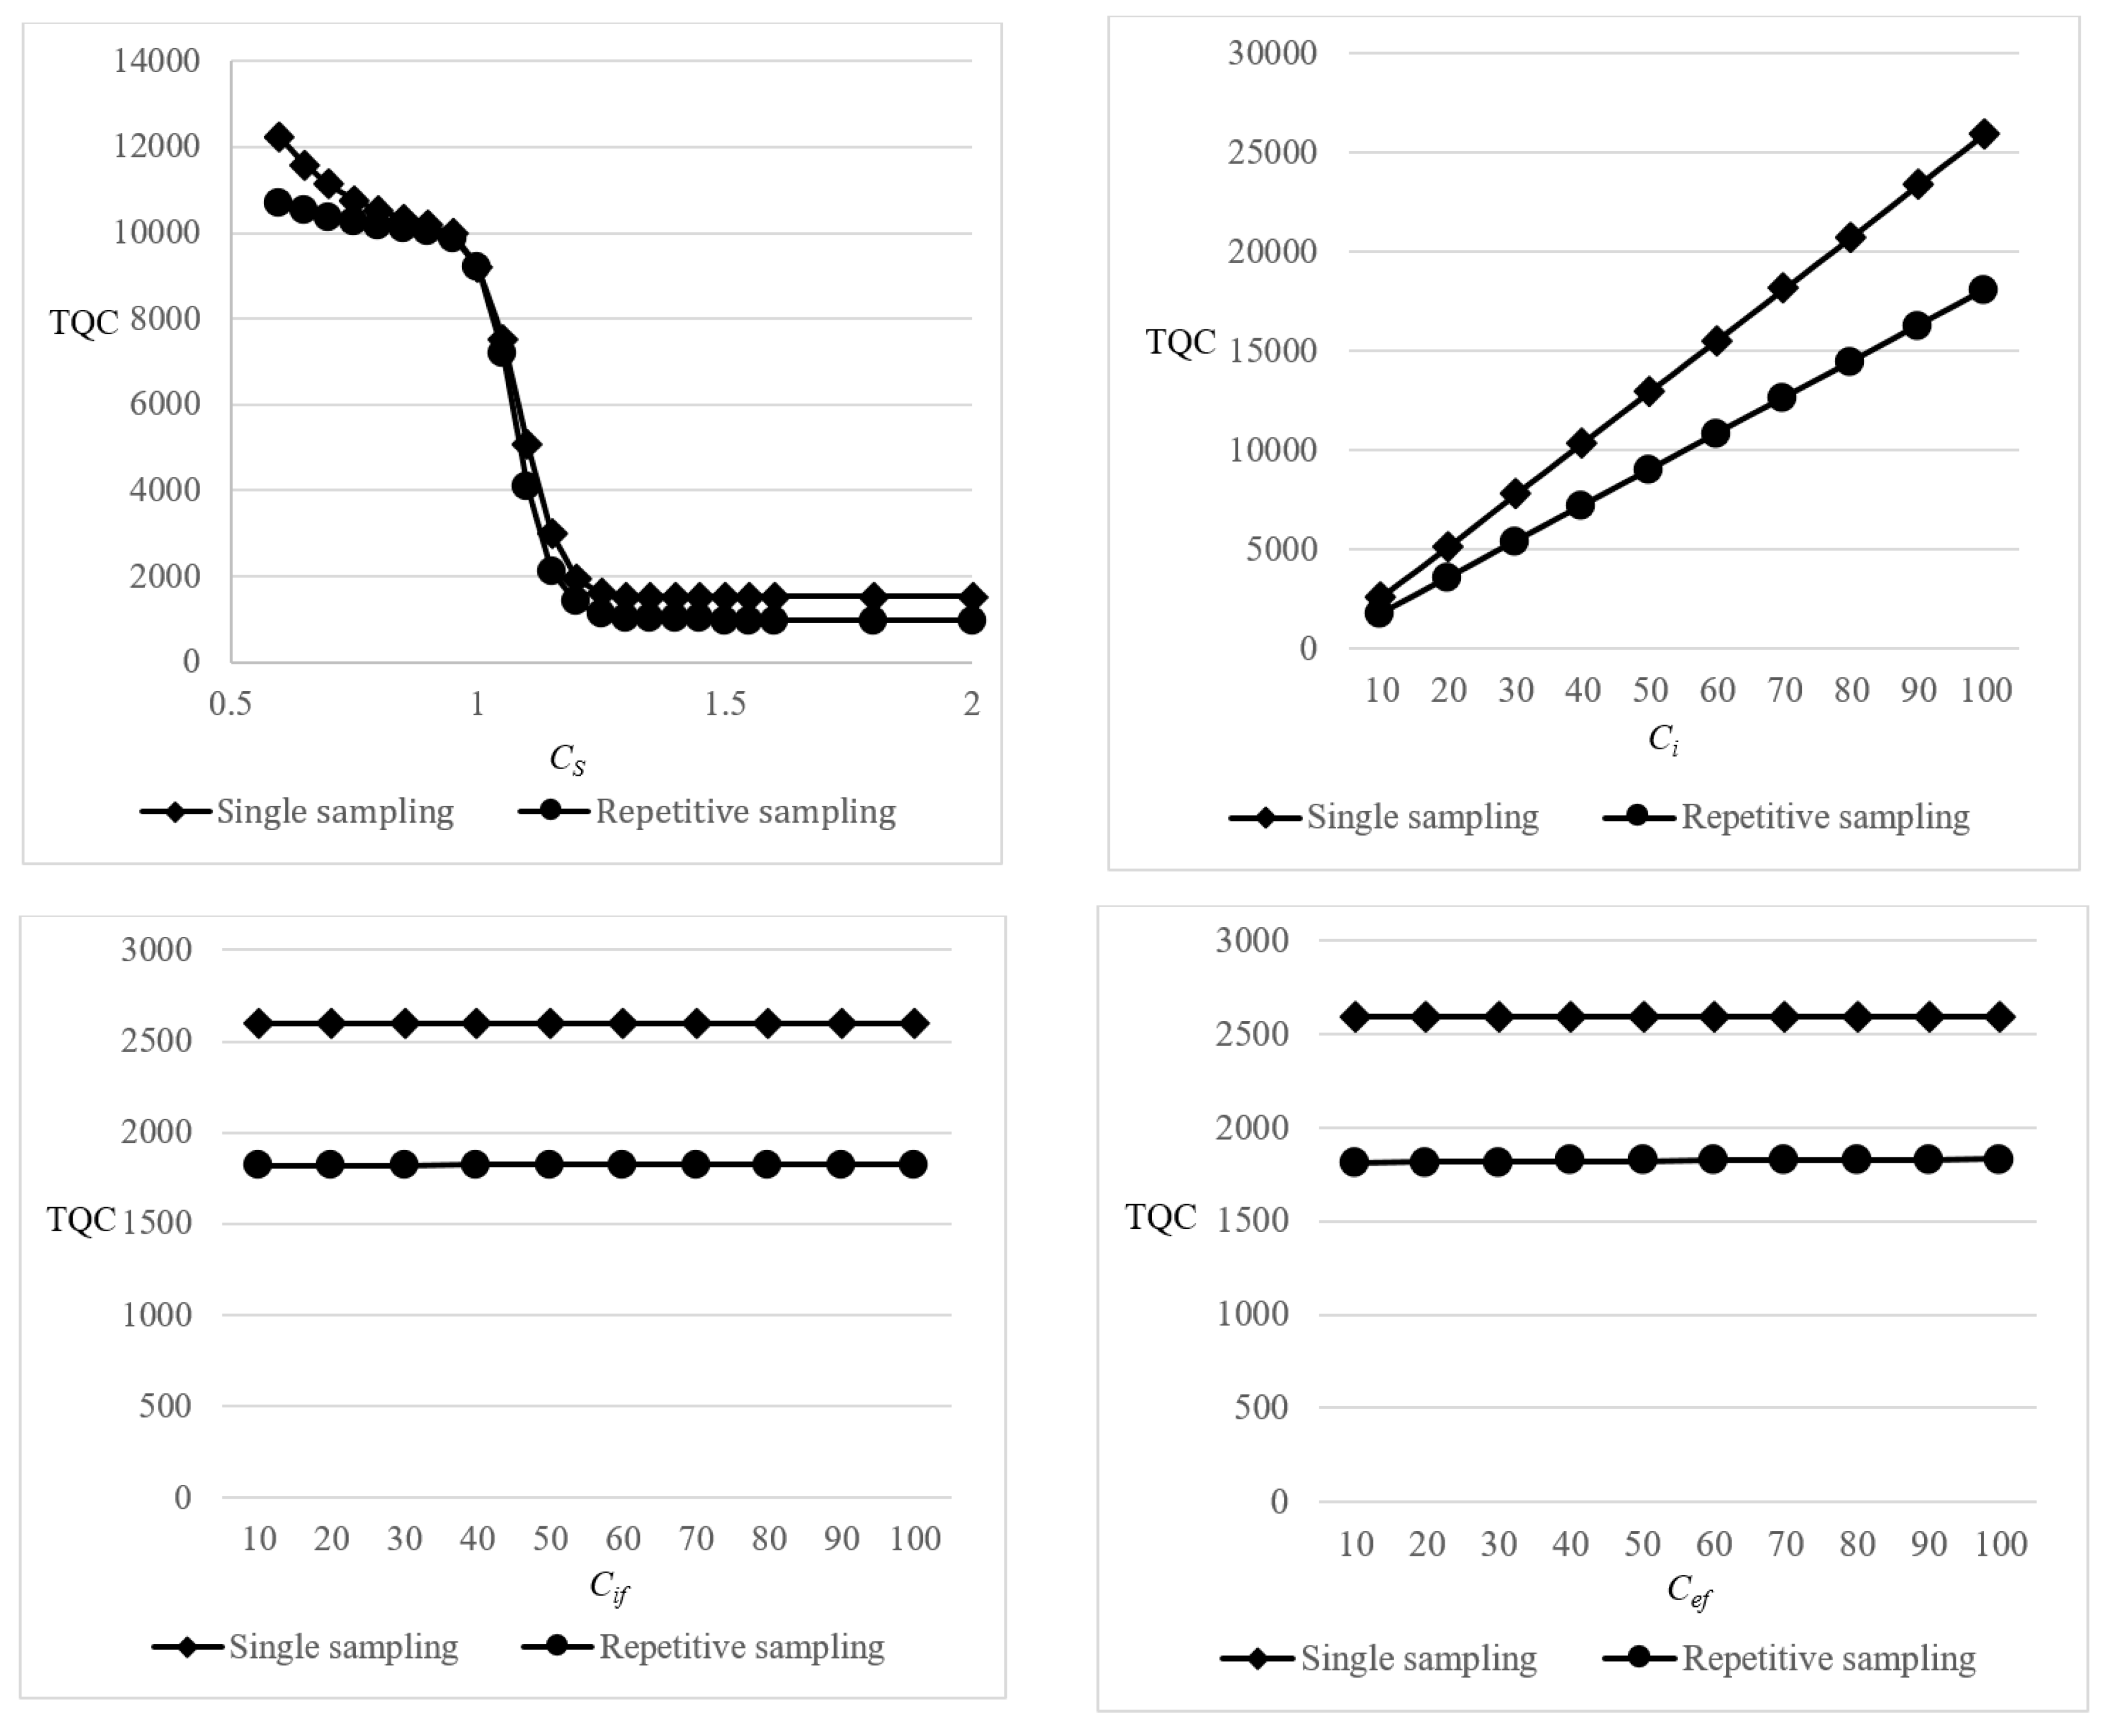
To investigate the behavior of the individual CS, Ci, Cif, and Cef against the TQC, sensitivity analysis is executed on TQC for individual parameters. Table 2 displays the sample size, critical values, and TQC of both sampling plans for CS = 0.6(0.05)1.6 with the given Ci = 10, Cif = 20, and Cef = 50. The results reveal that the sample size and critical values of the individual sampling plans are constant for all values of CS, and the TQC of the proposed methods are significantly lower than those of the single sampling plan for all cases. Table 3 displays the sample size, critical values, and TQC of the two sampling plans for Ci = 10(10)100, Cif = 10(10)100, and Cef = 10(10)100 with the given CS = 1.165. The results reveal that the sample size and critical values of the individual sampling plans are constant regardless of changes in the values of Ci, Cif, and Cef, and the TQC of the proposed method is significantly lower than that of the single sampling plan for all cases. Figure 4 displays TQC vs. Ci, Cif, and Cef based on results illustrated in Table 2 and Table 3. The outline reveals that the decline in TQC for the proposed method is more significant when the process capability is very effective (i.e., greater than 1.3) or very ineffective (i.e., less than 0.7). Moreover, the TQC seems to be primarily dependent on process capability and inspection cost, whereas internal failure cost and external failure cost have very little influence.
Table 2.
Sensitivity analysis of TQC for CS.
Table 3.
Sensitivity analysis of TQC for , Cif, and Cef.
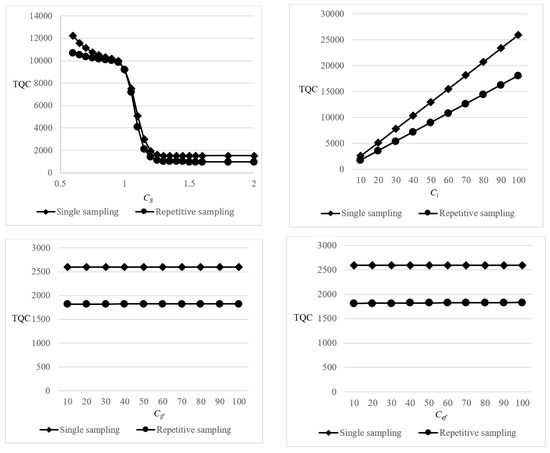
Figure 4.
Sensitivity analysis graphs for CS, Ci, Cif, and Cef.
4.3. Sensitivity Analysis on TQC for Simultaneous Changes in All Parameters
To further investigate the extent of the individual parameters’ effects on TQC, sensitivity analysis is implemented on TQC for simultaneous changes in CS, Ci, Cif, and Cef. We establish three levels for each factor (i.e., CS, Ci, Cif, and Cef) and use the orthogonal array L9(34) to implement level average analysis. Table 4 exhibits the values of TQC for each combination of CS, Ci, Cif, and Cef., and the absolute values of the effects of each factor are presented in Table 5. From the results in Table 5, we conclude that CS has the strongest effect on TQC, followed by Ci, whereas Cif and Cef have the least effect on TQC.
Table 4.
Sensitivity analysis for simultaneous changes in parameters.
Table 5.
Influence of parameters.
5. Conclusions
In this paper, we propose a repetitive rectifying sampling plan based on the one-sided PCI by extending previous research on the single rectifying sampling plan [17]. Our proposed repetitive rectifying sampling plan minimizes TQC, including inspection cost, internal failure cost, and external failure cost. A thorough comparison with the single rectifying sampling plan is implemented to confirm the performance of the proposed sampling plan. The results of the parameters of the two sampling plans reveal that sample size and critical values seem to be only determined by consumer risk rather than producer risk, quality level, or relevant quality costs. For various risk combinations under certain parameter conditions, the TQC of the proposed sampling plan is significantly lower than that of the single rectifying sampling plan. Specifically, the TQC of the proposed sampling plan is extremely low relative to that of the single rectifying sampling plan when the process capability is very good or when it is very bad. Furthermore, the AOQL of the proposed sampling plan is lower than that of the single rectifying sampling plan despite the two sampling plans’ apparently similar AOQ. Based on the results of the sensitivity analysis, we observe that CS has the strongest effect on TQC, followed by Ci, whereas Cif and Cef exhibit the least influence on TQC. Overall, we conclude that the proposed sampling plan exhibits superior performance to that of Yen et al. [17]. Therefore, the proposed sampling plan is recommended when a rectifying inspection must be executed. It is noted that the proposed methodology is applied in the quality characteristic of interest that follows normal distribution and has one-sided specifications.
Author Contributions
Conceptualization, C.-H.Y; Data curation, Y.-R.S.; Formal analysis, K.-H.L.; Investigation, K.-H.L. and S.-H.L.; Methodology, C.-H.Y; Project administration, C.-C.L.; Resources, S.-H.L.; Software, Y.-R.S.; Supervision, C.-C.L.; Writing—original draft, C.-H.Y. All authors have read and agreed to the published version of the manuscript.
Funding
This research received no external funding.
Acknowledgments
The authors appreciate the support of Ministry of Sciences and Technology of Taiwan.
Conflicts of Interest
The authors declare no conflict of interest.
Nomenclature
| TQC | total quality cost per lot |
| ATI | average total inspection |
| AOQ | average outgoing quality |
| inspection cost per unit | |
| internal failure cost per unit | |
| external failure cost per item | |
| N | lot size |
| c | acceptance value of single sampling |
| rejection value of repetitive sampling | |
| lot tolerance percent defective of one-sided PCI | |
| defective units detected | |
| defective units undetected | |
| probability of accepting one lot for each sampling | |
| probability of rejecting one lot for each sampling | |
| R | probability of resampling after each sampling |
| probability of acceptance of repetitive sampling plan | |
| n | sample size |
| acceptance value of repetitive sampling | |
| acceptable quality level of one-sided PCI |
References
- Schilling, E.G. Acceptance Sampling in Quality Control; Marcel Dekker Inc.: New York, NY, USA, 1982. [Google Scholar]
- Duncan, A.J. Quality Control and Industrial Statistics, 5th ed.; Irwin: Huntersville, NC, USA, 1986. [Google Scholar]
- Montgomery, D.C. Introduction to Statistical Quality Control, 5th ed.; John Wiley: New York, NY, USA, 2005. [Google Scholar]
- Yen, C.-H.; Aslam, M.; Jun, C.-H. A lot inspection sampling plan based on EWMA yield index. Int. J. Adv. Manuf. Technol. 2014, 75, 861–868. [Google Scholar] [CrossRef]
- Wu, C.-W.; Liu, S.-W. Developing a sampling plan by variables inspection for controlling lot fraction of defectives. Appl. Math. Model. 2014, 38, 2303–2310. [Google Scholar] [CrossRef]
- Aslam, M.; Yen, C.-H.; Chang, C.-H.; Jun, C.-H. Multiple dependent state variable sampling plans with process loss consideration. Int. J. Adv. Manuf. Technol. 2014, 71, 1337–1343. [Google Scholar] [CrossRef]
- Wu, C.-W.; Shu, M.-H.; Nugroho, A.A.; Kurniati, N. A flexible process-capability-qualified resubmission-allowed acceptance sampling scheme. Comput. Ind. Eng. 2015, 80, 62–71. [Google Scholar] [CrossRef]
- Yen, C.H.; Chang, C.H.; Aslam, M. Repetitive variable acceptance sampling plan for one-sided specification. J. Stat. Comput. Simul. 2015, 85, 1102–1116. [Google Scholar] [CrossRef]
- Lee, A.H.; Wu, C.W.; Chen, Y.W. A modified variables repetitive group sampling plan with the consideration of preceding lots information. Ann. Oper. Res. 2016, 238, 355–373. [Google Scholar] [CrossRef]
- Fallah-Nezhad, M.S.; Seifi, S. Repetitive group sampling plan based on the process capability index for the lot acceptance problem. J. Stat. Comput. Simul. 2017, 87, 29–41. [Google Scholar] [CrossRef]
- Wu, C.W.; Wang, Z.H. Developing a variables multiple dependent state sampling plan with simultaneous consideration of process yield and quality loss. Int. J. Prod. Res. 2017, 55, 2351–2364. [Google Scholar] [CrossRef]
- Yen, C.H.; Chang, C.H.; Aslam, M.; Jun, C.H. Multiple Dependent State Repetitive Sampling Plans for One-Sided process capability indices. Commun. Stat. Theory Methods 2018, 47, 1403–1412. [Google Scholar] [CrossRef]
- Aslam, M.; Balamurali, S.; Jun, C.-H. A new multiple dependent state sampling plan based on the process capability index. Commun. Stat. Simul. Comput. 2019. [Google Scholar] [CrossRef]
- Feigenbaum, A.V. Total Quality Control, 3rd ed.; McGraw-Hill: New York, NY, USA, 1983. [Google Scholar]
- Juran, J.M. The Quality Trilogy. Qual. Prog. 1986, 19, 19–24. [Google Scholar]
- Shank, J.K.; Govindarajan, V. Strategic Cost Management: The New Tool of Competitive Advantage; Free Press: New York, NY, USA, 1993. [Google Scholar]
- Yen, C.-H.; Ma, H.; Yeh, C.-H.; Chang, C.-H. The economic design of variable acceptance sampling plan with rectifying inspection. Kybernetes 2015, 44, 440–450. [Google Scholar] [CrossRef]
- Sherman, R.E. Design and evaluation of a repetitive group sampling plan. Technometrics 1965, 7, 11–21. [Google Scholar] [CrossRef]
- Wortham, A.W.; Baker, R.C. Multiple deferred state sampling inspection. Int. J. Prod. Res. 1976, 14, 719–731. [Google Scholar] [CrossRef]
- Aslam, M.; Yen, C.-H.; Chang, C.-H.; Jun, C.-H. Multiple states repetitive group sampling plans with process loss consideration. Appl. Math. Model. 2013, 37, 9063–9075. [Google Scholar] [CrossRef]
- Juran, J.M. Quality Control Handbook, 3rd ed.; McGraw-Hill: New York, NY, USA, 1974. [Google Scholar]
- Kane, V.E. Process Capability Indices. J. Qual. Technol. 1986, 18, 41–52. [Google Scholar] [CrossRef]
- Chan, L.K.; Cheng, S.W.; Spiring, F.A. A New Measure of Process Capability: Cpm. J. Qual. Technol. 1988, 20, 162–175. [Google Scholar] [CrossRef]
- Chou, Y.-M.; Owen, D. On the distributions of the estimated process capability indices. Commun. Stat. Theory Methods 1989, 18, 4549–4560. [Google Scholar] [CrossRef]
© 2020 by the authors. Licensee MDPI, Basel, Switzerland. This article is an open access article distributed under the terms and conditions of the Creative Commons Attribution (CC BY) license (http://creativecommons.org/licenses/by/4.0/).