Article

Capital City as a Factor of Multi-Criteria Decision Analysis—Application on Transport Companies in the Czech Republic

Department of Public Economics, Faculty of Economics, VŠB—Technical University of Ostrava, Sokolská třída 33, 70200 Ostrava, Czech Republic
*
Author to whom correspondence should be addressed.
Mathematics 2020, 8(10), 1765; https://doi.org/10.3390/math8101765
Submission received: 15 September 2020 / Revised: 5 October 2020 / Accepted: 7 October 2020 / Published: 13 October 2020
(This article belongs to the Special Issue Advances in Multiple Criteria Decision Analysis)

Abstract

:
The manuscript applied multi-criteria analysis using several indicators to evaluate 18 transport companies established on the level of the Czech statutory towns during period of 2001–2016 that provided for a mass commuting system. Transport companies were chosen for evaluation in the towns being company establishers in the area of mass commuting systems. Based on the prepared analysis outcomes, we suppose that transport companies in big Czech cities and towns using combination of various transport means within the mass commuting system reached lower effectiveness. The Transport Company of the Czech capital city Prague only one operates subway, i.e., it works with specific requirements laid on assurance of this public transport type. Nevertheless, its inclusion in the analysis didn’t affect total results, thus we are able to work with a complete group of transport companies in the Czech Republic when evaluating their economic effectiveness.

1. Introduction

Transportation has been a driving force of progress of all nations. Currently people cannot imagine life without transportation, transport means, and sufficient transport infrastructure. Transportation is defined as deliberate and organized relocation of objects and persons performed by various types of transport means on the rails and roads. The manuscript deals with evaluation of 18 selected transport companies established by a public subject (municipality) in order to provide transport services in the territory controlled by it, primarily providing public services to populations in the area of transportation of persons in the delimited territory of the Czech Republic.
Public transport can be characterized as purposely and controlled movement of various transport means on the rails and roads, aimed at ensuring services for population in the delimited territory. Transport infrastructure, i.e., rails, roads, transport equipment and transport means, play important role within the public infrastructure. Transport infrastructure has had significant spatial and investment demands, including specified requirements in the area of situation of roads and equipment that is inevitable for proper transportation functioning. Transport mainly represents a service that is practically as old as mankind. It has developed since the primitive transport of loads up to current relatively comfortable and fast transport of persons and loads. Transportation is not a part of the production sector, but mankind has been depending on its perfect function for centuries and it represents a condition of the social development, living standards, and quality of the population.
Eisler et al. [1] ranked transport among technical and social-economic services that can be also a public service. Ochrana et al. [2] suppose that there isn’t an unambiguous definition of the term “public service”. The manuscript authors understand “public service” as a service type whose consumers refer to the public, is produced by the public administration bodies, and is financed partly or in whole from the public budgets.
From an economic point of view, public service is an economic or public property. Ochrana [3] stated that provision of public services is often associated with externalities and non-effectiveness of public funds spending causes lack of sources for provision of public services in sufficient scope and required quality. In relation to this, Simpson [4] analyzes the problems resulting from measurement of public services productivity, stating the differences in provision of services by organizations in private and public sectors. Services provided in the public sector are often more expensive because of their collective consumption. In general, effectiveness is defined as a key and universal economic doctrine of goal-minded activities. In conditions of public services, expression of effectiveness is limited by a range of specific factors, amongst them, e.g., absence of competition, fully valued service price, motivation to higher performance and accountability for outputs by the management—these factors deform and complicate the effectiveness assessment [5,6]. Nevertheless, the theory offers a range of approaches that allow for measurement and evaluation of production process outputs and results effectiveness. In most cases, these are approaches based on ex post evaluation that enable professional prediction of the development and effects of specific processes and programs.
According to Stiglitz [7], public property market imbalance results from failure of private companies that are focused only on their own interests and efforts to maximize profits of their owners, instead of performing beneficially towards the society as a whole. Musgrave and Musgrave [8] said: “If we say that public property is public secured, we mean thereby that they are covered by the budget and available for free to particular consumers”. Řežuchová [9] added that provision of public services has a broader meaning in the terms of assurance, arrangement, regulation, control, and funding of particular public service. Bruun and Vanderschuren [10] subsequently stated that public funds should be managed better. Litman [11] pointed to various possibilities of public transport financing and to assurance of long-term funds stability in favor of public transport development and improvement, and also to broad distribution of cost among the population. Thus, evaluation and application of methods that thoroughly assess public provided services quality including future effects (e.g., investments in public infrastructure) would represent a logical step resulting in application of such indicators that don´t evaluate only performance but also social, economic, and environmental effects.
Mitwallová [12] stated about the public services production that one of main public services signs refers to the non-profitable nature of this activity that must be subsidized by the founder. If we agree with this standpoint, then we can classify public services further to public services only or combined public services (partly financed from the State Budget and partly from the user’s budget). Based on public service providers, we can distinguish service provision centrally or on self-government level (in the Czech Republic from self-government regions and municipalities’ budgets). Thus, public services financing is various. Regarding purely public services, they are financed only from the public budgets and citizens pay for them indirectly by taxes. According to Eisler et al. [1], Varadzin and Bečica [13] public budgets of countries or self-governing wholes, charges paid by citizens and purpose funds represent the source of combined public services financing in the Czech Republic. Regarding further classification of public services, they are: (a) administration public services for assurance of public order, security of population and defense of the state, and (b) general public services including social, healthcare, cultural services, and territorial transport services.
This manuscript is dedicated to evaluation of performance effectiveness of 18 selected transport companies founded in the Czech Republic by territorial self-governing whole (municipality) to ensure transport services provision in delimited territory. It is divided into the following sections: The first one deals with the literature review of current knowledge of this topic (transportation), the second one describes the methodology of presented research (including indicators or research sample description). Section 3 represents the main part of the manuscript—application of coefficient of variance method (CV) and technique of order preference similarity to the ideal solution (TOPSIS). In the last section, we summarize the results obtained in the context of the results of other authors. Considering the manuscript topic, it doesn’t deal with other transport indicators or economic specificity in the area of transport services (regulating interventions by the state, transport principles, protection of economic competition, environmental protection, regulation in the area of security, and approval of building of selected transport infrastructure facilities).

2. Review of Literature and (Public) Transport

Transportation ranks among the fastest developing sectors of the national economy in developed countries. Growth of this sector has been driven especially by passenger motoring [14] or by technology and social changes with an assurance of users´ mobility [15,16]. A consequence of such fast development has been adverse environmental effects [10] that many governmental officials (within countries, regions and municipalities) try to resolve through the implementation of new principles aimed at restricting the massive development of passenger motoring (delimited parking zones, restricted ingress of some vehicle categories that are environmentally detrimental in the historical city centers) in favor of supporting mass commuting transport system.
Globally, we can state that there are various traditions in various countries as well as legal standards of mass commuting system financing and regulation. In some countries, transportation is operated on purely commercial basis while in other countries some transport forms, especially local and regional ones, are ordered by public-law subjects and financed from public funds. Li et al. [17], Ojo [18] stated that transport participants often require frequent services provided within extensive network but funding and further sources are limited. It results in complicated relations between the set forth political goals, service efficiency, and business effectiveness goals.
In the Czech Republic, public transport is such transport that is provided upon transport (and tariff) conditions determined in advance and is available to any and all citizens. In terms of big cities (from approx. 40 thousand citizens) or agglomerations (regional centers), so called mass commuting system is operated that includes various transport types (train, subway, trolleybus, tram, cable cars, buses, ships). Mass commuting system is characterized by organization within lines having driving schedule, and creating a network on geographically delimited territory (most often they are cities or regions). In narrower meaning, public transport in the Czech Republic can be interpreted as transport lines driving upon public order by elected regional/municipal/state representatives. Additional cost associated with such ordered public transport that isn’t covered from payment of tickets by mass commuting system users is paid from applicable public budget.
Taking into account the differences between particular mass commuting system providers, their evaluation is relatively popular topic when looking at it from various points of view. Many published professional manuscripts from both foreign and domestic authors correspond to it. Stiglitz [7] dealt with the issue of various transport means that would result in increased public transport effectiveness. Taking Stockholm, Sweden as an example, Jenelius [19] evaluated availability and reliability of services in bus transport in selected locations and identified uneven utilization of the capacities within the weekdays and particular day hours. Pereira [20] investigated the effect of multinational events (World Championship 2014, Olympic Games 2016) on improvement of transport availability in particular city districts to citizens in Rio de Janeiro, Brazil. He also took in account the effect of service improvement in the area of transport availability and its transferred effect on availability of public services in the area of healthcare and educational facilities and other public services provided to citizens [21].
Fitzová et al. [22] tried to identify the factors affecting the mass commuting system effectiveness in the Czech Republic during period of years 2010–2015, using method DEA. Similarly, Hawas et al. [23] applied DEA methods to public transport lines effectiveness in the abroad. Čejka et al. [24], Klieštik [25] also dealt with effective management of selected transport companies in the Czech Republic. Vrabková et al. [26] considered other aspect, namely accessibility of various institutions by mass transport means. Ivan [27] also studied integration of city and suburban transport in the Czech Republic. Olivková [28] investigated the factors that influence citizens’ satisfaction with mass commuting system in selected Czech cities. As for foreign countries, Van Lierop and El-Geneidy [29], Brechan [30] dealt with citizens’ satisfaction with public transport services. Reasons for decreasing interest in the use of a mass commuting system have been solved in the Czech Republic and in other countries, and the explanations for this vary (increasing service price, unacceptable intensity or spatial availability). In general, it can be attributed to dissatisfaction of users with services provided.
In this manuscript, mass commuting system is analyzed in the terms of effectiveness calculated through multi-criterion analysis, namely CV-TOPSIS technique. It uses a few indicators for an evaluation of the whole range of transport companies, using the below described methodology.

3. Material & Methods

A total of 7 indicators of financial effectiveness assessment of transport companies in the Czech Republic were identified within the research. Identification of the final set of indicators was preceded by the analysis of literature sources dealing with the subject matter (see the previous chapters) in order to select indicators that could capture financial effectiveness of these subjects in a complex way. According to Grünwald and Holečková [31], Dluhošová et al. [32], Sedláček [33], financial indicators are especially used for evaluation of private subjects financial vitality, which however doesn´t exclude their application to public sector-controlled organizations [34,35]. The following indicators are used in the presented manuscript:
  • I1—Sales per an employee (in CZK),
  • I2—Current assets per an employee (in CZK),
  • I3—Total assets per an employee (in CZK),
  • I4—Own capital per an employee (in CZK),
  • I5—Short-term liabilities per an employee (in CZK),
  • I6—Foreign capital per an employee (in CZK),
  • I7—Cash flow per an employee (in CZK).
Financial analysis in the public sector has its specific features. Contrary to well-performing companies on the market that were founded for purpose of reaching profit, the main goal of public founded organizations (regardless their legal status) is to ensure public assets for citizens and satisfy the public interest. Taking in account the manuscript topic, it is namely the assurance of transportation services within delimited territory pursuant to requirements of Act No. 194/2010 Coll. on Public Services in the area of Passenger Transport as amended, corresponding to EU Parliament and EC Council Regulation No. 1370/2007. The Act imposes obligation to regions and municipalities with self-governments to determine the extent of transport services to be ensured by public rail and road line transportation, evtl. by combination thereof. Accordingly, 7 indicators were chosen that are most frequently used in the multi-discrimination analysis except the various forms of performance (e.g., EBIT, EAT, ROA, etc.). Their usage is illustrated in the Table 1.
Above described indicators were processed via method CV-TOPSIS. Results obtained were subjected to the statistical analysis including:
  • Shapiro–Wilk test (standard distribution of variables)
    S W = (   u i x i ) 2   u i 2   ( x i x ¯ ) 2
    where u i is the constant; x i is the value of the ith statistical unit; and x ¯ is the average value of the variable;
  • Kruskal–Wallis test (median value)
    Q = 12 n ( n 1 ) i = 1 I T i 2 n i 3 ( n + 1 )
    where n is the number of observations or file size; n i is the number of observations in the ith group; and T i 2 is the total number of ranks in the ith group;
  • Levene test (homoscedasticity)
    W = ( N k ) ( k 1 ) i = 1 k N i ( Z i Z .. ) 2 i = 1 k j = 1 N i ( Z i j Z i . ) 2
    where k is the number of values of the observed categorical variable; N is the total number of observations; N i is the number of observations in the ith group; Y i j is the gained value of the jth unit of the ith group; Y i ¯ is the average value of the ith group; Y ˜ i   i s   the median of the ith group; Z ..   i s   t h e   average of groups Zij; and Z i .   is the average Zij for the ith group;
  • regression analysis which is evaluated by the coefficient of determination
    R 2 = i = 1 n ( y i y ^ i ) 2 i = 1 n ( y i y ¯ i ) 2
    where y i is the measured value of the dependent variable; y ^ i is the estimated value of the dependent variable; and y ¯ i   i s   t h e   average value of the dependent variable.
The analyses were processed in the format MS Excel, Statistica 13.4 and Statgraphics XVIII.

3.1. Determining the Importance of Selected Indicators

In order to be able to concurrently evaluate the transport companies on basis of all above mentioned indicators, we have to determine their importance or weight that significantly affects the application of multi-criterion method [36,37] and we also agree with Brans and Mareschal [38], the assessment of weights to the different criteria is a crucial problem in all multi-criteria techniques. There are a few methods to assign a weight to each indicator in combination with TOPSIS technique that Tzeng et al. [39] classified in two basic categories, subjective and objective methods. Subjective methods result from individual preferences of the evaluating person while objective methods determine indicators’ weights on the basis of mathematical models without any intervention of an evaluating person.
Since it is impossible to assign weight to monitored indicators at one´s convenience or according to opinion supported in professional literature (that is not unified regarding the importance of financial indicators), we decided to apply objective methods of weight determination to which we can include method ENTROPY, CRITIC, MW, SD, IDOCRIW, CV, IDP, or SVP. The current use of these methods was confirmed by the team of authors that provide a detail description of the methods [36,40,41]. For the purposes of our research, we used the method of the last authors with the following results.
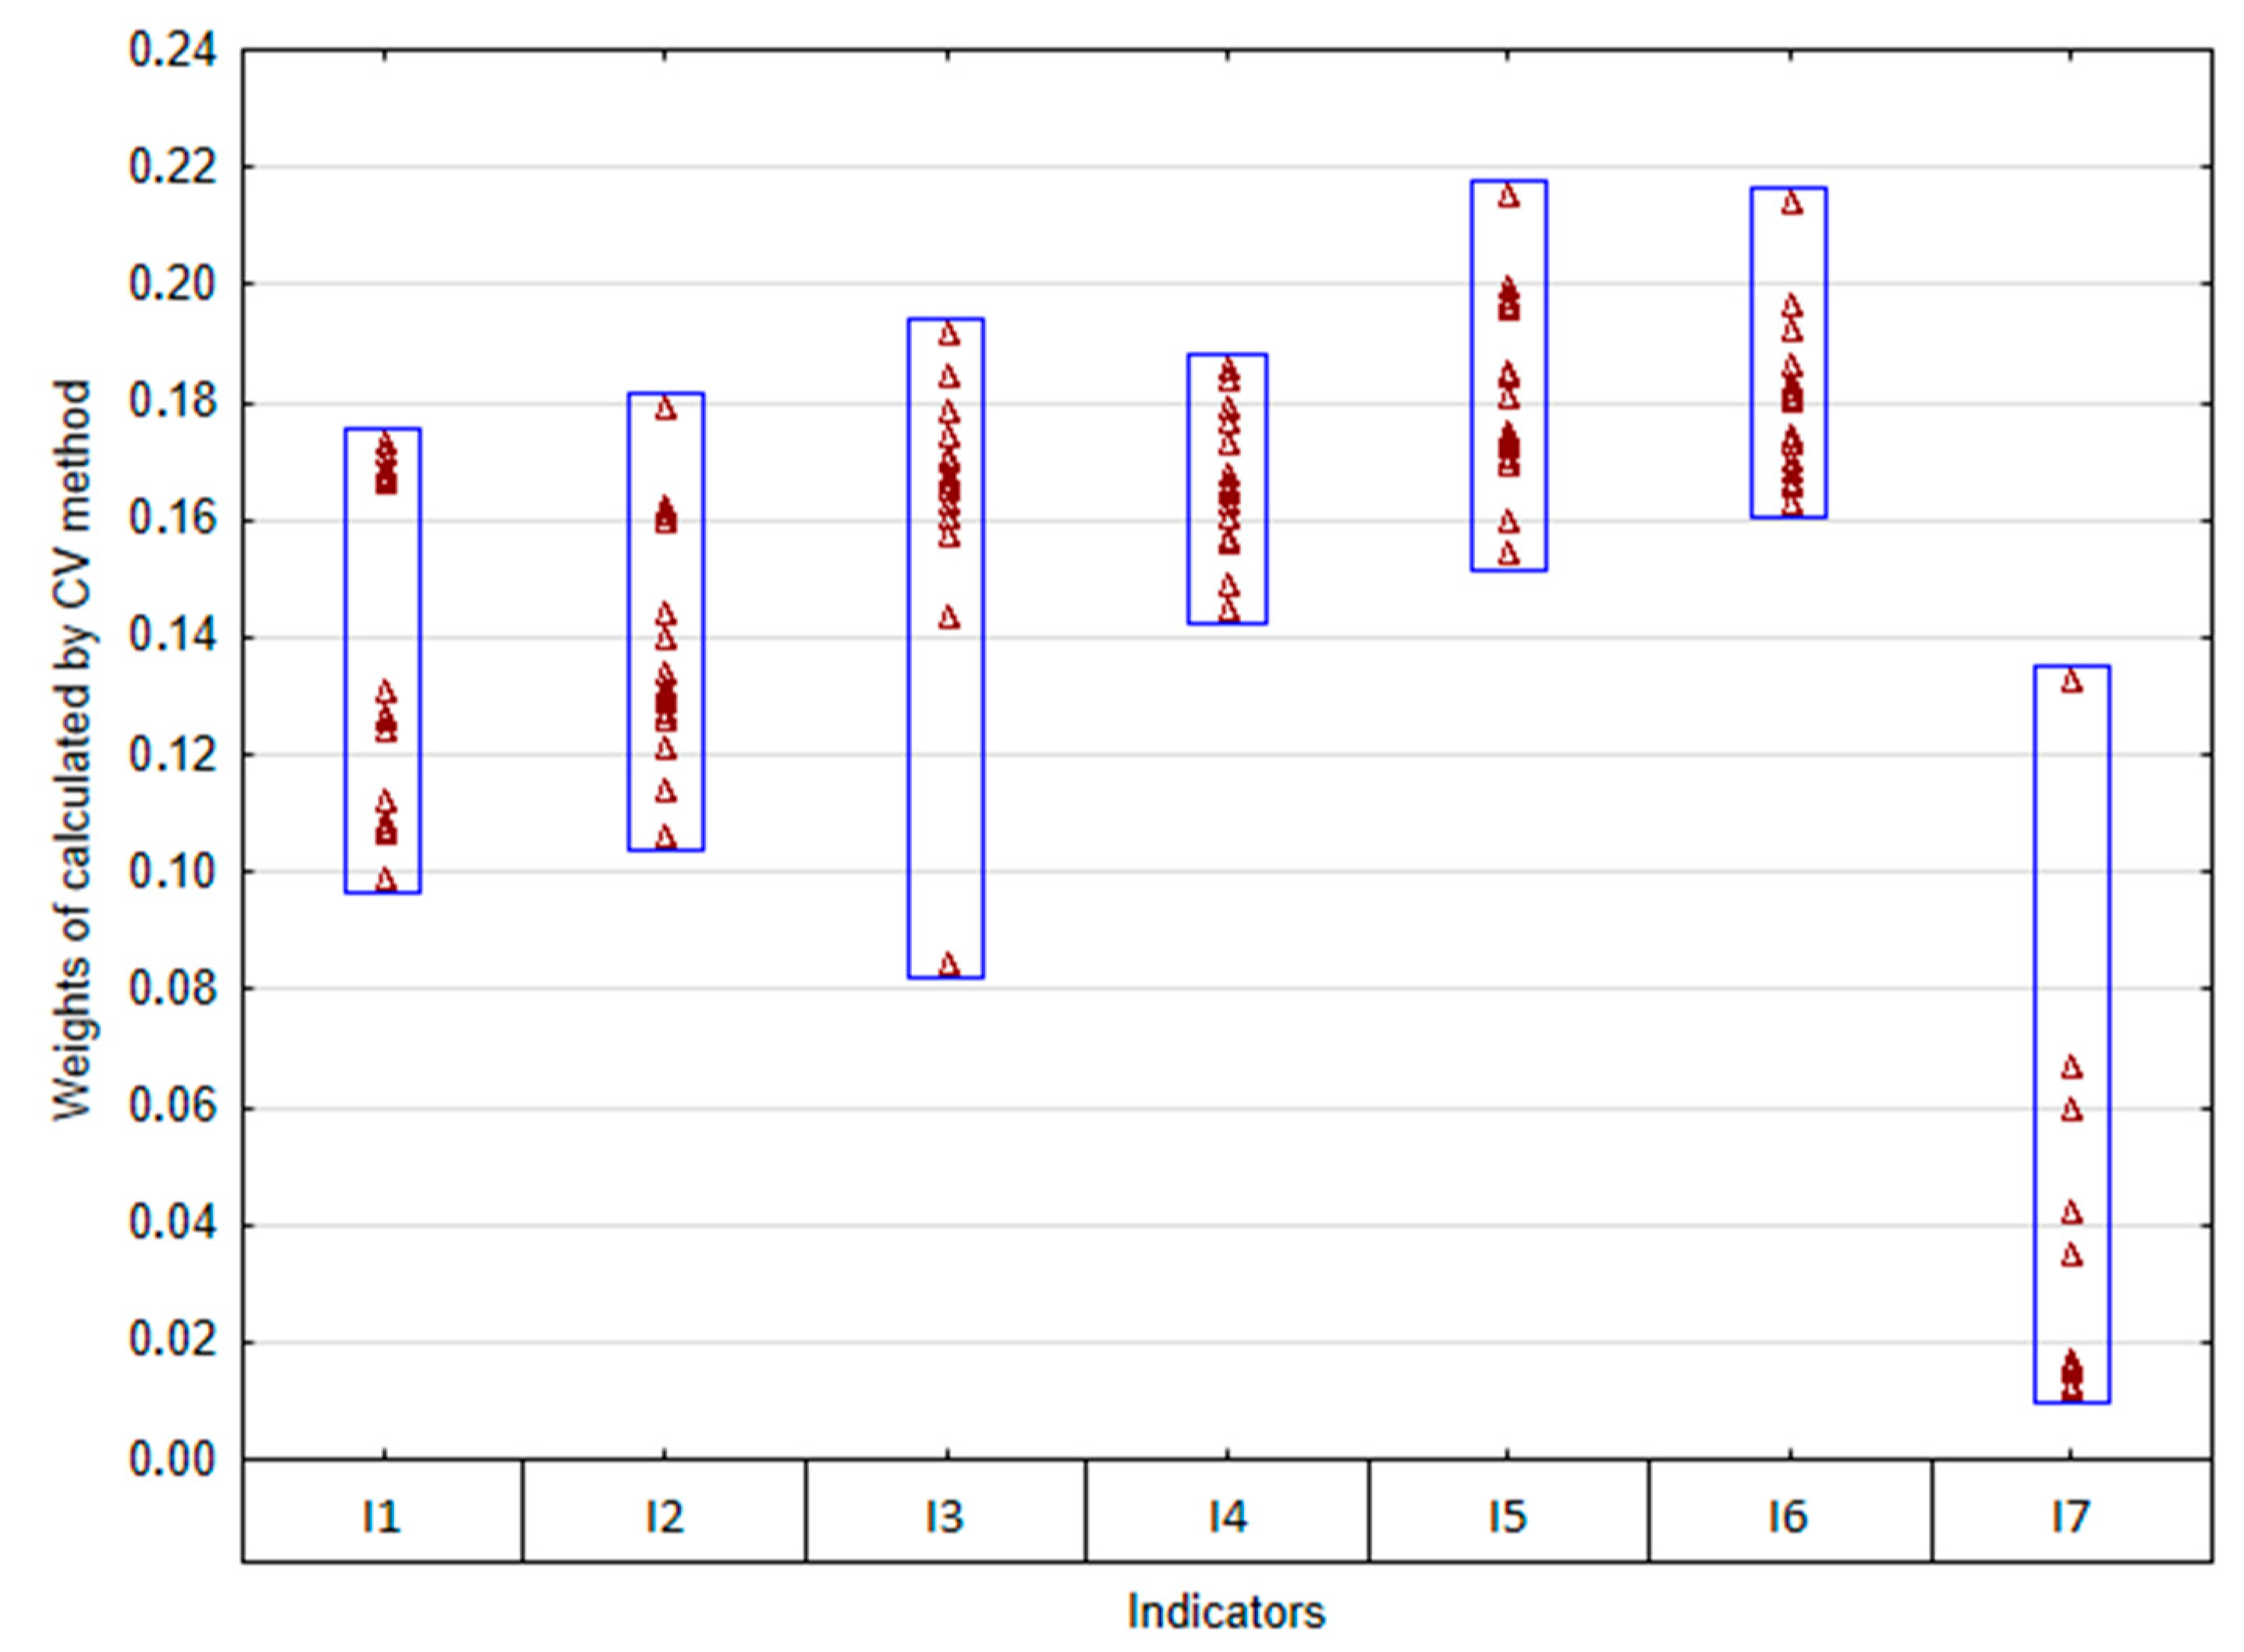
Except the year 2004, the last indicator (cash flow per an employee) represents the least important one amongst the group of monitored indicators, and its weight didn´t reach event 1% during the last year (only 0.5995%). We also evaluate this fact positively since it indicates the balanced volume of short-term funds at particular transport companies. We monitored the balance of all indicators across particular years of the monitoring period (Figure 1), which has been disturbed by results in a single year being 2005 in the case of total assets per capita.
In the presented manuscript, the weights represent the input data for TOPSIS technique calculation, used and calculated according to Vavrek et al. [42], Širá et al. [43]. The acronym TOPSIS stands for technique for preference by similarity to the ideal solution [44]. TOPSIS was initially presented by Hwang and Yoon [45], Lai et al. [46], Yoon and Hwang [47]. The calculation is as follows:
  • Create the criterion matrix, which represents the ranking of possibilities in accordance with the set characteristics:
    D = ( X 1 X 2 X j X n A 1 x 11 x 12 x 1 j x 1 n A 2 x 21 x 22 x 2 j x 2 n : : : : : A i x i 1 x i 2 x i j x i n : : : : : A m x m 1 x m 2 x m j x m n )
    where Ai is the ith alternative and Xij is the value of the jth parameter achieved by the ith alternative.
  • Create the normalized criterion matrix. To get this matrix, calculate the next formula:
    r i j = x i j / j = 1 j x i j 2
    where rij is the normalized value of the jth criterion and xij is the value of the jth criterion reached by the ith alternative.
  • Assign weights to each parameter:
    v i j = w i j r i j
    where vij is the weight of the normalized value and wij is the weight of the parameter.
  • Find and label PIS and NIS alternatives. These fictitious limits comprise real values, in most cases, and hypothetical alternatives:
    H j = max ( w i j ) , D j = min ( w i j )
    where Hj is positive ideal solution (PIS), and Dj is negative ideal solution (NIS).
  • Compute the distance from these alternatives:
    d i + = [ j = 1 k ( w i j H j ) 2 ] 1 / 2 ,   d i = [ j = 1 k ( w i j D j ) 2 ] 1 / 2
    where d+ is the distance from the PIS alternative and d is the distance from the NIS alternative.
  • Calculate the relative distance from the PIS alternative (in terms of alternatives, minimizing the distance from the PIS (d+) and maximizing the distance from the NIS (d) are desired):
    c i = d i d i + d i +
    where ci is the relative distance from the PIS alternative.
According to Liang et al. [48] the method can produce reasonable solutions for real-world practice. Bhutia and Phipon [49], Pavic and Novoselac [50] and many others dealt with the TOPSIS method in detail and its application can be found in various areas, e.g., tourism [51], airlines evaluation [52], transportation [53,54], agriculture [55], risk assessment [56], financial investment [57], evaluation of cloud service providers [58], or evaluation of territorial self-government subjects [42].

3.2. Research Sample

Mass commuting system is operated in the Czech Republic by either companies being shareholders of particular town/city; or private companies. We evaluated 18 transport companies in this manuscript that are members of the Czech Transport Companies Association and city shareholder deposit; save the companies Arriva Teplice s.r.o., that is owned by the holding Arriva Transport ČR a.s.—a member of the German concern DeutscheBahn. The company from Teplice is also known for the following facts: In 2017, companies Arriva Teplice, s.r.o. and Arriva Praha, s.r.o. merged in a single new company Arriva City, s.r.o. that has provided transport services since 2017 not only within Teplice territory but it operates also long-distance lines and thereby the company principally distinguishes from other evaluated transport companies offering public transportation usually only within a city/town territory or also in the suburbs (so called suburban lines), thus the stated company was removed from the below stated evaluation.
Data required for particular indicators´ calculation were drawn from Final Accounts for period 2001–2016, i.e., Balance Sheet, Profit and Loss Statement and Cash Flow that were published in the Company Register per each transport company (official server of the Czech Justice and portal of the Czech Ministry of Treasury, IISSP-Monitor.) Transport Company Mariánske Lázne was founded in 2006 and it was included in the analysis as late as in this year.

4. Results

As we already stated above, we evaluated 18 transport companies for period of years 2001–2016. Analysis using method CV-TOPSIS and 7 indicators has been prepared in two variants:
  • The first variant evaluates all transport companies, i.e., including Transport Company of Czech Capital City Prague.
  • The second variant evaluates transport companies except the Transport Company of Czech Capital City Prague.
These obtained results were subsequently matched in order to identify the differences between inclusion and removal of the Transport Company of Czech Capital City Prague in/from the analysis.

4.1. Analysis of Effectiveness with Included Transport Company of Czech Capital City Prague

Looking at a complex structure of the results in particular analyzed years, we can see significant differences (see Figure 2). High variability was primarily caused by the occurrence of remote or extreme values on both ends of the result spectrum, which caused a rejection of the standard results distribution hypothesis. Best absolute values, i.e., total effectiveness evaluation, were reported during period of years 2001–2007. The worst results were also reported in the same period, which caused the biggest heterogeneity of the results.
Conformance of medians wasn´t confirmed (W = 166,895, p ≤ 0.01), which was indicated in a graphical illustration of the results. Significant linear relation (α = 0.05) between the results in particular years is depicted on the Table 2 to which we could divide the monitored period in two parts. Results are different in the first part covering years 2001–2006 and their linear correlation is rare and max. 50%. In the second part, covering years 2007–2016, the occurrence of correlations rose as well as their intensity.
Analyzing the transport companies ranking (Table 3), we should take in account the structure of absolute results of CV-TOPSIS method as outlines above. Even negligible differences in the monitored indicators caused major changes in a transport company ranking. We can see that nine of total 18 transport companies ranked on the 1st place at least in one year, i.e., 50%. However, majority of them reported also last rank in the chart within the monitored period. Based on the above facts, the Transport Company of city Děčín can be considered the most effectively managed transport company during period of year 2001–2016 that ranked always within the six best evaluated subjects except year 2001 and as the best transport company during the last six years.

4.2. Analysis of Effectiveness without Inclusion of Transport Company of Czech Capital City Prague

Complex structure of results for period of years 2001–2016 is again significantly heterogeneous (see Figure 3). High variability was caused mainly by the occurrence of remote or extreme values on both sides of result spectrum and their presence caused rejection of the hypothesis of standard result distribution. The highest absolute differences between the best and the worst ranked subject, i.e., the highest variation span, were reported in 2001 (caused by extreme value on both ends). With the following years passing, differences in total results had decreased (years 2006 and 2008). Extreme values were not reported during the last seven years and it contributed to a stabilization of evaluation and its momentum characteristics.
Similar to the variant with included Transport Company of City Prague, median values conformance wasn´t confirmed (W = 81,247, p ≤ 0.01), which was indicated by the differences in comparison of years 2001 and 2008 as an example. A significant linear relation (α = 0.05) between the results in particular years is depicted on the Table 4, confirming conclusions drawn in the variant I.
Analyzing the transport companies ranking (Table 5), differences resulting from graphical illustration of absolute results (Figure 3). Even negligible differences in the monitored indicators caused major changes in a transport company ranking. We can see that 50% of transport companies ranked in the 1st place at least in one year. Save the transport company of city Děčín, all of them reported also last rank in the chart within the monitored period. The Transport Company of city Děčín can be considered the most effectively managed transport company that ranked always within the top five evaluated subjects except year 2001 and as the best transport company for five years.

4.3. Comparison of Results

Based on the above stated analyses prepared in two variants, we can conclude the following:
  • Inclusion of the Transport Company of City Prague didn´t result in a change to the structure of results or linear relations within them.
  • Major differences in the structure of results/absolute effectiveness rating can be seen in particular years of the monitored period.
  • Save one, a subject with a stable ranking couldn’t be identified.
Comparing the effect of Capital City Prague Transport Company inclusion in the analysis, we realized the change at the regress model trend at first, which was the minimum based on the graphical analysis (Figure 4) and below stated results, i.e., we don’t consider inclusion of the said subject significant in the terms of time aspect.
VARIANT I: CV-TOPSIS = 0.000254583 * YEAR (p-value ≤ 0.01; R2 = 0.9585)
VARIANT II: CV-TOPSIS = 0.000281509 * YEAR (p-value ≤ 0.01; R2 = 0.9778)
Inclusion of the subject in the calculations of CV-TOPSIS method resulted in absolute changes at particular transport companies’ evaluation whose nature is shown in the Table 5. Of total 272 cases, majority was positive (70.59%), i.e., the inclusion of a new subject caused the increase of their effectiveness in the context of evaluated transport companies’ group. This can be attributed to the fact that the Prague Transport Company was ranked below in the chart, i.e., its inclusion resulted in the change to the variation span of particular indicators (downwards), see Table 6.
Absolute differences between particular subjects (Table 7) are tested in pairs on the monitored importance level (α = 0.05) that were confirmed in major part, i.e., inclusion of the Transport Company Prague in the analysis or CV-TOPSIS method caused statistically significant difference at evaluation of transport companies’ effectiveness (expressed by relative distance from PIS alternative).
The above statement of pair difference in absolute values of total results cannot be applied to total ranking (Table 8) that wasn’t confirmed in any of 16 monitored years; i.e., we presume that absolute changes resulting from inclusion of another subject in the calculation (Transport Company Prague) were expressed uniformly at all analyzed subjects.

5. Conclusions

An evaluation of effectiveness is an actual question in the context of the 21st century that all subjects in both private and public sector must face. The presented manuscript subject refers to multi-criteria analysis of 18 transport companies for period of years 2001–2016 (similar use also in [59,60]). The subjects were analyzed according to seven indicators used as input data in the CV-TOPSIS method. Based on the obtained results, we can state that significant differences can be seen in the structure of results/absolute effectiveness rating within the analyzed years. The inclusion of Transport Company Prague in the analysis didn’t cause a change to the structure of results as a whole, or linear relations within them. Change was however reported in the case of a pairwise comparison with increased effectiveness rating in the majority (70.59%). The changes were minimal, and they didn’t cause the change to the total ranking.
Within the evaluated transport companies in the Czech Republic, lower effectiveness was reported in case of big cities and towns operating mass commuting system or public transport with combination of various more ecological transport means (subway, tram, trolleybus), compared to the towns operating mass commuting system only with buses. Thus, it seems that appeal for environmental effects of mass commuting system operation and variability of transport means increases both cost of such system operation (energies, wages) and inevitable investments in the development of infrastructure (subway, tram) from public funds. Similar conclusions were made by Sheurer [61], who evaluated public transportation in 19 metropolitan regions of well-developed countries. His analysis outcomes indicate that cost of cities operating trams differ from cities using only buses. We agree with statements of Galván et al. [62] that environmental protection and related operation of eco-friendly transport means is considered an important decision by common population until we compare the procurement and operating cost of transport means.
Performed analysis of 18 transport companies in the Czech Republic also indicate that transport companies with higher amount of independent lines and denser system of stops per a comparable unit reached worse results. Citizens of big Czech cities (Prague, Brno, and Ostrava) understand denser system of public transport stops as a matter of course, considering it as a standard service. The analysis and its results also showed that the most economically efficient in the Czech Republic are transport companies operating in medium-sized cities (e.g., Děčín, Opava, Zlín-Otrokovice), which are characterized by:
  • A lower number of permanent residents (in the range of about 50–70 thousand inhabitants).
  • Public transport in the city is operated by lower number of lines, which are also shorter.
  • The number of lines operated is also lower compared to total volume of transported persons.
  • Transport is carried out only by buses or only in combination with trolleybuses (thus eliminating the more investment-intensive operation of rail transport).
  • The age of the vehicle fleet is low or maximum up to the average of the monitored sample of transport companies.
However, a transport company’s economic performance decreases with an increased number of lines and stops. Similar results were obtained by Foell et al. [63] who measured the periodicity of particular public transport lines use in Lisbon, Portugal.
According to a number of authors, the preference for public transport over individual transport depends on a number of factors, e.g., use costs or bus stops [18,64,65]. We also agree with the statement of Wright [66] that public transport in large European urban clusters is better operated in the term of public service, which is also in the public interest of the city’s representatives but in direct contradiction with the economic performance reached. Thus, we should ask whether an evaluation of transport companies represents an evaluation of the service or of economic performance, or both, and in what proportion. Every individual should answer the question whether service or economic performance should prevail in the area of public transportation as a value, and what their eventual proportion should be. In general, we can admit bigger efforts in lower regulation or changes that should support higher competition in the provision of any public services. Taking into account a public service, we should appreciate any efforts made in favor of mutual cooperation aimed at interconnecting particular transport systems and improving the service in favor of users.

Author Contributions

Conceptualization, R.V. and J.B.; methodology, R.V.; software, R.V.; validation, R.V.; formal analysis, R.V.; investigation, R.V. and J.B.; resources, J.B.; data curation, J.B.; writing—original draft preparation, R.V. and J.B.; writing—review and editing, R.V. and J.B.; visualization, R.V.; supervision, R.V; project administration, J.B.; funding acquisition, J.B. All authors have read and agreed to the published version of the manuscript.

Funding

This research was funded by the student grant competition in VŠB—Technical University of Ostrava, grant number SP2020/32; Technological Agency of the Czech Republic, grant number TL01000145.

Conflicts of Interest

The authors declare no conflict of interest.

References

  1. Eisler, J.; Kunst, J.; Orava, F. Ekonomika Dopravního Systému; Oeconomica: Prague, Czech Republic, 2011; pp. 1–45. [Google Scholar]
  2. Ochrana, F.; Sumpikova, M.F.; Pavel, J.; Nemek, J. Efektivnost Zabezpečování Vybraných Veřejných Služeb na Úrovni Obcí; Oeconomica: Prague, Czech Republic, 2017; pp. 1–30. [Google Scholar]
  3. Ochrana, F. Veřejné Služby-Jejich Poskytování, Zadávání a Hodnocení: Teorie a Metodika Poptávkového Způsobu Poskytování a Zadávání Veřejných Služeb na Úrovni Municipalit; Ekopress: Prague, Czech Republic, 2007; pp. 1–50. [Google Scholar]
  4. Simpson, H. Productivity in public services. J. Econ. Surv. 2009, 23, 250–276. [Google Scholar] [CrossRef]
  5. Walker, R.M.; Brewer, G.A.; Boyne, G.A.; Avellaneda, C.N. Market orientation and public service performance: New public management gone mad? Public Adm. Rev. 2011, 71, 707–717. [Google Scholar] [CrossRef]
  6. Van Dooren, W.; Bouckaert, G.; Halligan, J. Performance Management in the Public Sector; Taylor & Francis: London, UK, 2015; pp. 1–50. [Google Scholar]
  7. Stiglitz, J.E. Ekonomie Veřejného Sektoru; Grada Publishing: Prague, Czech Republic, 1997; pp. 1–40. [Google Scholar]
  8. Musgrave, R.A.; Musgrave, J.P. Veřejné Finance V Teorii a Praxi; Management Press: Prague, Czech Republic, 1994; pp. 1–15. [Google Scholar]
  9. Řežuchová, M. Partnerství Veřejného a Soukromého Sektoru: Analýza Možností Efektivního Zabezpečování Veřejných Služeb. Available online: http://is.muni.cz/th/77468/esf_d/ (accessed on 15 July 2020).
  10. Bruun, E.; Vanderschuren, M. Assessment methods from around the world potentially useful for public transport projects. J. Public Transp. 2017, 20, 103. [Google Scholar] [CrossRef] [Green Version]
  11. Litman, T. Evaluating public transportation local funding options. J. Public Transp. 2014, 17, 43–74. [Google Scholar] [CrossRef]
  12. Mitwallyová, H. Mají Příspěvkové Organizace V Dnešní Době Své Opodstatnění? Ústav Státu a Práva; AV ČR: Prague, Czech Republic, 2014; pp. 772–792. [Google Scholar]
  13. Varadzin, F.; Bečica, J. Sídla a Produkční Potenciál. (Fungování a Ekonomický Potenciál Obcí v ČR (s Příklady z Území Moravskoslezského Kraje); Professional Publishing: Prague, Czech Republic, 2016; pp. 1–35. [Google Scholar]
  14. Buehler, R. Can public transportation compete with automated and connected cars? J. Public Transp. 2018, 21, 7–18. [Google Scholar] [CrossRef] [Green Version]
  15. Shaheen, S.; Cohen, A. Is it time for a public transit renaissance? Navigating travel behavior, technology, and business model shifts in a brave new world. J. Public Transp. 2018, 21, 67–81. [Google Scholar] [CrossRef]
  16. Papanikolaou, A.; Basbas, S. Analytical models for comparing demand responsive transport with bus services in low demand interurban areas. Transp. Lett. 2020, 1–8. [Google Scholar] [CrossRef]
  17. Li, X.; Fan, Y.; Shaw, J.; Qi, Y. A Fuzzy AHP Approach to compare transit system performance in US urbanized areas. J. Public Transp. 2017, 20, 66–89. [Google Scholar] [CrossRef]
  18. Ojo, T.K. Quality of public transport service: An integrative review and research agenda. Transp. Lett. 2017, 11, 104–116. [Google Scholar] [CrossRef]
  19. Jenelius, E. Public transport experienced service reliability: Integrating travel time and travel conditions. Transp. Res. Part. A Policy Pr. 2018, 117, 275–291. [Google Scholar] [CrossRef] [Green Version]
  20. Pereira, R.H. Transport legacy of mega-events and the redistribution of accessibility to urban destinations. Cities 2018, 81, 45–60. [Google Scholar] [CrossRef]
  21. Ratrout, N.T.; Gazder, U.; Assi, K.J. Effect of public transportation in reducing passenger car trips to schools in Al-Khobar–Dhahran metropolitan area, Saudi Arabia. Transp. Lett. 2016, 10, 43–51. [Google Scholar] [CrossRef]
  22. Fitzová, H.; Matulová, M.; Tomeš, Z. Determinants of urban public transport efficiency: Case study of the Czech Republic. Eur. Transp. Res. Rev. 2018, 10, 42. [Google Scholar] [CrossRef]
  23. Hawas, Y.E.; Khan, M.; Basu, N. Evaluating and enhancing the operational performance of public bus systems using GIS-based data envelopment analysis. J. Public Transp. 2012, 15, 19–44. [Google Scholar] [CrossRef] [Green Version]
  24. Čejka, J.; Telecký, M.; Kolář, J. Appropriate strategies of transport companies for more efficient management with the aim of their further assessment using the operations research methods. Nase More 2016, 63, 98–101. [Google Scholar] [CrossRef]
  25. Klieštik, T. Quantification effectiveness activities traffic company by the rules of data envelopment analysis. E M Ekonomie Manag. 2009, 12, 133–145. [Google Scholar]
  26. Vrabková, I.; Vaňková, I.; Ivan, I. The efficiency and public transport accessibility of indirect state administration in the Czech Republic. Rev. Econ. Perspect. 2016, 16, 135–156. [Google Scholar] [CrossRef]
  27. Ivan, I. Interchange nodes between suburban and urban public transport: A case study of the Czech Republic. Acta Geogr. Slov. 2016, 56, 221–233. [Google Scholar] [CrossRef] [Green Version]
  28. Olivková, I. Evaluation of quality public transport criteria in terms of passenger satisfaction. Transp. Telecommun. J. 2016, 17, 18–27. [Google Scholar] [CrossRef]
  29. Van Lierop, D.; El-Geneidy, A.M. A new market segmentation approach: Evidence from two Canadian cities. J. Public Transp. 2017, 20, 20–43. [Google Scholar] [CrossRef] [Green Version]
  30. Brechan, I. Effect of price reduction and increased service frequency on public transport travel. J. Public Transp. 2017, 20, 139–156. [Google Scholar] [CrossRef]
  31. Grünwald, R.; Holečková, J. Finanční Analýza a Plánování Podniku; Ekopress: Prague, Czech Republic, 2009; pp. 1–40. [Google Scholar]
  32. Dluhošová, D.; Zmeškal, Z.; Richtarová, D.; Valecký, J. Finanční Řízení a Rozhodování Podniku, 3rd ed.; Ekopress: Prague, Czech Republic, 2010; pp. 1–20. [Google Scholar]
  33. Sedláček, J. Finanční Analýza Podniku; Computer Press: Brno, Czech Republic, 2011; pp. 1–30. [Google Scholar]
  34. Balest, R.; Cho, K.; Ford, W.T.; Lohner, M.; Park, H.; Rankin, P.; Smith, J.G.; Alexander, J.P.; Bebek, C.; Berger, B.E.; et al. Measurements of the decays τh-h + h-ντ and τh-h + h-π 0 ντ. Phys. Rev. Lett. 1995, 75, 3809–3813. [Google Scholar] [CrossRef] [PubMed]
  35. Kraftová, I.; Prášilová, P. Prosperující Podnik v Regionálním Kontextu; Wolters Kluwer ČR: Prague, Czech Republic, 2013; pp. 1–40. [Google Scholar]
  36. Yalçın, N.; Ünlü, U. A multi-criteria performance analysis of Initial Public Offering (IPO) firms using CRITIC and VIKOR methods. Technol. Econ. Dev. Econ. 2017, 24, 1–27. [Google Scholar] [CrossRef]
  37. Zavadskas, E.K.; Turskis, Z.; Ustinovichius, L.; Shevchenko, G. Attributes weights determining peculiarities in multiple attribute decision making methods. Inz. Ekon. Eng. Econ. 2010, 21, 32–43. [Google Scholar]
  38. Brans, J.-P.; Mareschal, B. The PROMCALC & GAIA decision support system for multicriteria decision aid. Decis. Support. Syst. 1994, 12, 297–310. [Google Scholar] [CrossRef]
  39. Tzeng, G.-H.; Chen, T.-Y.; Wang, J.-C. A weight-assessing method with habitual domains. Eur. J. Oper. Res. 1998, 110, 342–367. [Google Scholar] [CrossRef]
  40. Singla, A.; Sing Ahuja, I.; Sing Sethi, A. Comparative analysis of technology push strategies influencing sustainable development in manufacturing industries using Topsis and Vikor technique. Int. J. Qual. Res. 2018, 12, 129–146. [Google Scholar]
  41. Čereška, A.; Zavadskas, E.K.; Bucinskas, V.; Podvezko, V.; Sutinys, E. Analysis of steel wire rope diagnostic data applying multi-criteria methods. Appl. Sci. 2018, 8, 260. [Google Scholar] [CrossRef] [Green Version]
  42. Vavrek, R.; Kotulič, R.; Adamišin, P. District as a determinant of the evaluation of municipalities’ economy? Int. J. Appl. Mater. Sci. 2015, 53, 53–64. [Google Scholar]
  43. Širá, E.; Vavrek, R.; Vozárová, I.K.; Kotulič, R. Knowledge economy indicators and their impact on the sustainable competitiveness of the EU countries. Sustainability 2020, 12, 4172. [Google Scholar] [CrossRef]
  44. Yoon, K. Systems Selection by Multiple Attribute Decision Making; Kansas State University: Manhattan, KS, USA, 1980; pp. 1–20. [Google Scholar]
  45. Hwang, C.-L.; Yoon, K. Multiple Attribute Decision Making; Springer Science and Business Media LLC: Berlin, Germany, 1981; Volume 186. [Google Scholar]
  46. Lai, Y.-J.; Liu, T.-Y.; Hwang, C.-L. TOPSIS for MODM. Eur. J. Oper. Res. 1994, 76, 486–500. [Google Scholar] [CrossRef]
  47. Yoon, K.; Hwang, C.-L. Multiple Attribute Decision Making; Springer: Berlin, Germany, 1995; pp. 1–40. [Google Scholar]
  48. Liang, R.; Dong, Z.S.; Sheng, Z.; Wang, X.; Wu, C. Case study of selecting decision-making schemes in large-scale infrastructure projects. J. Infrastruct. Syst. 2017, 23, 06017001. [Google Scholar] [CrossRef]
  49. Bhutia, P.W.; Phipon, R. Application of AHP and TOPSIS method for supplier selection problem. J. Eng. 2012, 2, 43–50. [Google Scholar]
  50. Pavic, Z.; Novoselac, M. Notes on TOPSIS Method. Int. J. Res. Eng. Sci. 2013, 1, 5–12. [Google Scholar]
  51. Yin, J.; Yang, X.; Zheng, X.; Jiao, N. Analysis of the investment security of the accommodation industry for countries along the B&R. Tour. Econ. 2017, 23, 1437–1450. [Google Scholar] [CrossRef]
  52. Feng, C.-M.; Wang, R.-T. Performance evaluation for airlines including the consideration of financial ratios. J. Air Transp. Manag. 2000, 6, 133–142. [Google Scholar] [CrossRef]
  53. Markovic, L.; Mitrovic, S.; Stanarevic, S. The evaluation of alternative solutions for the highway route E-763 Belgrade-South Adriatic: A case study of Serbia. The. Vje. Tech. Gaz. 2018, 24, 1951–1958. [Google Scholar]
  54. Vavrek, R.; Bečica, J. Efficiency evaluation of cultural services in the Czech Republic via multi-criteria decision analysis. Sustainability 2020, 12, 3409. [Google Scholar] [CrossRef] [Green Version]
  55. Seyedmohammadi, J.; Sarmadian, F.; Jafarzadeh, A.A.; Ghorbani, M.A.; Shahbazi, F. Application of SAW, TOPSIS and fuzzy TOPSIS models in cultivation priority planning for maize, rapeseed and soybean crops. Geoderma 2018, 310, 178–190. [Google Scholar] [CrossRef]
  56. Zolfani, S.H.; Pourhossein, M.; Yazdani, M.; Zavadskas, E.K. Evaluating construction projects of hotels based on environmental sustainability with MCDM framework. Alex. Eng. J. 2018, 57, 357–365. [Google Scholar] [CrossRef]
  57. Chau, O.; Parkan, C. Selection of a manufacturing process with multiple attributes: A case study. J. Eng. Technol. Manag. 1995, 12, 219–237. [Google Scholar] [CrossRef]
  58. Rădulescu, C.Z.; Rădulescu, I.C. An Extended TOPSIS approach for ranking cloud service providers. Stud. Inform. Control. 2017, 26, 183–192. [Google Scholar] [CrossRef]
  59. Deng, W.; Deng, W.; Yang, X.; Li, D.; Li, Y.; Liu, J. Research on a robust multi-objective optimization model of gate assignment for hub airport. Transp. Lett. 2016, 10, 229–241. [Google Scholar] [CrossRef]
  60. Majumdar, B.B.; Mitra, S.; Pareekh, P. On identification and prioritization of motivators and deterrents of bicycling. Transp. Lett. 2019, 1–13. [Google Scholar] [CrossRef]
  61. Scheurer, J. How Intermediate capacity modes provide accessibility and resilience in metropolitan transit networks: Insights from a global study of 19 cities. J. Public Transp. 2016, 19, 107–125. [Google Scholar] [CrossRef] [Green Version]
  62. Galván, J.; Cantillo, V.; Arellana, J. Factors influencing demand for buses powered by alternative energy sources. J. Public Transp. 2016, 19, 23–37. [Google Scholar] [CrossRef] [Green Version]
  63. Foell, S.; Phithakkitnukoon, S.; Veloso, M.; Kortuem, G.; Bento, C. Regularity of public transport usage: A case study of bus rides in Lisbon, Portugal. J. Public Transp. 2016, 19, 161–177. [Google Scholar] [CrossRef] [Green Version]
  64. Eriksson, L.; Friman, M.; Ettema, D.; Fujii, S.; Gärling, T. Experimental simulation of car users’ switching to public transport. Transp. Lett. 2010, 2, 145–155. [Google Scholar] [CrossRef]
  65. Bilbao-Ubillos, J.; Fernandez-Sainz, A.; Heidenreich, N.; Sperlich, S. Flexible estimation of transport demand functions: Recommendations for public policy makers. Tran. Lett. 2015, 7, 241–251. [Google Scholar] [CrossRef]
  66. Wright, S. A European model for public transport authorities in small and medium urban areas. J. Public Transp. 2015, 18, 45–60. [Google Scholar] [CrossRef] [Green Version]
Figure 1. Weights of used indicators calculated with the use of CV method.
Mathematics 08 01765 g001
Figure 2. Total results of CV-TOPSIS method for period of years 2001–2016 (variant I.).
Mathematics 08 01765 g002
Figure 3. Total results of CV-TOPSIS method for period of years 2001–2016 (variant II.).
Mathematics 08 01765 g003
Figure 4. Comparison of regression models residuals in both variants. (a) regression model of CV-TOPSIS results with the capital city included; (b) regression model of CV-TOPSIS results with the capital city excluded.
Mathematics 08 01765 g004aMathematics 08 01765 g004b
Table 1. Application of selected parameters in multi-discrimination analysis.
ModelsCASLTAOCFCSCF
AltmanXXXXXX
TafflerX X XX
Beerman X X
IN 95XX XX
IN 99XXX XX
IN 01XX XX
IN 05XX XX
Bonity index X X
SpringateXXX X
PoznańskyXXX
Virág and HajdaXXX X X
CA—current assets, SL—short-term liabilities, TS—total assets, OC—own capital, FC—foreign capital, S—sales, CF—cash flow.
Table 2. Confirmed linear relation between results of CV-TOPSIS method for period of years 2001–2016 (variant I.).
2001200220032004200520062007200820092010201120122013201420152016
2001 0.35
2002 0.59 0.40 0.37 0.40 0.440.41
2003 0.59 0.40 0.46 0.440.410.410.440.46
2004 0.38 0.510.47 0.46
20050.350.400.40 0.38
2006 0.36 0.35 0.39
2007 0.460.38 0.420.460.420.440.480.350.44
2008 0.37 0.380.36 0.490.530.460.450.44 0.480.50
2009 0.44 0.420.49 0.700.500.540.42
2010 0.41 0.460.530.70 0.730.690.650.460.500.56
2011 0.41 0.420.460.500.73 0.750.740.530.540.49
2012 0.440.51 0.440.450.540.690.75 0.800.390.630.61
2013 0.400.460.47 0.480.440.420.650.740.80 0.450.670.59
2014 0.350.35 0.460.530.390.45 0.520.49
2015 0.44 0.46 0.440.48 0.500.540.630.670.52 0.74
2016 0.41 0.39 0.50 0.560.490.610.590.490.74
Table 3. Ranking of transport companies within entire monitored period (variant I.).
Transport Company of the City/CitiesAverageMedianThe BestThe Worst
Prague17.31171618
Karlovy Vary7.757.5313
Chomutov and Jirkov11.3111.5415
Liberec and Jablonec nad Nisou14.6315318
Most and Litvínov12.1312617
Brno5.384.5113
České Budějovice9.5610116
Děčín3.252.5111
Hradce Králové6.004.5116
Jihlava12.4415117
Olomouc9.259515
Pardubice8.638.5415
Ústí nad Labem9.699117
Ostrava10.0610.5117
Zlín-Otrokovice5.063.5112
Mariánské Lázně9.829616
Opava4.314115
Plzeň11.8812.5217
Table 4. Confirmed linear relation between results of CV-TOPSIS method for period of years 2001–2016 (variant II.).
2001200220032004200520062007200820092010201120122013201420152016
2001 0.53 0.42 0.43
20020.53 0.520.40 0.47 0.37
2003 0.43 0.58
2004 0.43 0.42 0.45
20050.420.520.430.43 0.370.370.420.380.370.42
2006 0.40 0.400.35
2007 0.40 0.57 0.37
2008 0.47 0.42 0.350.57 0.380.410.400.400.39 0.380.37
2009 0.58 0.38 0.530.49
2010 0.410.53 0.510.540.430.35 0.37
2011 0.37 0.400.490.51 0.590.50 0.460.50
2012 0.37 0.40 0.540.59 0.79 0.600.56
2013 0.450.42 0.49 0.430.500.79 0.600.56
20140.43 0.38 0.37 0.35 0.350.43
2015 0.37 0.38 0.460.600.600.35 0.69
2016 0.37 0.42 0.37 0.370.500.560.560.430.69
Table 5. Ranking of transport companies within entire monitored period (variant II.).
Transport Company of the City/CitiesAverageMedianThe BestThe Worst
Karlovy Vary4.13429
Chomutov and Jirkov8.138212
Liberec and Jablonec nad Nisou15.69161417
Most and Litvínov10.508.5317
Brno9.069114
České Budějovice11.0611.5616
Děčín2.75215
Hradce Králové8.068.5116
Jihlava9.069117
Olomouc11.2511.5716
Pardubice7.506.5116
Ústí nad Labem11.6313.5117
Ostrava12.81131017
Zlín-Otrokovice5.883.5115
Mariánské Lázně8.458316
Opava4.633115
Plzeň9.7510.5116
Table 6. Nature of the change resulted from inclusion of Transport Company Prague in the analysis.
Transport Company of the City/Cities01020304050607080910111213141516
Karlovy Vary++++-+++--+++-+-
Chomutov and Jirkov++++-++++++++++-
Liberec and Jablonec nad Nisou+++++++++++++++-
Most and Litvínov++++-+++--+++-+-
Brno+++--++++-+-+++-
České Budějovice++++-++++++++++-
Děčín+-++-+++-++++++-
Hradce Králové++++++++----+-+-
Jihlava++++-+++-+--+++-
Olomouc++++-++++-+++++-
Pardubice++++-++++-+++-+-
Ústí nad Labem++-+--+---++++++
Ostrava-+++-+++--+++++-
Zlín-Otrokovice+-++-+++----+++-
Mariánské Lázně-----++++-+++-+-
Opava++++-+++------+-
Karlovy Vary+-++-+++--++++++
Table 7. Pair comparison of absolute results in both analysis variants.
01020304050607080910111213141516
T-test (average)DDDDSDDDSSDSDSDD
Sign test (median)DDDDDDDDSSSSDDDD
D—statistically significant differences, S—not statistically significant differences
Table 8. Pair comparison of absolute rankings in both analysis variants.
01020304050607080910111213141516
T-test (mean)SSSSSSSSSSSSSSSS
Sign test (median)SSSSSSSSSSSSSSSS

