Abstract
The compressive strength of recycled concrete is acknowledged to be largely conditioned by the incorporation ratio of Recycled Concrete Aggregate (RCA), although that ratio needs to be carefully assessed to optimize the design of structural applications. In this study, Self-Compacting Concrete (SCC) mixes containing 100% coarse RCA and variable amounts, between 0% and 100%, of fine RCA were manufactured and their compressive strengths were tested in the laboratory for a statistical analysis of their strength variations, which exhibited robustness and normality according to the common statistical procedures. The results of the confidence intervals, the one-factor ANalysis Of VAriance (ANOVA), and the Kruskal–Wallis test showed that an increase in fine RCA content did not necessarily result in a significant decrease in strength, although the addition of fine RCA delayed the development of the final strength. The statistical models presented in this research can be used to define the optimum incorporation ratio that would produce the highest compressive strength. Furthermore, the multiple regression models offered accurate estimations of compressive strength, considering the interaction between the incorporation ratio of fine RCA and the curing age of concrete that the two-factor ANOVA revealed. Lastly, the probability distribution predictions, obtained through a log-likelihood analysis, fitted the results better than the predictions based on current standards, which clearly underestimated the compressive strength of SCC manufactured with fine RCA and require adjustment to take full advantage of these recycled materials. This analysis could be carried out on any type of waste and concrete, which would allow one to evaluate the same aspects as in this research and ensure that the use of recycled concrete maximizes both sustainability and strength.
1. Introduction
The varied environmental impacts of the construction sector are often of great magnitude [1], extending to resource-intensive materials [2], widely used in this sector, such as concrete and bituminous mixtures [3]. The recovery of waste sub-products for use in construction materials is now a widely accepted solution to this problem [4], to reduce these impacts [5], and to minimize dumping in landfill sites [6]. Waste with pozzolanic properties that can substitute clinker [7] is specified in European standard EN 197-1 [8]. Replacing Natural Aggregates (NAs) with waste sub-products [9] is, likewise, a valid strategy, if the effect of each particular waste is evaluated [10] in order to get a correct mix design of the construction material [11]. The most used by-products are Recycled Concrete Aggregate (RCA) [12]; slag, both in concrete [13] and asphalt mixes [14]; rubber [15].
There are three main characteristics of RCA. Firstly, its angular shape, due to the crushing process. Secondly, the presence of adhered mortar, which causes lower wear resistance, a greater water absorption, and the appearance of Interfacial Transition Zones (ITZs) of poor quality [16]. Finally, the presence of altered and potentially contaminated cement particles within the finest fraction [17].
Self-Compacting Concrete (SCC) is a high flowability concrete in the fresh state, characterized by its slump flow and viscosity [18]. The slump-flow test measures the ease with which the concrete will pour, while the viscosity index is related to the speed of flow [19]. The addition of RCA, in general, worsens both aspects, due to its angular shape [20], which hinders the flow of aggregate particles within the paste [21], and its high water absorption, which decreases the effective water-to-cement (w/c) ratio [22]. This last aspect can be compensated by increasing the water content [23]. Another possible solution is to use RCA with a high fine particle proportion, although it implies a decrease in concrete strength [24].
The most important property of concrete in the hardened state, including SCC, is its compressive strength [25], to which most structural calculations refer [26,27]. The standardized strength is referred to as the characteristic strength, and it can be used for a theoretical estimate of the modulus of elasticity or the tensile strength [28]. This strength is obtained through the statistical treatment of a large number of experimental data, all of which are necessary as this material is not homogeneous and can be affected, for example, by irregular aggregate distributions [28,29]. Most of the statistical models developed to predict the compressive strength of vibrated concrete with NA show that the quantities of the mix components and the w/c ratio are the key aspects that influence this strength [30,31]. The characteristics of the NA and their gradation have much less influence [32]. However, the characteristics and amount of waste are key factors in the compressive strength of the recycled concrete.
In principle, the replacement of NA by RCA, in any fraction, decreases the compressive strength of SCC [33], due to the presence of contaminants and ITZs with poor adhesion [34]. However, a lower water content can yield higher strengths than those obtained with NA, by decreasing the effective w/c ratio [35], although the flowability of the SCC will worsen [36]. A literature review of over 60 studies on vibrated concrete, conducted by Portuguese researchers [30], showed this trend (lower strength when increasing the RCA content). The same trend has also been observed in SCC [37].
Statistical studies of compressive strength in non-recycled SCC are very scarce and focus on the validity of Artificial Neural Networks and multivariate models that can predict compressive strength as a function of the composition of the mix [27,38]. The acceptability of these procedures has been demonstrated, but their disadvantage is that they only evaluate strength at the standard age of 28 days [39]. In relation to recycled concrete, regardless of its type, the influence of different cement components has been statistically evaluated [40], as well as the good fit of normal probability distribution to the compressive strength if coarse RCA is used [41]. Correct statistical studies allow one to predict both the compressive strength when a certain waste is used and the optimal amount to add of this waste. With this kind of analysis, it is possible to adapt the strength of concrete to the requirements of each structural application [42]. Nevertheless, there is a lack of research that statistically evaluates the strength behavior of recycled concrete and the effect of the waste used. Therefore, this study aims to fill this gap of knowledge in the field of concrete.
Previous research has demonstrated the good performance of coarse RCA [21,37], so the sustainable SCC designed included 100% of coarse RCA. Therefore, the study focused on the effect of different percentages of RCA in the fine fraction (0, 25, 50, 75, and 100%). Both the flowability and the compressive strength of the mixes were analyzed. Moreover, an experimental procedure was designed to discard the effect of the water content [35] and the curing conditions [43], and then isolate the effect of the fine RCA content.
The novelty of this study lies in the extensive laboratory work carried out and the statistical analysis of the compressive strength afterwards. This analysis is quite significant and allows us to study some aspects that the traditional descriptive analysis does not cover:
- Evaluating the effect of RCA at each age and the significance of the differences in the strength of concrete made with different RCA ratios. This way, it is possible to detect whether the same performance can be expected with different waste contents, and to define the optimum ratios from the strength point of view.
- Developing models to estimate the compressive strength of SCC with RCA. The effect of the residue is different at each age and the interaction between these two parameters, age and RCA content, must be considered when developing these models.
- Analyzing if the predicted values of the compressive strength according to the existing structural design regulations are suitable for recycled SCC.
Therefore, this study allows us to obtain relevant conclusions regarding how the analysis of SCC with RCA should be carried out. This analysis includes the evaluation of the significance of the effect of RCA, the estimation of the strength, and the analysis of the existing regulations for the design of this type of concrete. These aspects are important for the generalization and standardization of the analysis of the SCC produced with RCA.
In addition to the particular conclusions reached for the material studied, another scope of this research is the development of the study procedure, which is described in detail. Therefore, it could be replicated in any type of concrete manufactured with any alternative material. With this type of analysis, the use of sustainable materials in real structures is closer.
2. Materials
CEM I 52.5 R was used, according to EN 197-1 [8], in all mixtures, with a clinker content of 95% and a density of 3.12 Mg/m3. The mix water was taken from the mains water supply of the city of Burgos, Spain.
Proper use of chemical admixtures is essential to achieve self-compacting properties [44]. In this study, a plasticizer gave the concrete a high level of flowability. In addition, a viscosity regulator was also added, so that the concrete retained its flowability for longer. Previous studies of this research group have shown the validity of these admixtures in proportions between 2% and 2.2% by weight of cement [35].
The mixes were developed with three different types of aggregates:
- RCA—supplied by a local Construction and Demolition Waste (CDW) management company (IGLECAR S.L.) based in Burgos. This waste came from crushing 45 MPa strength prefabricated elements, rejected due to aesthetic manufacturing defects. The initial granulometry, 0/31.5 mm, was sieved into three fractions: fine RCA 0/4 mm, coarse RCA 4/12.5 mm, and RCA > 12.5 mm. The first two fractions were used and the third was discarded and posteriorly re-crushed.
- Rounded siliceous sand 0/4 mm—used in the region to elaborate SCC.
- Limestone filler—with a size below 0.063 mm and high purity (CaCO3 content above 98%), to provide the finest particle size fraction [45].
The physical properties of these aggregates, shown in Table 1, were in line with other similar investigations [46]: the presence of adhered mortar reduced the density and increased the water absorption of the RCA in comparison with the NA [47]. The content of particles of less than 0.125 mm in size was higher in the RCA, a very relevant aspect for the flowability of the SCC, as can be seen in Figure 1 and Table 2.

Table 1.
Physical properties of the aggregates.
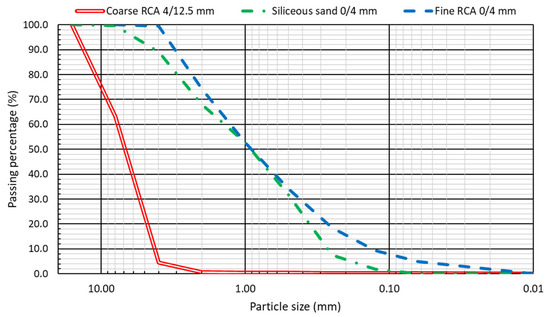
Figure 1.
Aggregates’ sieve analysis.
Table 2.
Gradation of the aggregates (EN 933-1 [8]).
3. Experimental Procedure
As large proportions of fine aggregate are required by SCC [48], its performance is very sensitive to the presence of residues within that fraction [33]. For this reason, this study evaluated the effect of adding fine RCA on the compressive strength of SCC with 100% coarse RCA at different ages, while minimizing the influence of other variables such as water content and curing conditions. To do so, the following experimental procedure was developed:
- Having an optimal SCC with 100% NA in the fine fraction and 100% RCA in the coarse fraction, the NA content was replaced by 25, 50, 75, and 100% fine RCA. The mixtures were labelled SA0, SA25, SA50, SA75, and SA100, in which the acronym “SA” and the following number refer to “Statistical Analysis” and to the percentage of fine RCA, respectively.
- In each mix, all the aggregates, except the filler, were pre-soaked for 24 h, which managed to maintain the effective w/c ratio constant (at a value of 0.45) in all the mixes. As RCA water absorption can be very prolonged over time [49], this long pre-soaking time (24 h) was chosen to achieve complete stabilization of water absorption. Thus, the effect of the variable “water content” in the experiment was eliminated. In addition, the behavior of the RCA may be optimized with this procedure, although it requires prior preparation of the aggregates and it is not economically profitable [50].
- The mixing process consisted of a single stage, first adding the aggregates after drying their surface (SSD conditions) [50], then the cement, and finally the water with the admixtures dissolved. The concrete, 60 L per mix, was mixed in a horizontal-axis mixer for 1 min.
- When the mixing process was finished, the fresh state tests were carried out (Table 3) and 32 cylindrical 10 × 20 cm specimens were made for the compressive-strength test. Thirty minutes after mixing, the slump-flow test was repeated with the rest of the concrete mass, to evaluate the evolution of flowability over time [49].
Table 3. In-fresh state tests on each mix.
- The specimens were left in their molds for 22 h under laboratory conditions: at a temperature and a humidity level of 20 °C and 60%, respectively. Subsequently they were demolded and, 23 h after the mixing process, were placed in a wet chamber (temperature of 20 ± 2 °C and humidity of 95 ± 5%), until the time of testing.
- At ages 24 ± 1 h (1 day), 168 ± 1 h (7 days), 672 ± 1 h (28 days), and 2160 ± 1 h (90 days), from the manufacturing of the mixes, 8 specimens were subjected to the compressive-strength test, EN 12390-3 [8], obtaining the data for the statistical analysis. With these precise moments of time, the effect of the variable “curing conditions” on the strength of SCC was eliminated: all the mixtures were tested at exactly the same age and after they had been in the same humidity and temperature conditions for the same time.
Some images of the most outstanding steps of the experimental plan are shown in Figure 2. On the other hand, the dosage of each mix is shown in Table 4. As the aggregate was pre-soaked, the amount of water added to each concrete mixture was the same.
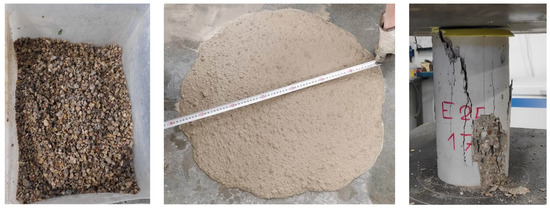
Figure 2.
Highlights of the experimental plan: coarse RCA pre-soaked (left), slump-flow test of mix SA50 (middle), and specimen tested for compressive strength (right).
Table 4.
Mix design (kg/m3).
4. In-Fresh Behavior
The results of these tests (Table 5) were in line with expectations, as stated in the introduction: the decrease in flowability, due to the addition of RCA, can be compensated by the increase in the water content, in this case by pre-soaking [50]. Thus, only the effect of fine RCA was evaluated, with aggregate water absorption having no influence.
Table 5.
Results of in-fresh state tests.
A very different effect of the residue was observed in relation to slump flow and viscosity according to a descriptive analysis:
- The fine RCA slightly increased the flowability (slump-flow and L-box tests) [24]. Mixture SA100 showed a 4.7% higher slump flow than mixture SA0, and the improvement in the L-box test was 5.8%.
- The addition of fine RCA resulted in an increase in viscosity [49]. The results for mixture SA100 in the slump-flow (t500) and in the V-funnel tests were, respectively, 28.6% and 70.8% higher than the results for mixture SA0.
This behavior can be explained by the content of particles smaller than 0.125 mm of fine RCA, which was higher than that of the NA (see the fineness modulus in Table 2, and Figure 1). As the entire NA fraction 0/4 mm was replaced simultaneously by fine RCA, it was not done size-by-size, the proportion of cement paste was greater when this waste was added. Therefore, the aggregate particles were evenly interspersed and dragged within the paste in the mixtures with fine RCA. This led to the increase in the slump flow [21]. However, this higher proportion of cement paste also resulted in a more viscous consistency and slower movement [33]. Sieve segregation was reduced as the fine RCA content increased due to the increase in viscosity and its higher water absorption [19].
After 30 min of the end of the mixing process, the overall decrease in slump flow was 4%, and t500 increased by 3%. The pre-soaking of the aggregates caused the water absorption by the aggregate to be minimal, thus favoring an optimum temporary conservation of self-compactability [50].
No clear influence of the fine RCA on the air content was observed, which was mainly controlled through the use of admixtures [51]. Nevertheless, other studies have stated that admixtures do not control the air content of the mix [52] and that it increases as the fine RCA content increases [33]. The fresh density of SCC decreased when replacing NA by RCA, due to its lower density [49].
The descriptive analysis can be completed with the one-factor ANalysis Of VAriance (ANOVA). By this statistical procedure it can be determined whether the effect of the factor (in this case, fine RCA content) is significative if the variances of the mixes are similar [53]—an aspect that is checked with two hypothesis tests explained in detail in Section 5.6. The results of this analysis are the p-value and the homogeneous groups. The effect of the factor will be significant when the p-value is lower than the chosen significance level (in this case the most usual one, 5% [41]). On the other hand, the homogeneous groups indicate the factor values that provide significantly equal results. The results obtained from the ANOVA carried out for the fresh state tests performed (all mixes exhibited a similar variance) are collected in Table 6 and show that:
Table 6.
One-factor ANOVA of the fresh properties.
- The behavioral differences obtained between mixtures with different percentage of fine RCA regarding the passing ability and the air content were not significative.
- Any variation in RCA content significantly affected both viscosity, which increased when adding fine RCA, and fresh density, which decreased with the addition of fine RCA. No homogeneous groups were obtained.
- Slump flow and resistance to segregation were significantly equal for 0–50% and 75–100% fine RCA contents. The increase in fines content experienced by SCC mixtures with the addition of RCA increased filling ability (slump flow) and resistance to segregation, thus compensating for the effect of the irregular shape of RCA.
5. Compressive Strength: Statistical Analysis and Strength Prediction
This section includes the statistical procedure carried out to evaluate the effect that the addition of different amounts of fine RCA will have on the compressive strength of SCC at different curing ages. Thanks to the experimental procedure designed (Section 3), the remaining variables that might potentially influence compressive strength (water content and curing conditions) were completely discarded [43]. This section includes the steps performed sequentially to obtain conclusions and which could be applied to any type of waste or concrete.
5.1. Stages of the Statistical Analysis
Eight 10 × 20 cm cylindrical specimens were subjected to a compressive-strength test at 1, 7, 28, and 90 days (Table 7) for each mix. All these values were required for applying all the statistical procedures collected in this paper [41], main novelty regarding previous similar studies [54].
Table 7.
Compressive strength (MPa) values by mix and by age.
The statistical analysis was performed with the above values. The aspects under evaluation were:
- The robustness of the measurements (Section 5.2).
- The normality of the compressive strength (Section 5.3).
- The confidence intervals of the compressive strength and its dispersion (Section 5.4).
- The influence of the age and the percentage of fine RCA (Section 5.5 and Section 5.6).
- The estimation of the compressive strength (Section 5.7).
- The determination of the characteristic strength (Section 5.8), which is the main property of concrete in any structural design.
A significance level of 5% was also used throughout this analysis (α = 0.05), as in the analysis of the properties in the fresh state, which is very common and widely accepted in this type of studies [41].
5.2. Robustness
A robustness analysis will detect anomalous data, which are results that are not in harmony with the other measures. The absence of such data is fundamental to the application of any statistical procedure, as they will affect the significance of the analysis.
Two approaches were followed to assess the existence of anomalous data (outliers):
- They can be visually detected within the box and whiskers plot (outliers are the data that are not within the limits of the diagram, defined by the whiskers).
- The comparison between the traditional indicators (arithmetic mean and standard deviation) and the robust indicators (median, trimmed mean 5%, winsorized mean, winsorized standard deviation, and Sbi), which are not affected by the presence of this type of data. In the absence of anomalous data, both types of indicators have very similar values.
In this study, the existence of anomalous data would indicate inappropriate breakage of specimens and, above all, a lack of homogeneity of the RCA in use: an eventual increase in the content of fine fractions (<1 mm) would cause notably lower strengths (anomalous data).
All the indicators commented upon for each mixture, at each age are shown in Table 8, while Figure 3 shows the box and whiskers graphs at 1 and 28 days. It can be seen that the traditional and robust indicators presented very similar values, and the box and whiskers graphs showed no outliers. It can therefore be stated that the data agreed with each other and that no anomalous data were present, so all the data were incorporated in the analysis. Furthermore, the results show the great homogeneity in the compressive-strength behavior of all the mixtures that were produced, a fundamental aspect when this waste is used [33]. Therefore, the distribution of fine RCA was uniform in all of them.
Table 8.
Both traditional and robust indicators of the compressive strength in MPa of the mixtures.
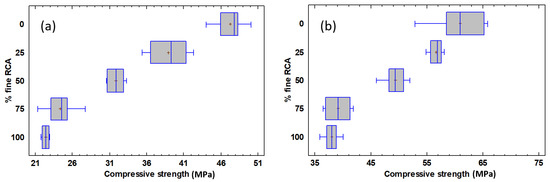
Figure 3.
Box plot for all mixes: (a) 1 day; (b) 28 days.
5.3. Normality
Data normality was validated with three hypothesis tests: the Chi-square test, the Saphiro–Wilk test, with which the histogram and the quartiles of each variable were, respectively, compared with those corresponding to a normal distribution, and the Z-asymmetry test, which evaluates the symmetry of the data. All these tests have as their null hypothesis that the data sample will follow a normal distribution, which is rejected if its p-value (Table 9) is lower than the significance level (in this study, 0.05).
Table 9.
p-value for the normality tests of the compressive strength of each mixture at each age.
It is known that the strength of non-recycled concrete conforms to a normal distribution [28]. If the RCA concretes also complied with this distribution, then similar calculation procedures would be applicable [28,29].
It may be observed that the p-value of these three tests was higher than 0.05, so the compressive strength of each mixture at each age followed a normal distribution. Nevertheless, there was an exception: at 28 days, mix SA75 presented an incompatible histogram with the normal distribution (Chi-square test) at a confidence level of 95%, although it was compatible with that distribution at a significance level of 0.01. This discrepancy was due to the concentration of the experimental results in two small intervals (around 37 MPa and 41 MPa), with no intermediate values (see Table 7). A significance level of 0.01 was therefore used for mixture SA75 at 28 days throughout the rest of the study.
5.4. Confidence Intervals
The confidence intervals for the arithmetic mean and the absolute and the relative standard deviation (Table 10 and Figure 4) inform us of the values between which a variable is found for a certain level of confidence. Thus, it can be ascertained whether, for example, an overlap is possible between the strengths obtained in the concretes with different percentages of fine RCA.
Table 10.
Confidence intervals for mean and standard deviation of compressive strength for each mixture and age.

Figure 4.
Graph of the confidence intervals of the arithmetic mean.
The arithmetic mean confidence intervals showed several relevant aspects (see Figure 4):
- In almost all mixtures, the 28-day and 90-day confidence intervals overlapped, with their strengths developing mainly during the first 4 weeks. The 7-day and 28-day confidence intervals also overlapped in two mixes, SA0 and SA25, showing that, in principle, the increase in the content of this residue caused a slower development of strength.
- Comparing the confidence intervals of different mixtures with each other, it was found that they overlapped in mixtures SA0 and SA25, as well as in mixtures SA75 and SA100, at 7, 28, and 90 days. Therefore, the strength of mix SA25 might be greater than the strength of mix SA0 at any of these ages, despite the higher fine RCA content of the first one. This behavior of mixture SA25 was mainly due to the higher fines content of fine RCA compared to NA (see Figure 1), which produced a “filler effect” that increased the expected compressive strength of SCC. On the other hand, mixtures SA75 and SA100 also did not show a significant difference in their compressive strength. Therefore, it seems, in principle, that strength can increase, despite a small increase in fine RCA.
The standard deviation confidence intervals show the dispersion of the compressive strength. At early ages (1 and 7 days), there was no clear trend in the dispersion of results with respect to the fine RCA content, although at older ages (28 and 90 days), the dispersion decreased as the percentage of fine RCA increased. Therefore, in spite of the contaminants present in the RCA, the concretes that contain fine RCA can show a homogeneous behavior.
5.5. Pearson Correlations
A correlation between two variables is a number between −1 and 1 that shows the linearity of the relationship between them. If there are more than two variables, the correlations are obtained by pairs of variables ignoring the others. The closer the absolute value is to 1, the greater the linearity, while if the sign is positive or negative it indicates whether the relationship is increasing (if one variable increases, so too is the other) or decreasing.
In this study, the variables considered were compressive strength, age, and percentage of fine RCA. It is clear that the correlation between compressive strength and age is positive and, according to existing studies [49], is negative between this strength and the percentage of fine RCA. However, the absolute value, indicated in the correlation symmetric matrix (Figure 5), shows that the effect of the percentage of fine RCA on the compressive strength was 83% ((0.75–0.41)/0.41·100) greater than the effect of the passing of time. The compressive strength was mainly conditioned by the residue content of the SCC.
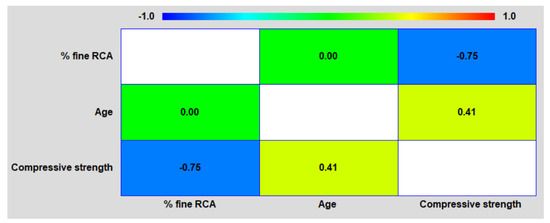
Figure 5.
Pearson correlation matrix.
5.6. Effect of Age and Percentage of Fine RCA on Compressive Strength
The effect of each factor (age and fine RCA percentage) can be separately analyzed when the other factor takes a particular value, rather than neglecting it (as in correlations). An example would be the effect of the percentage of fine RCA at the age of 7 days or the effect of age, if the percentage of fine RCA was 50%.
The usual statistical procedure for this analysis is the one-factor ANOVA, which was also used in the statistical analysis of the fresh properties. In this case, this statistical test states as its null hypothesis that there is no effect of the factor (age or fine RCA percentage) on the variable (compressive strength), providing a p-value that indicates whether to accept or to reject the null hypothesis. ANOVA must be applied to independent measurements (in our case, each compressive strength value was from a different specimen and was therefore independent). Likewise, the variances of the variable must be significantly equal for each value of the factor under analysis, which was evaluated with two hypothesis tests, Cochran test and Bartlett test, the null hypothesis of which is that the variances are equal (Table 11).
Table 11.
p-value for both the Cochran test and the Bartlett test.
These tests on the age factor showed that the variance was significantly equal in all cases except for 25% fine RCA, at a significance level of 5%. For this reason, the one-factor ANOVA with a significance level of 1% was applied, except for 25% fine RCA, for which the significance level of 5% was maintained.
For the fine RCA percentage factor, the low p-values of the Bartlett test prevented the use of the one-factor ANOVA, regardless of the level of significance. Therefore, the Kruskal–Wallis test was used, which is similar to the one-factor ANOVA, although it requires no equal variances, as it is a robust procedure. Both procedures allow homogeneous groups to be obtained, i.e., those factor values (age or fine RCA percentage) for which there is no significant difference in the value of the variable (compressive strength). In this study, the homogeneous groups would indicate at which ages the compressive strength of a mixture (specific fine RCA percentage) no longer varies and for which fine RCA percentages the compressive strength is statistically the same (at a specific age). The results of this analysis are shown in Table 12.
Table 12.
Results of ANOVA analysis and Kruskal–Wallis test.
The results of the ANOVA/Kruskal–Wallis test were consistent with the above-mentioned studies [33] and with the correlations: both factors, age and fine RCA percentage, influenced the compressive strength. The homogeneous groups confirmed the trends shown by the confidence intervals:
- The compressive strength development of the SCC was slower as the fine RCA content increased. The compressive strength of mixture SA0 was statistically identical at 7, 28, and 90 days, while this strength for mixtures SA50 and SA75 was statistically different at 7 days and was the same at later ages (28 and 90 days). Mixture SA100 showed different strengths at all ages.
- In contrast, the factor fine RCA percentage showed that the compressive strengths of mixtures SA75 and SA100 were statistically equal, as they were in mixtures SA0 and SA25, at both 7 and 90 days. It can therefore be stated that the effect on the compressive strength of the fine RCA content can statistically be divided into three groups with the same strength: low percentage (0–25%), medium percentage (50%), and high percentage (75–100%). Therefore, according to the statistical results obtained, in this study the optimal amount of fine RCA would be 25–50% from the strength point of view, depending on the level of self-compactability and sustainability required for the mixture. Nevertheless, if the beneficial effect of the higher fines content of RCA is to be maximized, the incorporation of fine RCA in SCC should be less than 25%.
Finally, the interaction between the factors (age and percentage of fine RCA), i.e., whether the effect of one factor is different depending on the value of the other factor, can be assessed by means of a two-factor ANOVA. Since a p-value of 0.0034 was obtained, the interaction between both factors was significant (at any confidence level). A result indicating that no generalization is possible and that the effect of fine RCA on compressive strength should in particular be studied for each age and each fine RCA percentage, which is the approach followed in this section. This interaction also conditions the estimation of compressive strength as a function of RCA content and age, as explained in the next section.
5.7. Compressive Strength Regression
Simple regression models were developed as a function of the compressive strength and its dependence on two variables: age and percentage of fine RCA. A process similar to one-factor ANOVA was performed: each mixture (different fine RCA percentages) was studied at each age, as the interaction between both factors was significative. Table 13 shows, for each situation, the two models with the best fit with their coefficient R2. The variables used are CS (mean values of Compressive Strength, in MPa), FRP (Fine RCA Percentage, in percentage), and A (Age, in days). These were fitted with the arithmetic mean of the compressive strength for each fine RCA percentage and age (see Table 8). The best-fit models are shown in Figure 6 (compressive strength as a function of age) and Figure 7 (compressive strength as a function of fine RCA percentage).
Table 13.
Best-fit models of compressive strength as a function of the fine RCA percentage and age.
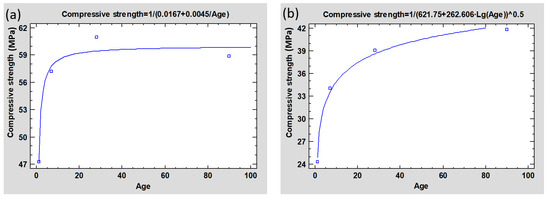
Figure 6.
Best-fit models of compressive strength as an age function: (a) mix SA0, also valid for mixtures SA25, SA50 and SA100; (b) mix SA75.
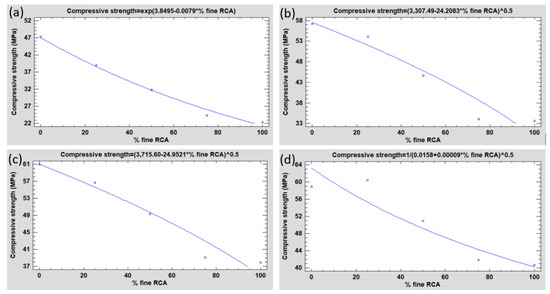
Figure 7.
Best-fit models of compressive strength as a fine RCA percentage function: (a) 1 day; (b) 7 days; (c) 28 days; (d) 90 days.
With all the above, it is observed that the simple regression provides an optimal adjustment of the compressive strength, reaching R2 coefficients of 99%. However, four aspects should be highlighted:
- A good fit was obtained for both the age and the percentage of fine RCA, although better R2 coefficients were obtained for the function of the age.
- The adjustment according to the percentage of fine RCA worsened with the age of the concrete: the longer the time that had elapsed since the concrete was mixed, the less reliable the estimate of its compressive strength.
- The adjustment of the compressive strength by age was robust: the best-fit model was unchanged when the percentage of fine RCA varied, only the coefficients (a, b) changed. For all mixtures, except mix SA75, the best-fit model followed Equation (1).
- When the compressive strength was fitted to the percentage of fine RCA, the best-fit model varied with age (there were three different models, for four different ages). This makes it difficult to obtain a valid overall model.
It can therefore be concluded that in order to predict the compressive strength of an SCC made from fine RCA using single-variable models, the best option was to do so as a function of age (for each specific percentage of fine RCA). This approach achieves greater stability and accuracy.
Obtaining a multiple regression model is very useful, since it allows the strength of all the mixtures to be predicted (different percentages of fine RCA) at any age by means of a single expression. Firstly, the simplest linear model was evaluated, as shown in Equation (2). It presented a poor fit (coefficient R2 of 78%), which is explained by the large width of the confidence intervals of all its coefficients (Table 14) and the low correlation between the different variables (Figure 5). Therefore, and secondly, from the combination of the simple regression models with a better fit, a more complex multiple model was developed, as indicated in Equation (3), reaching a correlation coefficient of 96.5%. It can be seen that this model, unlike the simple regression models, has a much more complex formulation with four terms: an independent term, two terms that each depend on a variable (age and percentage of fine RCA) and a fourth summand that reflects the effect of the interaction between both variables (discussed above in the two-factor ANOVA). The variables involved in both models are the same as in the simple regression (CS, FRP, and A), whose valid ranges are A ≥ 1 day and FRP = 0–100%. Figure 8 shows the estimated values compared to the experimental values of both models, clearly supporting the higher precision of the second model.
Table 14.
Main results for the model obtained by multiple linear regression (Equation (2)).
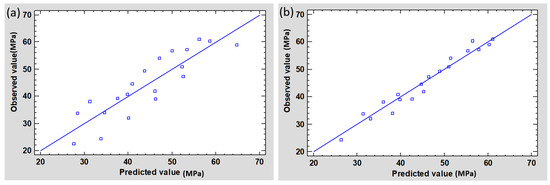
Figure 8.
Relationship between observed values and estimated values of compressive strength: (a) linear model; (b) multiple regression proposed model.
The proposed models are not intended to be general models that can be applied independently of the composition of the mixtures since, for example, the effect of adding different types or quantities of cement, variations in the w/c ratio or different compressive strength of the original concrete of the RCA have not been evaluated. Nevertheless, this model can be useful to predict the behavior of SCC with a compressive strength of 40–60 MPa at 28 days, as shown in Figure 9. In this figure, the results obtained are compared with the values collected in the few existing investigations in which the elaboration of SCC with RCA was approached. At most, the difference between the experimental value and the value estimated by this model is less than 5–8 MPa. In addition, the estimated value is generally lower than the experimental one. This allows us to carry out a safe estimation of the compressive strength of this type of concrete.
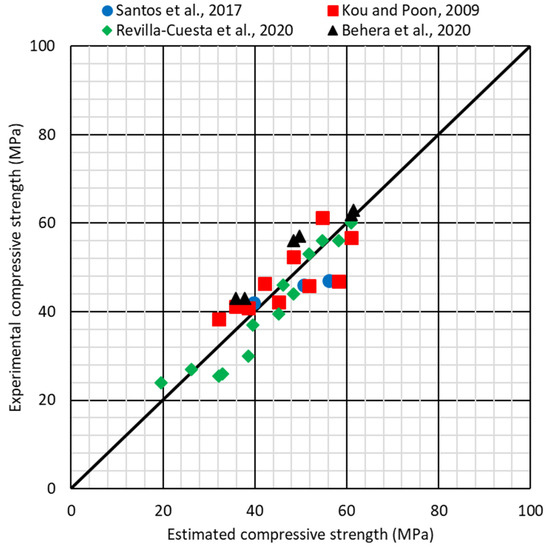
Figure 9.
Validation of the model developed (Equation (3)) throughout other similar studies [4,24,54,55].
However, the main utility of this model is that it does allow us to establish some guidelines for the prediction of the compressive strength of recycled concrete; in this case SCC, which can serve as a starting point. On the one hand, the amount of recycled aggregate added, in this study fine RCA (coarse RCA content was 100% for all the mixes), has a significant influence on the compressive strength and must be considered. On the other hand, the effect of recycled aggregate varies with age (interaction), which makes it necessary to introduce a term in the model that reflects it. The models developed for non-recycled concrete do not reflect these aspects, as NA does not affect the behavior of concrete in this way [32].
5.8. Probability Distributions Fitting: Characteristic Strength
The characteristic strength of concrete is the compressive strength value for which the probability of the actual compressive strength being lower is 5% at an age of 28 days, according to the standards [28,29]. This strength is used in structural design and its determination is made by adjusting the experimental values to the normal probability distribution and determining the 5% percentile [41]. However, other probability distributions may be better fitted to the experimental data.
In Section 5.3, the normality of the results was evaluated, concluding that the compressive strength of each mixture at any age could be adjusted to a normal distribution, whose expression is shown in Equation (4). Nevertheless, a log-likelihood study indicated that the probability distribution that best fitted the experimental data was the Weibull distribution, shown in Equation (5), except for the mix SA100, which was the gamma distribution, shown in Equation (6). In the normal distribution, µ and σ are the arithmetic mean and standard deviation of the experimental data, respectively. In the Weibull and gamma distribution, k and λ are the shape and scale parameters, respectively, i.e., the parameters of distribution fitting. All these parameters for each mixture are given in Table 15 for the 28-day compressive strength.
Table 15.
Adjustment parameters for the probability distributions of the 28-day compressive strength.
It is possible to determine the characteristic compressive strength of each mixture by obtaining the 5% percentile if the probability distributions are known. Table 16 shows the characteristic strength according to the normal distribution and the best-fit distribution (Weibull or gamma) for each mixture. In addition, this table also shows the normalized value according to the Spanish Instruction of Structural Concrete EHE-08 [29], calculated by approximating the value obtained to the standard series (20, 25, 30, 35, 40, 45, 50, 55, 60, 70, 80, 90, and 100 MPa). Figure 10 shows the calculation of the 5% percentile for each mixture in the best-fit distribution (Weibull or gamma).
Table 16.
Characteristic compressive strength of the mixes developed.
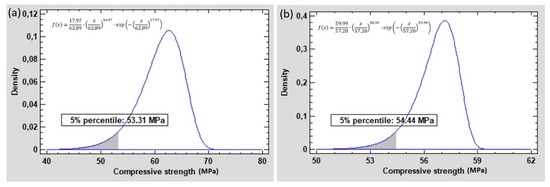
Figure 10.
Graph of the characteristic compressive strength for the best-fit distribution (Weibull and gamma): (a) SA0; (b) SA25; (c) SA50; (d) SA75; (e) SA100.
The values obtained show that mixtures with larger quantities of fine RCA can present the same characteristic strength as others with a lower fine content. Therefore, if structural calculations are to be performed, each mix developed with these sorts of recycled aggregates must be separately studied. The characteristic strength of concrete may not be affected by the increased amounts of recovered waste because, as shown in Table 16, mixes with 0 and 25% fine RCA had the same standardized characteristic strength, as also did mixtures incorporating 75 and 100% fine RCA.
Finally, both EC-2 [28] and EHE-08 [29] estimate characteristic compressive strength (fck, in MPa) by Equation (7) as a function of 28-day medium compressive strength (fc,m, in MPa, see Table 8). This expression was only valid for mix SA0, underestimating the characteristic strength between 4 and 6 MPa for the rest of the mixtures that incorporate fine RCA (Table 17). This is due to the sharpest form of the adjusted probability distribution, so that the use of this expression would not allow us to employ all the strength capacity of these mixtures, with the consequent economic loss. This is one of the reasons why the analysis of this article is fundamental in concrete for structural use.
Table 17.
Comparison between the characteristic strength obtained by calculation and that obtained through the standards.
6. Conclusions
Throughout this article, the flowability and the compressive strength of a Self-Compacting Concrete (SCC) made with Recycled Concrete Aggregate (RCA) have been analyzed. The compressive strength was also subjected to an extensive statistical analysis, which allowed us to evaluate different aspects than the traditional descriptive analysis.
Regarding the flowability, it was verified that it is possible to achieve SCC using high quantities of coarse and fine RCA (up to 100% incorporation ratios). The higher proportion of fine particles of the RCA (fine fraction), compared to Natural Aggregate (NA), resulted in higher slump flow and slower movement, which reduced the risk of segregation. Nevertheless, the most relevant conclusions are related to the statistical evaluation of compressive strength:
- The behavior of fine RCA in relation to the compressive strength of SCC was homogeneous, as no discordant breaks occurred in any mixture at any age (anomalous data). The dispersion was reduced with higher contents of fine RCA.
- The compressive strength of SCC in all the mixtures was properly fitted to a normal probability distribution, although the Weibull and gamma distributions showed the best fit. Characteristic compressive strength was underestimated when applying the standard estimation methods to mixtures with fine RCA.
- The dispersion of the compressive strength values obtained in the mixtures with RCA led the variance of the different mixtures not to be considered statistically equal. Therefore, the analysis of the effect of RCA could not be carried out using the usual procedures and required unusual robust procedures such as the Kruskal–Wallis test, which is not influenced by the variance of the mixtures.
- The addition of fine RCA, at a constant effective water-to-cement (w/c) ratio, reduced the compressive strength, being its influence greater than age. However, the addition of a larger amount of fine RCA was not always associated with a significant decrease in that strength: mixtures with low fine RCA content (0 and 25%), and high content (75 and 100%) showed, respectively, the same strength in statistical terms. Therefore, the normalized characteristic compressive strength was also the same in each batch. Thus, according to the results of the ANalysis Of VAriance (ANOVA), the optimum RCA content in the concretes developed would be 25–50% from the strength point of view. The exact amount should be defined by the assessment of flowability, service requirements of the structure, and sustainability criteria.
- With respect to age, the addition of fine RCA delayed the development of strength: for 0% fine RCA, the compressive strength at 7, 28 and 90 days was statistically equal, while for 100% fine RCA, the strength at each age was significantly different. The interaction between age and percentage of fine RCA makes the strength behavior of each mixture different. This implies that it is not possible to establish a clear generalization of the expected behavior of concrete with RCA: the effect of each RCA content must be studied in detail at each age.
- The most accurate and simplest techniques to estimate compressive strength were simple age-dependent regression models, while the models for predicting the compressive strength as a function of the fine RCA percentage showed imprecisions at advanced ages. The multiple regression model that has been developed provided highly reliable estimations, although its formulation was more complex. The interaction between RCA content and age should be considered for an accurate estimation of compressive strength.
This statistical approach towards the analysis of the compressive strength of an SCC containing coarse and fine RCA is intended to show a useful way of both addressing the problems associated with recycled aggregate and of arriving at conclusions that facilitate its use in real structures and the prediction of its strength. This procedure could be applied to any type of waste, making the structural use of recycled concrete more feasible.
Author Contributions
Conceptualization, V.R.-C., M.S. and V.O.-L.; methodology, V.R.-C. and V.O.-L.; software, V.R.-C.; validation, M.S., A.B.E. and A.S.; formal analysis, V.R.-C., A.B.E. and A.S.; investigation, V.R.-C. and A.B.E.; resources, M.S., A.S. and V.O.-L.; data curation, V.R.-C., M.S. and A.B.E.; writing—original draft preparation, V.R.-C.; writing—review and editing, M.S. and V.O.-L.; visualization, A.B.E. and A.S.; supervision, M.S. and V.O.-L.; project administration, M.S. and V.O.-L.; funding acquisition, M.S. and V.O.-L. All authors have read and agreed to the published version of the manuscript.
Funding
This research was funded by the following entities and grants: Spanish Ministry MCI, AEI, EU, and ERDF, grants FPU17/03374 and RTI2018-097079-B-C31; the Junta de Castilla y León and ERDF, grant BU119P17 awarded to research group UIC-231; Youth Employment Initiative (JCyL) and ESF, grant UBU05B_1274; the University of Burgos, grant Y135 GI awarded to the SUCONS group; the University of the Basque Country, grant PPGA20/26; the Basque Government research group IT1314-19.
Conflicts of Interest
The authors declare no conflict of interest. The funders had no role in the design of the study; in the collection, analyses, or interpretation of data; in the writing of the manuscript, or in the decision to publish the results.
References
- Sandanayake, M.; Zhang, G.; Setunge, S. Estimation of environmental emissions and impacts of building construction—A decision making tool for contractors. J. Build. Eng. 2019, 21, 173–185. [Google Scholar] [CrossRef]
- Liang, W.; Dai, B.; Zhao, G.; Wu, H. Assessing the performance of green mines via a hesitant fuzzy ORESTE-QUALIFLEX method. Mathematics 2019, 7, 788. [Google Scholar] [CrossRef]
- Maddalena, R.; Roberts, J.J.; Hamilton, A. Can Portland cement be replaced by low-carbon alternative materials? A study on the thermal properties and carbon emissions of innovative cements. J. Clean. Prod. 2018, 186, 933–942. [Google Scholar] [CrossRef]
- Behera, M.; Bhattacharyya, S.K.; Minocha, A.K.; Deoliya, R.; Maiti, S. Recycled aggregate from C&D waste & its use in concrete—A breakthrough towards sustainability in construction sector: A review. Constr. Build. Mater. 2014, 68, 501–516. [Google Scholar] [CrossRef]
- Bidabadi, M.S.; Akbari, M.; Panahi, O. Optimum mix design of recycled concrete based on the fresh and hardened properties of concrete. J. Build. Eng. 2020, 32, 101483. [Google Scholar] [CrossRef]
- Yuan, H.; Lu, W.; Jianli Hao, J. The evolution of construction waste sorting on-site. Renew. Sust. Energ. Rev. 2013, 20, 483–490. [Google Scholar] [CrossRef]
- Santamaría, A.; González, J.J.; Losáñez, M.M.; Skaf, M.; Ortega-López, V. The design of self-compacting structural mortar containing steelmaking slags as aggregate. Cem. Concr. Compos. 2020, 111, 103627. [Google Scholar] [CrossRef]
- EN-Euronorm. Rue de Stassart, 36; European Committee for Standardization: Belgium, Brussels.
- Khan, A.U.R.; Khan, M.S.; Fareed, S.; Xiao, J. Structural Behaviour and Strength Prediction of Recycled Aggregate Concrete Beams. Arab. J. Sci. Eng. 2019, 45, 3611–3622. [Google Scholar] [CrossRef]
- Cantero, B.; Sáez del Bosque, I.F.; Matías, A.; Sánchez de Rojas, M.I.; Medina, C. Inclusion of construction and demolition waste as a coarse aggregate and a cement addition in structural concrete design. Arch. Civ. Mech. Eng. 2019, 19, 1338–1352. [Google Scholar] [CrossRef]
- Lu, G.; Fan, Z.; Sun, Z.; Liu, P.; Leng, Z.; Wang, D.; Oeser, M. Improving the polishing resistance of cement mortar by using recycled ceramic. Resour. Conserv. Recycl. 2020, 158, 104796. [Google Scholar] [CrossRef]
- Gonzalez-Corominas, A.; Etxeberria, M.; Fernandez, I. Structural behaviour of prestressed concrete sleepers produced with high performance recycled aggregate concrete. Mater. Struct. 2017, 50, 94. [Google Scholar] [CrossRef]
- Faleschini, F.; Zanini, M.A.; Toska, K. Seismic reliability assessment of code-conforming reinforced concrete buildings made with electric arc furnace slag aggregates. Eng. Struct. 2019, 195, 324–339. [Google Scholar] [CrossRef]
- Skaf, M.; Pasquini, E.; Revilla-Cuesta, V.; Ortega-López, V. Performance and durability of porous asphalt mixtures manufactured exclusively with electric steel slags. Materials 2019, 12, 3306. [Google Scholar] [CrossRef] [PubMed]
- Mohajerani, A.; Burnett, L.; Smith, J.V.; Markovski, S.; Rodwell, G.; Rahman, M.T.; Kurmus, H.; Mirzababaei, M.; Arulrajah, A.; Horpibulsuk, S.; et al. Recycling waste rubber tyres in construction materials and associated environmental considerations: A review. Resour. Conserv. Recycl. 2020, 155, 104679. [Google Scholar] [CrossRef]
- Brand, A.S.; Roesler, J.R. Interfacial transition zone of cement composites with steel furnace slag aggregates. Cem. Concr. Compos. 2018, 86, 117–129. [Google Scholar] [CrossRef]
- Tam, V.W.Y.; Wang, K.; Tam, C.M. Assessing relationships among properties of demolished concrete, recycled aggregate and recycled aggregate concrete using regression analysis. J. Hazard. Mater. 2008, 152, 703–714. [Google Scholar] [CrossRef]
- Tam, V.W.Y.; Soomro, M.; Evangelista, A.C.J. A review of recycled aggregate in concrete applications (2000–2017). Constr. Build. Mater. 2018, 172, 272–292. [Google Scholar] [CrossRef]
- Silva, R.V.; de Brito, J.; Dhir, R.K. Fresh-state performance of recycled aggregate concrete: A review. Constr. Build. Mater. 2018, 178, 19–31. [Google Scholar] [CrossRef]
- Revilla-Cuesta, V.; Skaf, M.; Chica, J.A.; Fuente-Alonso, J.A.; Ortega-López, V. Thermal deformability of recycled self-compacting concrete under cyclical temperature variations. Mater. Lett. 2020, 278, 128417. [Google Scholar] [CrossRef]
- Revilla-Cuesta, V.; Skaf, M.; Faleschini, F.; Manso, J.M.; Ortega-López, V. Self-compacting concrete manufactured with recycled concrete aggregate: An overview. J. Clean. Prod. 2020, 262, 121362. [Google Scholar] [CrossRef]
- Grdic, Z.J.; Toplicic-Curcic, G.A.; Despotovic, I.M.; Ristic, N.S. Properties of self-compacting concrete prepared with coarse recycled concrete aggregate. Constr. Build. Mater. 2010, 24, 1129–1133. [Google Scholar] [CrossRef]
- Sun, C.; Chen, Q.; Xiao, J.; Liu, W. Utilization of waste concrete recycling materials in self-compacting concrete. Resour. Conserv. Recycl. 2020, 161, 104930. [Google Scholar] [CrossRef]
- Kou, S.C.; Poon, C.S. Properties of self-compacting concrete prepared with coarse and fine recycled concrete aggregates. Cem. Concr. Compos. 2009, 31, 622–627. [Google Scholar] [CrossRef]
- Zeng, J.J.; Ye, Y.Y.; Gao, W.Y.; Smith, S.T.; Guo, Y.C. Stress-strain behavior of polyethylene terephthalate fiber-reinforced polymer-confined normal-, high- and ultra high-strength concrete. J. Build. Eng. 2020, 30, 101243. [Google Scholar] [CrossRef]
- Santamaría, A.; Ortega-López, V.; Skaf, M.; Chica, J.A.; Manso, J.M. The study of properties and behavior of self compacting concrete containing Electric Arc Furnace Slag (EAFS) as aggregate. Ain Shams Eng. J. 2020, 11, 231–243. [Google Scholar] [CrossRef]
- Moayyeri, N.; Gharehbaghi, S.; Plevris, V. Cost-based optimum design of reinforced concrete retaining walls considering different methods of bearing capacity computation. Mathematics 2019, 7, 1232. [Google Scholar] [CrossRef]
- EC-2. Eurocode 2: Design of Concrete Structures. Part 1-1: General Rules and Rules for Buildings; CEN (European Committee for Standardization): Brussels, Belgium, 2010. [Google Scholar]
- EHE-08. Structural Concrete Regulations; Ministerio de Fomento, Gobierno de España: Madrid, Spain, 2010. (In Spanish) [Google Scholar]
- Silva, R.V.; De Brito, J.; Dhir, R.K. The influence of the use of recycled aggregates on the compressive strength of concrete: A review. Eur. J. Environ. Civ. Eng. 2015, 19, 825–849. [Google Scholar] [CrossRef]
- Penadés-Plà, V.; García-Segura, T.; Yepes, V. Robust design optimization for low-cost concrete box-girder bridge. Mathematics 2020, 8, 398. [Google Scholar] [CrossRef]
- Moutassem, F.; Chidiac, S.E. Assessment of concrete compressive strength prediction models. KSCE J. Civ. Eng. 2016, 20, 343–358. [Google Scholar] [CrossRef]
- Evangelista, L.; De Brito, J. Concrete with fine recycled aggregates: A review. Eur. J. Environ. Civ. Eng. 2014, 18, 129–172. [Google Scholar] [CrossRef]
- San-José, J.T.; Manso, J.M. Fiber-reinforced polymer bars embedded in a resin concrete: Study of both materials and their bond behavior. Polym. Compos. 2006, 27, 315–322. [Google Scholar] [CrossRef]
- Fiol, F.; Thomas, C.; Muñoz, C.; Ortega-López, V.; Manso, J.M. The influence of recycled aggregates from precast elements on the mechanical properties of structural self-compacting concrete. Constr. Build. Mater. 2018, 182, 309–323. [Google Scholar] [CrossRef]
- Manzi, S.; Mazzotti, C.; Bignozzi, M.C. Self-compacting concrete with recycled concrete aggregate: Study of the long-term properties. Constr. Build. Mater. 2017, 157, 582–590. [Google Scholar] [CrossRef]
- Santos, S.; da Silva, P.R.; de Brito, J. Self-compacting concrete with recycled aggregates—A literature review. J. Build. Eng. 2019, 22, 349–371. [Google Scholar] [CrossRef]
- Asteris, P.G.; Ashrafian, A.; Rezaie-Balf, M. Prediction of the compressive strength of self-compacting concrete using surrogate models. Comput. Concr. 2019, 24, 137–150. [Google Scholar] [CrossRef]
- Saha, P.; Prasad, M.L.V.; RathishKumar, P. Predicting strength of SCC using artificial neural network and multivariable regression analysis. Comput. Concr. 2017, 20, 31–38. [Google Scholar] [CrossRef]
- Abolpour, B.; Mehdi Afsahi, M.; Hosseini, S.G. Statistical analysis of the effective factors on the 28 days compressive strength and setting time of the concrete. J. Adv. Res. 2015, 6, 699–709. [Google Scholar] [CrossRef]
- Xiao, J.; Li, J.; Zhang, C. On statistical characteristics of the compressive strength of recycled aggregate concrete. Struct. Concr. 2005, 6, 149–153. [Google Scholar] [CrossRef]
- Brand, A.S.; Amirkhanian, A.N.; Roesler, J.R. Flexural capacity of full-depth and two-lift concrete slabs with recycled aggregates. Transp. Res. Rec. 2014, 2456, 64–72. [Google Scholar] [CrossRef]
- Velay-Lizancos, M.; Martinez-Lage, I.; Azenha, M.; Vázquez-Burgo, P. Influence of temperature in the evolution of compressive strength and in its correlations with UPV in eco-concretes with recycled materials. Constr. Build. Mater. 2016, 124, 276–286. [Google Scholar] [CrossRef]
- Mazloom, M.; Soltani, A.; Karamloo, M.; Hassanloo, A.; Ranjbar, A. Effects of silica fume, superplasticizer dosage and type of superplasticizer on the properties of normal and selfcompacting concrete. Adv. Mater. Res. 2018, 7, 407–434. [Google Scholar] [CrossRef]
- Bouarroudj, M.E.K.; Remond, S.; Michel, F.; Zhao, Z.; Bulteel, D.; Courard, L. Use of a reference limestone fine aggregate to study the fresh and hard behavior of mortar made with recycled fine aggregate. Mater. Struct. 2019, 52, 18. [Google Scholar] [CrossRef]
- Agrela, F.; Sánchez De Juan, M.; Ayuso, J.; Geraldes, V.L.; Jiménez, J.R. Limiting properties in the characterisation of mixed recycled aggregates for use in the manufacture of concrete. Constr. Build. Mater. 2011, 25, 3950–3955. [Google Scholar] [CrossRef]
- Martín-Morales, M.; Zamorano, M.; Ruiz-Moyano, A.; Valverde-Espinosa, I. Characterization of recycled aggregates construction and demolition waste for concrete production following the Spanish Structural Concrete Code EHE-08. Constr. Build. Mater. 2011, 25, 742–748. [Google Scholar] [CrossRef]
- Zhang, J.; An, X.; Li, P. Research on a mix design method of self-compacting concrete based on a paste rheological threshold theory and a powder equivalence model. Constr. Build. Mater. 2020, 233, 117292. [Google Scholar] [CrossRef]
- Carro-López, D.; González-Fonteboa, B.; De Brito, J.; Martínez-Abella, F.; González-Taboada, I.; Silva, P. Study of the rheology of self-compacting concrete with fine recycled concrete aggregates. Constr. Build. Mater. 2015, 96, 491–501. [Google Scholar] [CrossRef]
- González-Taboada, I.; González-Fonteboa, B.; Eiras-López, J.; Rojo-López, G. Tools for the study of self-compacting recycled concrete fresh behaviour: Workability and rheology. J. Clean. Prod. 2017, 156, 1–18. [Google Scholar] [CrossRef]
- Łaźniewska-Piekarczyk, B. The methodology for assessing the impact of new generation superplasticizers on air content in self-compacting concrete. Constr. Build. Mater. 2014, 53, 488–502. [Google Scholar] [CrossRef]
- MacInnis, C.; Racic, D. The effect of superplasticizers on the entrained air-void system in concrete. Cem. Concr. Res. 1986, 16, 345–352. [Google Scholar] [CrossRef]
- Ishrat, S.I.; Khan, Z.A.; Siddiquee, A.N.; Badruddin, I.A.; Algahtani, A.; Javaid, S.; Gupta, R. Optimising parameters for expanded polystyrene based pod production using Taguchi method. Mathematics 2019, 7, 847. [Google Scholar] [CrossRef]
- Santos, S.A.; da Silva, P.R.; de Brito, J. Mechanical performance evaluation of self-compacting concrete with fine and coarse recycled aggregates from the precast industry. Materials 2017, 10, 904. [Google Scholar] [CrossRef] [PubMed]
- Revilla-Cuesta, V.; Ortega-López, V.; Skaf, M.; Manso, J.M. Effect of fine recycled concrete aggregate on the mechanical behavior of self-compacting concrete. Constr. Build. Mater. 2020, 263, 120671. [Google Scholar] [CrossRef]


Publisher’s Note: MDPI stays neutral with regard to jurisdictional claims in published maps and institutional affiliations. |
© 2020 by the authors. Licensee MDPI, Basel, Switzerland. This article is an open access article distributed under the terms and conditions of the Creative Commons Attribution (CC BY) license (http://creativecommons.org/licenses/by/4.0/).