Article

Correlations between Background Radiation Inside a Multilayer Interleaving Structure, Geomagnetic Activity, and Cosmic Radiation: A Fourth-Order Cumulant-Based Correlation Analysis

by
Miguel E. Iglesias-Martínez
1,
Juan Carlos Castro-Palacio
1,*,
Felix Scholkmann
2,
Victor Milián-Sánchez
3,
Pedro Fernández de Córdoba
1,
Antonio Mocholí-Salcedo
4,
Ferrán Mocholí Belenguer
4,
Valeriy A. Kolombet
5,
Victor A. Panchelyuga
5 and
Gumersindo Verdú
3,6
1
Grupo de Modelización Interdisciplinar, InterTech, Instituto Universitario de Matemática Pura y Aplicada, Universitat Politècnica de València, Camino de Vera, s/n, 46022 València, Spain
2
Research Office for Complex Physical and Biological Systems, 8006 Zurich, Switzerland
3
Institute for Industrial, Radiophysical and Environmental Safety, Universitat Politècnica de València, Camino de Vera, s/n, 46022 València, Spain
4
Traffic Control Systems Group, ITACA Institute, Universitat Politècnica de València, Camino de Vera, s/n, 46022 València, Spain
5
Institute of Theoretical and Experimental Biophysics, Russian Academy of Science, Moscow Region, Pushchino 142292, Russia
6
Chemical and Nuclear Engineering Department, Universitat Politécnica de València, Camino de Vera, s/n, 46022 València, Spain
*
Author to whom correspondence should be addressed.
Mathematics 2020, 8(3), 344; https://doi.org/10.3390/math8030344
Submission received: 19 January 2020 / Revised: 13 February 2020 / Accepted: 18 February 2020 / Published: 4 March 2020
(This article belongs to the Section Engineering Mathematics)

Abstract

:
Time-series of background radiation (measured inside a multilayer structure), geomagnetic activity, and cosmic-ray activity has been analyzed using linear correlation analysis and a new correlation measure based on the one-dimensional component of the fourth-order cumulant. The new method is proposed based on the fact that the cumulant of a random process is zero if it is of Gaussian nature. The results show that this methodology is useful for detecting correlations between the analyzed time-series.

1. Introduction

In a previous work of our group [1] it was shown that the measured radioactive decay rates of different nuclides changed significantly when placed inside a simple enclosure in form of a modified Faraday cage [1,2]. The variations ranged at least between 0.8% and 5%. This enclosure also showed to cause anomalous capacitance measurements in ultra-stable capacitors, as well as in the measurements obtained with other devices. For example, the time constant of a RC low-pass filter increased at least by 5.5%, and the spectrum of a Cs-137 source was distorted, i.e., the photopeak was shifted to lower energies and its height increased.
In subsequent works [3,4] we discovered that there can be a correlation between some of the anomalous decay processes shown in [1] and geomagnetic activity (GMA) as well as cosmic-ray activity (CRA). This finding is important since it showed that the measured variability in reference [1] was not caused by some failure in the electronics of the instruments but rather followed the variations in GMA and CRA. Besides, it made apparent that a link exists between GMA/CRA and the outputs of the measuring system, i.e., the measured radioactive decay rates and the capacitance values.
In our most recent analysis [4] we analyzed the correlations with both linear correlation analysis and statistical tools based on Bayesian statistics. The correlation analysis revealed novel insights with regard to the relationship between the measured radioactive decay and GMA/CRA. We proposed some preliminary conclusions about the conditions under which those correlations took place, and on the circumstances in which the correlations could not be registered. One of the main conclusions was that the correlations between decay activity (counts per minute registered in the Geiger–Muller (GM) counter) and GMA/CRA could take place (at least when working with Ra-226) in those time intervals when the decay values increased (or were increased with regard to the counts outside the box). Although our analysis revealed new insights, we recognized that the correlation analysis had limitations and we aimed to extend the correlation analysis with a novel approach. To this end, correlations are analyzed this time from different points of view, that is, using fourth-order statistics as by this means one can draw more conclusions about the possible existing correlations. In the present paper only the background radiation measured with the GM counter was studied. In upcoming papers, the other processes described in [1] (i.e., decay rates with some radionuclides and capacitance variations) will be analyzed with the new approach as well.
The aim of this report is to present to the mathematics community a set of data related to the described enclosures, showing the need for using sophisticate techniques of correlations analysis.

2. Experimental Setup and Data Analysis

The key elements of the setup were a Faraday-like cage (developed by Reich [5]), whose sides are formed by interleaving sheets of metallic and organic materials (Figure 1a), and the Geiger–Müller counter tube (Figure 1b,c):
On the other hand, in the development of the work, an algorithm was proposed as a measure of similarity and features extraction; it is based on a time-correlation using the Pearson correlation coefficient of the one-dimensional component of fourth-order cumulant calculation (see next section).

2.1. Linear Correlation Analysis

As a first analysis and to determine whether or not there is a correlation in the data, Pearson’s correlation coefficient was used as a measure to assess the similarity of the data in a time series, based on the covariance matrix.
Let Y = { Y ( t ) } t 0 be a zeroth-mean stochastic process, then the autocovariance relates directly to the dispersion of the process and can be expressed in terms of its joint moments, see for instance references [6,7,8,9], where X ( t ) is the determinist part (i.e., the signal to be detected) and n(t) is a random process considered as additive noise, then:
C 2 Y ( τ ) = E [ X ( t ) · X ( t + τ ) ] + E [ n ( t ) · n ( t + τ ) ]
where C 2 Y ( τ ) stands for the second-order cumulant. For the discrete model, Equation (1) becomes,
C 2 Y ( τ ) = 1 M t = 0 M 1 τ X ( t ) · X ( t + τ ) + 1 M t = 0 M 1 τ n ( t ) · n ( t + τ ) ,
where M is the number of data points to be processed. The correlation coefficient is then given based on the covariance function:
R ( i , j ) = C 2 ( x , y ) C 2 ( x , x ) C 2 ( y , y ) ,
where R ( i , j ) is the correlation matrix and C 2 ( i , j ) is the covariance matrix of the two data set to be analyzed.
The use of the covariance matrix to obtain the Pearson correlation coefficient has the disadvantage of not being immune to noise. This means that if the data to be analyzed presents noise, it can influence the correlation levels obtained, of one variable with respect to the other.
From previous discussion, it was proposed to use higher order statistics for the calculation of the correlation matrix. To this end, the use of the one-dimensional component of the fourth-order cumulant of the data was suggested, which becomes zero for Gaussian processes. Moreover, the referred background data manifest a clear Gaussian behavior. We will discuss about it further down in this article.

2.2. Algorithm Based on Second-Order Statistics: Fourth-Order Cumulant-Based Correlation Analysis

For zero-average Gaussian processes, the fourth-order cumulant can be calculated as in [4]
C 4 Y ( τ 1 , τ 2 , τ 3 ) = E { Y ( t ) · Y ( t + τ 1 ) · Y ( t + τ 2 ) · Y ( t + τ 3 ) } C 2 Y ( τ 1 ) · C 2 Y ( τ 2 τ 3 ) C 2 Y ( τ 2 ) · C 2 Y ( τ 3 τ 1 ) C 2 Y ( τ 3 ) · C 2 Y ( τ 1 τ 2 )
Taking the 1-dimensional component of the fourth-order cumulant of the signal,   C 4 Y ( τ 1 , 0 , 0 ) , and when setting τ 2 = τ 3 = 0 , the same result as in [6] is obtained (it was obtained very similarly), but doing τ 1 = τ 2 = τ 3 = τ . We obtain the following:
C 4 Y ( τ 1 , 0 , 0 ) = E { Y 3 ( t ) · Y ( t + τ 1 ) } 3 · E { Y ( t ) · Y ( t + τ 1 ) } · E { Y 2 ( t ) }
For a discrete number of data points, Equation (5) can be rewritten as,
C 4 Y ( τ ) = 1 M t = 0 M 1 τ Y 3 ( t ) · Y ( t + τ ) 3 { 1 M t = 0 M 1 τ Y ( t ) · Y ( t + τ ) } · { t = 0 M 1 Y 2 ( t ) }
Thus, the correlation matrix can be evaluated as follows,
R ( i , j ) = C 4 ( i , j ) / C 4 ( i , i ) C 4 ( j , j ) ,
where R ( i , j ) is the correlation matrix using higher order statistics, and C 4 ( i , j ) is the one-dimensional component of the fourth-order cumulant.
For a process described in the following equation,
C 4 y ( τ 1 , τ 2 , τ 3 ) = C 4 x ( τ 1 , τ 2 , τ 3 ) + C 4 n ( τ 1 , τ 2 , τ 3 )
if n ( t ) is a Gaussian random signal of zero average value, C 4 n ( τ 1 , τ 2 , τ 3 ) = 0 , then,   C 4 y ( τ 1 , τ 2 , τ 3 ) = C 4 x ( τ 1 , τ 2 , τ 3 ) . If the random signal is not Gaussian, its fourth-order cumulant is a delta Dirac function [10].
The idea behind taking the correlation based on the one-dimensional component of the fourth-order cumulant is to reduce the influence of noise that does not provide useful information, regardless of the type of distribution it follows, as its fourth-order cumulant is zero if this noise is Gaussian distributed. On the other hand, if the noise follows another type of probabilistic distribution, its cumulant is a delta Dirac function.
This results in a greater reliability on the processed information, in the sense that when it is processed with the usual method of correlation based on the second-order cumulants, the correlation of the unusable noise is also included, as it is not zero.
A harmonic signal with noise added has been taken as an example. The spectrum of the noisy signal and of the correlation spectrum of noisy signal can be seen in Figure 2, upper-left and upper-right panels, respectively. Furthermore, in Figure 2 (lower panel), the spectrum of the one-dimensional component of the fourth-order cumulant of the noisy signal is also shown. It can be noticed that the result from working with the fourth-order component (see Figure 2, lower panel) is much more immune to noise and keeps the deterministic information unchanged.

3. Application Results

In order to check the analysis approaches described above, the data of different tests performed inside the cage were analyzed. All those results are presented in what follows.
In the first test (denoted by D1), the data were obtained by measurements inside the box starting on 2014 December 19 at 17:00 h and finishing on 2014 December 22 at 09:00 h (see Figure 3). Those data are presented in [2] and the results of the correlation analysis are shown in Table 1. The total number of processed samples was 65.
In order to verify the normality of the data, we have chosen Lilliefors test. It represents an improvement on the Kolomogorov–Smirnov (K–S) test as it corrects the K–S for small values at the tails of the probability distributions. Differently from the K–S test, Lilliefors can be used when the population mean or the standard deviation are unknown. Essentially, the Lilliefors test is a K–S test that allows you to estimate these parameters from your sample [11].
Table 1 shows that in this specific case (where covariance is used), there is a high correlation between the background (Bck) fluctuations (D1) and CRA and the GMA with CRA, respectively.
The above is consistent with the work done in [4], whose results are based on the correlation using the Spearman coefficient and show that there is a small correlation between the background and GMA (0.2441) and a clear correlation between the background and CRA (0.4104). Here we see (as in [4]) that CRA is the dominant factor.
Both algorithms, the first one used in this work (Equation (3)) as well as the one used in [4], are based on the covariance matrix of the data. Spearman’s correlation coefficient (used in [4]) is less sensitive than Pearson’s coefficient (used in the present paper) for values that are far from expected, that is, for isolated values that do not predominate in a set. To illustrate these results and to make a comparison with those obtained in [4], see Table 2.
After analyzing the correlations pairs using the one-dimensional component of the fourth-order cumulant, the following results were obtained (Table 3):
Table 3 shows that there is a linear correlation between the three analyzed data. In two of the cases, the results show a negative correlation. All the other available measurements of the background inside the cage were analyzed with this methodology. The results are presented in Table 4, which confirms the dominancy of CRA over GMA on Bck radiation [4].
The first analysis in Table 4 corresponds to the period labelled as J1 (10 July 2014). From the experimental data measured on that day, taken from 08 h until 12 h, there is a high correlation between the three variables, using both covariance (second order statistics) and cumulant (four order statistics).
The second analysis in Table 4 corresponds to the period labelled as J2 (11 July 2014). From the obtained experimental data, taken from 09 h until 11 h, one can derive the lack of correlation between the variables using covariance (second order statistics) and cumulant (four order statistics).
The last analysis in Table 4 corresponds to the period labelled as D1 (19 December 2014). The experimental data were measured, starting on 19 December 2014, (at 17:00 h) and finishing on 22 December 2014, 2014 (at 09:00 h).
Table 4 shows that when there is a correlation between the environmental variables (geomagnetic activity and cosmic neutrons flux), there is a correlation between the background and these variables.
Specifically, when there is a correlation above 0.6 between GMA and CRA, there is a non-negligible probability of finding a correlation between the background radiation and these variables.
The cases show just a few analyzed experimental data. Thus, more measurements are necessary to gain more insights into their behavior under similar experimental conditions and to understand the involved phenomena.

4. Conclusions

In this work, two methods to study the correlations have been shown, one based on using the Pearson correlation coefficient as the first measure of similarity, and another using a correlation measure based on the one-dimensional component of the fourth-order cumulant.
From the experimental results and from both methods of analysis, we can conclude that:
(i)
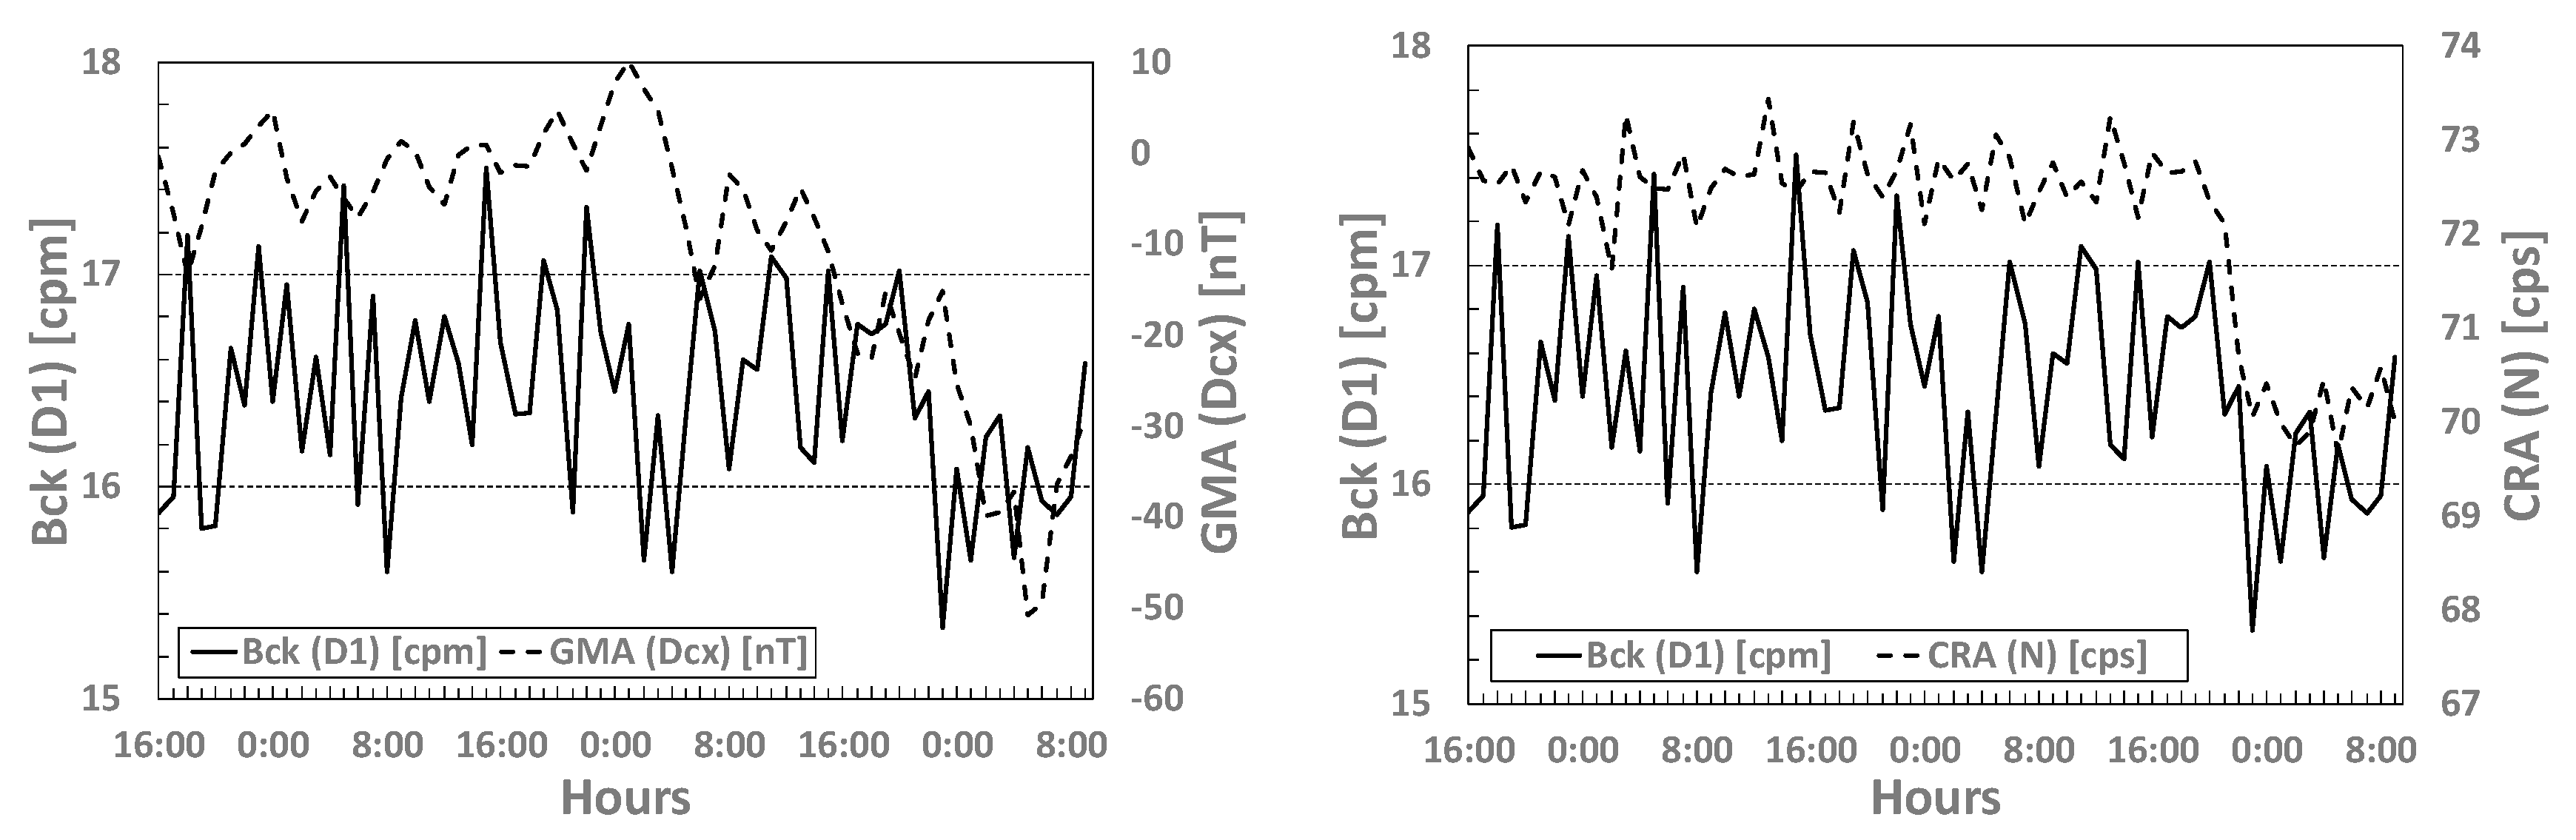
There is a linear, direct (as well as inverse) relationship between the background-GMA and background-CRA data when there is a correlation higher than 0.6 between the space weather variables, Dcx and N.
(ii)
We carried out the experimental tests in different periods (called J1, J2 and D1) and our methodology reveals the presence (or not) of correlations in those periods. Because of these facts, we consider that it is necessary to establish a more complete measurement planning in order to derive a model to understand this phenomenon.

Author Contributions

All authors contributed equally. All authors have read and agreed to the published version of the manuscript.

Funding

This research was supported by grant no. RTI2018-102256-B-I00 (Spain).

Conflicts of Interest

The authors declare no conflict of interest.

References

  1. Milián-Sánchez, V.; Mocholí-Salcedo, A.; Milián, C.; Kolombet, V.A.; Verdúa, G. Anomalous effects on radiation detectors and capacitance measurements inside a modified Faraday cage. Nucl. Instrum. Methods Phys. Res. Sect. A Accel. Spectrometers Detect. Assoc. Equip. 2016, 828, 210–228. [Google Scholar] [CrossRef]
  2. Milián-Sánchez, V.; Scholkmann, F.; Fernández de Córdoba, P.; Mocholí-Salcedo, A.; Mocholí-Belenguer, F.; Castro-Palacio, J.C.; Kolombet, V.A.; Verdú, G. Anomalous effects on radiation detectors and capacitance measurements coincidental with their emplacement in a Modified Faraday Cage. In Proceedings of the XV International Conference Finsler Extensions of Relativity Theory (FERT-2019), Moscow, Russia, 24–27 October 2019. [Google Scholar]
  3. Scholkmann, F.; Milián-Sánchez, V.; Mocholí-Salcedo, A.; Milián, C.; Kolombet, V.A.; Verdú, G. Anomalous effects of radioactive decay rates and capacitance values measured inside a modified Faraday cage: Correlations with space weather. EPL 2017, 117, 62002. [Google Scholar] [CrossRef] [Green Version]
  4. Milián-Sánchez, V.; Scholkmann, F.; Fernández de Córdoba, P.; Mocholí-Salcedo, A.; Mocholí-Belenguer, F.; Iglesias-Martínez, M.E.; Castro-Palacio, J.C.; Kolombet, V.A.; Panchelyuga, V.A.; Verdú, G. Fluctuations in measured radiactive decay rates inside a modified Faraday cage: Correlations with space weather. submitted to Scientific Reports.
  5. Reich, W. Selected Writings. An Introduction to Orgonomy; Farrar, Straus & Giroux: New York, NY, USA, 1960. [Google Scholar]
  6. Martínez, M.E.I.; Montero, F.E.H. Detection of periodic signals in noise based on higher-order statistics joined to convolution process and spectral analysis. In Progress in Pattern Recognition, Image Analysis, Computer Vision, and Applications. CIARP 2013; Lecture Notes in Computer Science; Ruiz-Shulcloper, J., Sanniti di Baja, G., Eds.; Springer: Berlin/Heidelberg, Germany, 2013; Volume 8258. [Google Scholar]
  7. Iglesias-Martínez, M.E.; García-Gómez, J.M.; Sáez Silvestre, C.; Fernández de Córdoba, P.; Conejero, J.A. Feature extraction and similarity of movement detection during sleep, based on higher order spectra and entropy of the actigraphy signal: Results of the Hispanic Community Health Study/Study of Latinos. Sensors 2018, 18, 4310. [Google Scholar] [CrossRef] [PubMed] [Green Version]
  8. Iglesias-Martinez, M.E.; Antonino-Daviu, J.A.; Fernández de Córdoba, P.; Conejero, J.A. Rotor fault detection in induction motors based on time-frequency analysis using the bispectrum and the autocovariance of stray flux signals. Energies 2019, 12, 597. [Google Scholar] [CrossRef] [Green Version]
  9. Iglesias-Martínez, M.E.; Fernández de Córdoba, P.; Antonino-Daviu, J.A.; Conejero, J.A. Higher Order Spectral Analysis of Stray Flux Signals for Faults Detection in Induction Motors, accepted in Applied Mathematics Nonlinear Sciences.
  10. Vaseghi, V. Advanced Digital Signal Processing and Noise Reduction, 4th ed.; John Wiley & Sons Ltd.: Hoboken, NJ, USA, 2008. [Google Scholar]
  11. Schaffer, J. Modified lilliefors test. J. Mod. Appl. Stat. Mothods 2015, 14, 53–69. [Google Scholar]
Figure 1. (a) A small model of metallic shield in form of Faraday cage where the sides are formed by interleaving structures of metallic and organic (cork sheeting). (b) Lead shield that contains the Geiger–Müller counter tube. The tube is inserted inside the shield on the upper part opening as looks as in (c). The radioactive preparation was placed on the tray shown in (b).
Mathematics 08 00344 g001
Figure 2. Illustrative example of the Fourier Transform spectrums of the noisy signal (upper-left panel), its correlation function (upper-right panel), and the one-dimensional component of the fourth-order cumulant (lower panel).
Mathematics 08 00344 g002
Figure 3. Background data (D1), geomagnetic activity (GMA) (Dcx) (left panel) and cosmic-ray activity (CRA) (N) (right panel) between 2014 December 19 and 2014 December 22. Dcx stands for the Dcx index and N for the neutron counts.
Mathematics 08 00344 g003
Table 1. Correlation between the three variables background (D1), GMA (Dcx) and CRA (N), using covariance (Equation (3)).
Correlations between Variables
Bck-GMABck-CRAGMA-CRA
0.24410.41040.7927
Table 2. Correlation between the three variables background (D1), GMA (Dcx) and CRA (N). A comparative study using Pearson and Spearman Coefficients.
CoefficientCorrelations between Variables
Bck-GMABck-CRAGMA-CRA
Pearson0.24410.41040.7927
Spearman0.16910.35280.4594
Table 3. Correlation between the three variables background (D1), GMA (Dcx) and CRA (N), using the one-dimensional component of fourth-order cumulant (Equation (7)).
Correlations between Variables
Bck-GMABck-CRAGMA-CRA
−0.1972−0.44320.6751
Table 4. Correlation between the three variables background (D1), GMA (Dcx) and CRA (N).
DataUsing Covariance (Equation (3))Using the One-Dimensional Component of Fourth-Order Cumulant (Equation (7))
Bck-GMABck-CRAGMA-CRABck-GMABck-CRAGMA-CRA
J10.87350.87471.0000.94010.94071.000
J20.1166−0.00010.0657−0.2628−0.01560.123
D10.24480.41040.7948−0.1974−0.44320.6705

