Article

On the Effect of the Absorption Coefficient in a Differential Game of Pollution Control

by
Ekaterina Marova
1,
Ekaterina Gromova
1,*,
Polina Barsuk
1 and
Anastasia Shagushina
2
1
Faculty of Applied Mathematics and Control Processes, St. Petersburg State University, 198504 St. Petersburg, Russia
2
EPAM Systems, Inc., 22/2 Zastavskaya St., MegaPark, 196084 Saint Petersburg, Russia
*
Author to whom correspondence should be addressed.
Mathematics 2020, 8(6), 961; https://doi.org/10.3390/math8060961
Submission received: 15 May 2020 / Revised: 7 June 2020 / Accepted: 9 June 2020 / Published: 12 June 2020
(This article belongs to the Special Issue Game Theory)

Abstract

:
We consider various approaches for a characteristic function construction on the example of an n players differential game of pollution control with a prescribed duration. We explore the effect of the presence of an absorption coefficient in the game on characteristic functions. As an illustration, we consider a game in which the parameters are calculated based on the real ecological situation of the Irkutsk region. For this game, we compute a number of characteristic functions and compare their properties.

1. Introduction

Differential games are used for describing continuous processes of decision making in conflict situations that happen in industry, ecology, biology, political science, and so on. Models of differential games are often utilized for solving problems in the field of environmental protection policy and the optimal exploitation of natural resources [1,2,3,4,5,6,7].
To solve the problems of environmental management, it is effective to use games with negative externalities [4,5,6,7]. In that class of games, the increasing of the controls of some players, which are the volumes of environmental pollution over time, leads to the decreasing value of the payoff functions for others.
In this paper, we consider a cooperative differential game of pollution control with negative externalities modeling the behavior of several enterprises. They have an agreement to limit environmental pollution. This limitation has a negative effect on the total profit of each enterprise. Moreover, the high level of environmental pollution leads to profit loss associated with the higher environmental costs and taxes. We focus our attention on two cases when there is an absorption coefficient and when there is not.
In the theory of cooperative differential games, the concept of a characteristic function is one of the basic ones. The characteristic function shows the worth of a coalition and affects the formation of coalitions [8,9]. Therefore, players or coalitions have the motivation to cooperate with each other if the characteristic function of the joint coalition is greater than the sum of the original characteristic functions. Additionally, the significance of each player in the coalition can be determined by its marginal contribution to the characteristic function. For example, this approach is used in constructing the Shapley value and Banzhaf power index [10,11,12].
We present different techniques for characteristic function construction [13,14,15]. For the above-mentioned cooperative differential game, we compute a number of characteristic functions and compare their properties. Further, we analyze the effect of the absorption coefficient representing the natural environment purification on player’s payoffs.
As an illustration, we explore a game of pollution control based on the acute ecological situation of the Irkutsk region. We use a cooperative differential game of three players, which are the largest enterprises of Bratsk [16]. Furthermore, we add the absorption coefficient to this model and focus on the effect this coefficient has on the payoffs.

2. Cooperative Differential Game in the form of the Characteristic Function

2.1. Differential Game in Normal Form

Let N = { 1 , 2 , , n } be a set of players participating in a classical cooperative differential game Γ ( x 0 , t 0 , T ) with a prescribed duration [17]. The game starts from the initial state x 0 at time t 0 and evolves over the interval t [ t 0 , T ] .
The dynamics of the game are described by the system of differential equations:
x ˙ ( t ) = f ( x , u 1 , , u n ) , x ( t 0 ) = x 0 ,
where x R n , u i U i comp R k .
We assume that all standard restrictions [18] on the parameters, controls, and trajectory function are satisfied.
The payoff function of the i th player is:
K i ( t 0 , x 0 , u ) = t 0 T h i ( x ( τ ) , u ( τ ) ) d τ , i = 1 , n ¯ ,
where h i ( x , u ) are continuous functions and x ( t ) is a solution of the Cauchy problem for System (1) under controls u ( t ) = ( u 1 ( t ) , , u n ( t ) ) .

2.2. Different Methods of Characteristic Function Construction

To define the cooperative game, we have to construct a characteristic function V ( S ) for every coalition S N in the game.
A characteristic function is a mapping from the set of all possible coalitions:
V ( S ) : 2 N R , V ( ) = 0 .
The value V ( S ) is typically interpreted as the worth or the power of the coalition S. One of the most important properties of the characteristic function is superadditivity:
V ( S 1 S 2 ) V ( S 1 ) + V ( S 2 ) , S 1 , S 2 N , S 1 S 2 = .
Superadditive characteristic functions provide some useful advantages in solving various problems in the field of cooperative game theory in static and dynamic settings. More information about this can be found in [19].
Currently, there are different approaches to the calculation of the characteristic function (see [7,19,20,21,22]). A systematic overview of different characteristic functions and their properties was presented in [23]. This paper provides an analysis of α -, δ -, ζ -, and η -characteristic functions.

2.2.1. α -Characteristic Function

A classical approach to the construction the characteristic function is called the α -characteristic function. It was introduced in [20] and was the only way to construct a cooperative game for a long time. The main idea of this method is using the lower value of the zero-sum game Γ S , N \ S between the coalition S as the first player and coalition N \ S as the second player.
V α ( S ) = 0 , S = { } , max u i , i S min u j , j N \ S i S K i ( t 0 , x 0 , u ) , S N .
We assume that the maximum and minimum is achieved on (3). The value V α ( S ) is interpreted as the maximum value that coalition S can get when N \ S acts against S.
It was proved in [24] that the α -characteristic function is superadditive.
This approach of defining the characteristic function has some issues. It is necessary to solve 2 n 1 complicated optimization problems. It is hard to find (3) in analytical form in differential games due to computational problems. Finally, from an economic standpoint, it is unlikely that players of N \ S form an anti-coalition [7].

2.2.2. δ -Characteristic Function

The technique of the construction the δ -characteristic function was proposed in [7]. The process of the calculation of this function consists of two steps. Firstly, one has to calculate the Nash equilibrium strategies for all players. Secondly, players from S maximize their total payoff i S K i while players from N \ S use strategies from the Nash equilibrium.
V δ ( S ) = 0 , S = { } , max u i , i S u j = u j N E , j N \ S i S K i ( t 0 , x 0 , u S , u N \ S N E ) , S N .
This form of the characteristic function requires fewer computational operations compared the with α -characteristic function. Additionally, the previously constructed Nash equilibrium simplifies the computation of V δ ( S ) . Moreover, (4) has a practical economic interpretation. Players not from the coalition S do not tend to form anti-coalition N \ S in real models (see [25,26,27]).
Nevertheless there are some problems of this approach. In general, the δ -characteristic function is a non-superadditive function (see examples in [28]). Besides, one has to consider the problem of the existence and uniqueness of the Nash equilibrium solution.

2.2.3. ζ -Characteristic Function

The ζ -characteristic function was introduced in [19]. The first step of calculation of this characteristic function for coalition S is finding optimal controls maximizing the total payoff of the players. In the second step, players from coalition S use the cooperative optimal strategies, while the left-out players from N \ S use the strategies minimizing the total payoff of the players from S.
V ζ ( S ) = 0 , S = { } , min u j U j , j N \ S , u i = u i * , i S i S K i ( t 0 , x 0 , u S * , u N \ S ) , S N .
We assume that the maximum and minimum are attained in (5).
The constructed V ζ ( S ) is superadditive in general [19]. Additionally, already computed optimal controls are used for the ζ -characteristic function, which simplifies the computation process compared with the α -characteristic function. Besides, these controls exist and could be found for a wide class of games under rather weak constraints. Lastly, the ζ -characteristic function is applicable to games with fixed coalition structures [29].

2.2.4. η -Characteristic Function

The idea of the η -characteristic function was presented in [22]. This characteristic function is based on strategies from the optimal profile u * and strategies from the Nash equilibrium u N E . We use u S * for players from S (as in the ζ -characteristic function) and u N \ S N E for players from N \ S (as in the δ -characteristic function).
V η ( S ) = 0 , S = { } , i S K i ( t 0 , x 0 , u S * , u N \ S N E ) , S N .
This function models the case when players from N \ S decide instead of optimal strategies to use strategies from Nash equilibrium u N E .
The construction of the η -characteristic function has some technical advantages. It is much simpler in terms of calculation compared with the α -characteristic function. As mentioned above, optimal controls exist and could be found for a wide class of games. The drawback of this function is the problem of the existence and uniqueness of the Nash equilibrium solution. Furthermore, V η ( S ) is not superadditive in the general case [23].

3. Problem of Optimal Pollution Control

3.1. Problem Statement

We assume there is an enterprise having a production site in its territory. The volume of production is directly proportional to harmful emissions to the atmosphere u ( t ) [ 0 , b ] , which the enterprise controls.
The dynamics of the total amount of pollution x ( t ) is described by the following differential equation:
x ˙ ( t ) = u ( t ) δ x ( t ) , x ( t 0 ) = x 0 ,
where δ 0 is the absorption coefficient, [ δ ] = 1 / [ t ] (we use square brackets to denote the dimension of the respective variable). Note that δ does not need to belong to the interval [ 0 , 1 ] as the value of δ is determined by the dimension of the time unit. For instance, 1 [1/day]=30 [1/month].
The instantaneous profit of the enterprise is defined as:
R ( u ( t ) ) = b 1 2 u ( t ) u ( t ) , t [ t 0 , T ] .
There is also an ecotax that is proportional to the amount of pollution. Hence, the net instantaneous payoff is obtained as the difference between the profit and the tax:
R ( u ( t ) ) d x ( t ) ,
where d > 0 is the tax coefficient. Thus, the total payoff is:
K ( t 0 , x 0 , u ) = t 0 T b 1 2 u ( t ) u ( t ) d x ( t ) d t .
It is straightforward to show that the optimal control maximizing the payoff K ( t 0 , x 0 , u ) is:
u * ( t ) = b + d e δ ( T t ) 1 δ .
We start by analyzing what values the optimal control can achieve. Before proceeding to the main result, we define:
δ ¯ = d b + 1 T t 0 W 0 d ( T t 0 ) b e d ( T t 0 ) b ,
where W 0 ( z ) is the principal branch of the Lambert function, defined as the solution to the equation w e w = z [30].
Proposition 1.
The optimal control Function (7) is bounded by b. The optimal control u * ( t ) 0 for all t [ t 0 , T ] if ( T t 0 ) b d or ( T t 0 ) > b d and δ δ ¯ . If ( T t 0 ) > b d and δ < δ ¯ , then the optimal control function changes sign from minus to plus at the point:
t ¯ = T + 1 δ ln 1 b d δ ( t 0 , T ) .
The proof is given in Appendix A.
Proposition 1 gives the conditions guaranteeing that the optimal control is defined by (7). Then, the corresponding trajectory is given by:
x * ( t ) = e δ t 2 δ 2 e δ ( T t ) d e δ t + 2 ( b δ d ) e δ T e δ ( T t 0 ) d e δ t 0 + 2 ( b δ d δ 2 x 0 ) e δ T
and the payoff is:
K ( t 0 , x 0 , u * ) = x 0 d ( e δ Δ 1 ) δ d 2 4 δ 3 e 2 δ Δ + d 2 δ 3 b d δ 2 e δ Δ + d 2 2 δ 2 b d δ + b 2 2 Δ 3 d 2 4 δ 3 + b d δ 2 ,
where Δ = T t 0 .
If ( T t 0 ) > b d and δ < δ ¯ , the function u * ( t ) is defined as:
u * ( t ) = 0 , t [ t 0 , t ¯ ] , b + d e δ ( T t ) 1 δ , t ( t ¯ , T ] .
and the corresponding trajectory is:
x * ( t ) = e δ ( t t 0 ) x 0 , t [ t 0 , t ¯ ] , e δ t 2 δ 2 e δ ( T t ) d e δ t + 2 ( b δ d ) e δ T + 2 δ 2 x 0 e δ t 0 + ( b δ d ) 2 d e δ T , t ( t ¯ , T ] .
The corresponding value of the payoff is:
K ( t 0 , x 0 , u * ) = x 0 d ( e δ Δ 1 ) δ d 2 4 δ 3 e 2 δ Δ ¯ + d 2 δ 3 b d δ 2 e δ Δ ¯ + d 2 2 δ 2 b d δ + b 2 2 Δ ¯ 3 d 2 4 δ 3 + b d δ 2 ,
where Δ ¯ = T t ¯ . Note that the latter case differs from the former one in that the optimal control is equal to zero on the interval [ t 0 , t ¯ ] .

3.2. Influence of the Absorption Coefficient on the Payoff

Proposition 2.
lim δ + K ( t 0 , x 0 , u * ) = b 2 2 Δ .
Proposition 2 is proven by applying L’Hospital’s rule to (8) three times.
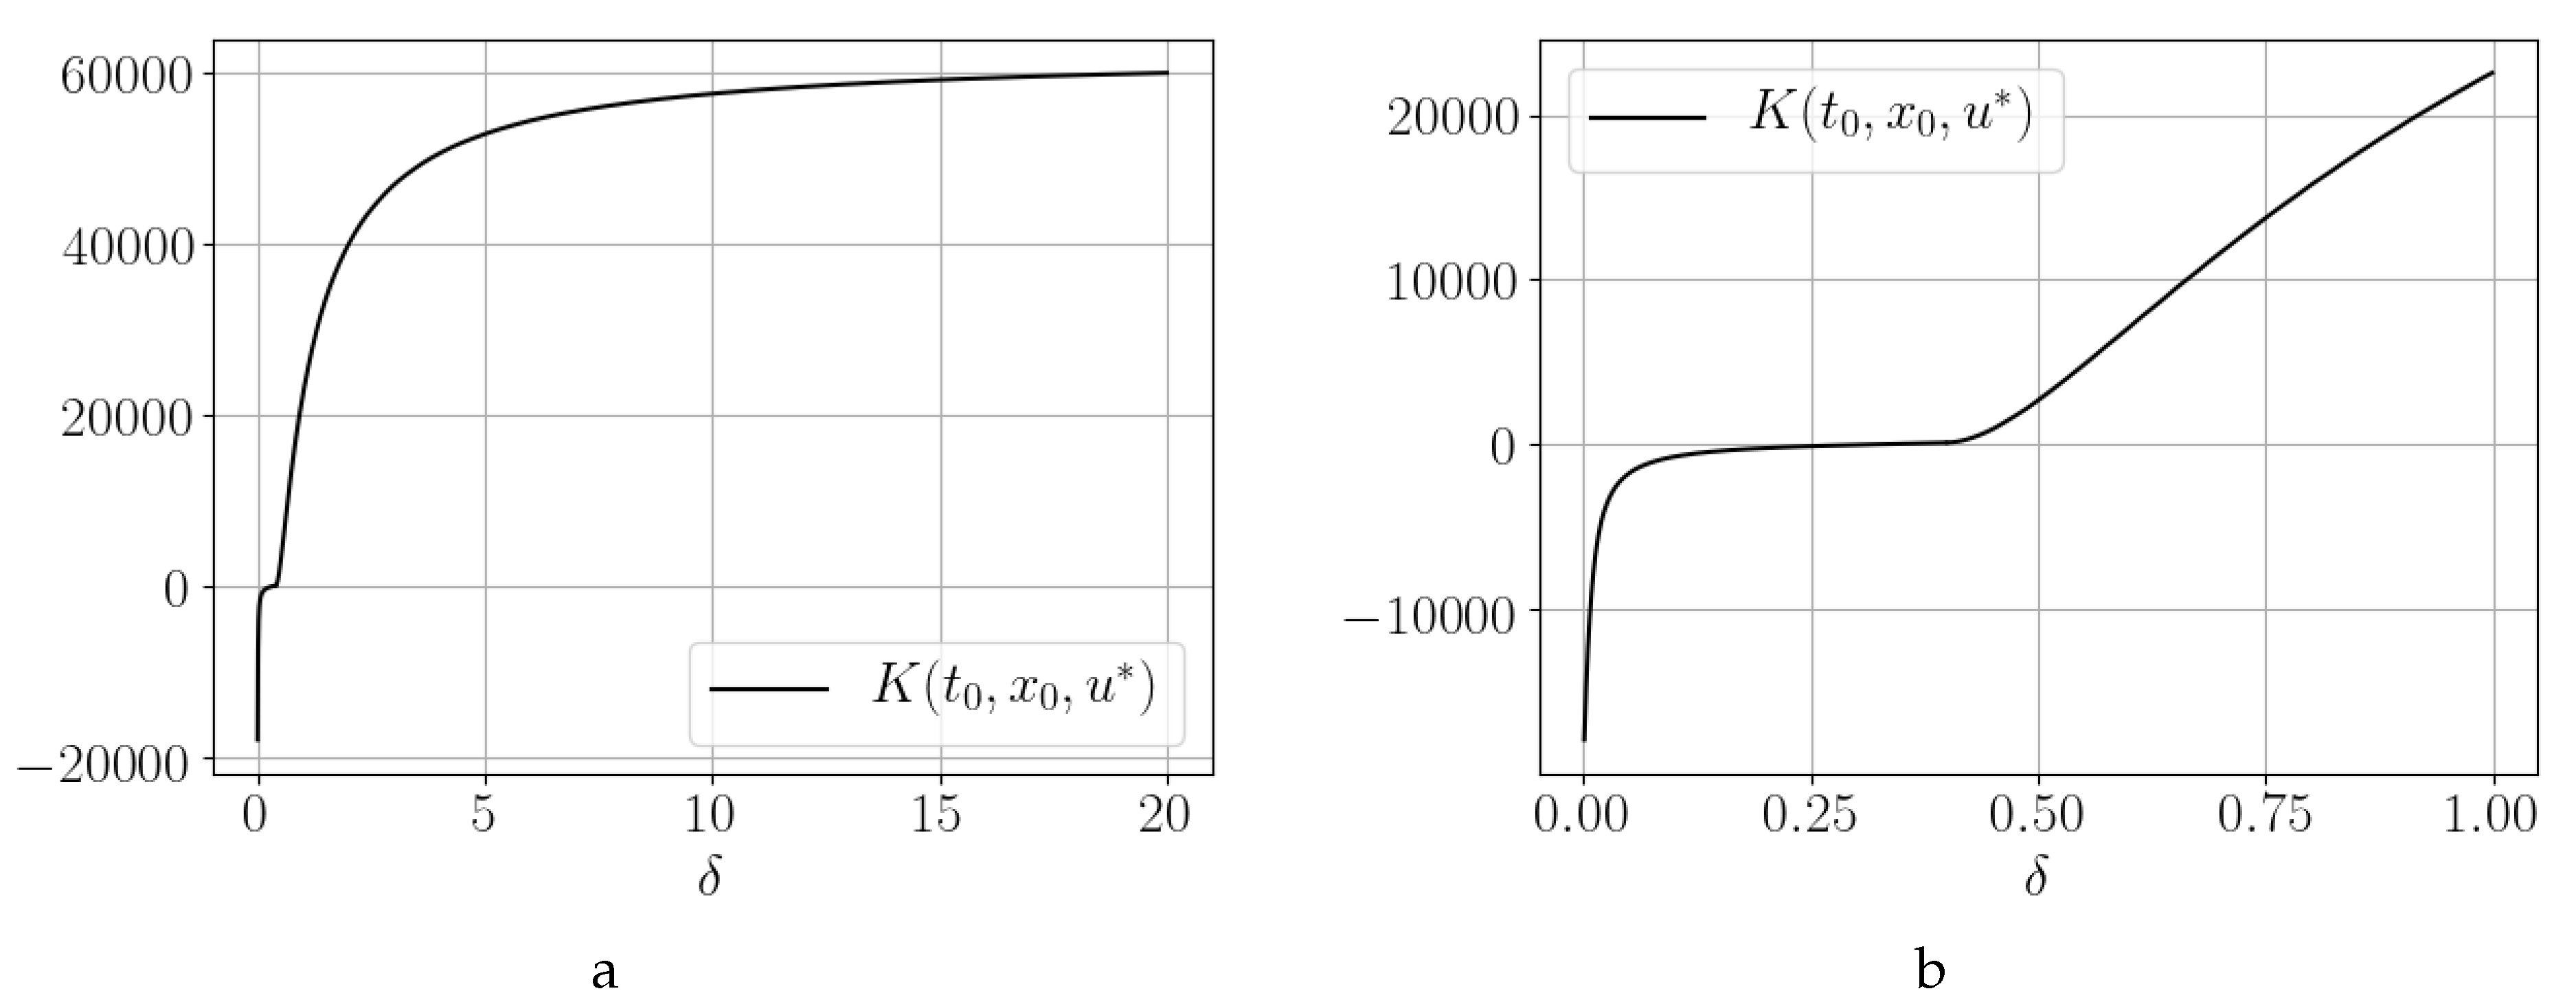
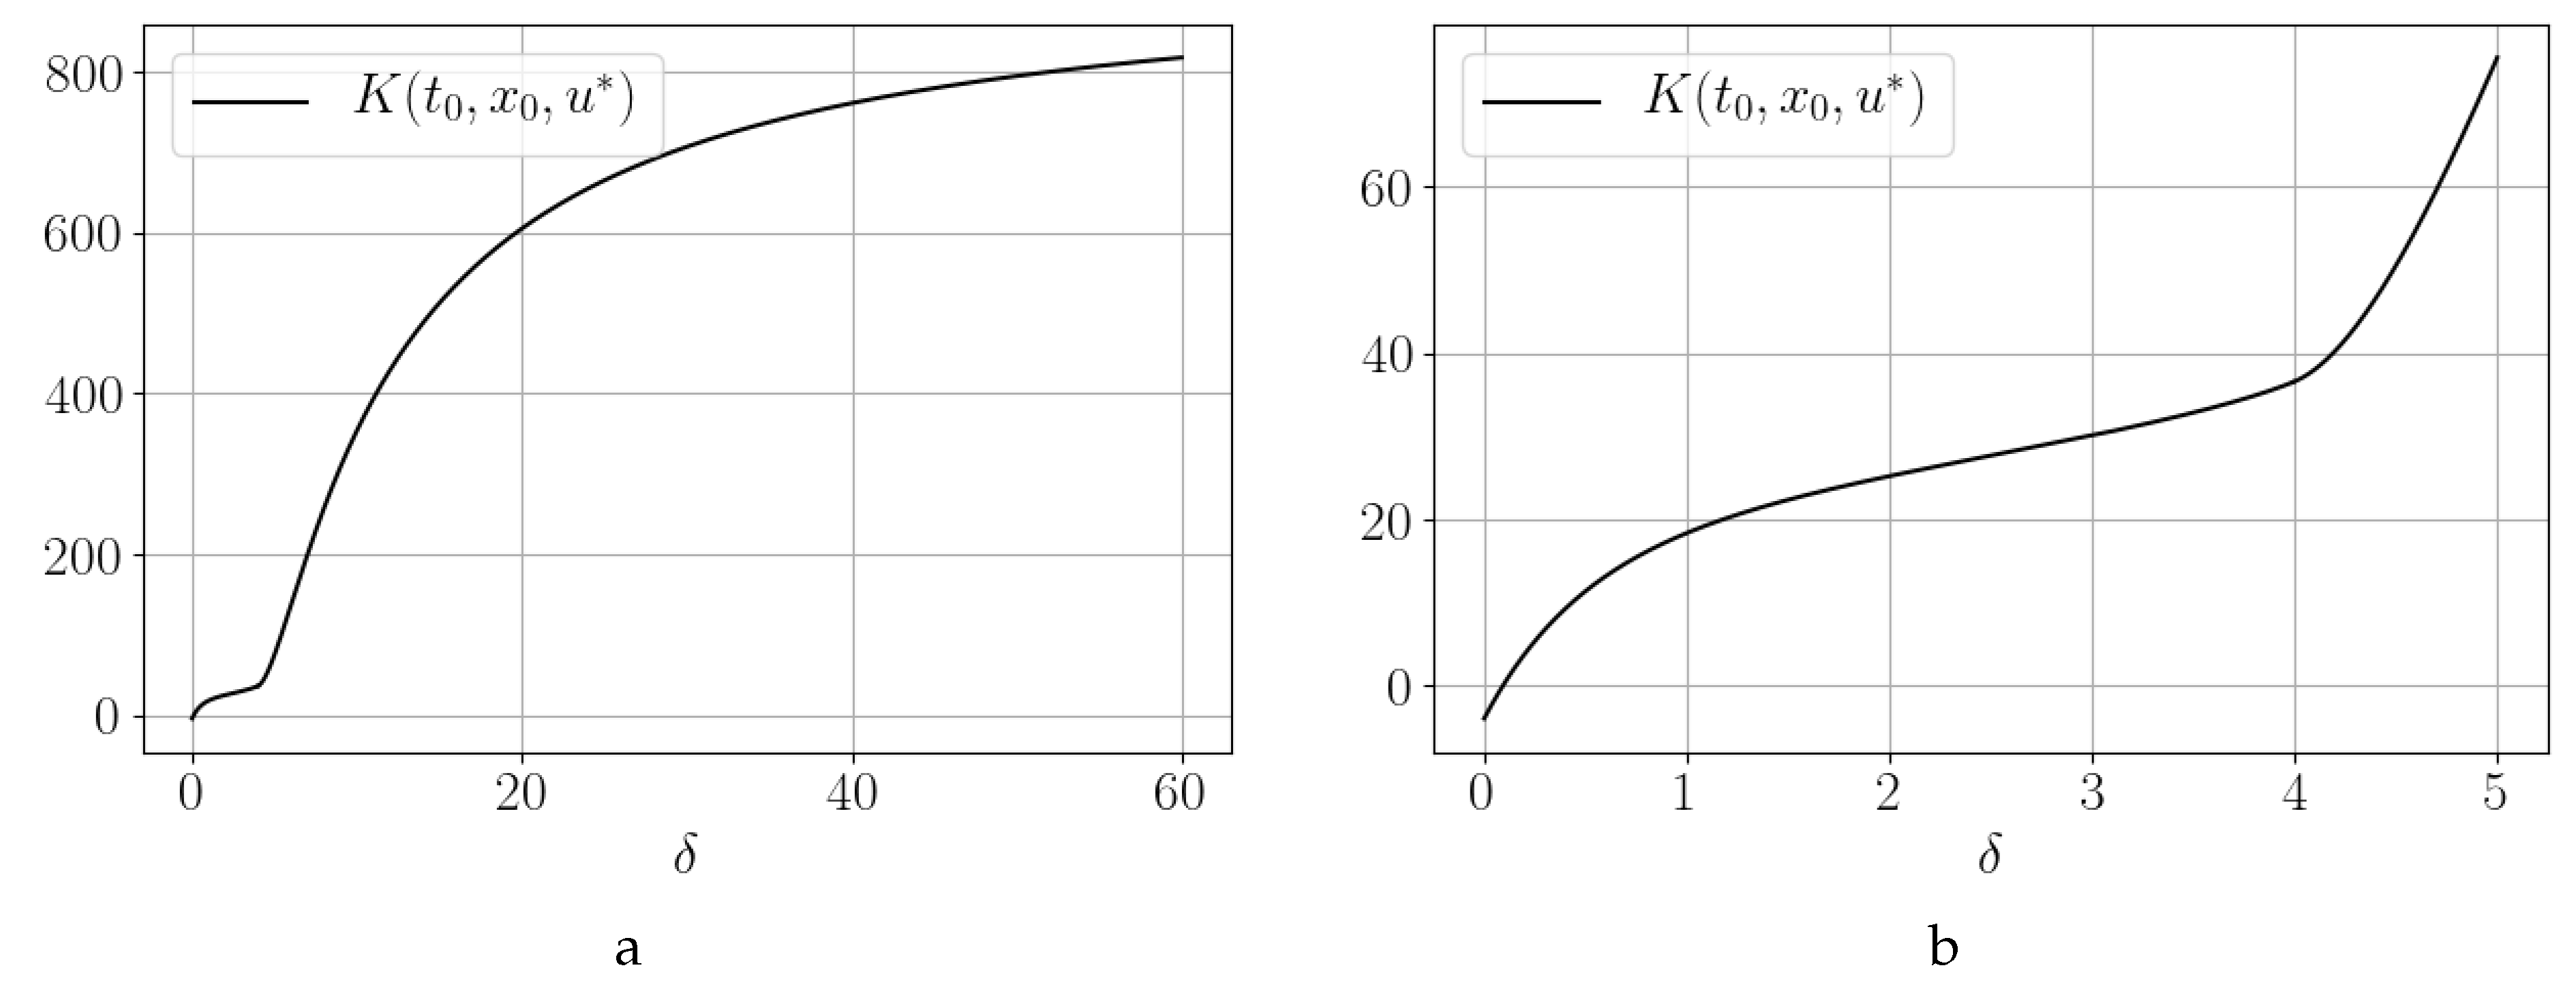
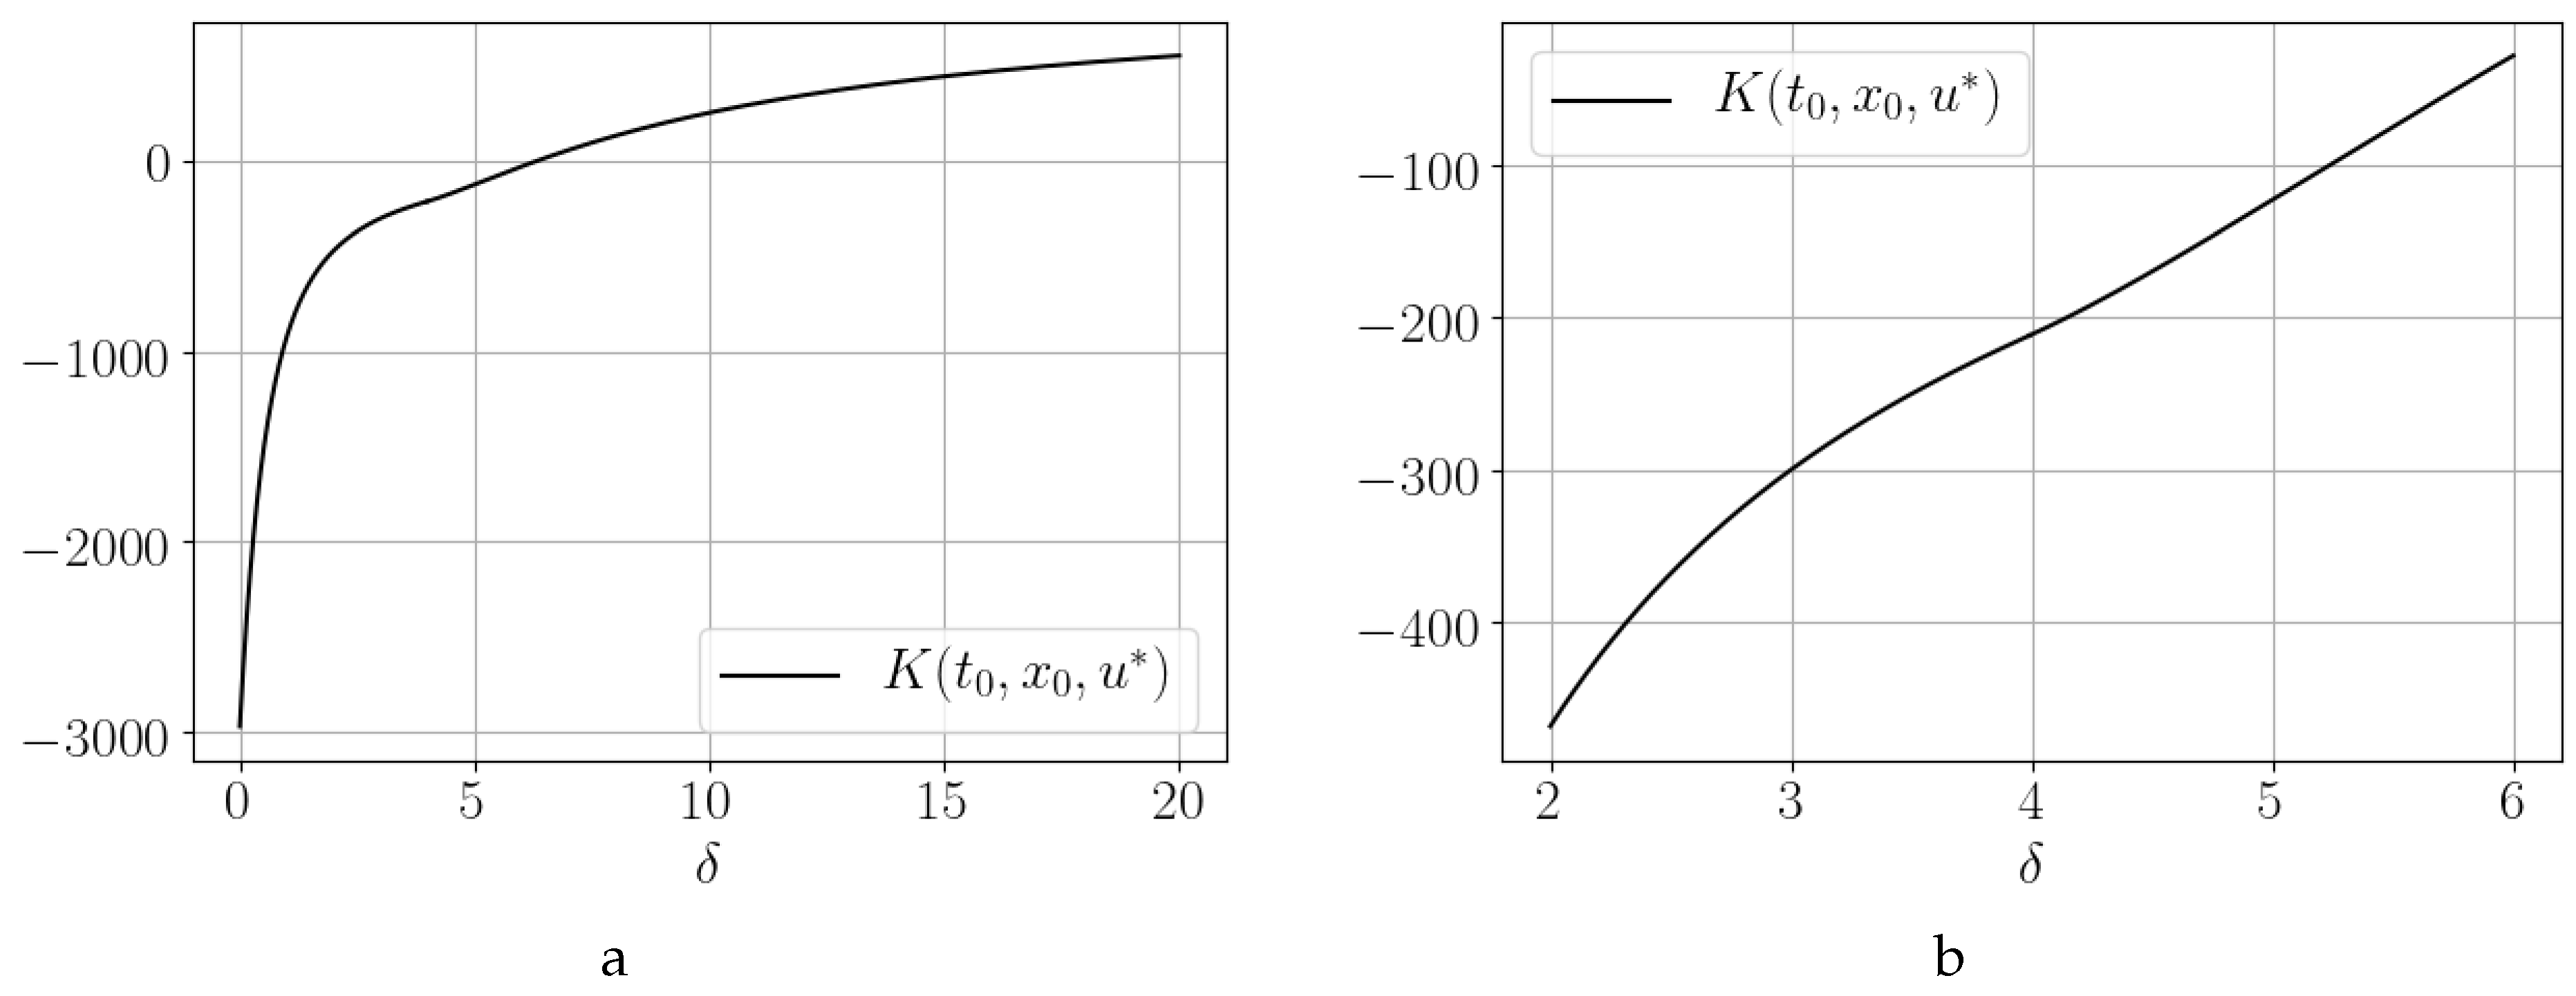
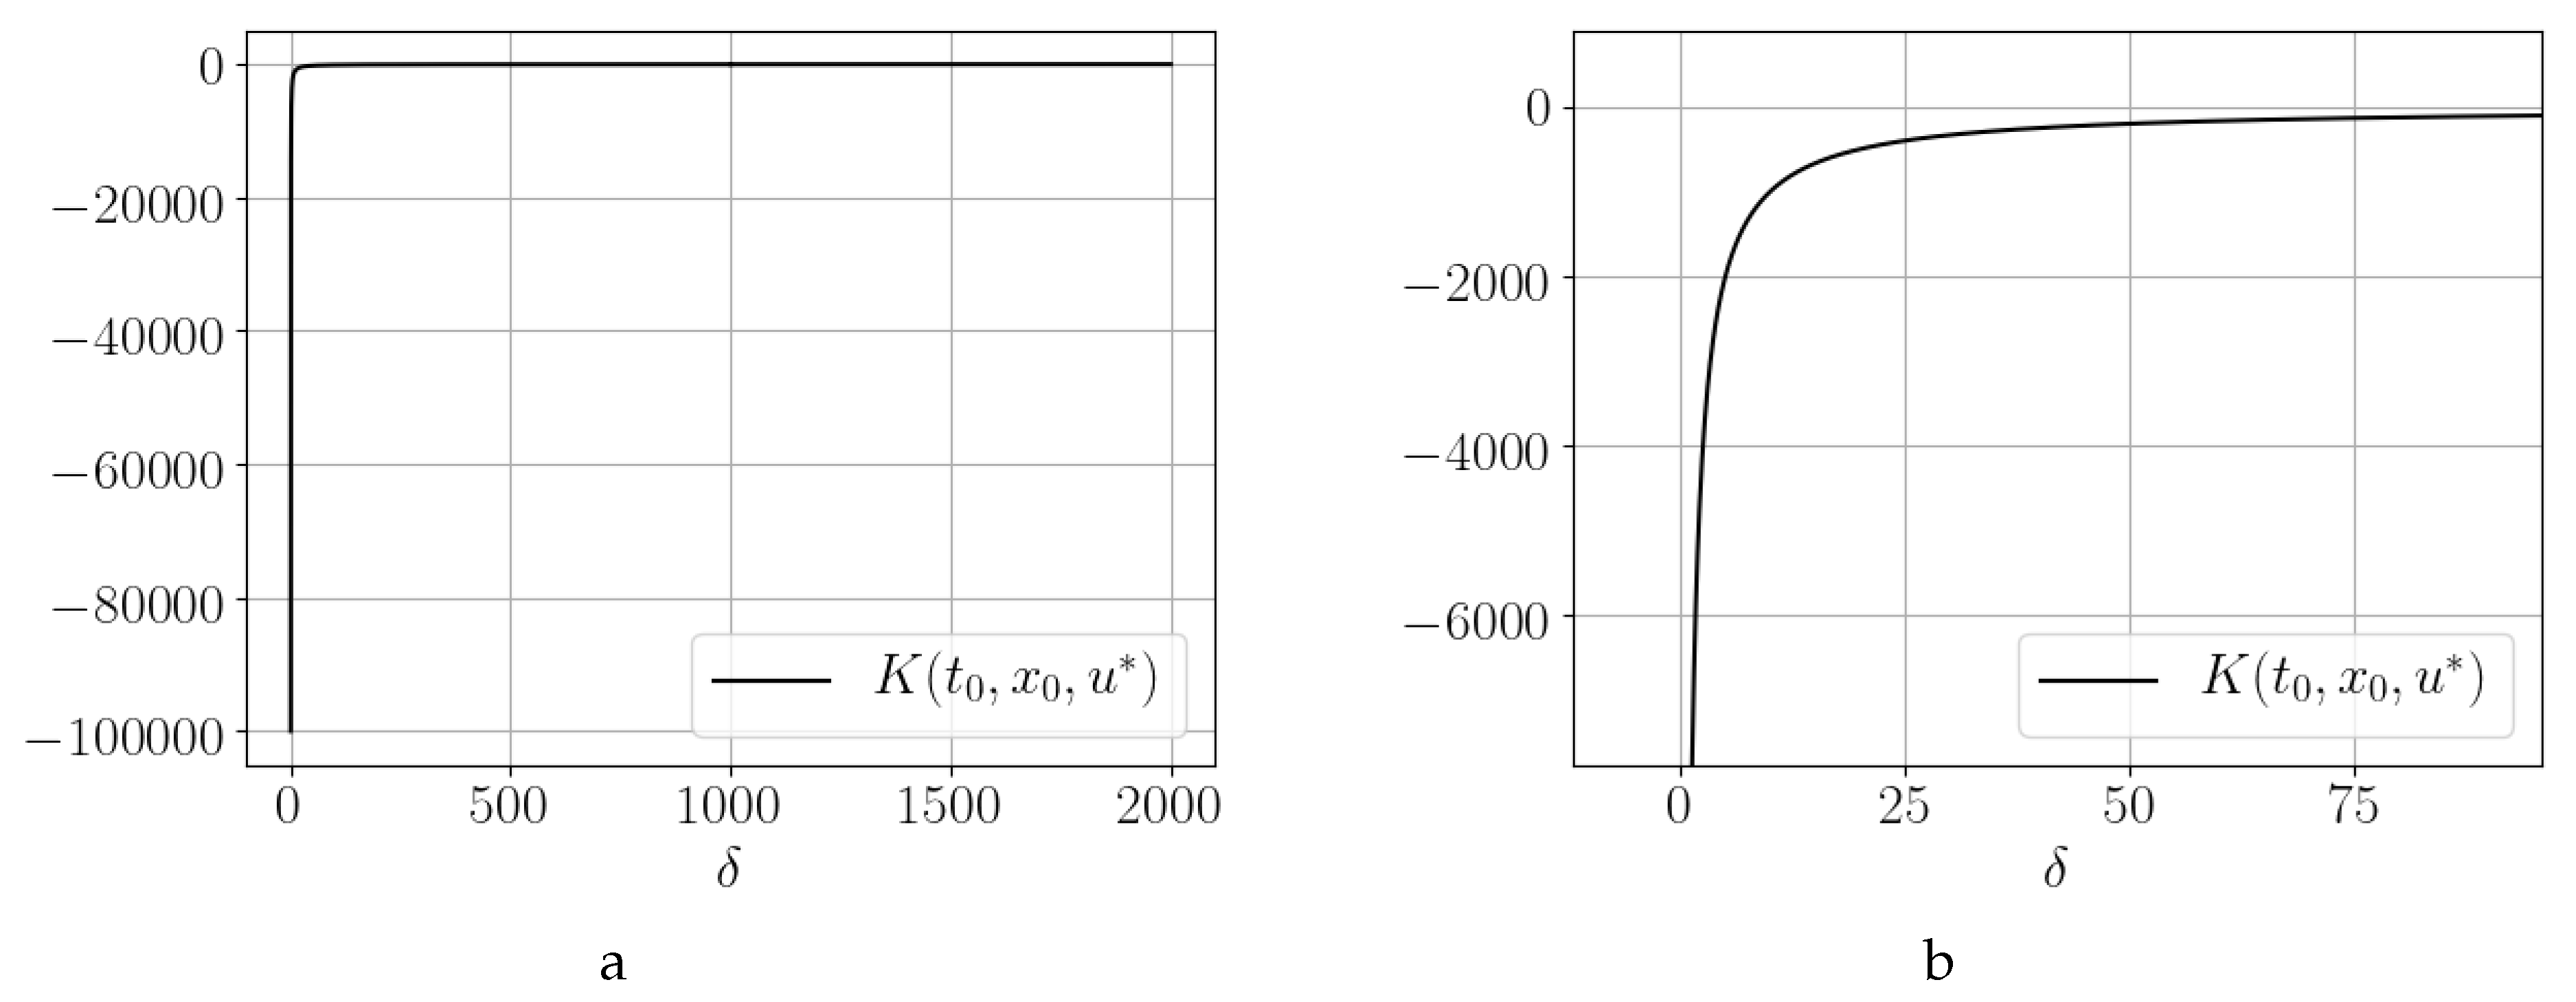
Figure 1, Figure 2, Figure 3, Figure 4 and Figure 5 demonstrate the dependence of the payoff from the absorption coefficient in special cases when the control has a switch point. Here and later on, we follow the convention that the overall plot is shown on the left, while the right plot shows a zoomed-in part of the graph.

4. Game-Theoretical Model of Pollution Control

4.1. No Absorption Coefficient Model

In this section, we consider a differential game of pollution control with a prescribed duration based on the game-theoretical models issued in [4]. The game involves n players (companies or countries), and each of them has an industrial production site in its territory. A three player game was considered in [31].
Let N = { 1 , 2 , , n } with n 2 be a set of players. The strategy of player i is the amount of pollution emitted to the atmosphere over time u i [ 0 ; b i ] . We will look for the solution in the class of open-loop strategies u i ( t ) .
The dynamics of the total amount of pollution x ( t ) is described by the following differential equation:
x ˙ ( t ) = i = 1 n u i ( t ) , x ( t 0 ) = x 0 0 .
The total payoff of the i th player is defined along the same lines as in Section 3.1. Thus, we write the payoff of the i th player as:
K i ( t 0 , x 0 , u ) = t 0 T b i 1 2 u i u i d i x d t ,
where b i and d i are the respective parameters that can be different for each player.
To simplify notation, we introduce the following parameters:
D N = i = 1 n d i , D S = i S d i , D N \ S = i N \ S d i , B N = i = 1 n b i , B ˜ S = i S b i 2 , and s = | S | .
We also assume that the regularity constraints ( T t 0 ) b i D N hold for all i N . These constraints guarantee that u i ( t ) 0 , t [ t 0 , T ] .
We assume the players have made a cooperative agreement on maximizing the total payoff of the players. To compute the cooperative solution (Shapley value, core, Harsanyi dividend, Banzhaf power index, etc.), one has to compute a characteristic function that plays a key role in cooperative game theory. In [23], we constructed the following characteristic functions for every coalition S N .
V α ( S , Δ , x 0 ) = D S x 0 Δ + 1 2 B ˜ S Δ 1 2 B N D S Δ 2 + 1 6 s D S 2 Δ 3 .
V δ ( S , Δ , x 0 ) = D S x 0 Δ + 1 2 B ˜ S Δ 1 2 B N D S Δ 2 + 1 6 ( 2 D N \ S D S + s D S 2 ) Δ 3 .
V ζ ( S , Δ , x 0 ) = D S x 0 Δ + 1 2 B ˜ S Δ 1 2 B N D S Δ 2 1 6 s D N ( D N 2 D S ) Δ 3 .
V η ( S , Δ , x 0 ) = D S x 0 Δ + 1 2 B ˜ S Δ 1 2 B N D S Δ 2 + 1 6 ( s D N 2 + 2 s D N D S + 2 D N \ S D S ) Δ 3 .
Functions (11)–(14) can be shown to be superadditive (see [23]). Moreover, the relations between characteristic functions were found in [23].
V δ ( S , Δ , x 0 ) V α ( S , Δ , x 0 ) , V η ( S , Δ , x 0 ) V ζ ( S , Δ , x 0 ) , V α ( S , Δ , x 0 ) V ζ ( S , Δ , x 0 ) , V δ ( S , Δ , x 0 ) V η ( S , Δ , x 0 )

4.2. Absorption Coefficient Model

We consider a modification of the differential game of pollution control. A special case of this game where n = 3 was considered in detail in [32]. In the paper [33], the construction of the η -characteristic function was presented for the example based on real data.
The dynamics of the total amount of pollution x ( t ) is described by an extended equation:
x ˙ ( t ) = i = 1 n u i ( t ) δ x ( t ) , x ( t 0 ) = x 0 0 ,
where δ > 0 is an absorption coefficient introduced earlier. The payoff function is defined by (10).
In the following, we assume that all additional regularity constraints defined above are satisfied.
Using the definitions (3)–(6), we get the following characteristic functions:
V α ( S , Δ , x 0 ) = x 0 D S e δ Δ 1 δ s D S 2 4 δ 3 e 2 δ Δ + s D S 2 δ 3 B N D S δ 2 e δ Δ + s D S 2 2 δ 2 B N D S δ + B ˜ S 2 Δ 3 s D S 2 4 δ 3 + B N D S δ 2 .
V δ ( S , Δ , x 0 ) = x 0 D S e δ Δ 1 δ s D S 2 + 2 D S D N \ S 4 δ 3 e 2 δ Δ + s D S 2 + 2 D S D N \ S δ 3 B N D S δ 2 e δ Δ + s D S 2 + 2 D S D N \ S 2 δ 2 B N D S δ + B ˜ S 2 Δ 3 ( s D S 2 + 2 D S D N \ S ) 4 δ 3 + B N D S δ 2 .
V ζ ( S , Δ , x 0 ) = x 0 D S e δ Δ 1 δ s D N 2 + 2 s D S D N 4 δ 3 e 2 δ Δ + s D N 2 + 2 s D S D N δ 3 B N D S δ 2 e δ Δ + s D N 2 + 2 s D S D N 2 δ 2 B N D S δ + B ˜ S 2 Δ 3 ( s D N 2 + 2 s D S D N ) 4 δ 3 + B N D S δ 2 .
V η ( S , Δ , x 0 ) = x 0 D S e δ Δ 1 δ s ( 2 D S D N ) D N + 2 D S D N \ S 4 δ 3 e 2 δ Δ + s ( 2 D S D N ) D N + 2 D S D N \ S δ 3 B N D S δ 2 e δ Δ + s ( 2 D S D N ) D N + 2 D S D N \ S 2 δ 2 B N D S δ + B ˜ S 2 Δ 3 s ( 2 D S D N ) D N + 2 D S D N \ S 4 δ 3 + B N D S δ 2 .
Functions (17)–(20) are superadditive. The construction of characteristic functions and the proof of their superadditivity are given in Appendix B and Appendix C. It can also be checked that the relations between characteristic Functions (15) are satisfied. In addition, we obtain the result:
V δ ( S , Δ , x 0 ) + V ζ ( S , Δ , x 0 ) = V η ( S , Δ , x 0 ) + V α ( S , Δ , x 0 ) .
Theorem 1.
The limits of the α-, δ-, ζ-, and η-characteristic functions exist and are equal as δ tends to infinity.
lim δ + V α ( S , Δ , x 0 ) = lim δ + V δ ( S , Δ , x 0 ) = lim δ + V ζ ( S , Δ , x 0 ) = lim δ + V η ( S , Δ , x 0 ) = B ˜ S 2 Δ .
Theorem 1 is proven by computing limits with the use of the L’Hospital rule.

5. Optimal Control of Pollution Emissions for the Irkutsk Region

As an illustration, we considered a differential game of pollution control based on real data for enterprises of the Irkutsk region [16,33]. The ecological situation in Bratsk is one of the most acute in the region. We observed that the three largest enterprises of Bratsk pollute the environment: OJSC «RUSAL Bratsk», OJSC «ILIM Group», and units of OJSC «Irkutskenergo».
We used the coefficients of the differential game that were found in the paper [16].
We considered two cases. In the first case, the dynamics of the total amount of pollution x ( t ) is described by (9). This means that there is no absorption coefficient in the model.
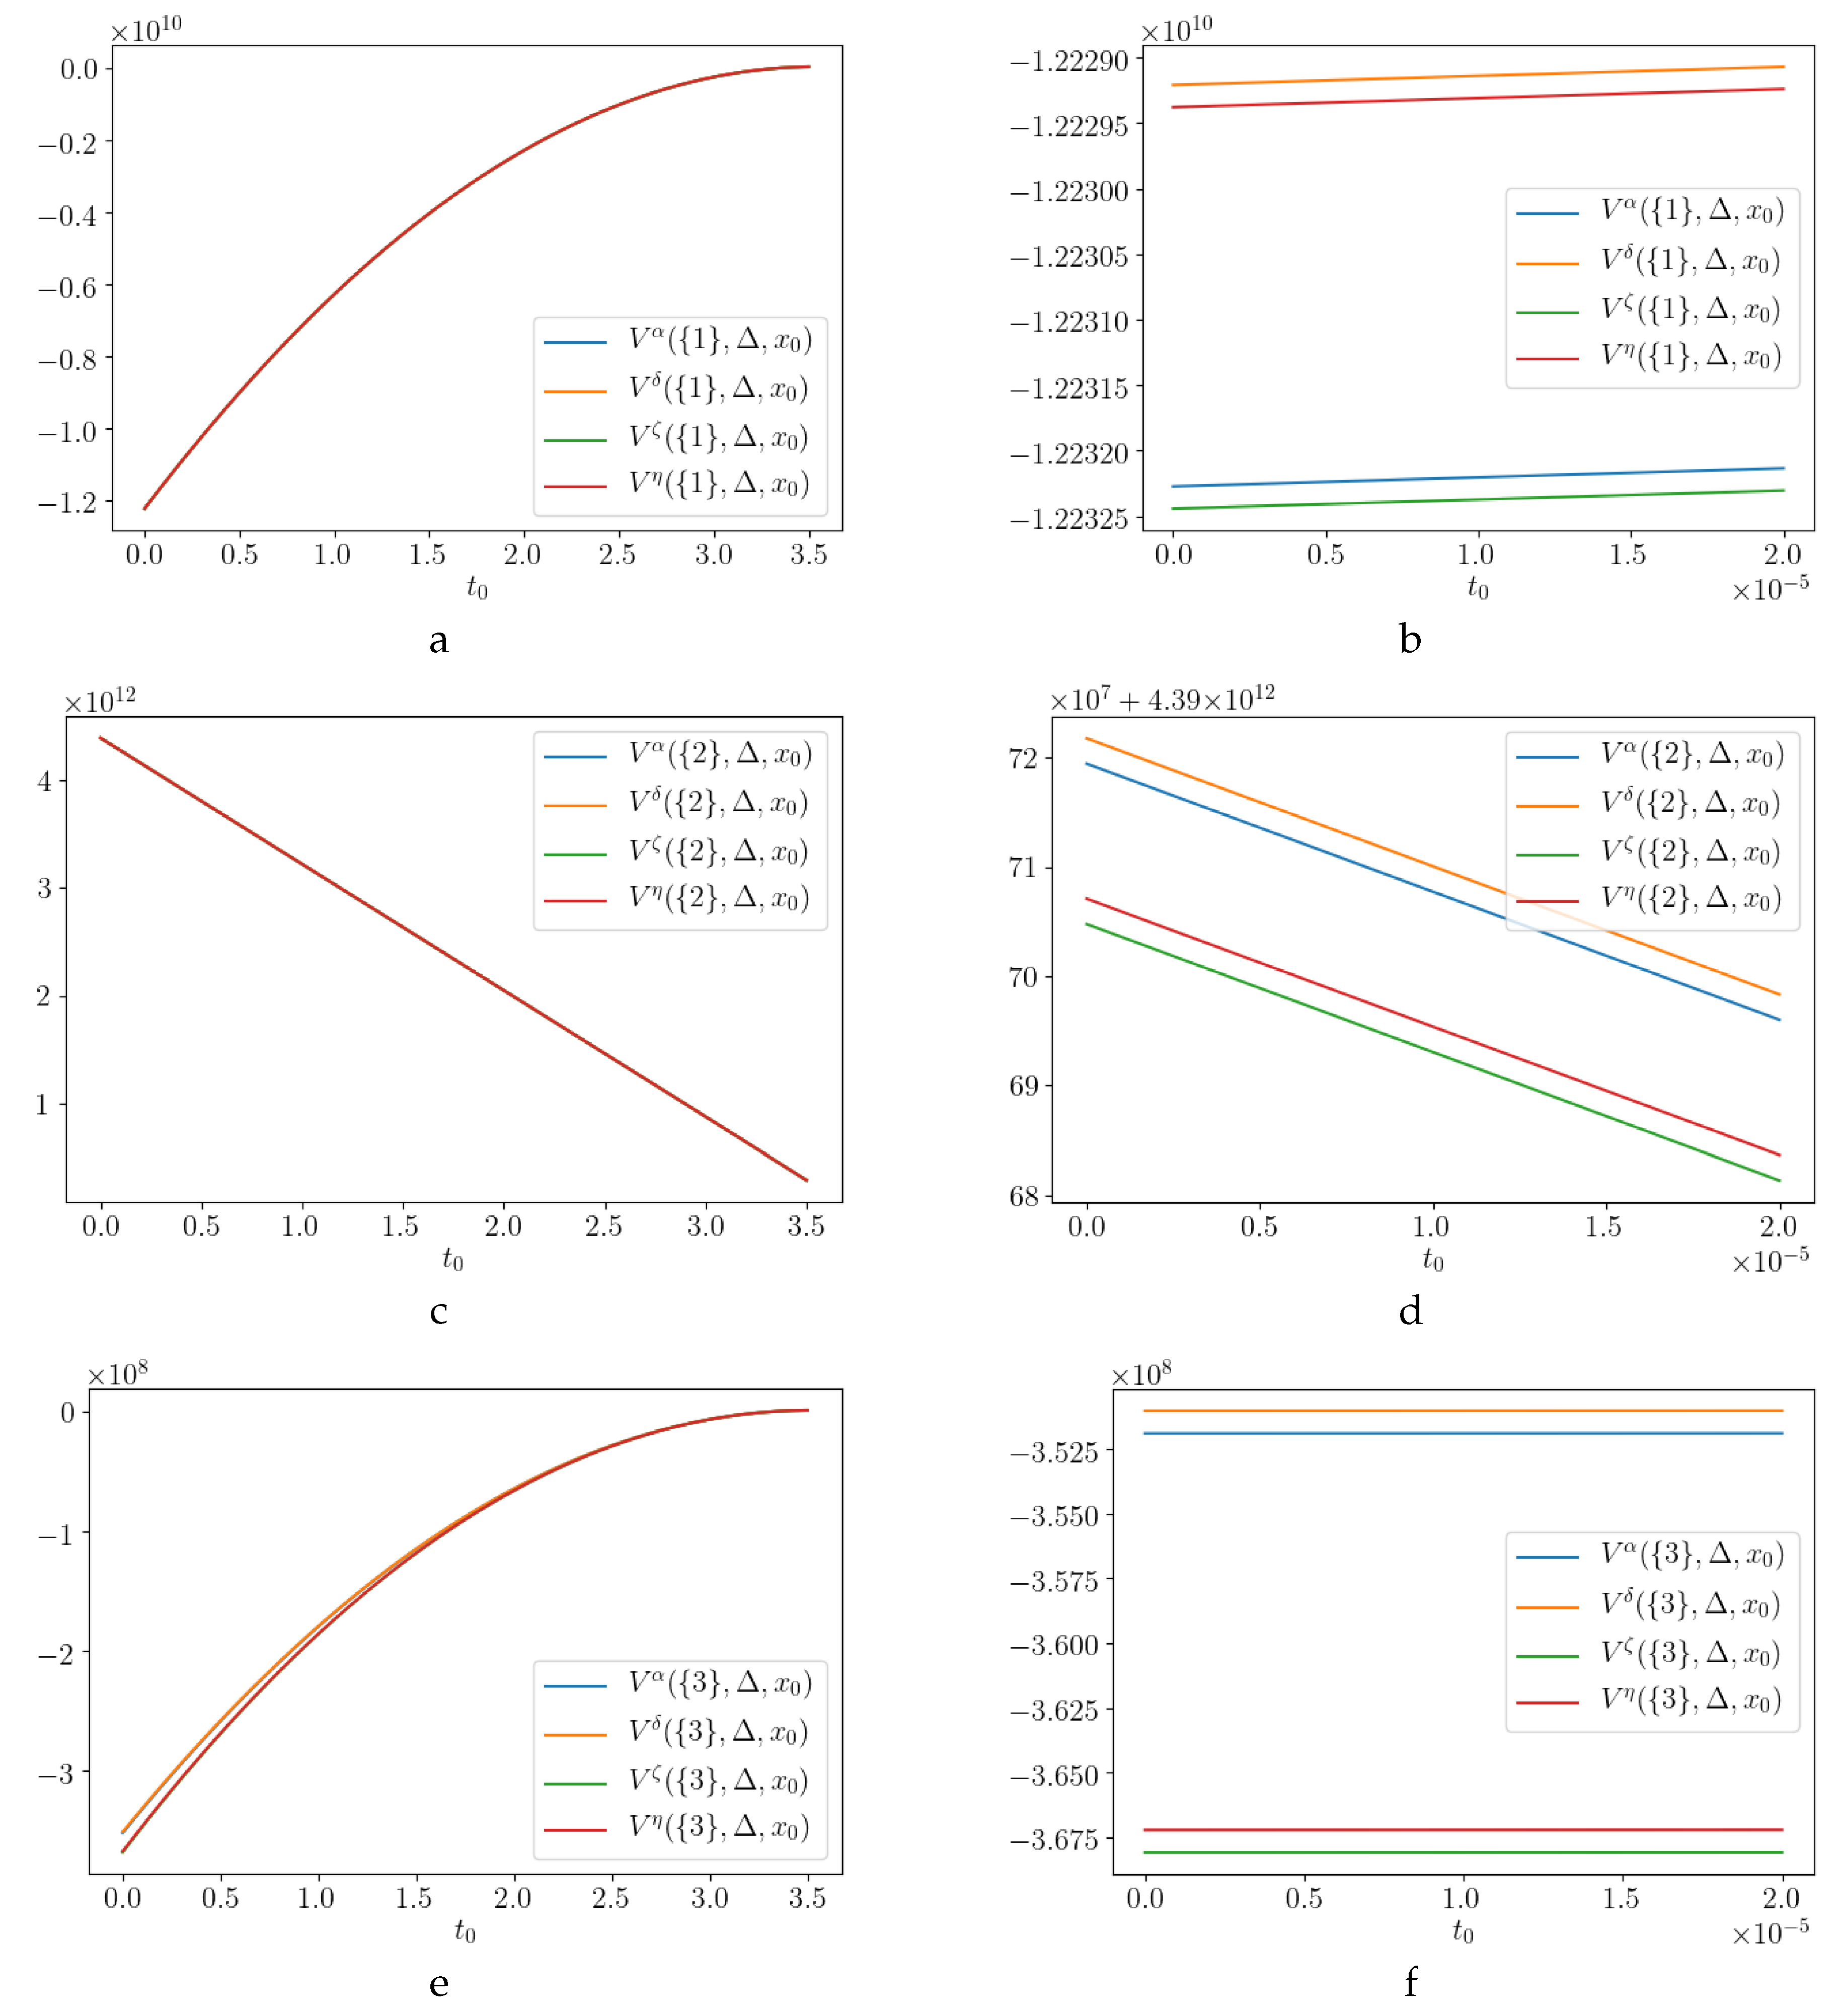
Using the provided numerical values of the parameters, we used (11)–(14) to compute α -, δ -, ζ -, and η -characteristic functions as functions of x 0 and Δ .
Figure 6 shows the influence of the initial time t 0 on the characteristic functions of the individual players. Similar results can be shown for the case of coalitions. In the following figures, we present the respective dependence on the left side and the zoomed-in fragments of the respective plots on the right side.
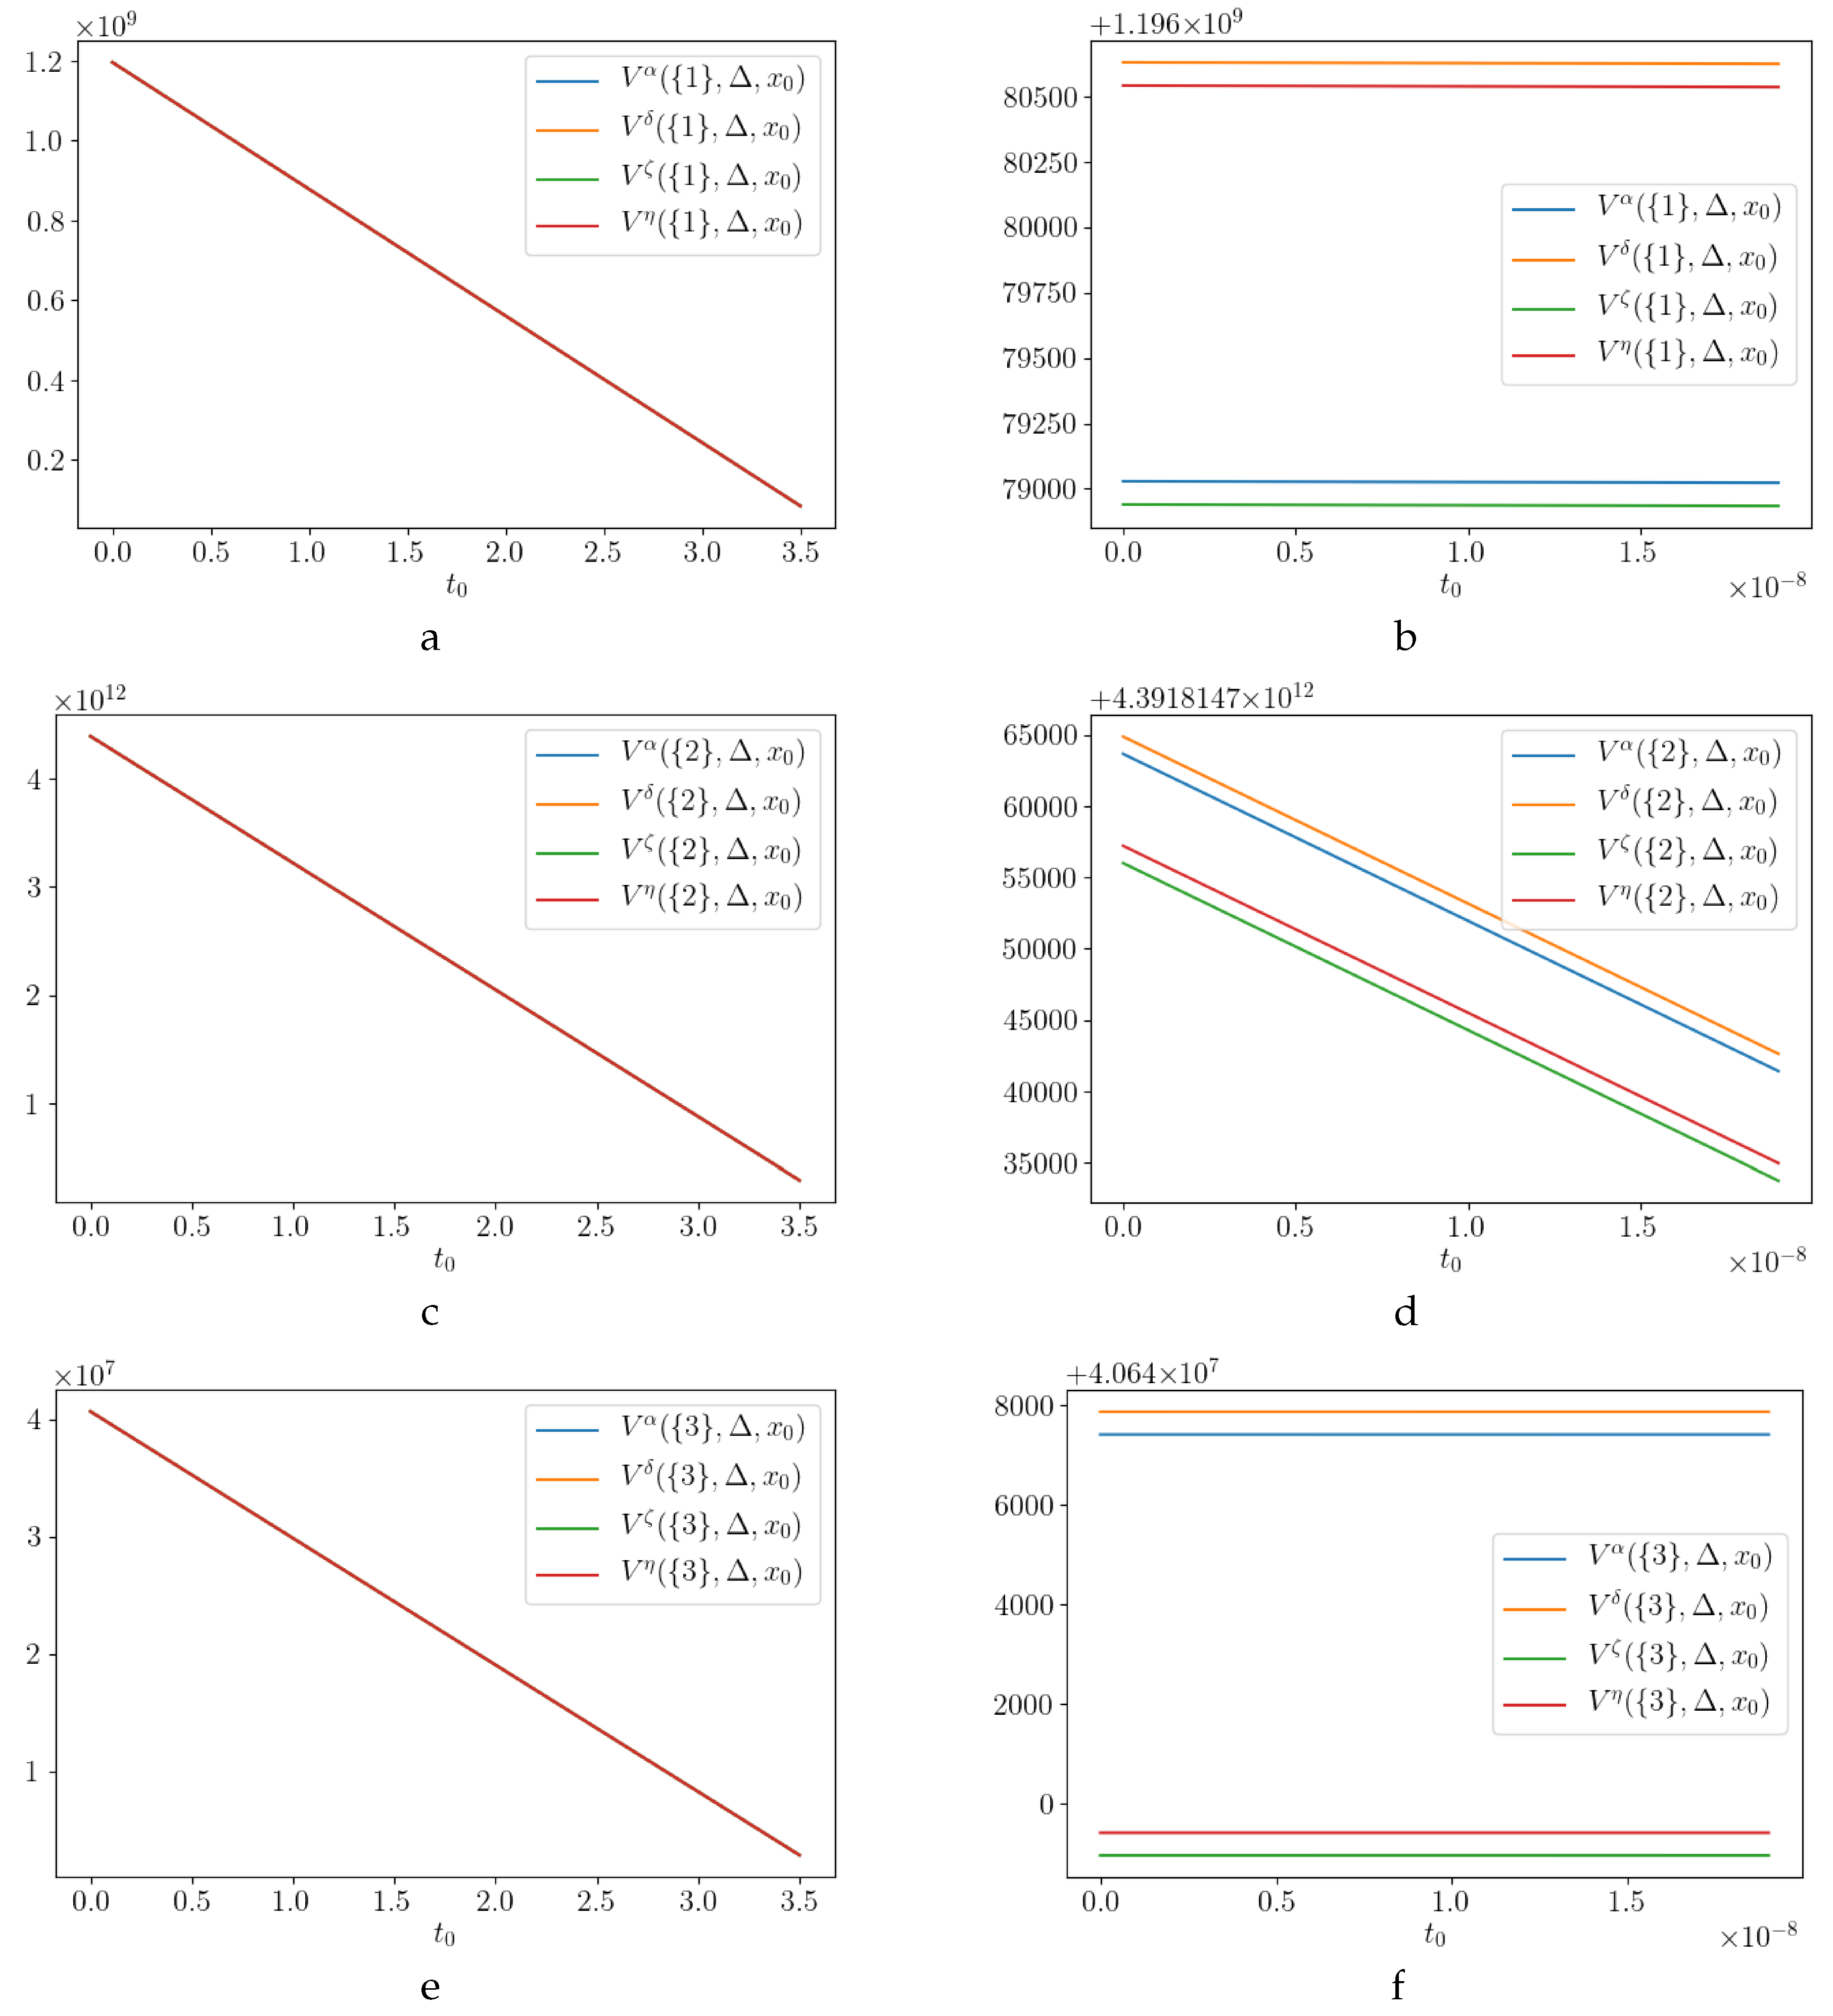
We now proceed to the case with non-zero pollution absorption. The dynamics of x ( t ) is described by (16). Using the numerical values from Table 1 and the expressions for the characteristic Functions (17)–(20), we calculated the α -, δ -, ζ -, and η -characteristic functions.
Below, we present the plots showing the effect of the initial time t 0 and the absorption coefficient δ on the values of the respective characteristic functions. In particular, Figure 7 shows the influence of the initial time t 0 on the characteristic functions of the individual players, while Figure 8 illustrates the dependence of characteristic functions on the parameter δ . All presented results can be demonstrated for the coalitions as well.
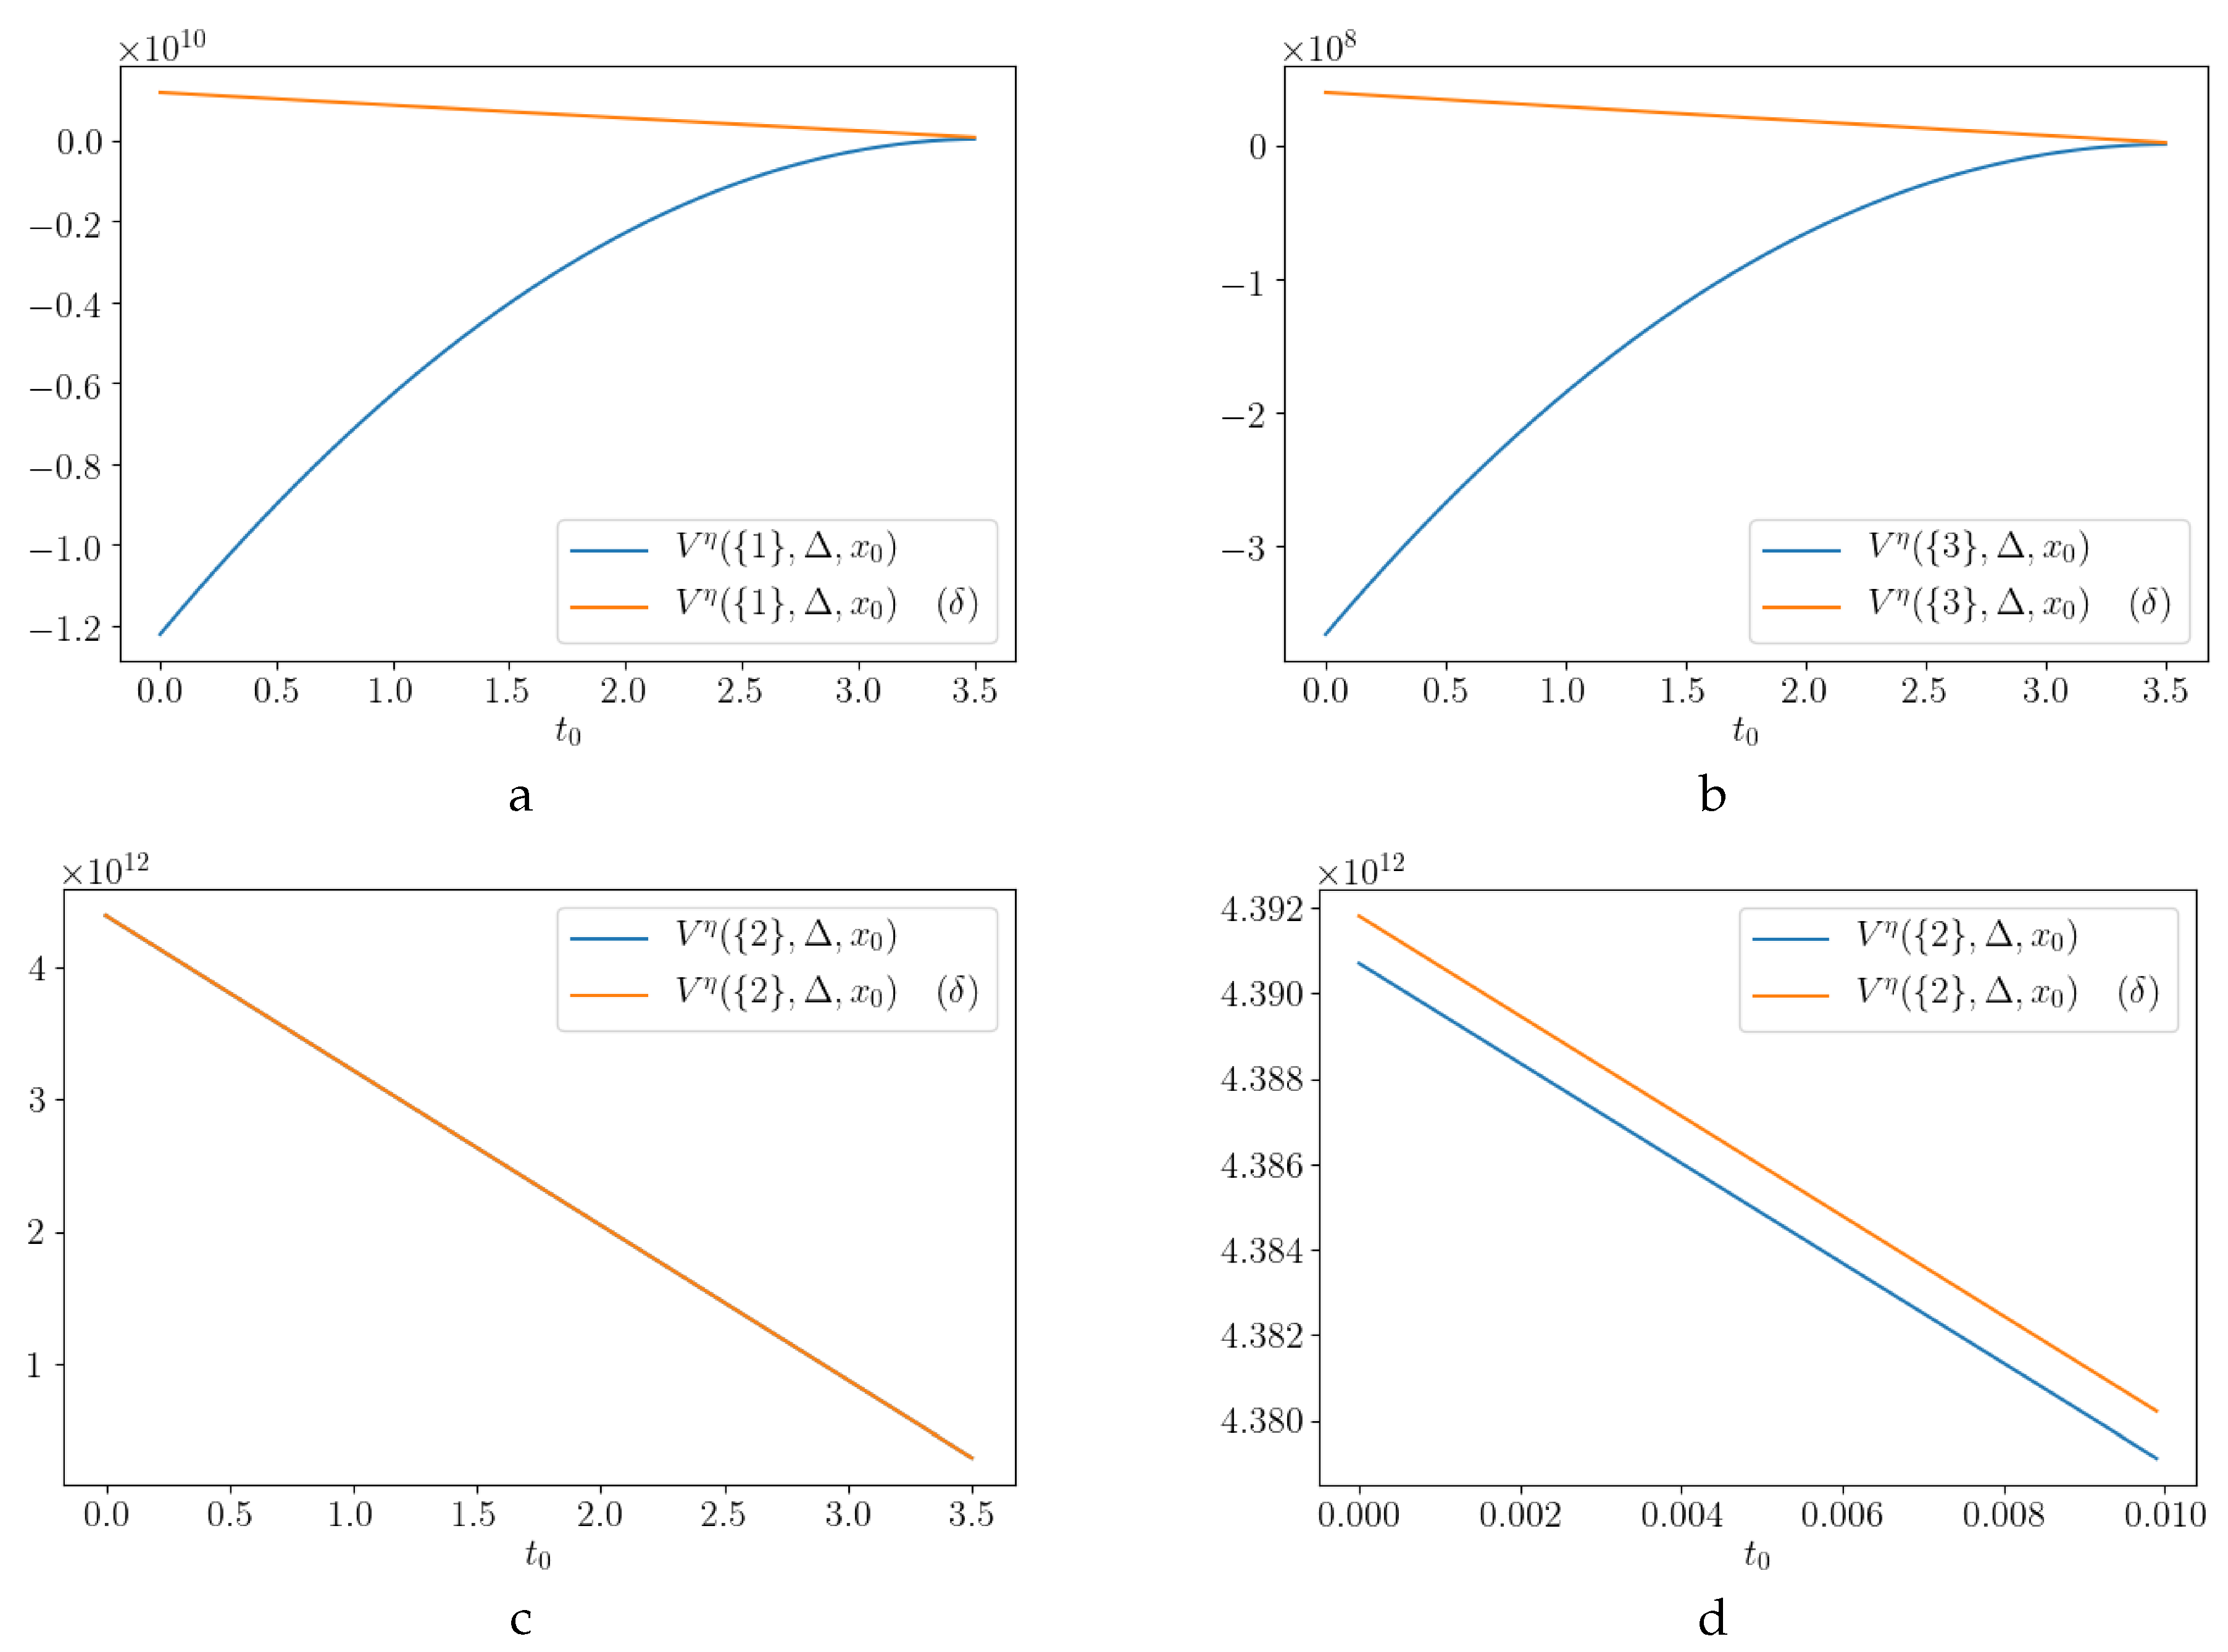
Finally, in Figure 9, we illustrate the difference between the characteristic functions for the cases when the absorption coefficient is equal to zero (blue line) and when the absorption coefficient is taken from Table 1. For the illustration, we chose the η -characteristic function.

Conclusions

In this paper, we considered a cooperative differential game of pollution control with a prescribed duration. We analyzed two cases when there was an absorption coefficient δ and when there was not. For these games, α -, δ -, ζ -, and η -characteristic functions were constructed for the general case of n players.
It was shown that the parameter δ had a significant impact on the characteristic functions. We also obtained analytical formulas for the limiting values of the characteristic functions with increasing absorption coefficient.
All results were illustrated with the differential game of pollution control based on real data for enterprises of the Irkutsk region.

Author Contributions

Conceptualization: E.G. Formal analysis: E.M., P.B. Funding acquisition: E.G. Investigation: E.M., E.G., A.S., P.B. Methodology: E.G., E.M. Project administration: E.M. Supervision: E.G. Validation: E.M., P.B. Visualization: E.M. Writing – original draft: E.M., E.G. All authors have read and agreed to the published version of the manuscript.

Funding

Ekaterina Gromova acknowledges the grant from Russian Science Foundation 17-11-01079.

Conflicts of Interest

The authors declare no conflict of interest.

Appendix A. Construction of Optimal Pollution Control

Proof of Proposition 1
Proof. 
The proof of u * ( t ) b is trivial because the second term is not positive.
We differentiate u * ( t ) with respect to t:
d u * ( t ) d t = d e δ ( T t ) > 0 , t [ t 0 , T ] .
Therefore, u * ( t ) is an increasing function of t. This means that the function takes a minimum value at a point t = t 0 :
u * ( t 0 ) = b + d e δ ( T t 0 ) 1 δ .
We differentiate u * ( t ) with respect to δ :
d u * ( t ) d δ = d e δ ( T t ) ( δ ( T t ) + e δ ( T t ) 1 ) δ 2 .
Obviously, d e δ ( T t ) > 0 and δ 2 > 0 . To define the sign of ( δ ( T t ) + e δ ( T t ) 1 ) :
d ( δ ( T t ) + e δ ( T t ) 1 ) d δ = ( T t ) ( e δ ( T t ) 1 ) > 0 .
Hence, ( δ ( T t ) + e δ ( T t ) 1 ) is an increasing function of δ . It follows that the function is positive for δ > 0 . This completes the proof that d u * ( t ) d δ > 0 .
Thus, u * ( t ) is an increasing function of δ , then:
u * ( t 0 ) lim δ 0 b + d e δ ( T t 0 ) 1 δ = b d ( T t 0 ) .
If b d ( T t 0 ) 0 , which is the same as ( T t 0 ) b d , then u * ( t ) 0 , δ and t [ t 0 , T ] . Next, we consider the case ( T t 0 ) > b d . We find δ that provides u * ( t ) 0 .
Note that u * ( t 0 ) 0 for sufficiently large δ . If δ tends to zero, then u * ( t ) < 0 at t = t 0 at least. Define the delta at which u * ( t 0 ) = 0 under the condition u * ( t ) is an increasing function of t and δ .
b + d e δ ( T t 0 ) 1 δ = 0 ,
whence, upon some algebraic manipulation, we get:
δ ( T t 0 ) d ( T t 0 ) b + d ( T t 0 ) b e δ ( T t 0 ) = 0 .
We define:
ρ = d ( T t 0 ) b , ε = δ ( T t 0 ) .
Since ( T t 0 ) > b d , then ρ > 1 . Hence, we obtain the equation ε ρ + ρ e ε = 0 . Solving this equation with respect to ε , we get:
ε = ρ + W ( ρ e ρ ) .
Finally, we arrive at the following expression for the threshold value of δ :
δ = 1 T t 0 d ( T t 0 ) b + W d ( T t 0 ) b exp d ( T t 0 ) b = d b + 1 T t 0 W d ( T t 0 ) b exp d ( T t 0 ) b = δ ¯ .
If δ δ ¯ , then u * ( t 0 ) 0 and u * ( t ) 0 , t [ t 0 , T ] . Otherwise, if δ < δ ¯ , then u * ( t 0 ) < 0 . We determine the moment t ¯ > t 0 at which the optimal control turns to zero: u * ( t ¯ ) = 0 . Solving:
b + d e δ ( T t ) 1 δ = 0 ,
we get:
t ¯ = T + 1 δ ln 1 b δ d .
Thus, t ¯ is the point where the control changes sign. □

Appendix B. Computation of the Characteristic Functions

Appendix B.1. Nash Equilibrium

The computation of the Nash equilibrium strategies (NE) is fairly obvious, so we skip most details. Using the Pontryagin maximum principle, we find the Nash equilibrium strategies:
u N E ( t ) = b 1 + d 1 e δ ( T t ) 1 δ b n + d n e δ ( T t ) 1 δ
and the corresponding trajectory:
x N E ( t ) = e δ t 2 δ 2 e δ ( T t ) D N e δ t + 2 ( B N δ D N ) e δ T e δ ( T t 0 ) D N e δ t 0 + 2 ( B N δ D N δ 2 x 0 ) e δ T .
Following the same scheme as that shown in Appendix A, we obtain that if ( T t 0 ) b i d i , then u i N E ( t ) 0 , δ > 0 and t [ t 0 , T ] .

Appendix B.2. Cooperative Agreement

The optimal cooperative strategies are:
u * ( t ) = b 1 + D N e δ ( T t ) 1 δ b n + D N e δ ( T t ) 1 δ
and the optimal trajectory is:
x * ( t ) = e δ t 2 δ 2 e δ ( T t ) n D N e δ t + 2 ( B N δ n D N ) e δ T e δ ( T t 0 ) ( n D N e δ t 0 + 2 ( B N δ n D N δ 2 x 0 ) e δ T ) .
For the optimal control, we have that if b i D N ( T t 0 ) 0 , which is the same as ( T t 0 ) b i D N , then u * ( t ) 0 , δ and t [ t 0 , T ] .

Appendix B.3. Construction of the α-Characteristic Function

We consider a minimization problem:
min u j j N \ S i S t 0 T b i 1 2 u i u i d i x d t , S N .
For this problem, the optimal strategies are:
u j = b j .
Next, we consider a maximization problem:
max u i , i S , u j = b j , j N \ S i S t 0 T b i 1 2 u i u i d i x d t , S N .
For this problem, we obtain the controls:
u i S ( t ) = b i + D S e δ ( T t ) 1 δ , i S .
The corresponding trajectory is:
x S ( t ) = e δ t 2 δ 2 e δ ( T t ) s D S e δ t + 2 ( B N δ s D S ) e δ T e δ ( T t 0 ) s D S e δ t 0 + 2 ( B N δ s D S δ 2 x 0 ) e δ T .
For the controls (A4), we have that if ( T t 0 ) b i D S , then u i S ( t ) 0 , δ > 0 and t [ t 0 , T ] .
Combining (3), (A3), and (A4), we construct the α -characteristic function:
V α ( S , t 0 , x 0 ) = x 0 D S e δ ( T t 0 ) 1 δ s D S 2 4 δ 3 e 2 δ ( T t 0 ) + s D S 2 δ 3 B N D S δ 2 e δ ( T t 0 ) + s D S 2 2 δ 2 B N D S δ + B ˜ S 2 ( T t 0 ) 3 s D S 2 4 δ 3 + B N D S δ 2 .

Appendix B.4. Construction of the δ-Characteristic Function

We consider a maximization problem:
max u i , i S , u j = u j N E , j N \ S i S t 0 T b i 1 2 u i u i d i x d t , S N .
For this problem, the optimal controls are:
u i S ( t ) = b i + D S e δ ( T t ) 1 δ
and the corresponding trajectory is:
x S ( t ) = e δ t 2 δ 2 ( e δ ( T t ) ( s D S + D N \ S ) e δ t + 2 ( B N δ s D S D N \ S ) e δ T e δ ( T t 0 ) ( s D S + D N \ S ) e δ t 0 + 2 ( B N δ s D S D N \ S δ 2 x 0 ) e δ T ) .
Similar to the previous cases, we have that if ( T t 0 ) b i D S , then u i S ( t ) 0 , δ > 0 and t [ t 0 , T ] .
Combining (4), (A1), and (A5), we construct the δ -characteristic function:
V δ ( S , t 0 , x 0 ) = x 0 D S e δ ( T t 0 ) 1 δ s D S 2 + 2 D S D N \ S 4 δ 3 e 2 δ ( T t 0 ) + s D S 2 + 2 D S D N \ S δ 3 B N D S δ 2 e δ ( T t 0 ) + s D S 2 + 2 D S D N \ S 2 δ 2 B N D S δ + B ˜ S 2 ( T t 0 ) 3 ( s D S 2 + 2 D S D N \ S ) 4 δ 3 + B N D S δ 2 .

Appendix B.5. Construction of the ζ-Characteristic Function

According to (5), players from coalition S N use optimal controls (A2).
We consider the minimization problem:
min u j , j N \ S i S t 0 T b i 1 2 u i * u i * d i x d t , S N .
In this case, the optimal strategies are:
u j = b j .
Combining (5), (A2), and (A6), we construct the ζ -characteristic function:
V ζ ( S , t 0 , x 0 ) = x 0 D S e δ ( T t 0 ) 1 δ s D N 2 + 2 s D S D N 4 δ 3 e 2 δ ( T t 0 ) + s D N 2 + 2 s D S D N δ 3 B N D S δ 2 e δ ( T t 0 ) + s D N 2 + 2 s D S D N 2 δ 2 B N D S δ + B ˜ S 2 ( T t 0 ) 3 ( s D N 2 + 2 s D S D N ) 4 δ 3 + B N D S δ 2 .

Appendix B.6. Construction of the η-Characteristic Function

According to (6), players from S N use (A2) when players from N \ S use (A1). We construct the η -characteristic function:
V η ( S , t 0 , x 0 ) = x 0 D S e δ ( T t 0 ) 1 δ s ( 2 D S D N ) D N + 2 D S D N \ S 4 δ 3 e 2 δ ( T t 0 ) + s ( 2 D S D N ) D N + 2 D S D N \ S δ 3 B N D S δ 2 e δ ( T t 0 ) + s ( 2 D S D N ) D N + 2 D S D N \ S 2 δ 2 B N D S δ + B ˜ S 2 ( T t 0 ) 3 s ( 2 D S D N ) D N + 2 D S D N \ S 4 δ 3 + B N D S δ 2 .

Appendix C. Proofs of Superadditivity Characteristic Functions

Appendix C.1. Additional Statement

Proposition A1.
e 2 δ ( T t 0 ) + 4 e δ ( T t 0 ) + 2 δ ( T t 0 ) 3 > 0 .
Proof. 
Let x = e δ ( T t 0 ) , then we need to prove:
x 2 + 4 x + 2 δ ( T t 0 ) 3 > 0 .
We solve the quadratic equation:
x 2 + 4 x + 2 δ ( T t 0 ) 3 = 0 .
The roots of the equation are:
x 1 = 2 1 + 2 δ ( T t 0 ) , x 2 = 2 + 1 + 2 δ ( T t 0 ) .
The branches of the parabola y = x 2 + 4 x + 2 δ ( T t 0 ) 3 are directed downwards. This means that:
x 2 + 4 x + 2 δ ( T t 0 ) 3 > 0
when:
x 2 1 + 2 δ ( T t 0 ) , 2 + 1 + 2 δ ( T t 0 ) .
We change x to e δ ( T t 0 ) . Let us prove that:
e δ ( T t 0 ) 2 1 + 2 δ ( T t 0 ) , 2 + 1 + 2 δ ( T t 0 ) .
We make a replacement m = δ ( T t 0 ) > 0 . Therefore, we prove:
e m 2 1 + 2 m , 2 + 1 + 2 m .
First, let us show that:
2 + 1 + 2 m e m > 0 .
We have:
1 + 2 m 1 ,
e m 1 .
Hence:
2 + 1 + 2 m e m 2 .
This completes the proof (A9).
Secondly, let us show that:
e m 2 + 1 + 2 m > 0 .
We transform the expression:
e m 2 + 1 + 2 m = e m ( e m 1 + 2 m 2 e m + 1 ) .
We clearly have e m > 0 . To prove e m 1 + 2 m 2 e m + 1 > 0 , we need to differentiate ( e m 1 + 2 m 2 e m + 1 ) with respect to m:
d ( e m 1 + 2 m 2 e m + 1 ) d m = 2 e m ( m 1 + 2 m + 1 ) 1 + 2 m
Obviously, e m > 0 , 1 + 2 m > 0 for m > 0 . Let us show:
m 1 + 2 m + 1 > 0 .
Assume the converse. Then:
m 1 + 2 m + 1 0 .
Hence:
m + 1 1 + 2 m
( m + 1 ) 2 1 + 2 m
because m > 0 . Therefore:
m 2 0 ,
m = 0 .
This contradiction proves (A12). This means that in (A11):
d ( e m 1 + 2 m 2 e m + 1 ) d m > 0
That is, the function y = e m 1 + 2 m 2 e m + 1 is increasing for m > 0 and:
e m 1 + 2 m 2 e m + 1 > 0 .
This implies the inequality (A10). Finally, using (A9) and (A10), we get (A8). This yields
e δ ( T t 0 ) 2 1 + 2 δ ( T t 0 ) , 2 + 1 + 2 δ ( T t 0 ) .
and hence, e 2 δ ( T t 0 ) + 4 e δ ( T t 0 ) + 2 δ ( T t 0 ) 3 > 0 . □

Appendix C.2. Superadditivity of the α-Characteristic Function

We prove that the α -characteristic function is superadditive using (2).
V α ( S 1 S 2 , t 0 , x 0 ) V α ( S 1 , t 0 , x 0 ) V α ( S 2 , t 0 , x 0 ) = s 2 D S 1 2 + s 1 D S 2 2 + 2 D S 1 D S 2 s 1 + s 2 4 δ 3 e 2 δ ( T t 0 ) + s 2 D S 1 2 + s 1 D S 2 2 + 2 D S 1 D S 2 s 1 + s 2 δ 3 e δ ( T t 0 ) + s 2 D S 1 2 + s 1 D S 2 2 + 2 D S 1 D S 2 s 1 + s 2 2 δ 2 ( T t 0 ) 3 s 2 D S 1 2 + s 1 D S 2 2 + 2 D S 1 D S 2 s 1 + s 2 4 δ 3 = s 2 D S 1 2 + s 1 D S 2 2 + 2 D S 1 D S 2 s 1 + s 2 4 δ 3 e 2 δ ( T t 0 ) + 4 e δ ( T t 0 ) + 2 δ ( T t 0 ) 3 .
Clearly,
s 2 D S 1 2 + s 1 D S 2 2 + 2 D S 1 D S 2 s 1 + s 2 4 δ 3 > 0 .
According to Proposition A1:
e 2 δ ( T t 0 ) + 4 e δ ( T t 0 ) + 2 δ ( T t 0 ) 3 > 0 .
Hence, V α ( S 1 S 2 , t 0 , x 0 ) V α ( S 1 , t 0 , x 0 ) V α ( S 2 , t 0 , x 0 ) > 0 .

Appendix C.3. Superadditivity of the δ-Characteristic Function

We verify the superadditivity of the δ -characteristic function using the definition (2).
V δ ( S 1 S 2 , t 0 , x 0 ) V δ ( S 1 , t 0 , x 0 ) V δ ( S 2 , t 0 , x 0 ) = s 2 D S 1 2 + s 1 D S 2 2 + 2 D S 1 D S 2 s 1 + s 2 2 4 δ 3 e 2 δ ( T t 0 ) + s 2 D S 1 2 + s 1 D S 2 2 + 2 D S 1 D S 2 s 1 + s 2 2 δ 3 e δ ( T t 0 ) + s 2 D S 1 2 + s 1 D S 2 2 + 2 D S 1 D S 2 s 1 + s 2 2 2 δ 2 ( T t 0 ) 3 s 2 D S 1 2 + s 1 D S 2 2 + 2 D S 1 D S 2 s 1 + s 2 2 4 δ 3 = s 2 D S 1 2 + s 1 D S 2 2 + 2 D S 1 D S 2 s 1 + s 2 2 4 δ 3 e 2 δ ( T t 0 ) + 4 e δ ( T t 0 ) + 2 δ ( T t 0 ) 3 .
Using s 1 = | S 1 | 1 , s 2 = | S 2 | 1 , we get s 1 + s 2 2 0 . It is obvious that:
s 2 D S 1 2 + s 1 D S 2 2 + 2 D S 1 D S 2 s 1 + s 2 2 4 δ 3 > 0 .
According to Proposition A1:
e 2 δ ( T t 0 ) + 4 e δ ( T t 0 ) + 2 δ ( T t 0 ) 3 > 0 .
Therefore, V δ ( S 1 S 2 , t 0 , x 0 ) V δ ( S 1 , t 0 , x 0 ) V δ ( S 2 , t 0 , x 0 ) > 0 .

Appendix C.4. Superadditivity of the ζ-Characteristic Function

Let us show that the ζ -characteristic function is superadditive using (2).
V ζ ( S 1 S 2 , t 0 , x 0 ) V ζ ( S 1 , t 0 , x 0 ) V ζ ( S 2 , t 0 , x 0 ) = D N ( s 2 D S 1 + s 1 D S 2 ) 2 δ 3 e 2 δ ( T t 0 ) + 2 D N ( s 2 D S 1 + s 1 D S 2 ) δ 3 e δ ( T t 0 ) + D N ( s 2 D S 1 + s 1 D S 2 ) δ 2 3 D N ( s 2 D S 1 + s 1 D S 2 ) 2 δ 3 ( T t 0 ) = D N ( s 2 D S 1 + s 1 D S 2 ) 2 δ 3 e 2 δ ( T t 0 ) + 4 e δ ( T t 0 ) + 2 δ ( T t 0 ) 3 .
Trivially,
D N ( s 2 D S 1 + s 1 D S 2 ) 2 δ 3 > 0 .
According to Proposition A1:
e 2 δ ( T t 0 ) + 4 e δ ( T t 0 ) + 2 δ ( T t 0 ) 3 > 0 .
It follows that V ζ ( S 1 S 2 , t 0 , x 0 ) V ζ ( S 1 , t 0 , x 0 ) V ζ ( S 2 , t 0 , x 0 ) > 0 .

Appendix C.5. Superadditivity of the η-Characteristic Function

Let us check that the η -characteristic function is superadditive using (2).
V η ( S 1 S 2 , t 0 , x 0 ) V η ( S 1 , t 0 , x 0 ) V η ( S 2 , t 0 , x 0 ) = D S 1 ( s 2 D N D S 2 ) + D S 2 ( s 1 D N D S 1 ) 2 δ 3 e 2 δ ( T t 0 ) + 2 D S 1 ( s 2 D N D S 2 ) + 2 D S 2 ( s 1 D N D S 1 ) δ 3 e δ ( T t 0 ) + D S 1 ( s 2 D N D S 2 ) + D S 2 ( s 1 D N D S 1 ) δ 2 ( T t 0 ) 3 D S 1 ( s 2 D N D S 2 ) + D S 2 ( s 1 D N D S 1 ) 2 δ 3 = D S 1 ( s 2 D N D S 2 ) + D S 2 ( s 1 D N D S 1 ) 2 δ 3 e 2 δ ( T t 0 ) + 4 e δ ( T t 0 ) + 2 δ ( T t 0 ) 3 .
We obtain:
D S 1 ( s 2 D N D S 2 ) + D S 2 ( s 1 D N D S 1 ) 2 δ 3 D S 1 ( D N D S 2 ) + D S 2 ( D N D S 1 ) 2 δ 3 = D S 1 D N \ S 2 + D S 2 D N \ S 1 2 δ 3 > 0 .
According to Proposition A1:
e 2 δ ( T t 0 ) + 4 e δ ( T t 0 ) + 2 δ ( T t 0 ) 3 > 0 .
Therefore, V η ( S 1 S 2 , t 0 , x 0 ) V η ( S 1 , t 0 , x 0 ) V η ( S 2 , t 0 , x 0 ) > 0 .

References

  1. Petrosjan, L.; Zakharov, V. Mathematical Models in Ecology; Izdatelstvo Sankt-Peterburgskogo Universiteta: St. Petersburg, Russia, 1997. [Google Scholar]
  2. Mazalov, V.; Rettieva, A. Nash equilibrium in environmental problems. Math. Model. 2006, 18, 73–90. [Google Scholar]
  3. Rettieva, A. Cooperative incentive condition in bioresource sharing problem. Upravleniye Bolshimi Sistemami 2009, 26, 366–384. [Google Scholar]
  4. Breton, M.; Zaccour, G.; Zahaf, A. A differential game of joint implementation of environmental projects. Automatica 2005, 41, 1737–1749. [Google Scholar] [CrossRef]
  5. Dockner, E.; Van Long, N. International pollution control: Cooperative versus noncooperative strategies. J. Environ. Econ. Manag. 1993, 25, 13–29. [Google Scholar] [CrossRef] [Green Version]
  6. Haurie, A.; Zaccour, G. Differential game models of global environmental management. Ann. Int. Soc. Dyn. Games 1995, 2, 3–23. [Google Scholar]
  7. Petrosjan, L.; Zaccour, G. Time-consistent Shapley value allocation of pollution cost reduction. J. Econ. Dyn. Control 2003, 27, 381–398. [Google Scholar] [CrossRef]
  8. Greenberg, J. Coalition structures. In Handbook of Game Theory with Economic Applications; North Holland: Amsterdam, The Netherlands, 1994; Volume 2, pp. 1306–1337. [Google Scholar]
  9. Hajduková, J. Coalition formation games: A survey. Int. Game Theory Rev. 2006, 8, 613–641. [Google Scholar] [CrossRef]
  10. Shapley, L. A value for n-person games. In Contributions to the Theory of Games II; Princeton University Press: Princeton, NJ, USA, 1953; pp. 307–317. [Google Scholar]
  11. Winter, E.; Aumann, R. The Shapley value. In Handbook of Game Theory with Economic Applications; North Holland: Amsterdam, The Netherlands, 2002; Volume 3, pp. 1521–2351. [Google Scholar]
  12. Alvin, E. Introduction to the Shapley value. In The Shapley Value: Essays in Honor of Lloyd S. Shapley; Cambridge University Press: Cambridge, UK, 1988. [Google Scholar]
  13. Basar, T.; Olsder, G. Dynamic Noncooperative Game Theory, 2nd ed.; Society for Industrial and Applied Mathematics (SIAM): Philadelphia, PA, USA, 1999. [Google Scholar]
  14. Hull, D. Optimal Control Theory for Applications; Springer: New York, NY, USA, 2003. [Google Scholar]
  15. Moulin, H. Equal or proportional division of a surplus, and other methods. Int. J. Game Theory 1987, 16, 161–186. [Google Scholar] [CrossRef]
  16. Gromova, E.; Tur, A. On the optimal control of pollution emissions for the largest enterprises of the Irkutsk region of the Russian Federation. Matematicheskaya Teoriya Igr i Ee Prilozheniya 2018, 2, 150–152. [Google Scholar]
  17. Petrosjan, L.; Danilov, N. Cooperative Differential Games and Their Applications; Tomsk University Press: Tomsk, Russia, 1982. [Google Scholar]
  18. Krasovskii, N.; Subbotin, A. Game-Theoretical Control Problems; Springer: New York, NY, USA, 1989. [Google Scholar]
  19. Gromova, E.; Petrosyan, L. On an approach to constructing a characteristic function in cooperative differential games. Autom. Remote Control 2017, 78, 1680–1692. [Google Scholar] [CrossRef]
  20. von Neumann, J.; Morgenstern, O. Theory of Games and Economic Behavior; Princeton University Press: Princeton, NJ, USA, 1953. [Google Scholar]
  21. Reddy, P.; Shevkoplyas, E.; Zaccour, G. Time-consistent Shapley value for games played over event trees. Automatica 2013, 49, 1521–1527. [Google Scholar] [CrossRef]
  22. Gromova, E.; Marova, E. Coalition and anti-coalition interaction in cooperative differential games. IFAC PapersOnLine 2018, 51, 479–483. [Google Scholar] [CrossRef]
  23. Gromova, E.; Marova, E.; Gromov, D. A substitute for the classical Neumann-Morgenstern characteristic function in cooperative differential games. J. Dyn. Games 2020, 7, 105–122. [Google Scholar] [CrossRef] [Green Version]
  24. Petrosjan, L.; Danilov, N. Stability of solutions in non-zero sum differential games with transferable payoffs. Vestnik Leningradskogo Universiteta. Ser. Matematika Mekhanika Astronomiya 1979, 1, 52–59. [Google Scholar]
  25. Dockner, E.; Jorgensen, S.; van Long, N.; Sorger, G. Differential Games in Economics and Management Science; Cambridge University Press: Cambridge, UK, 2000. [Google Scholar]
  26. Kostyunin, S.; Palestini, A.; Shevkoplyas, E. On a nonrenewable resource extraction game played by asymmetric firms. SIAM J. Optim. Theory Appl. 2014, 163, 660–673. [Google Scholar] [CrossRef]
  27. Mazalov, V.; Rettieva, A. Fish wars with many players. Int. Game Theory Rev. 2010, 12, 385–405. [Google Scholar] [CrossRef]
  28. Gromova, E.; Malahova, A.; Marova, E. On the superadditivity of a characteristic function in cooperative differential games with negative externalities. In Proceedings of the Constructive Nonsmooth Analysis and Related Topics, St. Petersburg, Russia, 22–27 May 2017; pp. 1–4. [Google Scholar]
  29. Petrosjan, L.; Gromova, E. Two-level cooperation in coalitional differential games. Trudy Instituta Matematiki i Mekhaniki UrO RAN 2014, 20, 193–203. [Google Scholar]
  30. Corless, R.M.; Gonnet, G.H.; Hare, D.E.G.; Knuth, D.E. On the Lambert W function. Adv. Comput. Math. 1996, 5, 329–359. [Google Scholar] [CrossRef]
  31. Gromova, E.; Marova, E. On the characteristic function construction technique in differential games with prescribed and random duration. Contrib. Game Theory Manag. 2018, 11, 53–65. [Google Scholar]
  32. Barsuk, P.; Gromova, E. Properties of one cooperative solution in a differential game of pollution control. In Proceedings of the IV Stability and Control Processes Conference 2020, Saint Petersburg, Russia, 20–24 April 2020. [Google Scholar]
  33. Gromova, E.; Tur, A.; Barsuk, P. A Pollution Control Problem for the Aluminum Production in Eastern Siberia: Differential Game Approach. 2020. Available online: https://arxiv.org/abs/2005.08260 (accessed on 15 April 2020).
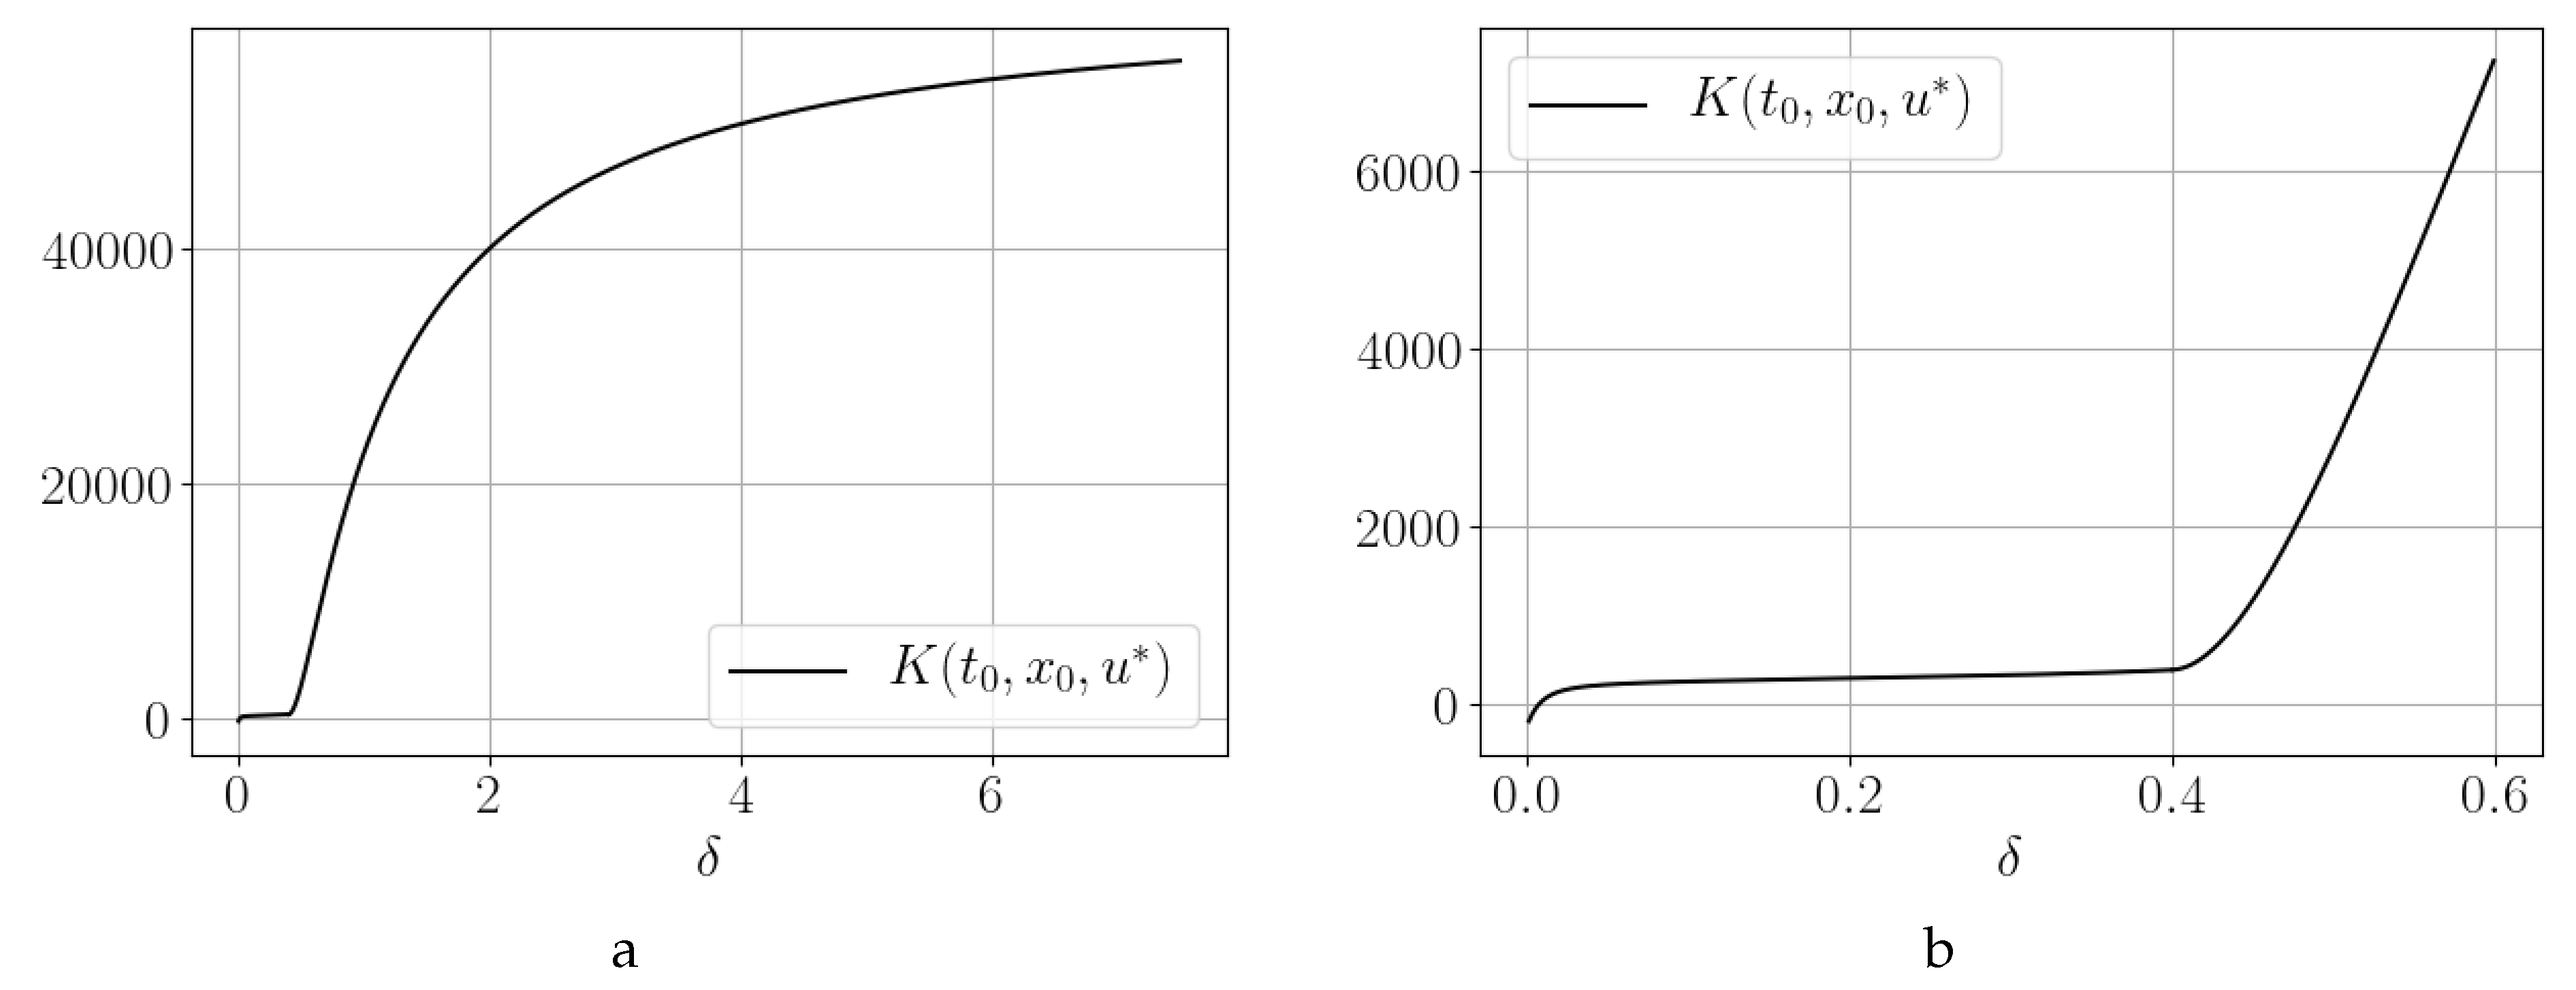
Figure 1. d = 10 , b = 25 , t 0 = 0 , T = 200 , x 0 = 0.25 . (a) δ [ 0 , 8 ] and (b) δ [ 0 , 0.6 ] .
Mathematics 08 00961 g001
Figure 2. d = 10 , b = 25 , t 0 = 0 , T = 200 , x 0 = 10 . (a) δ [ 0 , 20 ] and (b) δ [ 0 , 1 ] .
Mathematics 08 00961 g002
Figure 3. d = 100 , b = 25 , t 0 = 0 , T = 3 , x 0 = 0.1 . (a) δ [ 0 , 60 ] and (b) δ [ 0 , 5 ] .
Mathematics 08 00961 g003
Figure 4. d = 100 , b = 25 , t 0 = 0 , T = 3 , x 0 = 10 . (a) δ [ 0 , 20 ] and (b) δ [ 2 , 6 ] .
Mathematics 08 00961 g004
Figure 5. d = 1000 , b = 1 , t 0 = 8 , T = 100 , x 0 = 10 . (a) δ [ 0 , 2000 ] and (b) δ [ 0 , 90 ] .
Mathematics 08 00961 g005
Figure 6. (a) V ( { 1 } ) , t 0 [ 0 , 3.5 ] , (b) V ( { 1 } ) , t 0 [ 0 , 2 × 10 5 ] , (c) V ( { 2 } ) , t 0 [ 0 , 3.5 ] , (d) V ( { 2 } ) , t 0 [ 0 , 2 × 10 5 ] , (e) V ( { 3 } ) , t 0 [ 0 , 3.5 ] , and (f) V ( { 3 } ) , t 0 [ 0 , 2 × 10 5 ] .
Mathematics 08 00961 g006
Figure 7. (a) V ( { 1 } ) , t 0 [ 0 , 3.5 ] , (b) V ( { 1 } ) , t 0 [ 0 , 2 × 10 8 ] , (c) V ( { 2 } ) , t 0 [ 0 , 3.5 ] , (d) V ( { 2 } ) , t 0 [ 0 , 2 × 10 8 ] , (e) V ( { 3 } ) , t 0 [ 0 , 3.5 ] , and (f) V ( { 3 } ) , t 0 [ 0 , 2 × 10 8 ] .
Mathematics 08 00961 g007
Figure 8. (a) V ( { 1 } ) , δ [ 0.1 , 20 ] , (b) V ( { 1 } ) , δ [ 0.0001 , 0.00018 ] , (c) V ( { 2 } ) , δ [ 0.1 , 20 ] , (d) V ( { 2 } ) , δ [ 0.0001 , 0.00018 ] , (e) V ( { 3 } ) , δ [ 0.1 , 20 ] , and (f) V ( { 3 } ) , δ [ 0.0001 , 0.00018 ] .
Mathematics 08 00961 g008
Figure 9. δ = 20 (a) V η ( { 1 } ) , (b) V η ( { 3 } ) , (c) V η ( { 2 } ) , t 0 [ 0 , 3.5 ] , and (d) V η ( { 2 } ) , t 0 [ 0 , 0.01 ] .
Mathematics 08 00961 g009
Table 1. Coefficient values.
Enterprise b i d i
OJSC «RUSAL Bratsk»28,838.011254.97
OJSC «ILIM Group»1,530,463102.27
Units of OJSC «Irkutskenergo»5228.436.65