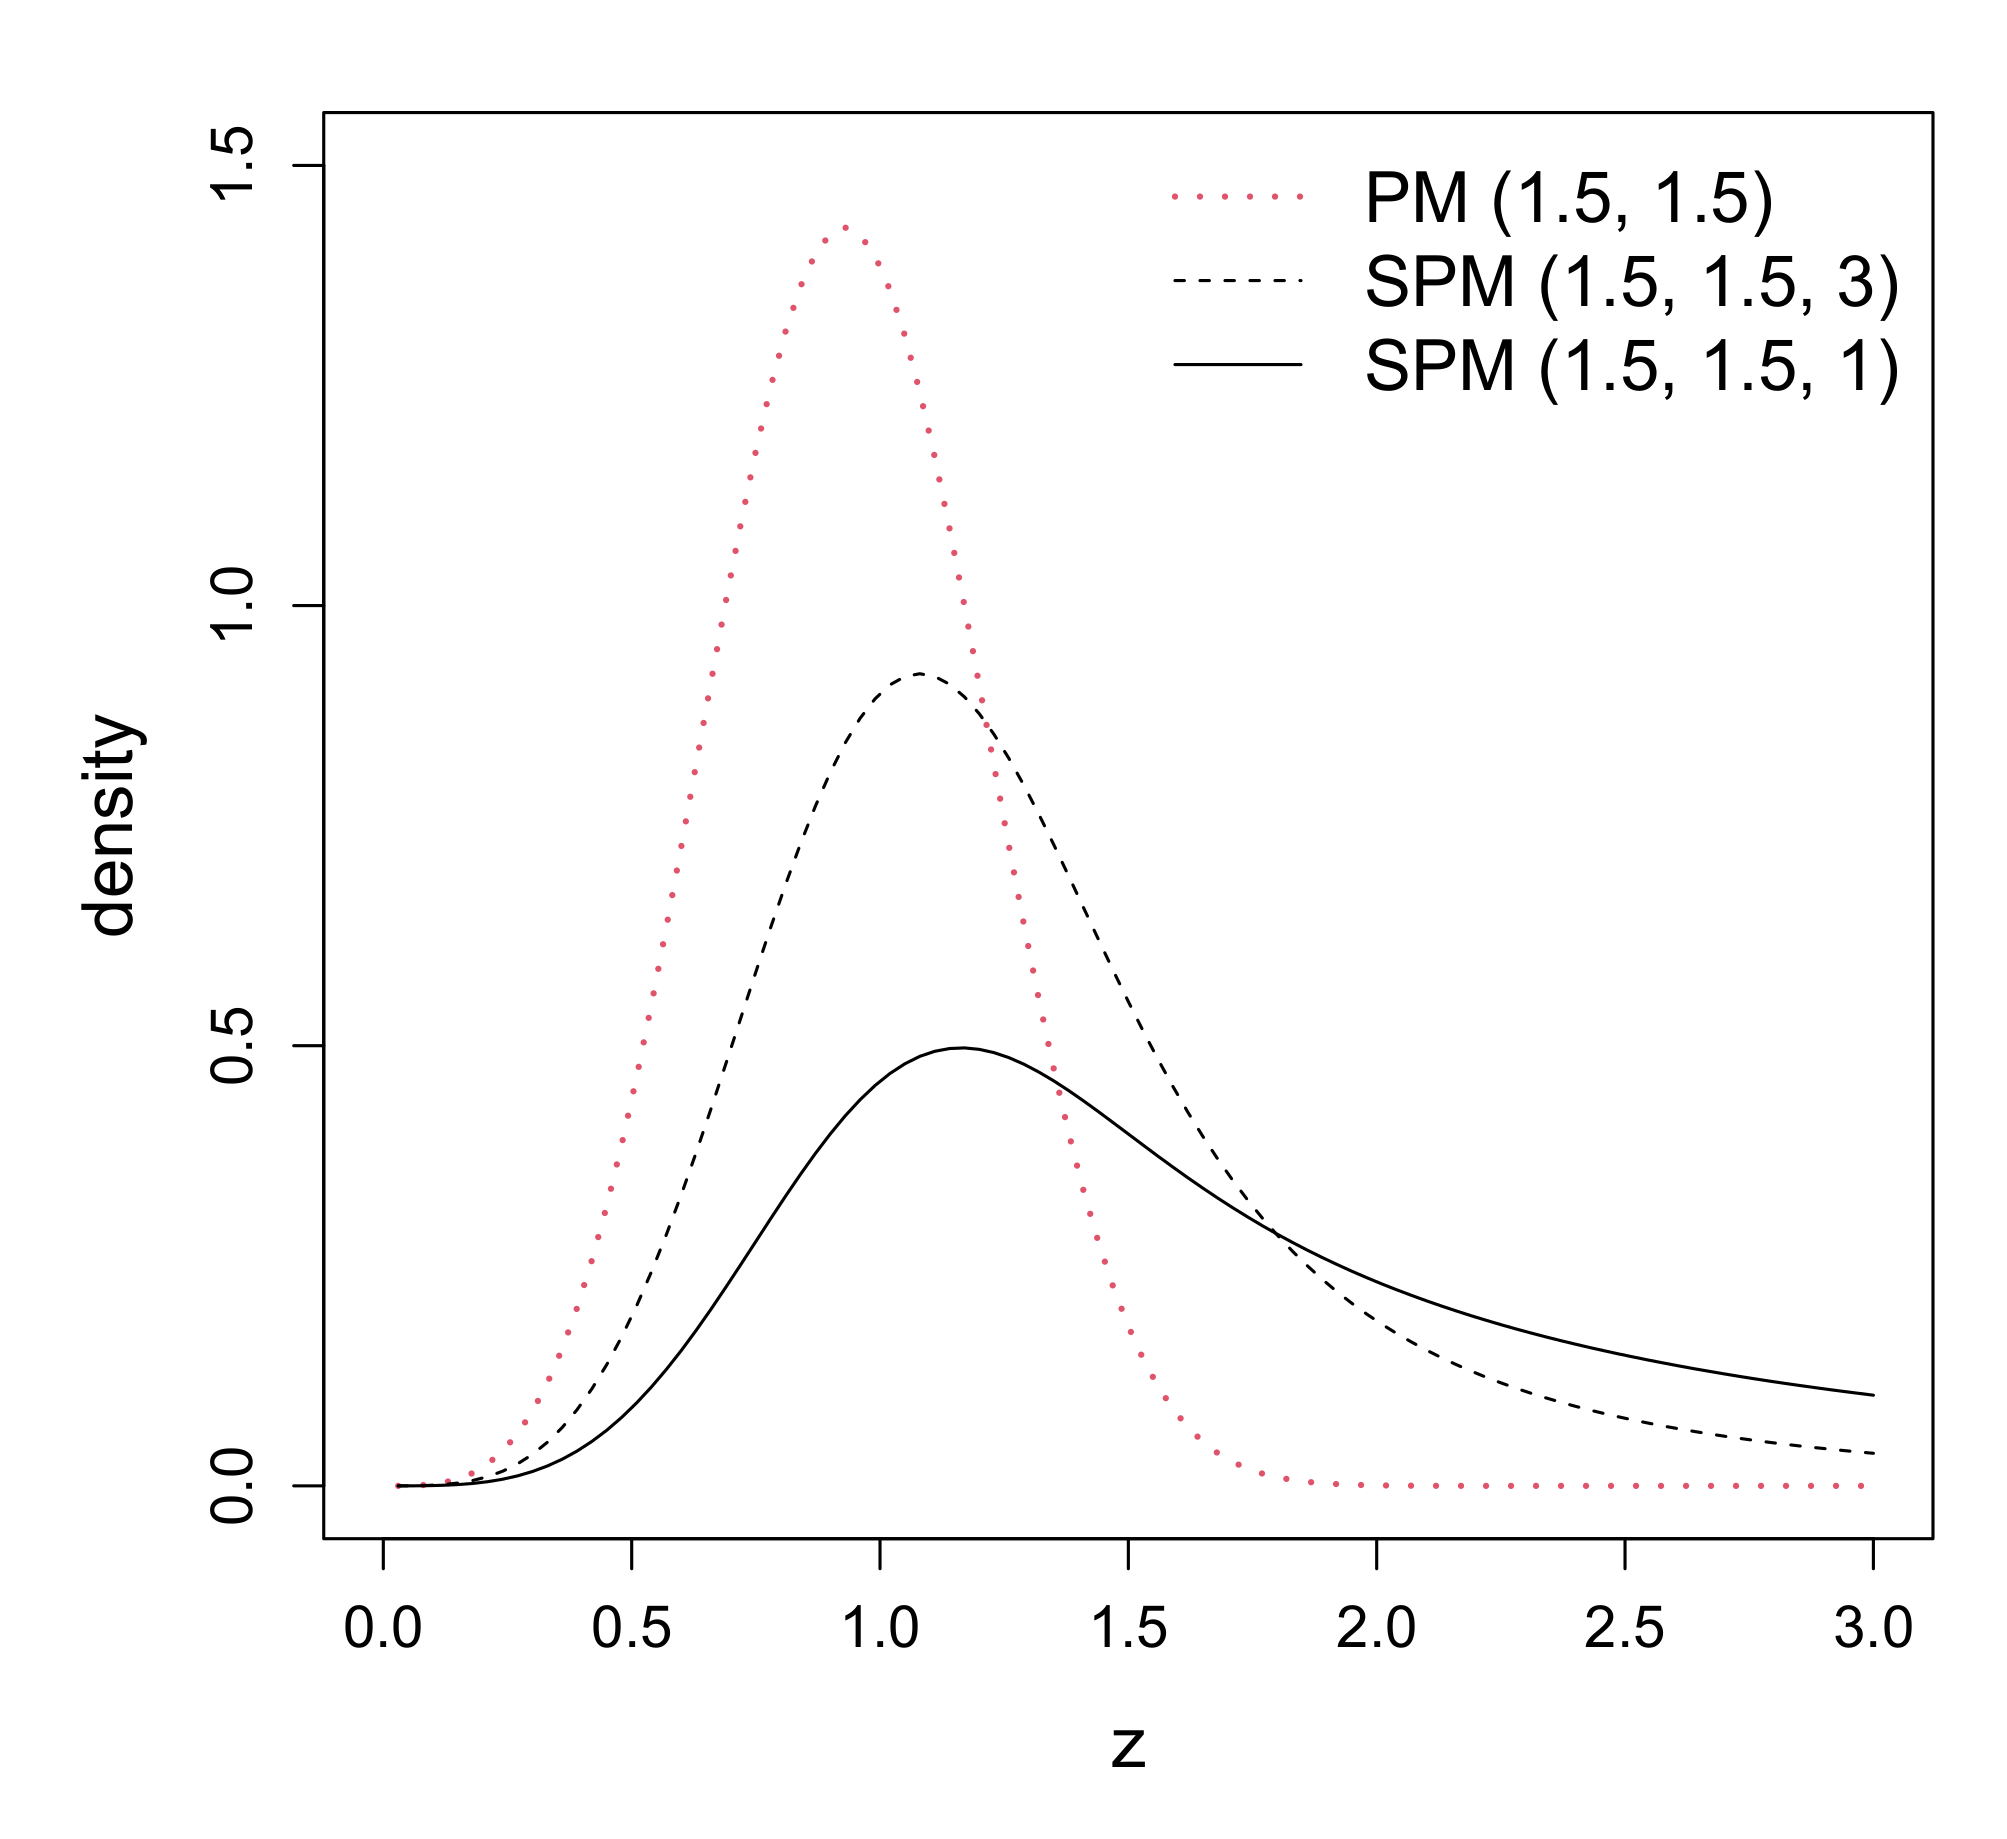
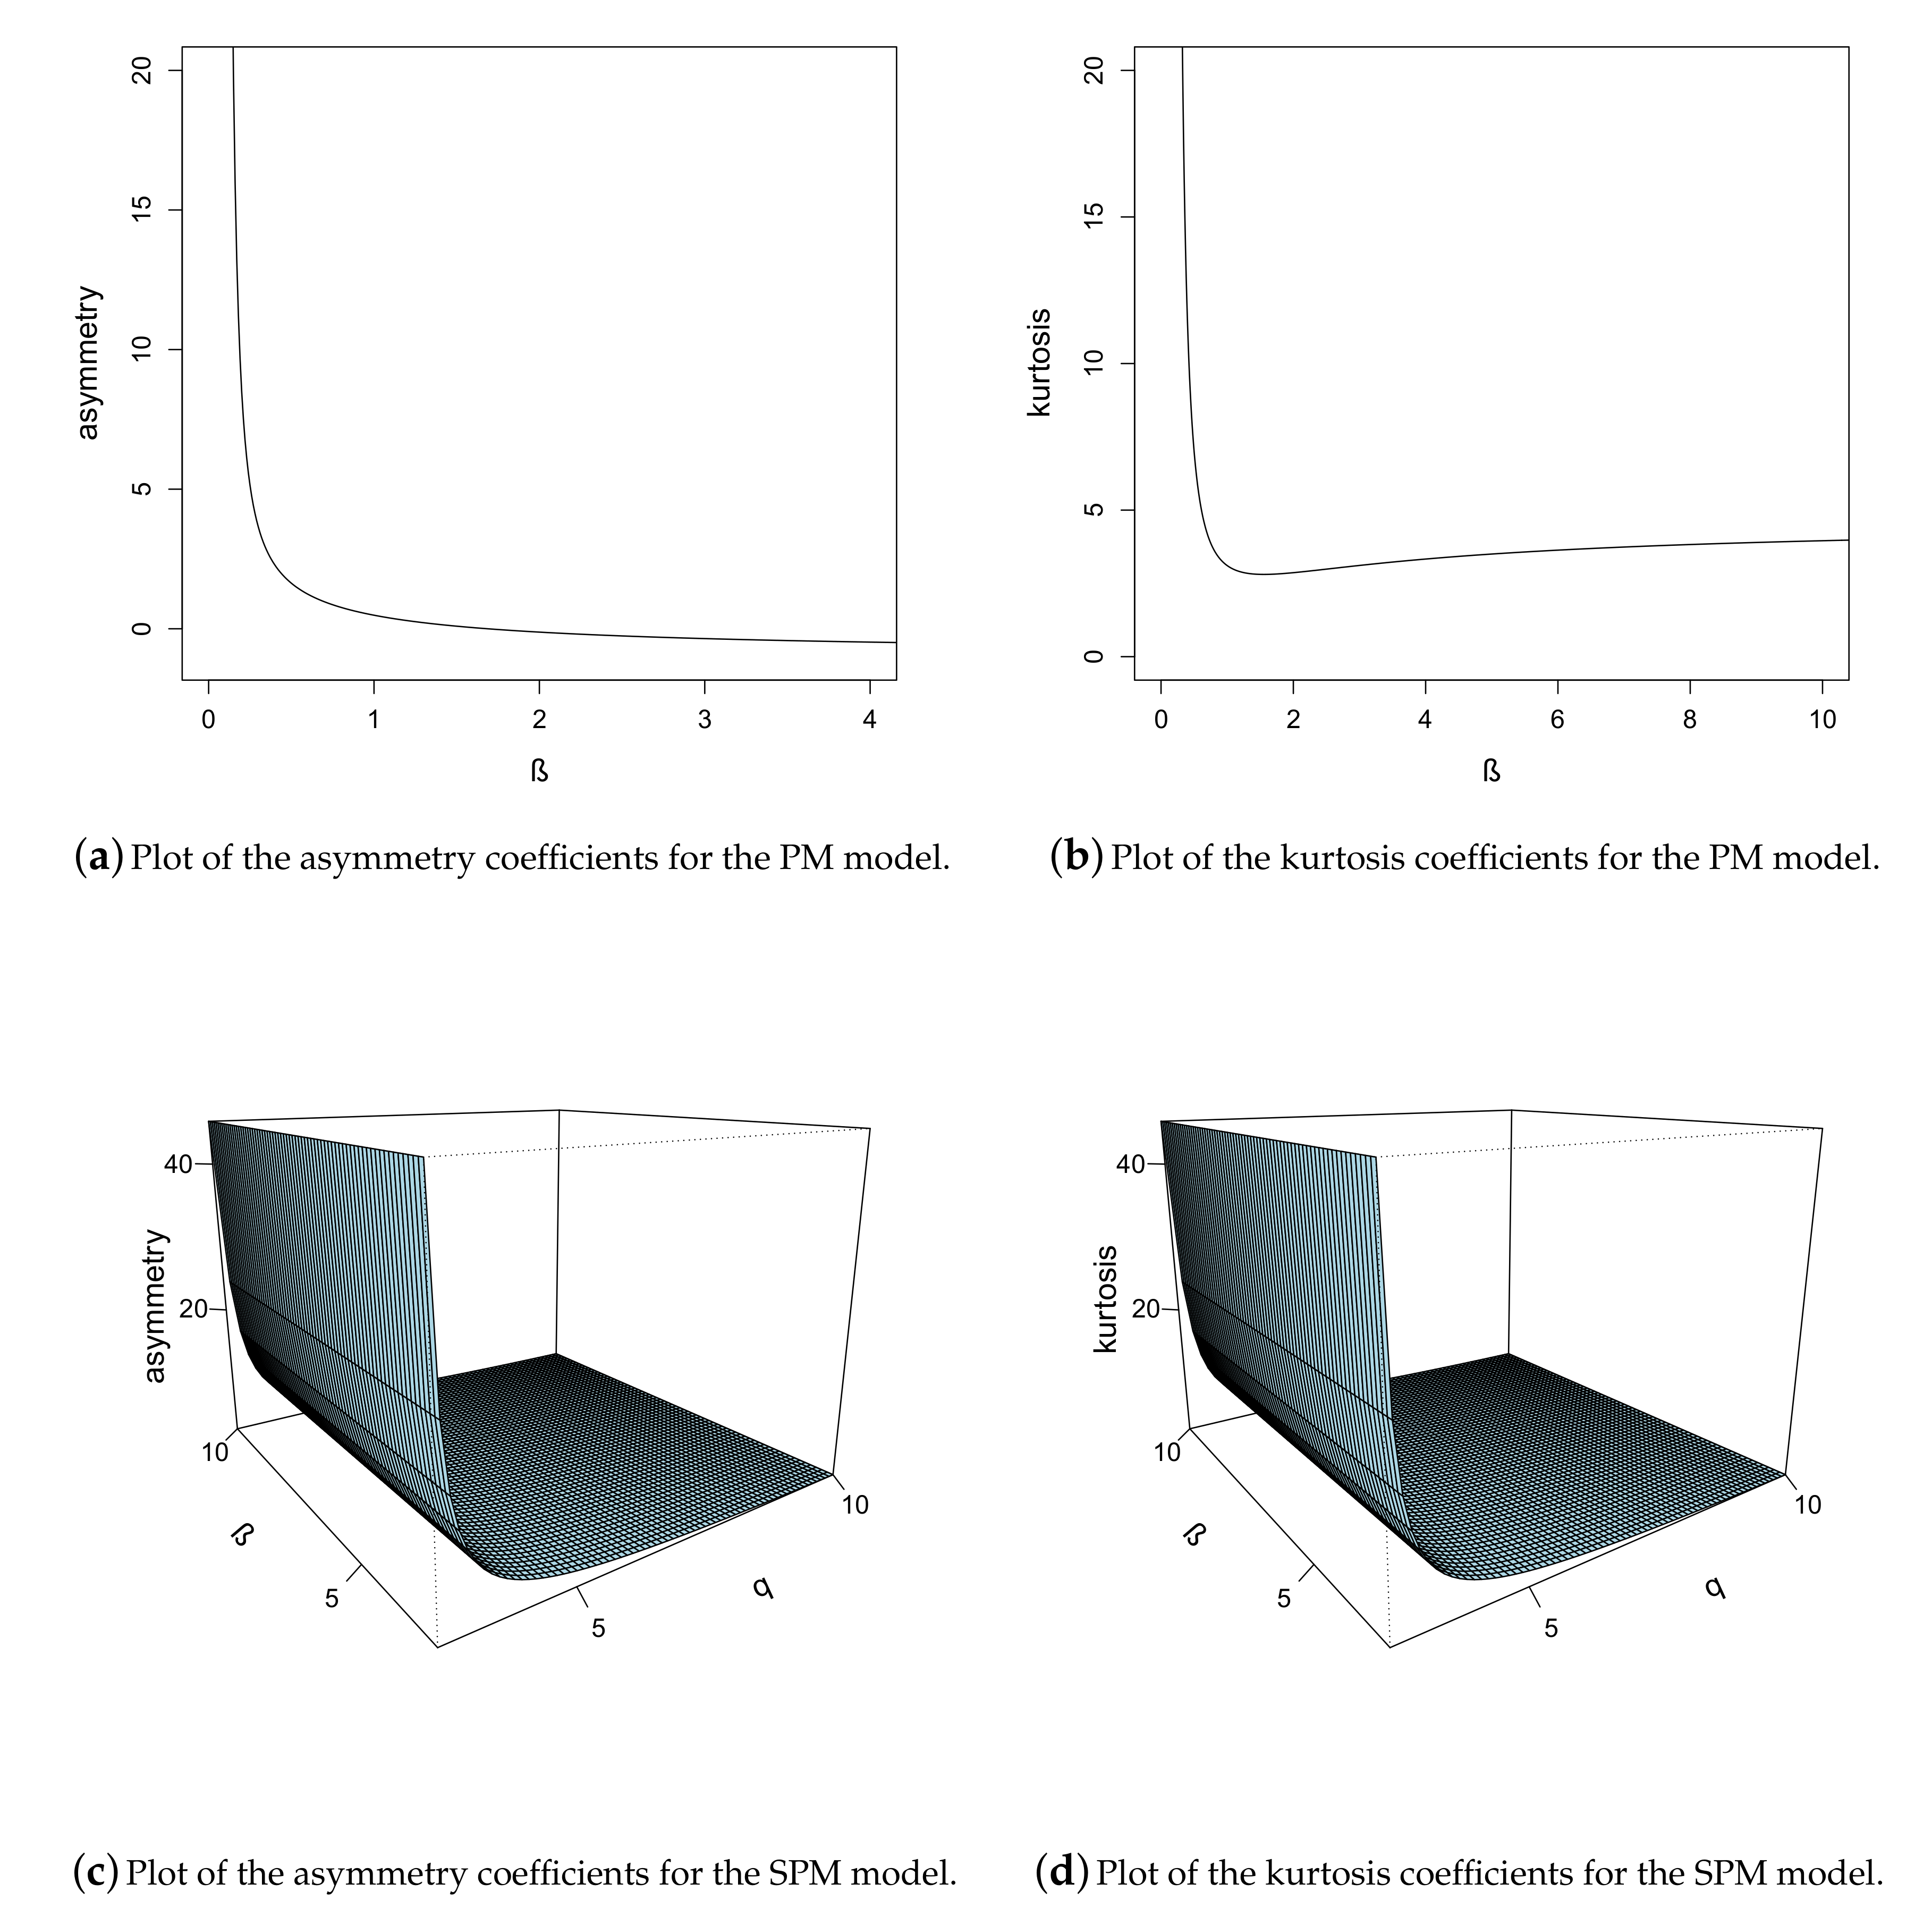
A Power Maxwell Distribution with Heavy Tails and Applications
Abstract
:1. Introduction
2. Probability Density Function
2.1. Stochastic Representation
2.2. Density Function
2.3. Distribution Relationships
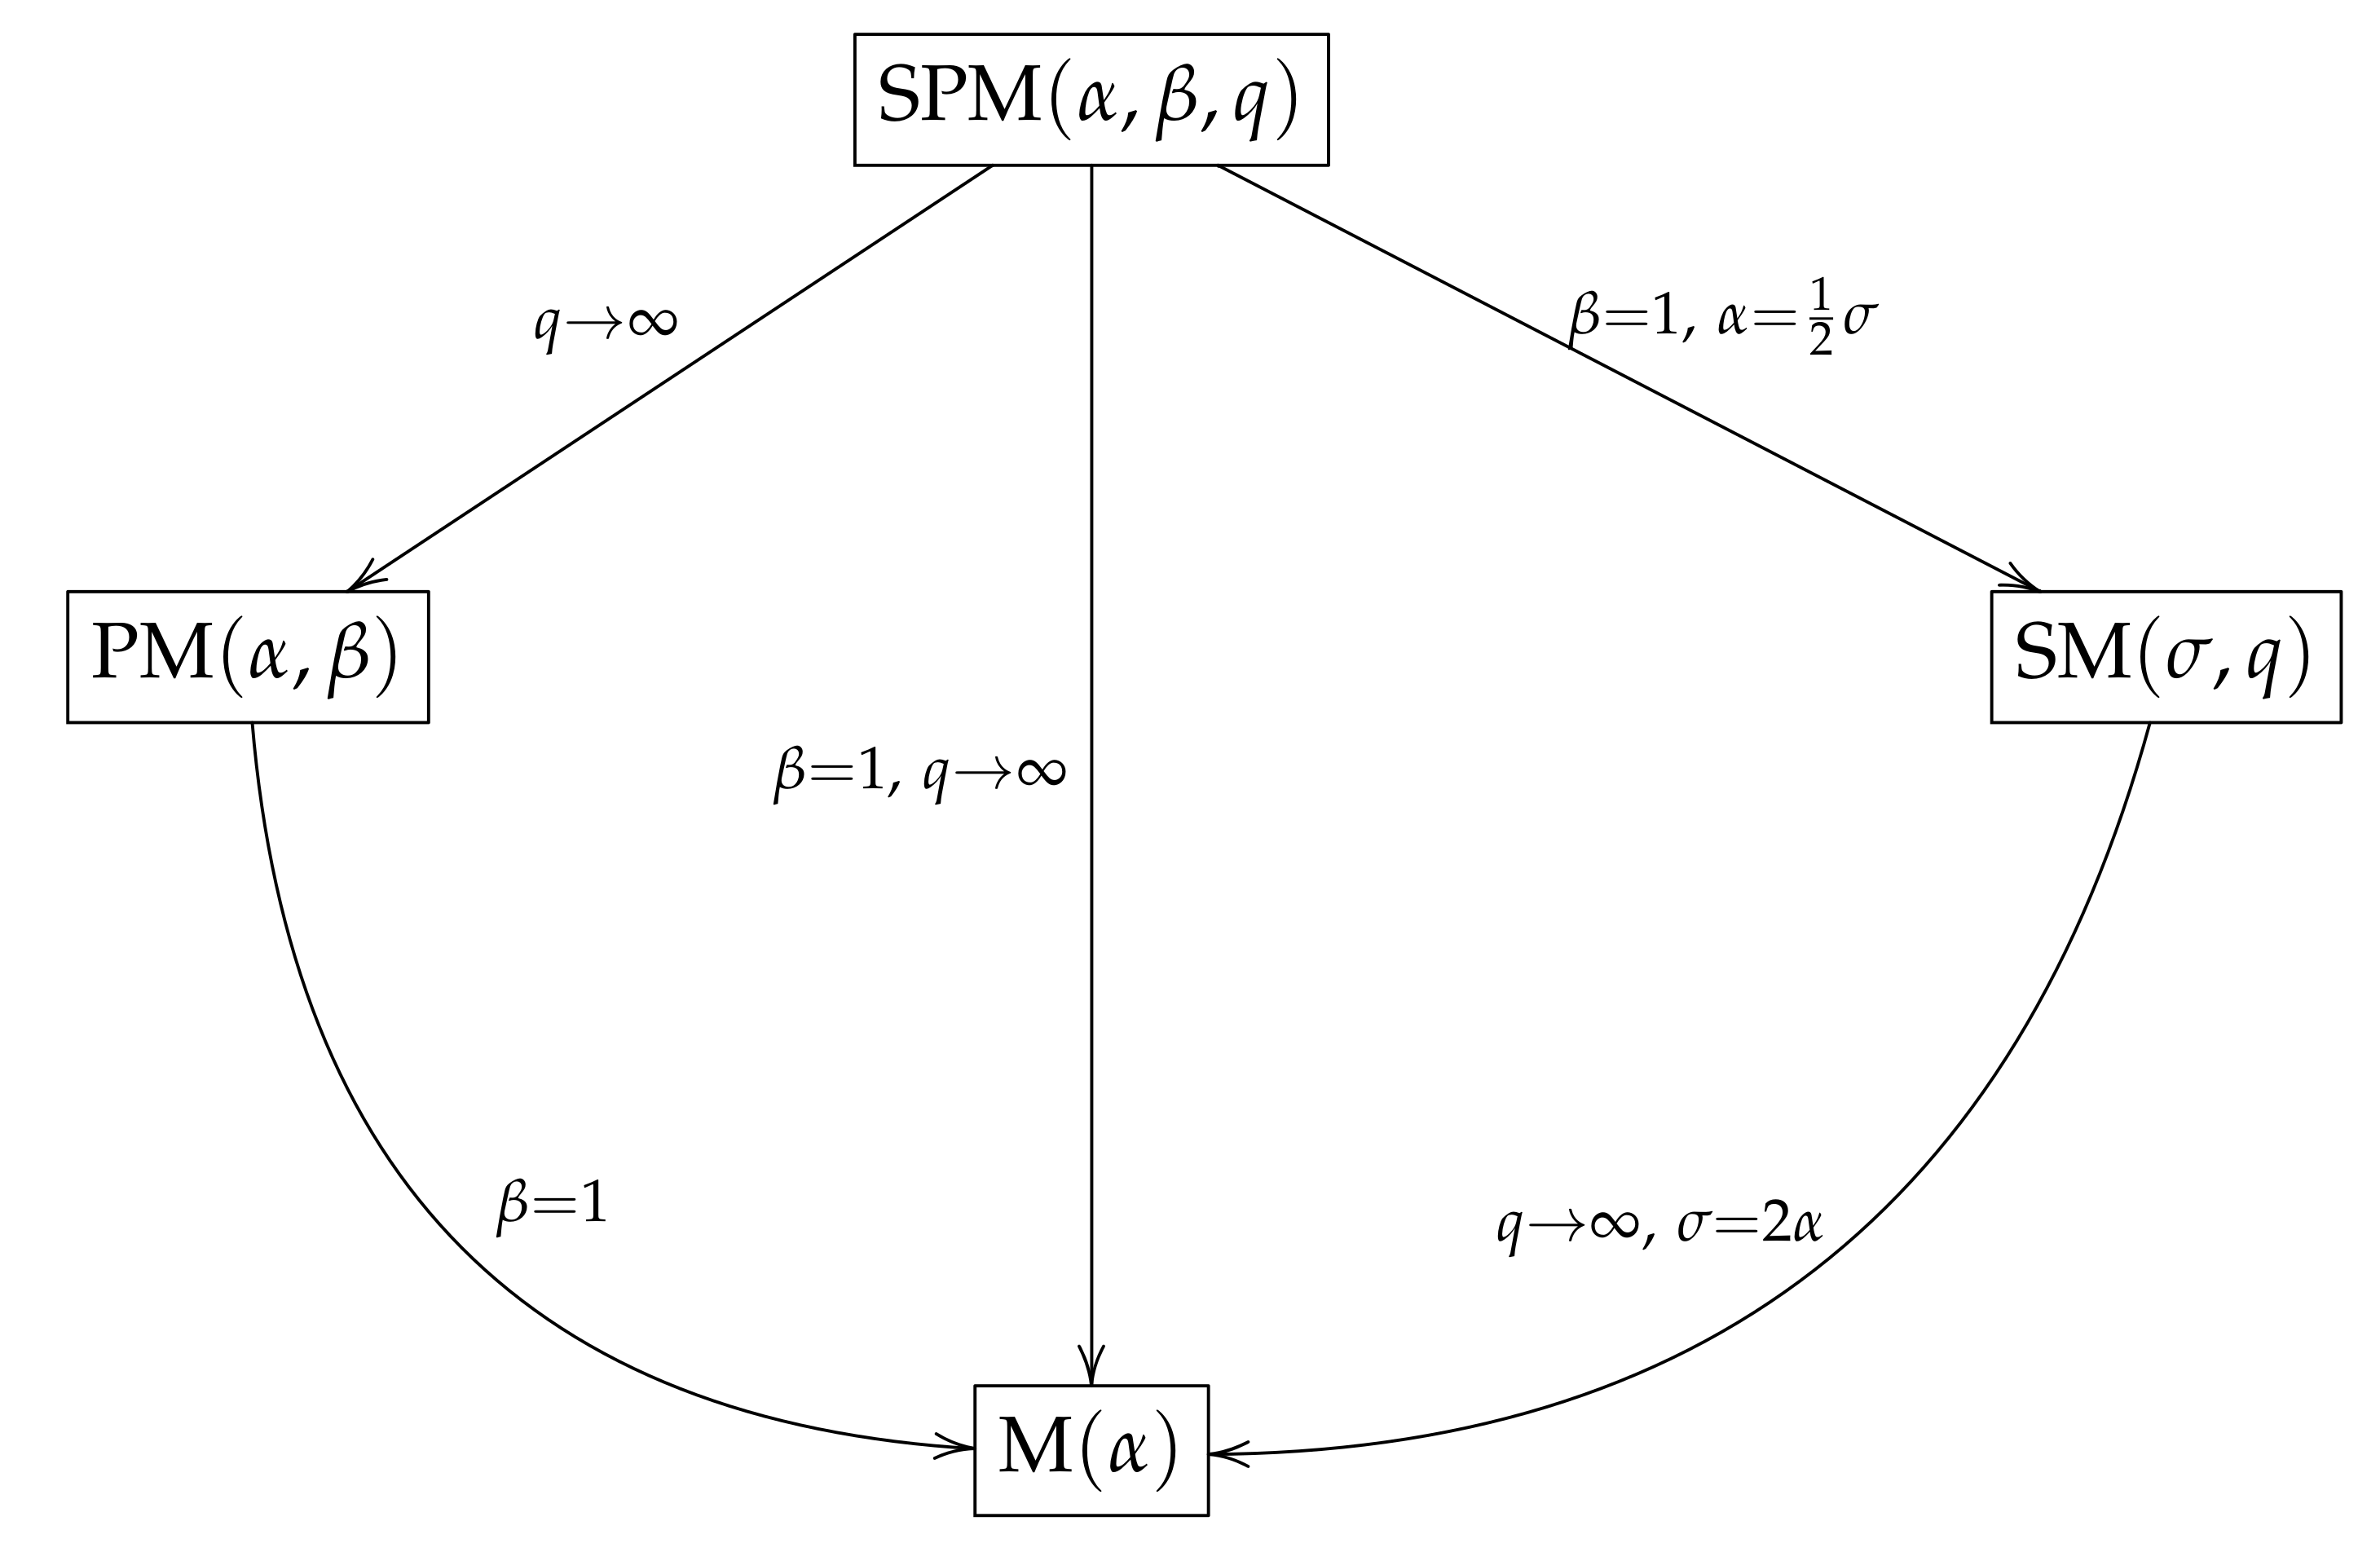
- According to a property that we will discuss later in Section 3, if then , where ).
- If then with , where Y has slash Maxwell (SM) distribution (Iriarte et al. [8]).
- If and , then , where M has Maxwell distribution.
2.4. Moments
3. Properties
4. Inference
4.1. Moments Estimation
4.2. ML Estimation
4.3. EM Algorithm
5. Simulation
- Generate (chi squared with 3 degrees of freedom), .
- Compute , .
- Generate , .
- Compute , ,
5.1. Parameter Recovery
5.2. Criteria Comparison
6. Applications
6.1. Application 1
6.2. Application 2
7. Conclusions
Author Contributions
Funding
Conflicts of Interest
Appendix A. Definitions of Some Distributions
References
- Johnson, N.; Kotz, S.; Balakrishnan, N. Continuous Univariate Distributions, 2nd ed.; Wiley-Interscience: New York, NY, USA, 1994; Volume 1. [Google Scholar]
- Rogers, W.; Tukey, J. Understanding some long-tailed symmetrical distributions. Stat. Neerl. 1972, 26, 211–226. [Google Scholar] [CrossRef]
- Mosteller, F.; Tukey, J. Data Analysis and Regression; Addison-Wesley: Boston, MA, USA, 1977. [Google Scholar]
- Kafadar, K. A biweight approach to the one-sample problem. J. Am. Stat. Assoc. 1982, 77, 416–424. [Google Scholar] [CrossRef]
- Wang, J.; Genton, M. The multivariate skew-slash distribution. J. Stat. Plan. Inference 2006, 136, 209–220. [Google Scholar] [CrossRef]
- Gómez, H.; Quintana, F.; Torres, F. A new family of slash-distributions with elliptical contours. Stat. Probab. Lett. 2007, 77, 717–725. [Google Scholar] [CrossRef]
- Gómez, H.; Olivares-Pacheco, J.; Bolfarine, H. An extension of the generalized birnbaun-saunders distribution. Stat. Probab. Lett. 2009, 79, 331–338. [Google Scholar] [CrossRef]
- Iriarte, Y.; Vilca, F.; Varela, H.; Gómez, H. Slashed generalized rayleigh distribution. Commun. Stat. Theory Methods 2017, 38, 4686–4699. [Google Scholar] [CrossRef]
- Gómez, Y.; Bolfarine, H.; Gómez, H. Gumbel distribution with heavy tails and applications to environmental data. Math. Comput. Simul. 2019, 157, 115–129. [Google Scholar] [CrossRef]
- Olmos, N.; Venegas, O.; Gómez, Y.; Iriarte, Y. An asymmetric distribution with heavy tails and its expectation–maximization (EM) algorithm implementation. Symmetry 2019, 11, 1150. [Google Scholar] [CrossRef] [Green Version]
- Olmos, N.; Venegas, O.; Gómez, Y.; Iriarte, Y. Confluent hypergeometric slashed-Rayleigh distribution: Properties, estimation and applications. J. Comput. Appl. Math. 2020, 368, 112548. [Google Scholar] [CrossRef]
- Maxwell, J. Illustrations of the dynamical theory of gases. Part I. On the motions and collisions of perfectly elastic spheres. Philos. Mag. 1860, 19, 19–32. [Google Scholar] [CrossRef]
- Boltzmann, L. Über das Wärmegleichgewicht zwischen mehratomigen Gasmolekülen. Wiener Ber. 1871, 63, 397–418. [Google Scholar]
- Boltzmann, L. Einige allgemeine Sätze über Wärmegleichgewicht. Wiener Ber. 1871, 63, 679–711. [Google Scholar]
- Boltzmann, L. Analytischer Beweis des zweiten Haubtsatzes der mechanischen Wärmetheorie aus den Sätzen über das Gleichgewicht der lebendigen Kraft. Wiener Ber. 1871, 63, 712–732. [Google Scholar]
- Dunbar, R.C. Deriving the Maxwell Distribution. J. Chem. Educ. 1982, 59, 22–23. [Google Scholar] [CrossRef]
- Coraddu, M.; Kaniadakis, G.; Lavagno, A.; Lissia, M.; Mezzorani, G.; Quarati, P. Thermal distributions in stellar plasmas, nuclear reactions and solar neutrinos. Braz. J. Phys. 1999, 29, 153–168. [Google Scholar] [CrossRef]
- Singh, A.; Bakouch, H.; Kumar, S.; Singh, U. Power maxwell distribution: Statistical properties, sstimation and application. arXiv 2018, arXiv:1807.01200v1. [Google Scholar]
- Lehmann, E.L. Elements of Large-Sample Theory; Springer: New York, NY, USA, 1999. [Google Scholar]
- Dempster, A.; Laird, N.; Rubin, D. Maximum likelihood from incomplete data via the EM algorithm. J. R. Stat. Soc. B 1977, 39, 1–38. [Google Scholar]
- Meng, X.; Rubin, D. Maximum likelihood estimation via the ECM algorithm: A general framework. Biometrika 1993, 80, 267–278. [Google Scholar] [CrossRef]
- Akaike, H. A new look at the statistical model identification. IEEE Trans. Autom. Control 1974, 19, 716–723. [Google Scholar] [CrossRef]
- Schwarz, G. Estimating the dimension of a model. Ann. Stat. 1978, 6, 461–464. [Google Scholar] [CrossRef]
- Anderson, T.; Darling, D. Asymptotic theory of certain “goodness of fit” criteria based on stochastic processes. Ann. Math. Stat. 1952, 23, 193–212. [Google Scholar] [CrossRef]
- Devore, J. Probability and Statistics for Engineering and the Sciences, 9th ed.; Cengage Learning: Boston, MA, USA, 2014. [Google Scholar]


| Distributions | ||||
|---|---|---|---|---|
| PM (1.5, 1.5) | ||||
| SPM (1.5, 1.5, 10) | ||||
| SPM (1.5, 1.5, 5) | ||||
| SPM (1.5, 1.5, 3) | ||||
| SPM (1.5, 1.5, 1) |
| q | |||
|---|---|---|---|
| 188.415 | |||
| 2 | 479.077 | ||
| 10 | 767.271 | ||
| 1000 | 789.663 | ||
| 36.686 | |||
| 2 | 81.509 | ||
| 10 | 144.018 | ||
| 1000 | 149.444 | ||
| 5 | 2.397 | 19.256 | |
| 2 | 2.670 | 35.360 | |
| 10 | 4.482 | 70.302 | |
| 1000 | 4.648 | 73.800 | |
| 7 | 9.480 | ||
| 2 | 8.844 | ||
| 10 | 25.013 | ||
| 1000 | 27.857 | ||
| 9 | 8.079 | ||
| 2 | 5.081 | ||
| 10 | 16.444 | ||
| 1000 | 19.755 | ||
| 10 | 7.791 | ||
| 2 | 4.360 | ||
| 10 | 14.224 | ||
| 1000 | 17.828 |
| Parameters | Mean | Variance | Median | Mode |
|---|---|---|---|---|
| 2.378 | 2.519 | 2.071 | 1.847 | |
| 1.391 | 0.862 | 1.211 | 1.080 | |
| 1.104 | 0.543 | 0.961 | 0.857 | |
| 1.500 | 2.750 | 1.075 | 0.415 | |
| 1.391 | 0.862 | 1.211 | 1.080 | |
| 1.428 | 0.742 | 1.225 | 1.099 | |
| 1.770 | 16.439 | 1.330 | 1.109 | |
| 1.391 | 0.862 | 1.211 | 1.080 | |
| 1.236 | 0.336 | 1.142 | 1.057 | |
| 1.192 | 0.256 | 1.119 | 1.048 |
| n | ||||
|---|---|---|---|---|
| 50 | ||||
| 100 | ||||
| 200 | ||||
| 50 | ||||
| 100 | ||||
| 200 | ||||
| 50 | ||||
| 100 | ||||
| 200 | ||||
| 50 | ||||
| 100 | ||||
| 200 | ||||
| 50 | ||||
| 100 | ||||
| 200 | ||||
| 50 | ||||
| 100 | ||||
| 200 |
| AIC | BIC | ADR | AD2R | ||||||
|---|---|---|---|---|---|---|---|---|---|
| SPM | PM | SPM | PM | SPM | PM | SPM | PM | ||
| 50 | 0.627 | 0.373 | 0.479 | 0.521 | 0.804 | 0.196 | 0.999 | 0.001 | |
| 100 | 0.863 | 0.137 | 0.772 | 0.228 | 0.801 | 0.199 | 1.000 | 0.000 | |
| 200 | 0.993 | 0.007 | 0.970 | 0.030 | 0.798 | 0.202 | 1.000 | 0.000 | |
| 50 | 0.643 | 0.357 | 0.501 | 0.499 | 0.777 | 0.223 | 1.000 | 0.000 | |
| 100 | 0.874 | 0.126 | 0.758 | 0.242 | 0.768 | 0.232 | 1.000 | 0.000 | |
| 200 | 0.982 | 0.018 | 0.952 | 0.048 | 0.794 | 0.206 | 1.000 | 0.000 | |
| 50 | 0.432 | 0.568 | 0.303 | 0.697 | 0.804 | 0.196 | 0.998 | 0.002 | |
| 100 | 0.681 | 0.319 | 0.539 | 0.461 | 0.783 | 0.217 | 1.000 | 0.000 | |
| 200 | 0.899 | 0.101 | 0.762 | 0.238 | 0.795 | 0.205 | 0.999 | 0.001 | |
| 50 | 0.993 | 0.007 | 0.992 | 0.008 | 0.539 | 0.461 | 0.999 | 0.001 | |
| 100 | 1.000 | 0.000 | 1.000 | 0.000 | 0.502 | 0.498 | 1.000 | 0.000 | |
| 200 | 1.000 | 0.000 | 1.000 | 0.000 | 0.453 | 0.547 | 0.976 | 0.024 | |
| 50 | 0.880 | 0.120 | 0.862 | 0.138 | 0.630 | 0.370 | 0.997 | 0.003 | |
| 100 | 0.980 | 0.020 | 0.980 | 0.020 | 0.629 | 0.371 | 1.000 | 0.000 | |
| 200 | 0.998 | 0.002 | 0.996 | 0.004 | 0.587 | 0.413 | 0.980 | 0.020 | |
| Mean | S.D. | Median | Interquartile Range | Min. | Max. | Asymmetry | Kurtosis |
|---|---|---|---|---|---|---|---|
| 10.892 | 12.741 | 6.800 | 10.375 | 0.800 | 83.100 | 3.602 | 19.360 |
| Parameter | M | PM | SPM |
|---|---|---|---|
| 0.005(0.0006) | 0.196(0.047) | 0.198(0.059) | |
| — | 0.436(0.039) | 0.563(0.080) | |
| q | — | — | 2.122(0.733) |
| l | 277.564 | 201.531 | 199.017 |
| AIC | 557.127 | 407.063 | 404.034 |
| BIC | 559.228 | 411.251 | 410.317 |
| ADR | 65.062 | 26.711 | 25.425 |
| AD2R | 2.752 × 10 | 2799.457 | 269.557 |
| Mean | S.D. | Median | Interquartile Range | Min. | Max. | Asymmetry | Kurtosis |
|---|---|---|---|---|---|---|---|
| 3.666 | 1.612 | 3.300 | 1.75 | 2 | 10.1 | 2.760 | 11.689 |
| Parameter | M | PM | SPM |
|---|---|---|---|
| 0.094(0.015) | 0.097(0.043) | 0.006(0.005) | |
| — | 0.989(0.130) | 2.704(0.517) | |
| q | — | — | 3.591(1.083) |
| l | −42.193 | −42.190 | −34.567 |
| AIC | 86.386 | 88.380 | 75.135 |
| BIC | 87.564 | 90.736 | 78.670 |
| ADR | 0.762 | 0.753 | 0.106 |
| AD2R | 160.036 | 138.239 | 2.061 |
© 2020 by the authors. Licensee MDPI, Basel, Switzerland. This article is an open access article distributed under the terms and conditions of the Creative Commons Attribution (CC BY) license (http://creativecommons.org/licenses/by/4.0/).
Share and Cite
Segovia, F.A.; Gómez, Y.M.; Venegas, O.; Gómez, H.W. A Power Maxwell Distribution with Heavy Tails and Applications. Mathematics 2020, 8, 1116. https://doi.org/10.3390/math8071116
Segovia FA, Gómez YM, Venegas O, Gómez HW. A Power Maxwell Distribution with Heavy Tails and Applications. Mathematics. 2020; 8(7):1116. https://doi.org/10.3390/math8071116
Chicago/Turabian StyleSegovia, Francisco A., Yolanda M. Gómez, Osvaldo Venegas, and Héctor W. Gómez. 2020. "A Power Maxwell Distribution with Heavy Tails and Applications" Mathematics 8, no. 7: 1116. https://doi.org/10.3390/math8071116
APA StyleSegovia, F. A., Gómez, Y. M., Venegas, O., & Gómez, H. W. (2020). A Power Maxwell Distribution with Heavy Tails and Applications. Mathematics, 8(7), 1116. https://doi.org/10.3390/math8071116


