Scenario-Based Network Reconfiguration and Renewable Energy Resources Integration in Large-Scale Distribution Systems Considering Parameters Uncertainty
Abstract
1. Introduction
- (1).
- Optimal allocation of WTs and PVs is performed while considering their uncertainties, including wind speed and solar irradiance, respectively.
- (2).
- Load uncertainty is considered in this study to step on the real-life benefits of DGs penetration during load alterations.
- (3).
- A bilevel multi-objective optimization approach is formulated to optimally size renewable WT/PV DGs along with network optimization from the planning and operational perspectives. Further, the optimal solution is chosen from the pareto solutions via a decision-making algorithm called ‘Technique for Order of Preference by Similarity to Ideal Solution’ (TOPSIS).
- (4).
- Case studies are conducted on real distribution networks, including the 59-node distribution network in Cairo and the 83-node distribution network of the Taiwan power company. Furthermore, the proposed optimization approach is tested on the 415-and 880-node large distribution networks, which are ensembled from the 83- node real distribution network.
2. Materials and Methods
2.1. Power Flow Equations
2.2. Distribution Network Reconfiguration
2.3. DG modeling
2.3.1. Wind Turbine DG
2.3.2. Solar Photovoltaic DG
2.4. Scenarios Reduction
2.5. TOPSIS
- Phase 1:
- A matrix , where and denote the number of alternatives and the criteria, respectively. A vector of preset weights is established for each criterion in which the sum of its weights equals one. After that, a matrix () called the ‘normalized matrix’ is established, where , and its elements are obtained using the following equation:
- Phase 2:
- A new matrix () is calculated, whose dimensions are , and its elements are calculated as follows:
- Phase 3:
- At this phase, the best and the worst alternatives are denoted by the vectors: and , respectively. The elements of and are denoted by and , respectively.where and are the negative and positive criteria, respectively.
- Phase 4:
- For each alternative, the least-squares distances between the th alternative and and are expressed in Equations (12) and (13), respectively.where and are the distance of each alternative from the best and the worst elements, respectively.
- Phase 5:
- At this phase, the similarity index for the th alternative () expressed in Equation (12) is calculated to sort the alternatives.where belongs to the interval [0,1].
- Phase 6:
- Display the best alternative having the highest value.
2.6. System Performance Indices
2.6.1. Load Balancing Index (LBI)
2.6.2. Aggregate Voltage Deviation Index (AVDI)
2.6.3. Fast Voltage Stability Index (FVSI)
3. Problem Formulation
3.1. Objective Function
3.2. Constraints
| Algorithm 1 The proposed bilevel multi-objective optimization for HC maximization |
|
4. Results and Discussion
5. Conclusions and Future Works
Author Contributions
Funding
Institutional Review Board Statement
Informed Consent Statement
Data Availability Statement
Conflicts of Interest
Nomenclature
| Input Data and Indices | |
| Aggregated voltage deviation index | |
| Aggregated voltage deviation index at the sth scenario | |
| Overall aggregated voltage deviation index for all scenarios | |
| The set of nodes | |
| The set of lines | |
| Aggregated fast voltage stability index | |
| Aggregated FVSI for all distribution system lines at the sth scenario | |
| FVSI of the bth line at the sth scenario | |
| Overall aggregated fast voltage stability index for all scenarios | |
| Solar irradiance | |
| Standard solar irradiance | |
| Solar irradiance at the sth scenario | |
| Magnitude of the branch current flowing in the bth branch at the sth scenario | |
| Loading level at the sth scenario | |
| Load balancing index | |
| LBI at the sth scenario for the bth line | |
| Aggregated LBI for all lines at the sth scenario | |
| Overall LBI for all scenarios | |
| Total number of scenarios | |
| Probabilistic hosting capacity | |
| Apparent power injected to the kth node | |
| Load’s apparent power connected to the kth node | |
| Probability of the sth scenario | |
| Probabilistic total active loss for all the studied scenarios | |
| Total power loss at the normal loading conditions | |
| Active power delivered by the substation at the sth scenario | |
| Specific irradiance threshold | |
| Impedance of the bth line | |
| Total power loss reduction | |
| Maximum capacity of the installed PV | |
| Maximum capacity of the installed WT | |
| Nodal voltage at the kth node | |
| Magnitude of the kth node at the sth scenario | |
| Lower nodal voltage limit | |
| Upper nodal voltage limit | |
| WT rated speed | |
| WT cut-in speed | |
| WT cut-out speed | |
| Wind speed at the sth scenario | |
| Reactive component of the bth line impedance | |
| Impedance of the bth line at the sth scenario | |
| Decision variables of the upper-level optimization | |
| Actual penetration of a PV DG at the sth scenario | |
| Actual penetration of a WT DG at the sth scenario | |
| Size of the installed WT at the node | |
| Size of the installed PV unit at the node | |
| Decision variables of the graphically based DNR (lower-level optimization) | |
| Binary vector indicates the best open/close status of the distribution network tie-lines | |
| Temporary binary vector indicates open/close status of the network tie-lines | |
References
- Zappa, W.; Junginger, M.; van den Broek, M. Is a 100% renewable European power system feasible by 2050? Appl. Energy 2019, 233–234, 1027–1050. [Google Scholar] [CrossRef]
- Zsiborács, H.; Baranyai, N.H.; Vincze, A.; Zentkó, L.; Birkner, Z.; Máté, K.; Pintér, G. Intermittent Renewable Energy Sources: The Role of Energy Storage in the European Power System of 2040. Electronics 2019, 8, 729. [Google Scholar] [CrossRef]
- Ismael, S.M.; Abdel Aleem, S.H.E.; Abdelaziz, A.Y.; Zobaa, A.F. State-of-the-art of hosting capacity in modern power systems with distributed generation. Renew. Energy 2019, 130, 1002–1020. [Google Scholar] [CrossRef]
- Sakar, S.; Balci, M.E.; Abdel Aleem, S.H.E.; Zobaa, A.F. Increasing PV hosting capacity in distorted distribution systems using passive harmonic filtering. Electr. Power Syst. Res. 2017, 148, 74–86. [Google Scholar] [CrossRef]
- Diaaeldin, I.; Abdel Aleem, S.; El-Rafei, A.; Abdelaziz, A.; Zobaa, A.F. Optimal Network Reconfiguration in Active Distribution Networks with Soft Open Points and Distributed Generation. Energies 2019, 12, 4172. [Google Scholar] [CrossRef]
- Alalamat, F. Increasing the Hosting Capacity of Radial Distribution Grids in Jordan, n.d. Available online: http://www.teknat.uu.se/student (accessed on 3 June 2020).
- Takenobu, Y.; Yasuda, N.; Minato, S.; Hayashi, Y. Scalable enumeration approach for maximizing hosting capacity of distributed generation. Int. J. Electr. Power Energy Syst. 2019, 105, 867–876. [Google Scholar] [CrossRef]
- Capitanescu, F.; Ochoa, L.F.; Margossian, H.; Hatziargyriou, N.D. Assessing the Potential of Network Reconfiguration to Improve Distributed Generation Hosting Capacity in Active Distribution Systems. IEEE Trans. Power Syst. 2015, 30, 346–356. [Google Scholar] [CrossRef]
- Diaaeldin, I.M.; Abdel Aleem, S.H.E.; El-Rafei, A.; Abdelaziz, A.Y.; Zobaa, A.F. Hosting Capacity Maximization Based on Optimal Reconfiguration of Distribution Networks with Optimized Soft Open Point Operation. In Hosting Capacity for Smart Power Grids; Springer International Publishing: Cham, Switzerland, 2020; pp. 179–193. ISBN 9783030400293. [Google Scholar]
- Qi, Q.; Long, C.; Wu, J.; Smith, K.; Moon, A.; Yu, J. Using an MVDC Link to Increase DG Hosting Capacity of a Distribution Network. Energy Procedia 2017, 142, 2224–2229. [Google Scholar] [CrossRef]
- Ismael, S.M.; Abdel Aleem, S.H.E.; Abdelaziz, A.Y.; Zobaa, A.F. Practical Considerations for Optimal Conductor Reinforcement and Hosting Capacity Enhancement in Radial Distribution Systems. IEEE Access 2018, 6, 27268–27277. [Google Scholar] [CrossRef]
- Ismael, S.; Abdel Aleem, S.; Abdelaziz, A.; Zobaa, A. Probabilistic Hosting Capacity Enhancement in Non-Sinusoidal Power Distribution Systems Using a Hybrid PSOGSA Optimization Algorithm. Energies 2019, 12, 1018. [Google Scholar] [CrossRef]
- Pandi, V.R.; Zeineldin, H.H.; Xiao, W.; Zobaa, A.F. Optimal penetration levels for inverter-based distributed generation considering harmonic limits. Electr. Power Syst. Res. 2013, 97, 68–75. [Google Scholar] [CrossRef]
- Xu, X.; Li, J.; Xu, Z.; Zhao, J.; Lai, C.S. Enhancing photovoltaic hosting capacity—A stochastic approach to optimal planning of static var compensator devices in distribution networks. Appl. Energy 2019, 238, 952–962. [Google Scholar] [CrossRef]
- Jabr, R.A.; Singh, R.; Pal, B.C. Minimum Loss Network Reconfiguration Using Mixed-Integer Convex Programming. IEEE Trans. Power Syst. 2012, 27, 1106–1115. [Google Scholar] [CrossRef]
- Ahmadi, H.; Marti, J.R. Distribution System Optimization Based on a Linear Power-Flow Formulation. IEEE Trans. Power Deliv. 2015, 30, 25–33. [Google Scholar] [CrossRef]
- Taylor, J.A.; Hover, F.S. Convex Models of Distribution System Reconfiguration. IEEE Trans. Power Syst. 2012, 27, 1407–1413. [Google Scholar] [CrossRef]
- Mohamed Diaaeldin, I.; Abdel Aleem, S.H.E.; El-Rafei, A.; Abdelaziz, A.Y.; Zobaa, A.F. A Novel Graphically-Based Network Reconfiguration for Power Loss Minimization in Large Distribution Systems. Mathematics 2019, 7, 1182. [Google Scholar] [CrossRef]
- Badran, O.; Mekhilef, S.; Mokhlis, H.; Dahalan, W. Optimal reconfiguration of distribution system connected with distributed generations: A review of different methodologies. Renew. Sustain. Energy Rev. 2017, 73, 854–867. [Google Scholar] [CrossRef]
- Abdelaziz, A.Y.; Mohamed, F.M.; Mekhamer, S.F.; Badr, M.A.L. Distribution system reconfiguration using a modified Tabu Search algorithm. Electr. Power Syst. Res. 2010, 80, 943–953. [Google Scholar] [CrossRef]
- Diaaeldin, I.M.; Abdel Aleem, S.H.E.; El-Rafei, A.; Abdelaziz, A.Y. A Novel Reconfiguration Methodology of Radial Distribution Systems for Power Loss Minimization Using Expanded Invasive Weed optimization. In Proceedings of the 2019 21st International Middle East Power Systems Conference (MEPCON), Cairo, Egypt, 17–19 December 2019; IEEE: New York, NY, USA, 2019; pp. 119–124. [Google Scholar]
- Eldurssi, A.M.; O’Connell, R.M. A Fast Nondominated Sorting Guided Genetic Algorithm for Multi-Objective Power Distribution System Reconfiguration Problem. IEEE Trans. Power Syst. 2015, 30, 593–601. [Google Scholar] [CrossRef]
- Roberge, V.; Tarbouchi, M.; Okou, F.A. Distribution System Optimization on Graphics Processing Unit. IEEE Trans. Smart Grid 2017, 8, 1689–1699. [Google Scholar] [CrossRef]
- Deb, K.; Pratap, A.; Agarwal, S.; Meyarivan, T. A fast and elitist multiobjective genetic algorithm: NSGA-II. IEEE Trans. Evol. Comput. 2002, 6, 182–197. [Google Scholar] [CrossRef]
- Coello Coello, C.A.; Lechuga, M.S. MOPSO: A proposal for multiple objective particle swarm optimization. In Proceedings of the 2002 Congress on Evolutionary Computation. CEC’02 (Cat. No.02TH8600), Honolulu, HI, USA, 12–17 May 2002; IEEE: New York, NY, USA, 2002; Volume 2, pp. 1051–1056. [Google Scholar]
- Mohamed Diaaeldin, I.; Abdel Aleem, S.H.E.; El-Rafei, A.; Abdelaziz, A.Y.; Zobaa, A.F. Distribution System Reconfiguration for an Egyptian Distribution Feeder; Mendeley Data: Amesterdam, The Netherlands, 2020; Volume 1. [Google Scholar] [CrossRef]
- Zimmerman, R.D.; Murillo-Sanchez, C.E.; Thomas, R.J. MATPOWER: Steady-State Operations, Planning, and Analysis Tools for Power Systems Research and Education. IEEE Trans. Power Syst. 2011, 26, 12–19. [Google Scholar] [CrossRef]
- Zimmerman, R.D.; Murillo-Sanchez, C.E. MATPOWER (Version 4.1) [Software]. 2011. Available online: https://matpower.org (accessed on 9 November 2020). [CrossRef]
- Surender Reddy, S.; Bijwe, P.R.; Abhyankar, A.R. Real-Time Economic Dispatch Considering Renewable Power Generation Variability and Uncertainty Over Scheduling Period. IEEE Syst. J. 2015, 9, 1440–1451. [Google Scholar] [CrossRef]
- Biswas, P.P.; Suganthan, P.N.; Mallipeddi, R.; Amaratunga, G.A.J. Optimal reactive power dispatch with uncertainties in load demand and renewable energy sources adopting scenario-based approach. Appl. Soft Comput. 2019, 75, 616–632. [Google Scholar] [CrossRef]
- Available online: https://drive.google.com/drive/folders/1wdnc_Wizv5QYGz7NEx2XG52_HO6ET1bA?usp=sharing (accessed on 9 November 2020).
- Growe-Kuska, N.; Heitsch, H.; Romisch, W. Scenario reduction and scenario tree construction for power management problems. In Proceedings of the 2003 IEEE Bologna Power Tech Conference Proceedings, Bologna, Italy, 23–26 June 2003; IEEE: New York, NY, USA, 2003; Volume 3, pp. 152–158. [Google Scholar]
- Hwang, C.-L.; Yoon, K. Multiple Attributes Decision Making Methods and Applications. 1981. Available online: https://www.springer.com/gp/book/9783540105589 (accessed on 21 December 2020).
- Yoon, K. A Reconciliation among Discrete Compromise Solutions. J. Oper. Res. Soc. 1987, 38, 277. [Google Scholar] [CrossRef]
- Hwang, C.-L.; Lai, Y.-J.; Liu, T.-Y. A new approach for multiple objective decision making. Comput. Oper. Res. 1993, 20, 889–899. [Google Scholar] [CrossRef]
- Baran, M.E.; Wu, F.F. Network reconfiguration in distribution systems for loss reduction and load balancing. IEEE Trans. Power Deliv. 1989, 4, 1401–1407. [Google Scholar] [CrossRef]
- Othman, A.M.; El-Fergany, A.A.; Abdelaziz, A.Y. Optimal Reconfiguration Comprising Voltage Stability Aspect Using Enhanced Binary Particle Swarm Optimization Algorithm. Electr. Power Compon. Syst. 2015, 43, 1656–1666. [Google Scholar] [CrossRef]
- Diaaeldin, I.M.; Abdel Aleem, S.H.E.; El-Rafei, A.; Abdelaziz, A.Y.; Calasan, M. Optimal Network Reconfiguration and Distributed Generation Allocation using Harris Hawks Optimization. In Proceedings of the 2020 24th International Conference on Information Technology (IT), Zabljak, Montenegro, 18–22 February 2020; IEEE: New York, NY, USA, 2020; pp. 1–6. [Google Scholar]
- Available online: http://roberge.segfaults.net/joomla/index.php (accessed on 9 November 2020).
- Saleh, O.A.; Elshahed, M.; Elsayed, M. Enhancement of radial distribution network with distributed generation and system reconfiguration. J. Electr. Syst. 2018, 14, 36–50. [Google Scholar]
- Diaaeldin, I.M.; Abdel Aleem, S.H.E.; El-Rafei, A.; Abdelaziz, A.Y.; Zobaa, A.F. Enhancement of Hosting Capacity with Soft Open Points and Distribution System Reconfiguration: Multi-Objective Bilevel Stochastic Optimization. Energies 2020, 13, 5446. [Google Scholar] [CrossRef]
- Yang, X.-S.; Karamanoglu, M.; He, X. Flower pollination algorithm: A novel approach for multiobjective optimization. Eng. Optim. 2014, 46, 1222–1237. [Google Scholar] [CrossRef]
- Mirjalili, S.; Jangir, P.; Mirjalili, S.Z.; Saremi, S.; Trivedi, I.N. Optimization of problems with multiple objectives using the multi-verse optimization algorithm. Knowl. Based Syst. 2017, 134, 50–71. [Google Scholar] [CrossRef]
- Wu, W.-C.; Tsai, M.-S. Application of enhanced integer coded particle swarm optimization for distribution system feeder reconfiguration. IEEE Trans. Power Syst. 2011, 26, 1591–1599. [Google Scholar] [CrossRef]
- Diaaeldin, I.M.; Abdel Aleem, S.H.E.; El-Rafei, A.; Abdelaziz, A.Y.; Zobaa, A.F. Large-scale integration of distributed generation in reconfigured distribution networks considering load uncertainty. In Uncertainties in Modern Power Systems; Elsevier: Amsterdam, The Netherlands, 2021; pp. 441–484. [Google Scholar]
- Escalera, A.; Prodanović, M.; Castronuovo, E.D.; Roldan-Perez, J. Contribution of active management technologies to the reliability of power distribution networks. Appl. Energy 2020, 267, 114919. [Google Scholar] [CrossRef]
- Mostafa, M.H.; Abdel Aleem, S.H.E.; Ali, S.G.; Ali, Z.M.; Abdelaziz, A.Y. Techno-economic assessment of energy storage systems using annualized life cycle cost of storage (LCCOS) and levelized cost of energy (LCOE) metrics. J. Energy Storage 2020, 29, 101345. [Google Scholar] [CrossRef]
- Abdul Rahim, M.N.; Mokhlis, H.; Bakar, A.H.A.; Rahman, M.T.; Badran, O.; Mansor, N.N. Protection Coordination Toward Optimal Network Reconfiguration and DG Sizing. IEEE Access 2019, 7, 163700–163718. [Google Scholar] [CrossRef]
- Amanulla, B.; Chakrabarti, S.; Singh, S.N. Reconfiguration of Power Distribution Systems Considering Reliability and Power Loss. IEEE Trans. Power Deliv. 2012, 27, 918–926. [Google Scholar] [CrossRef]
- Ghasemi, S. Balanced and unbalanced distribution networks reconfiguration considering reliability indices. Ain Shams Eng. J. 2018, 9, 1567–1579. [Google Scholar] [CrossRef]
- Swief, R.; Abdel-Salam, T.; El-Amary, N. Photovoltaic and Wind Turbine Integration Applying Cuckoo Search for Probabilistic Reliable Optimal Placement. Energies 2018, 11, 139. [Google Scholar] [CrossRef]
- Abdel Aleem, S.H.E.; Elmathana, M.T.; Zobaa, A.F. Different Design Approaches of Shunt Passive Harmonic Filters Based on IEEE Std. 519-1992 and IEEE Std. 18-2002. Recent Pat. Electr. Electron. Eng. 2013, 6, 68–75. [Google Scholar] [CrossRef]


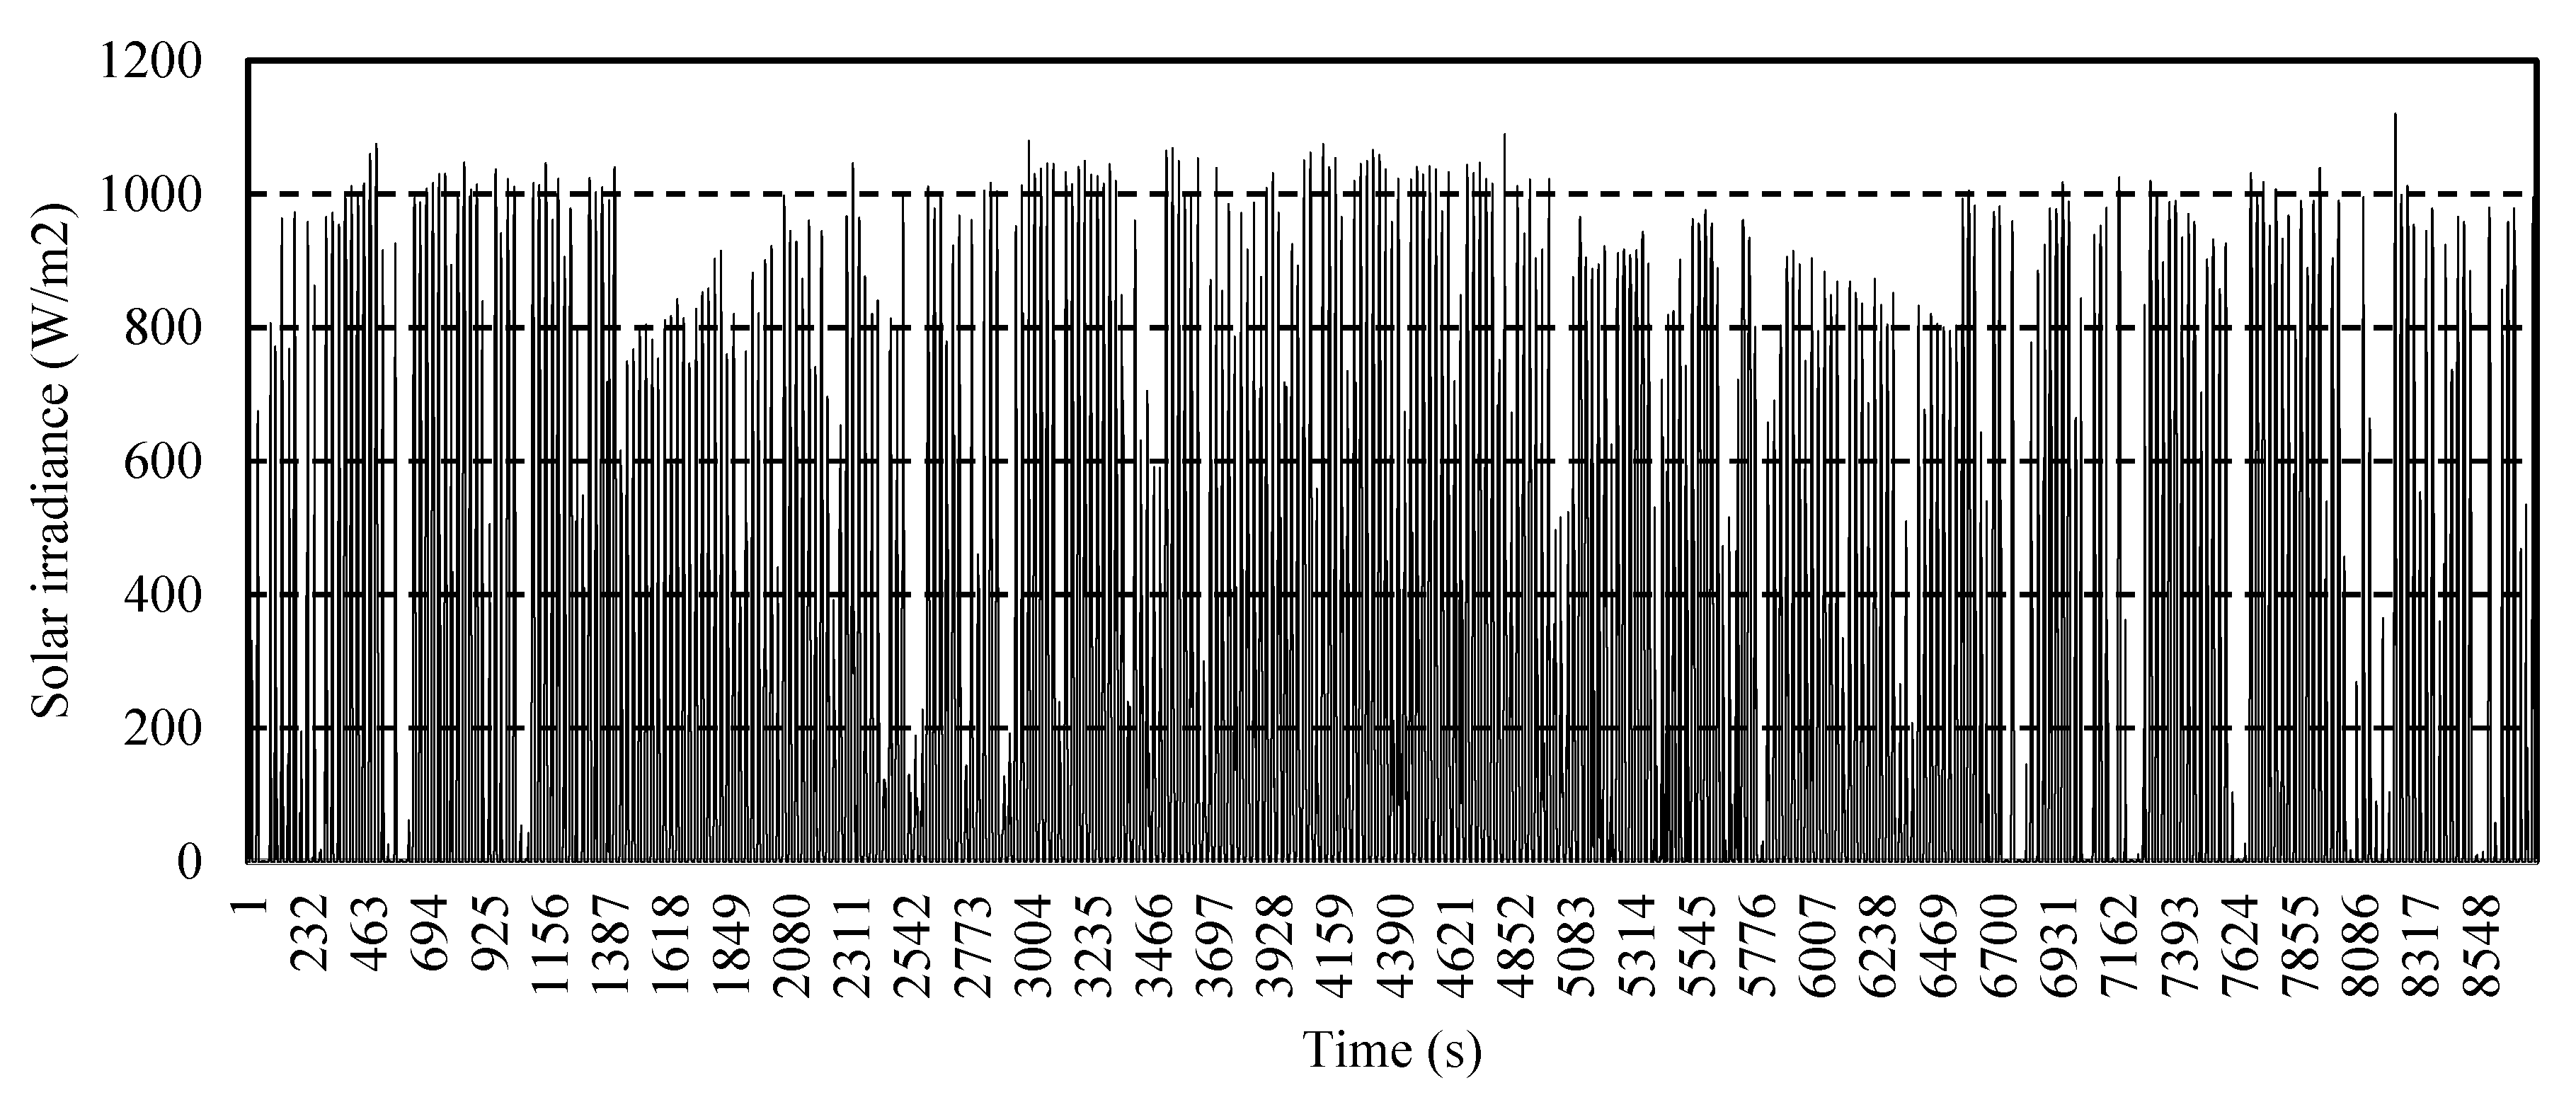
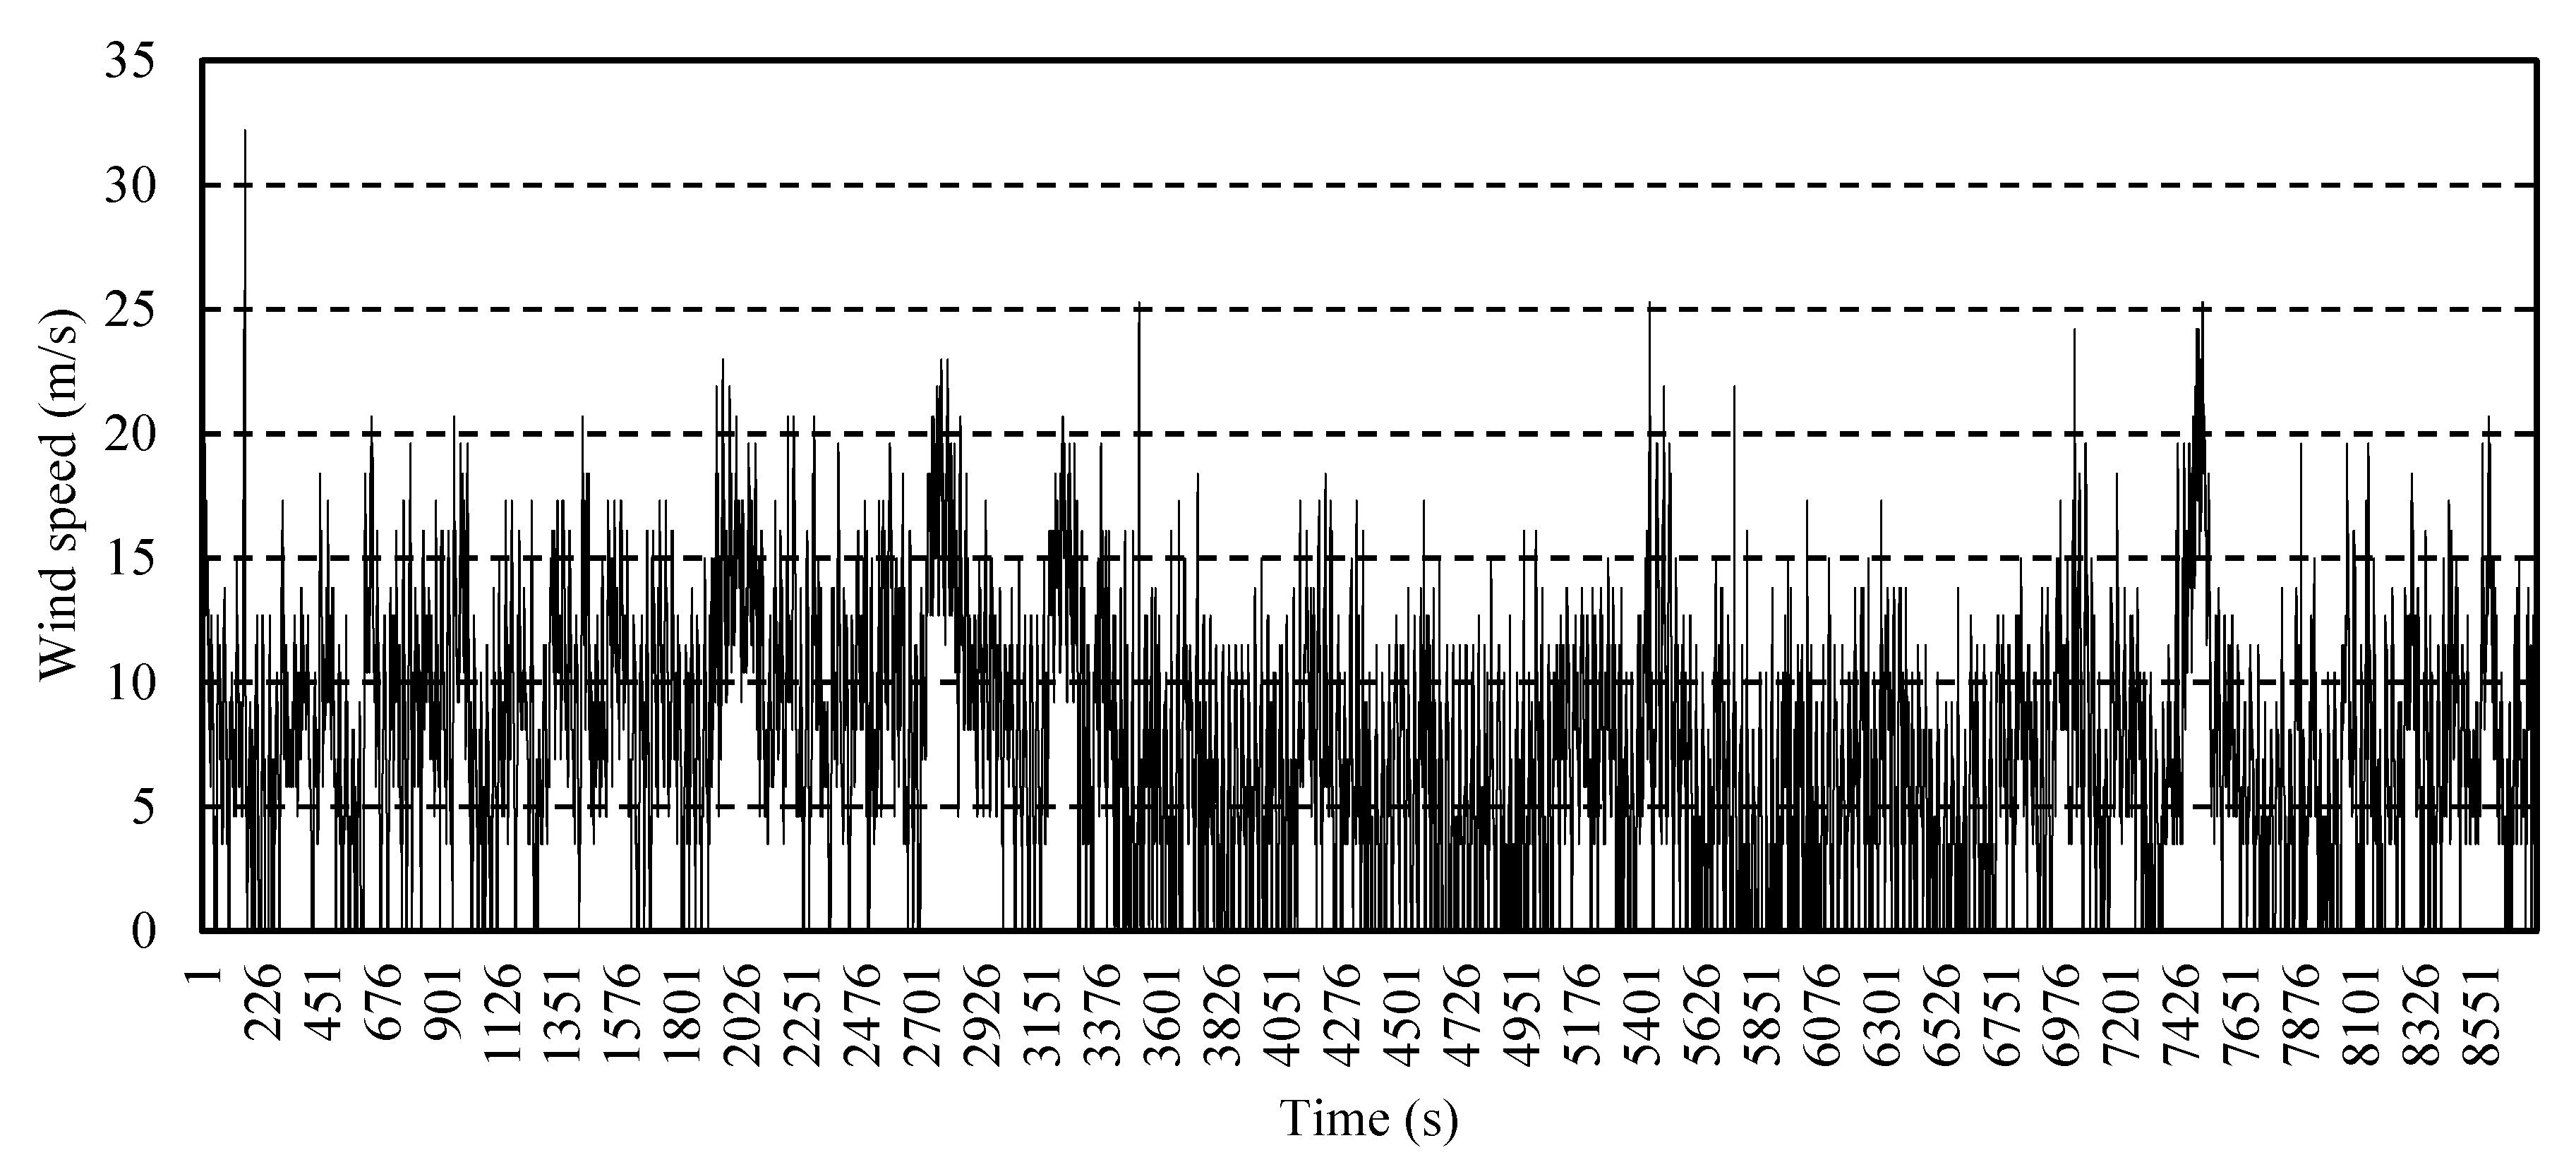
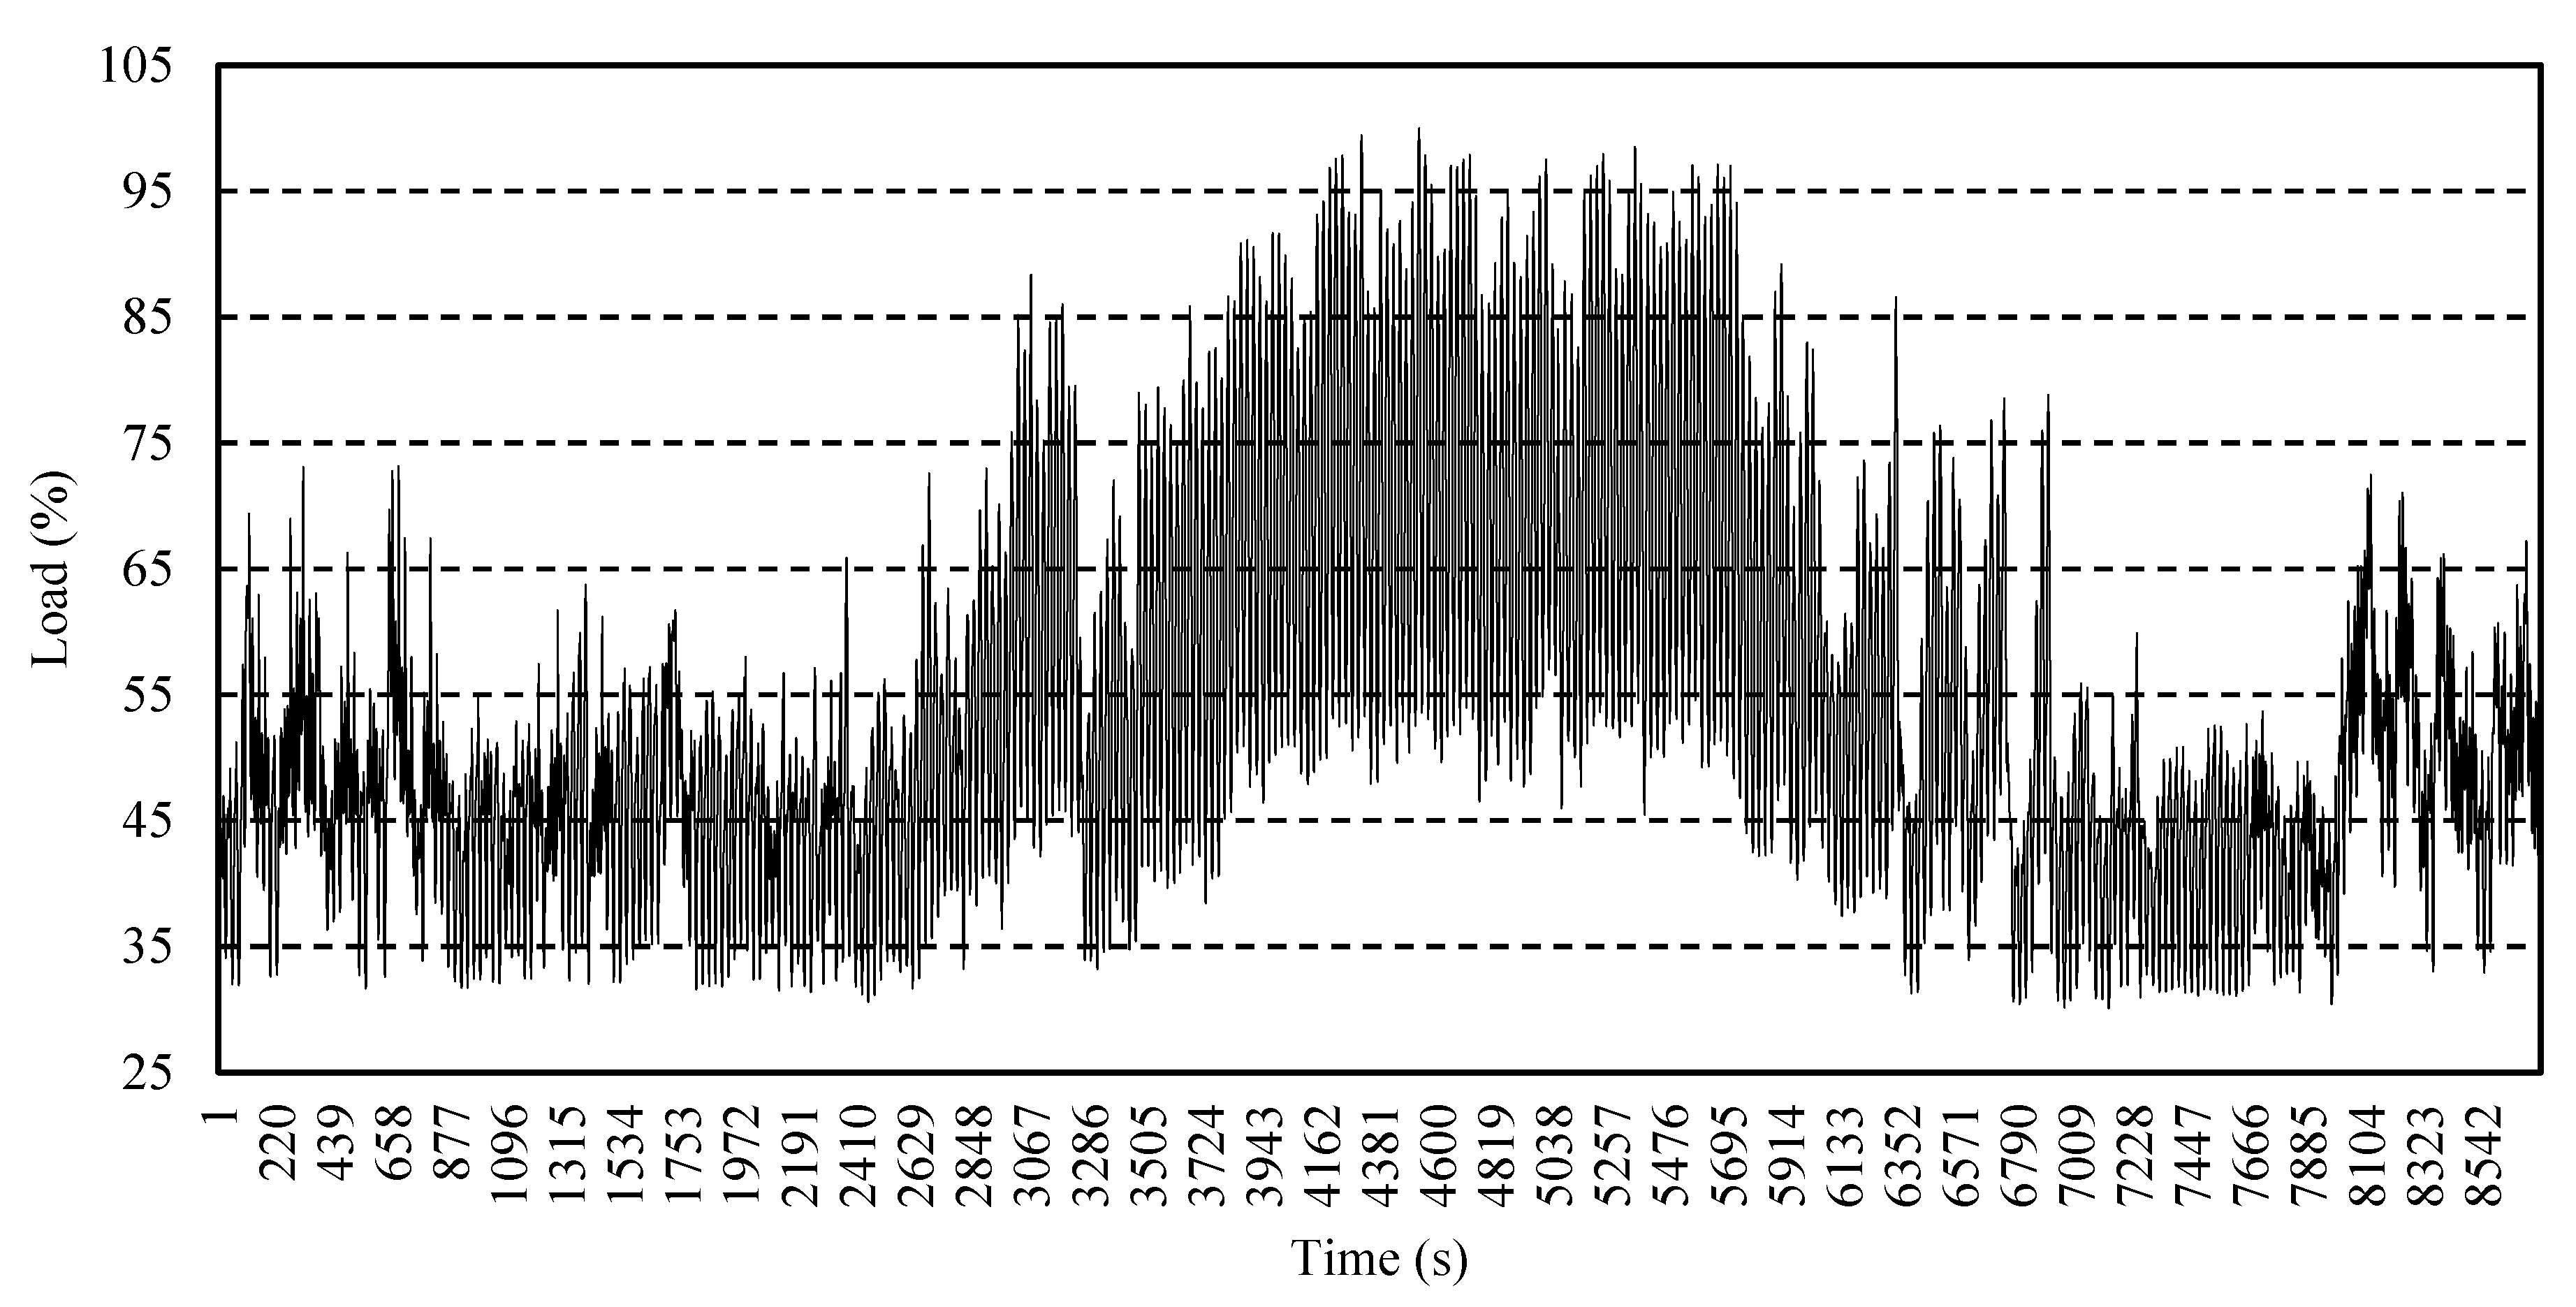
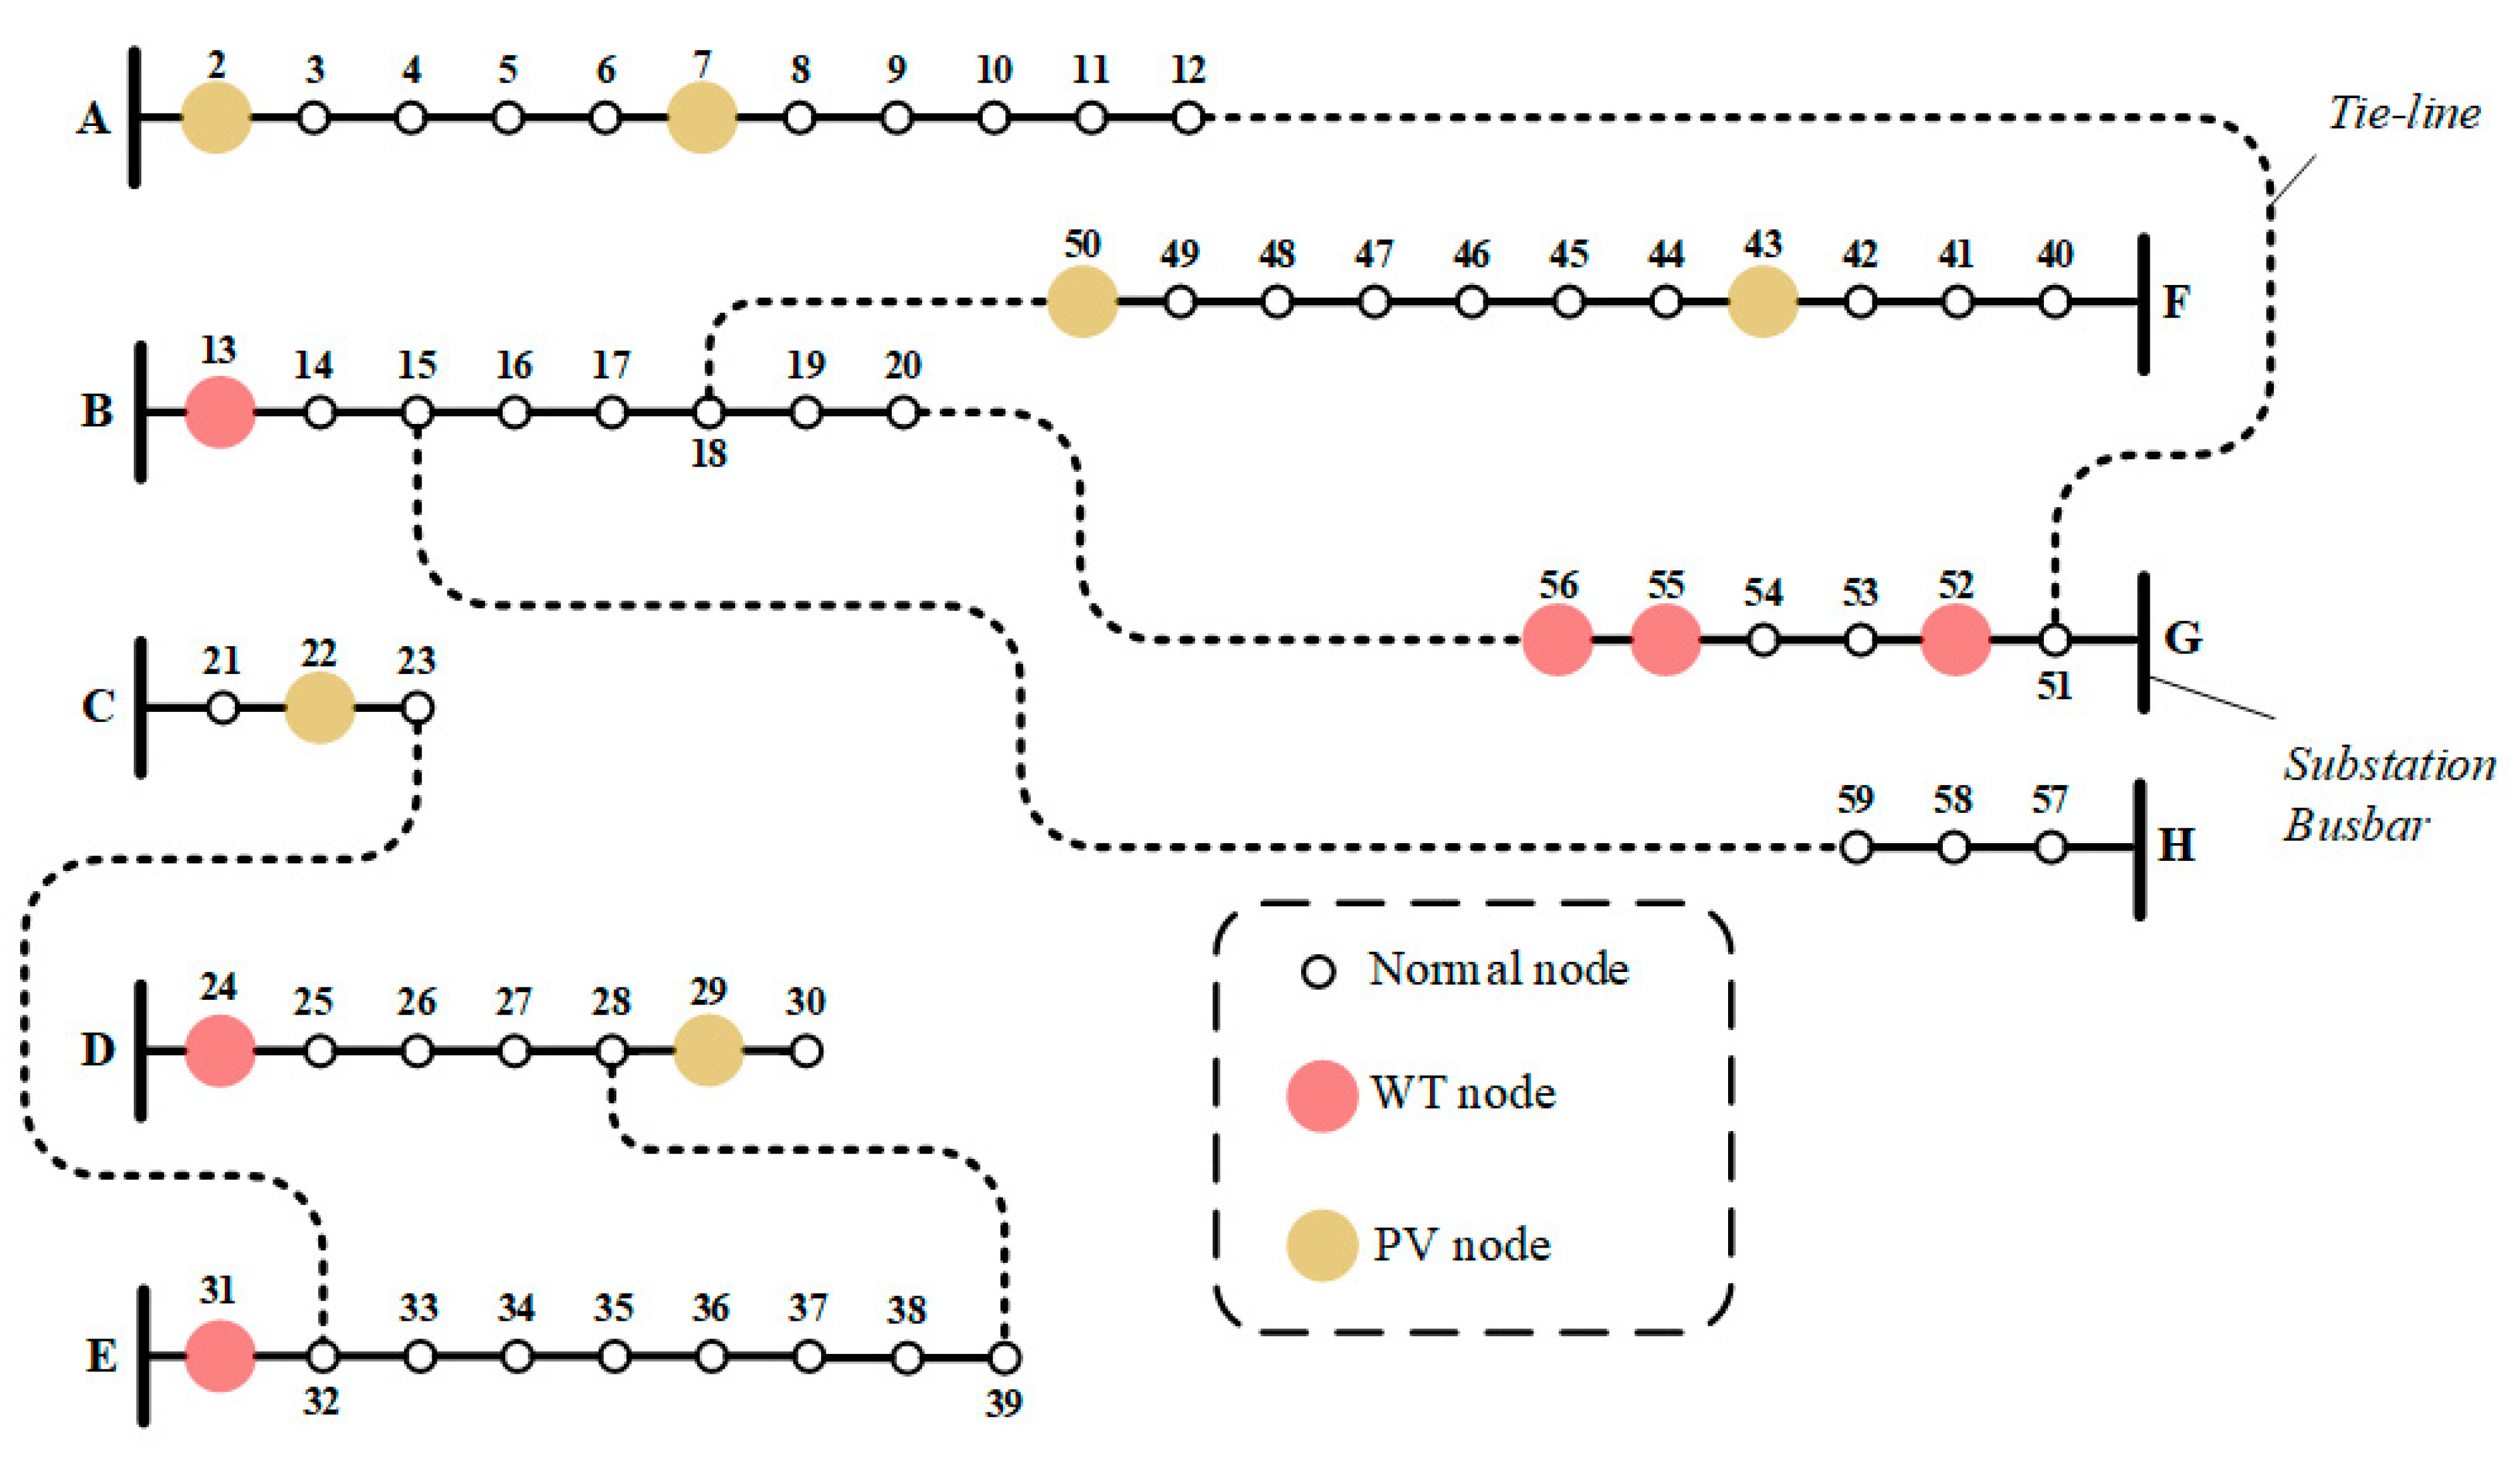
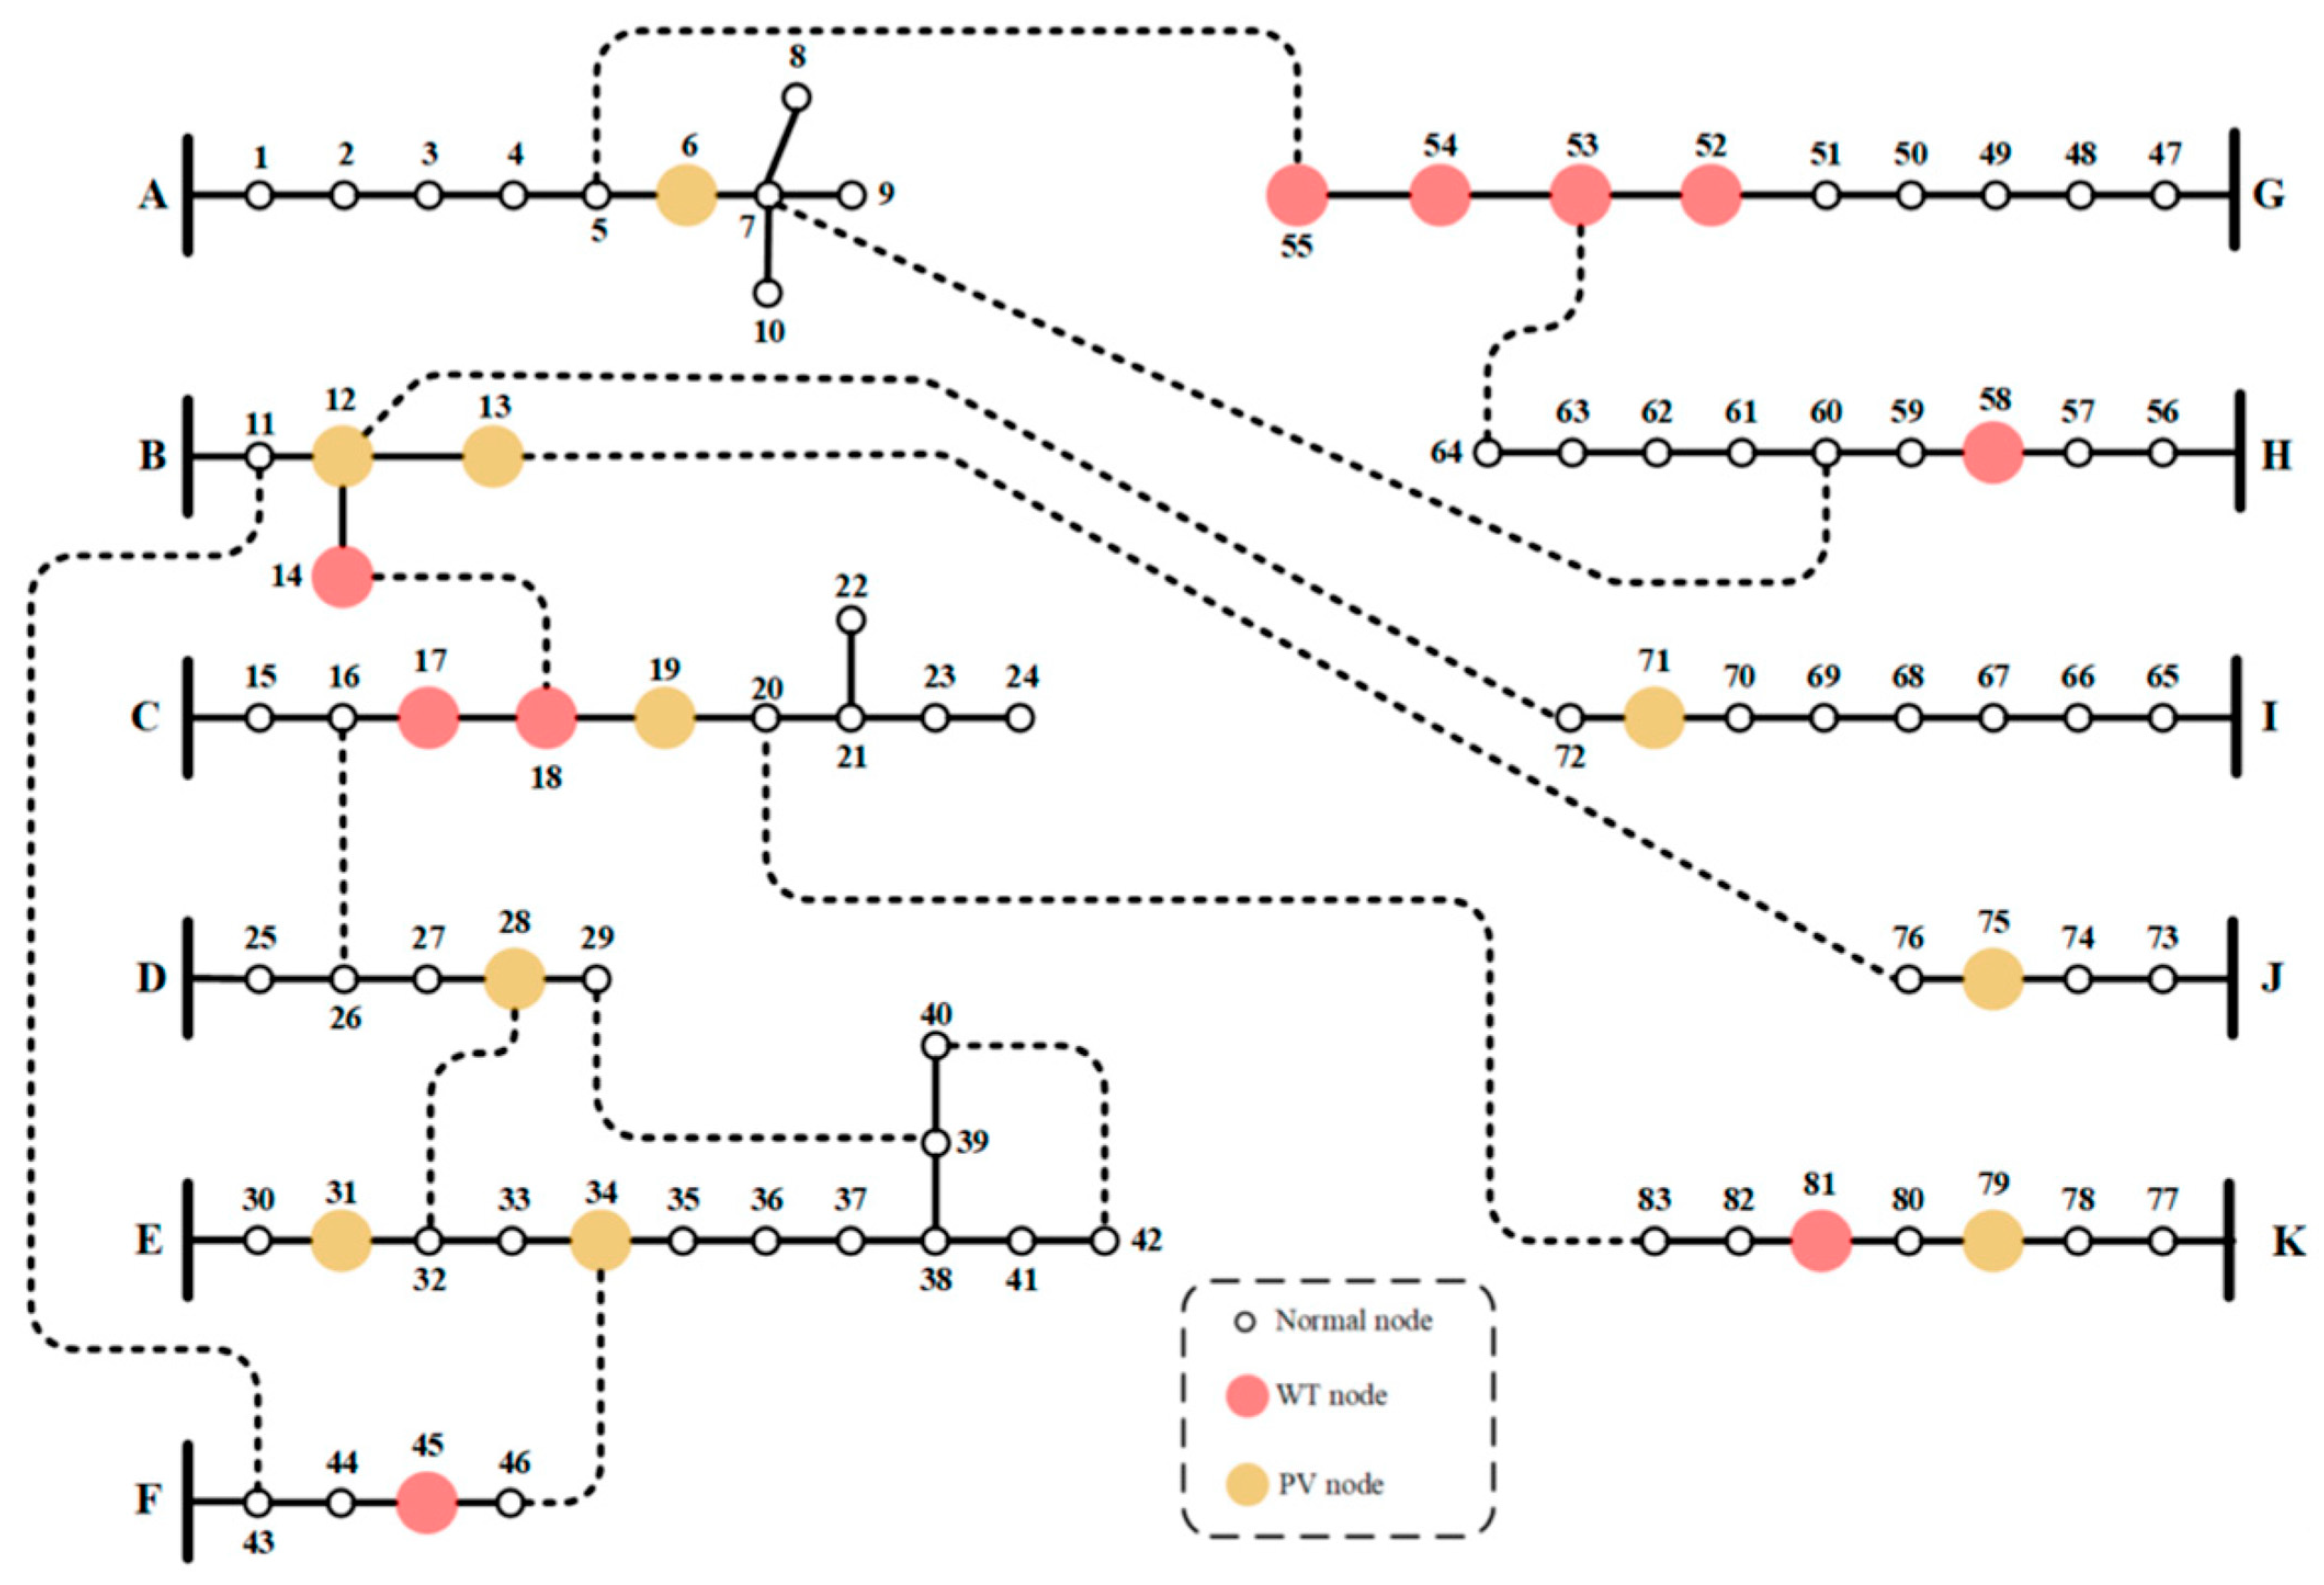
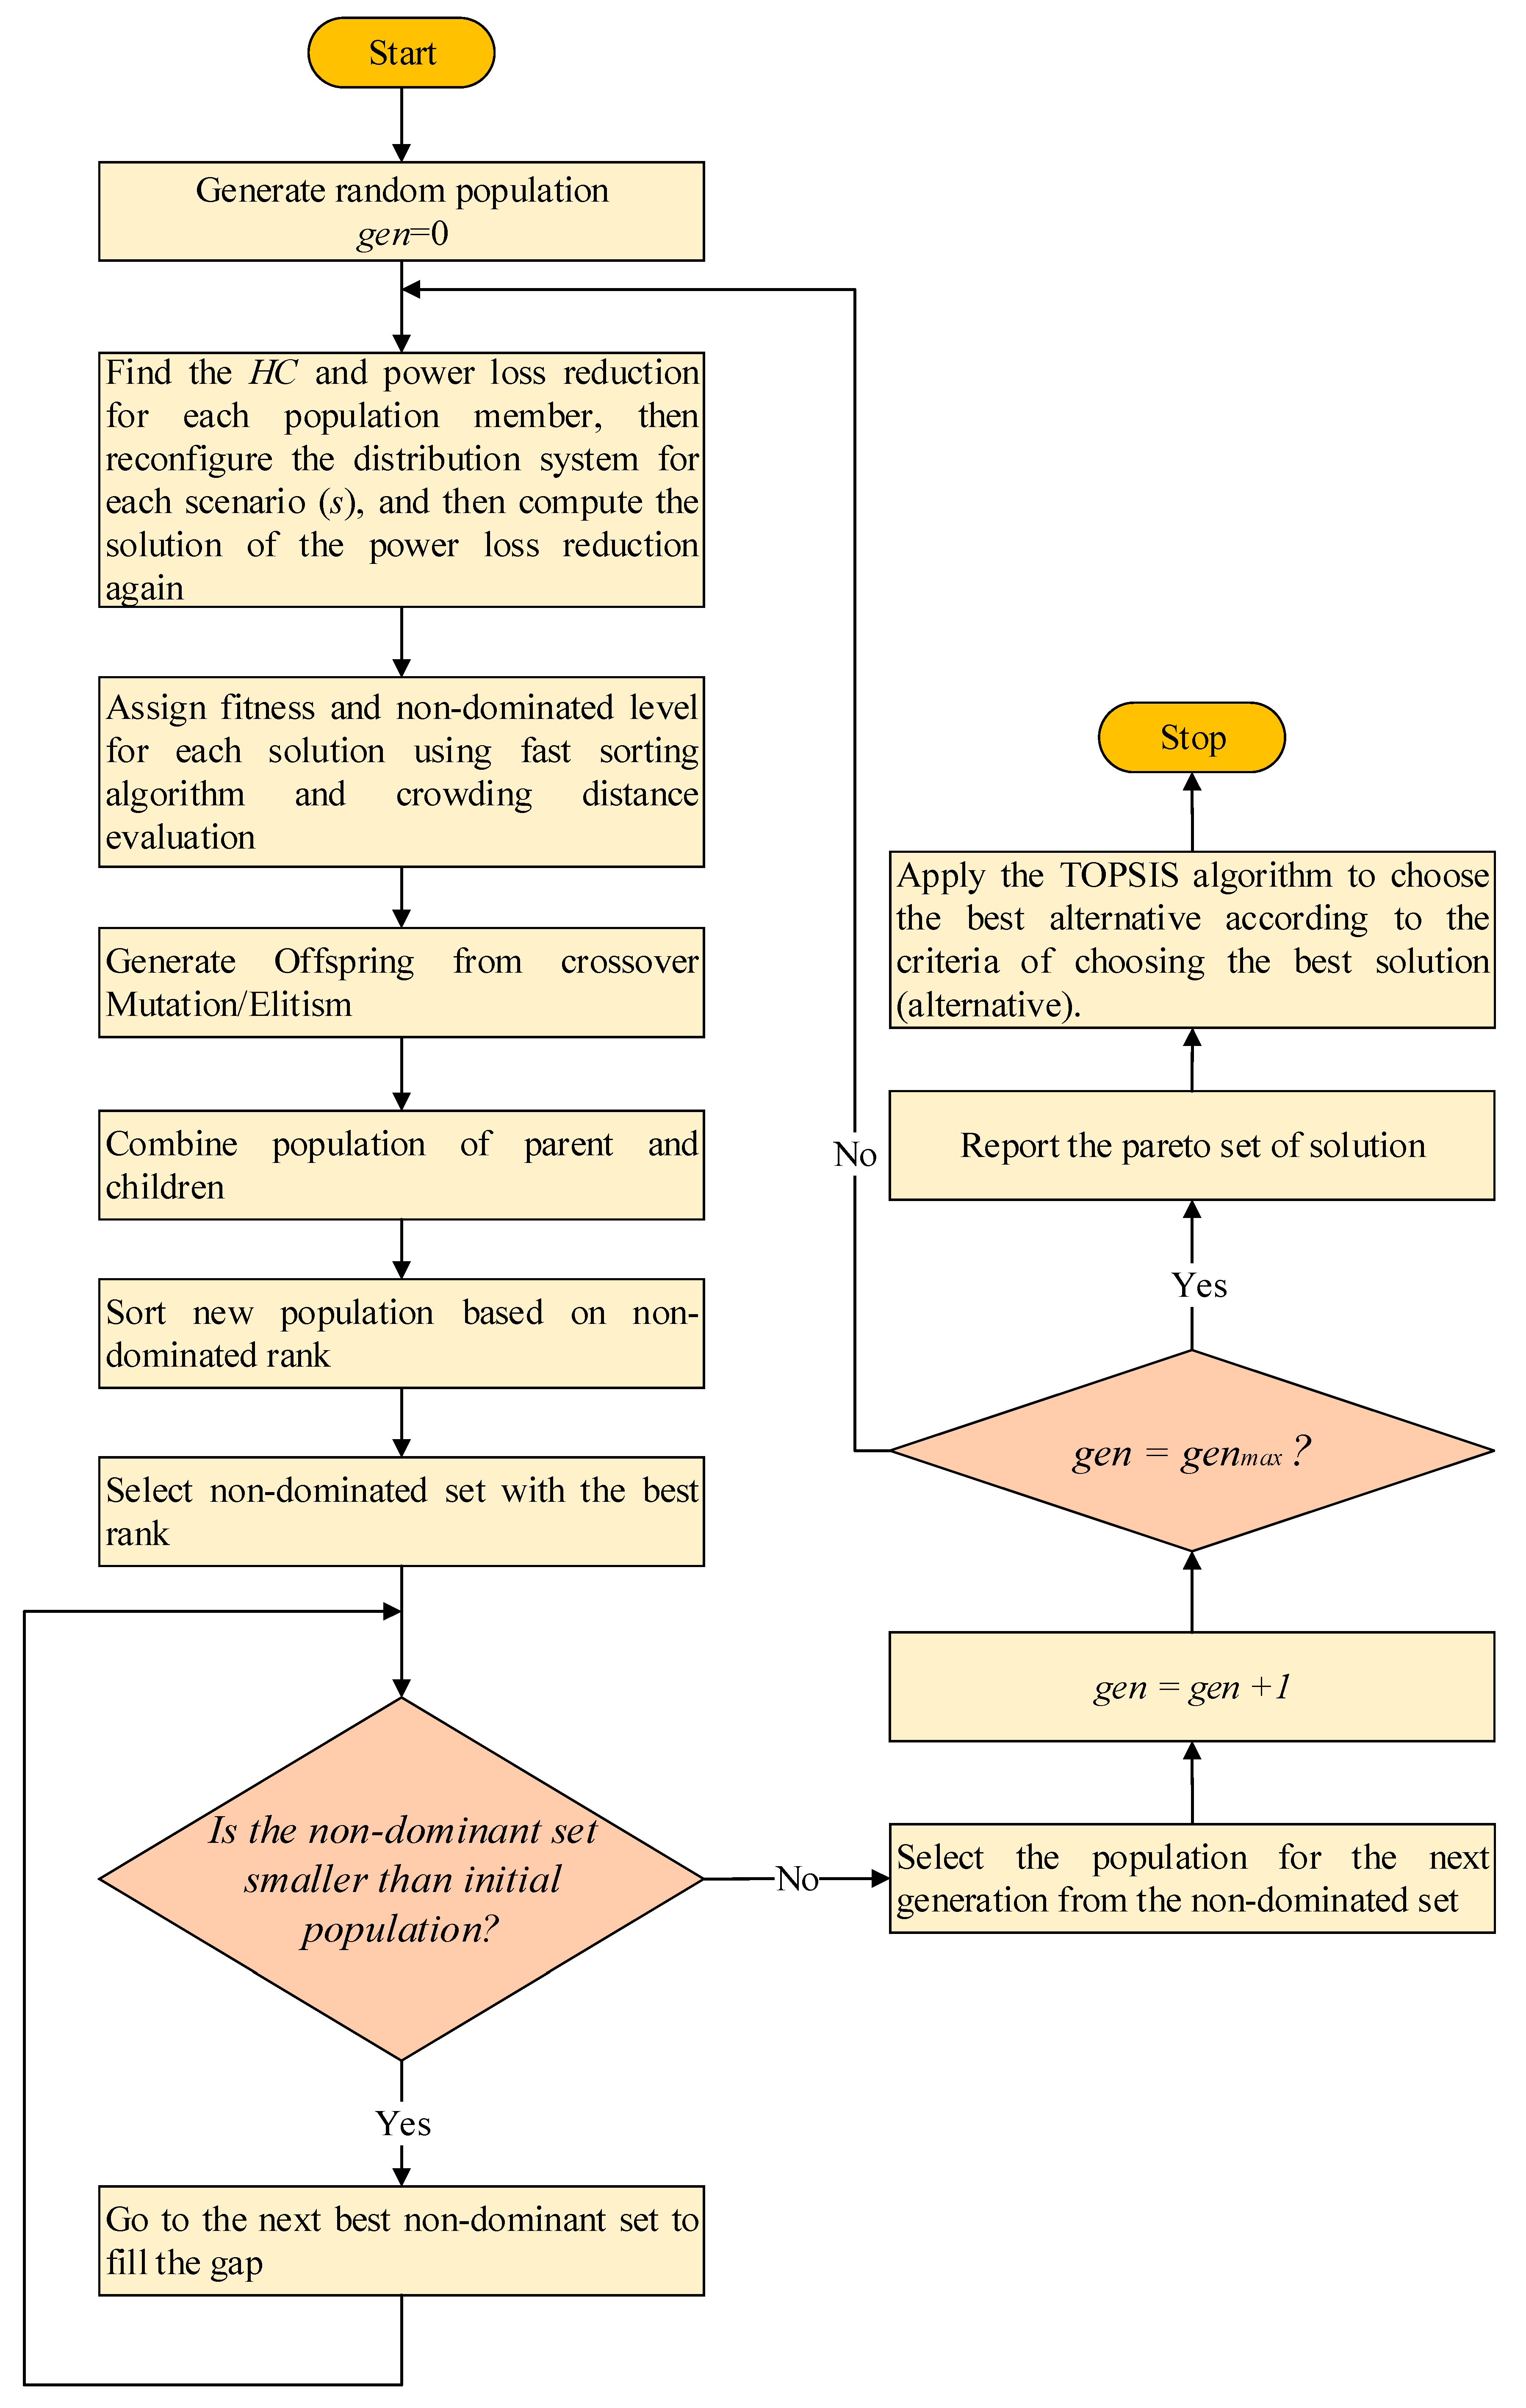
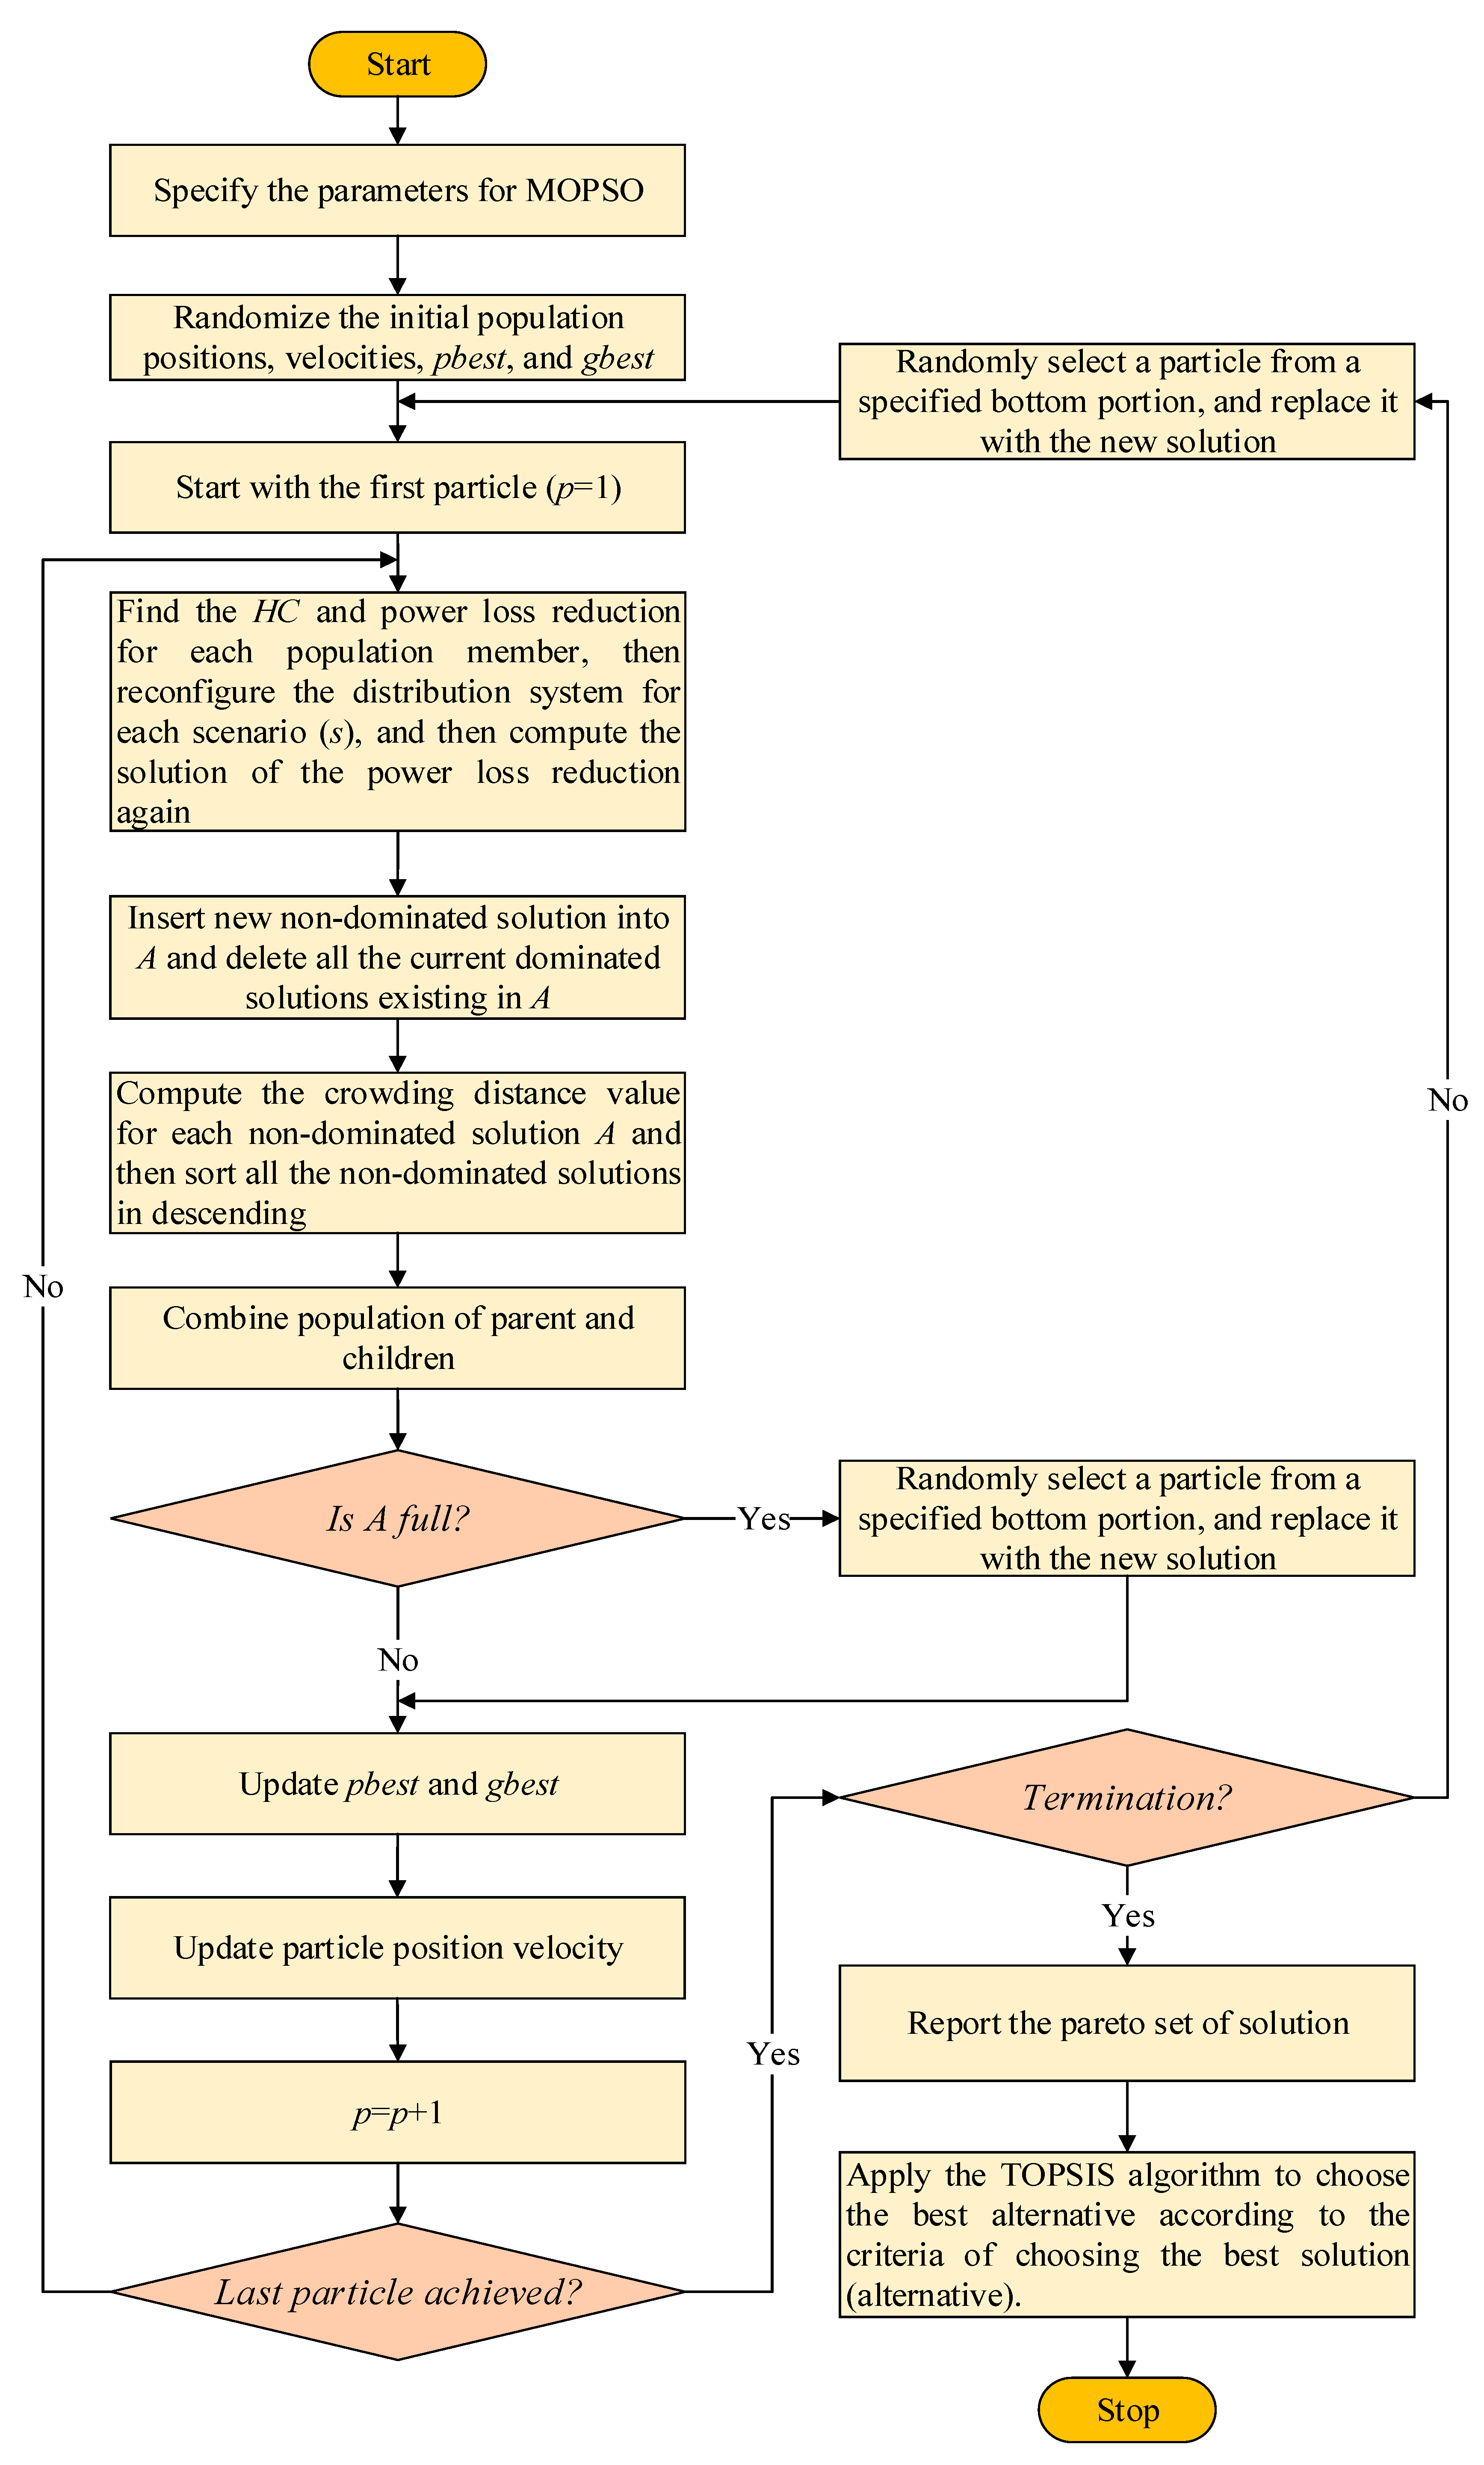

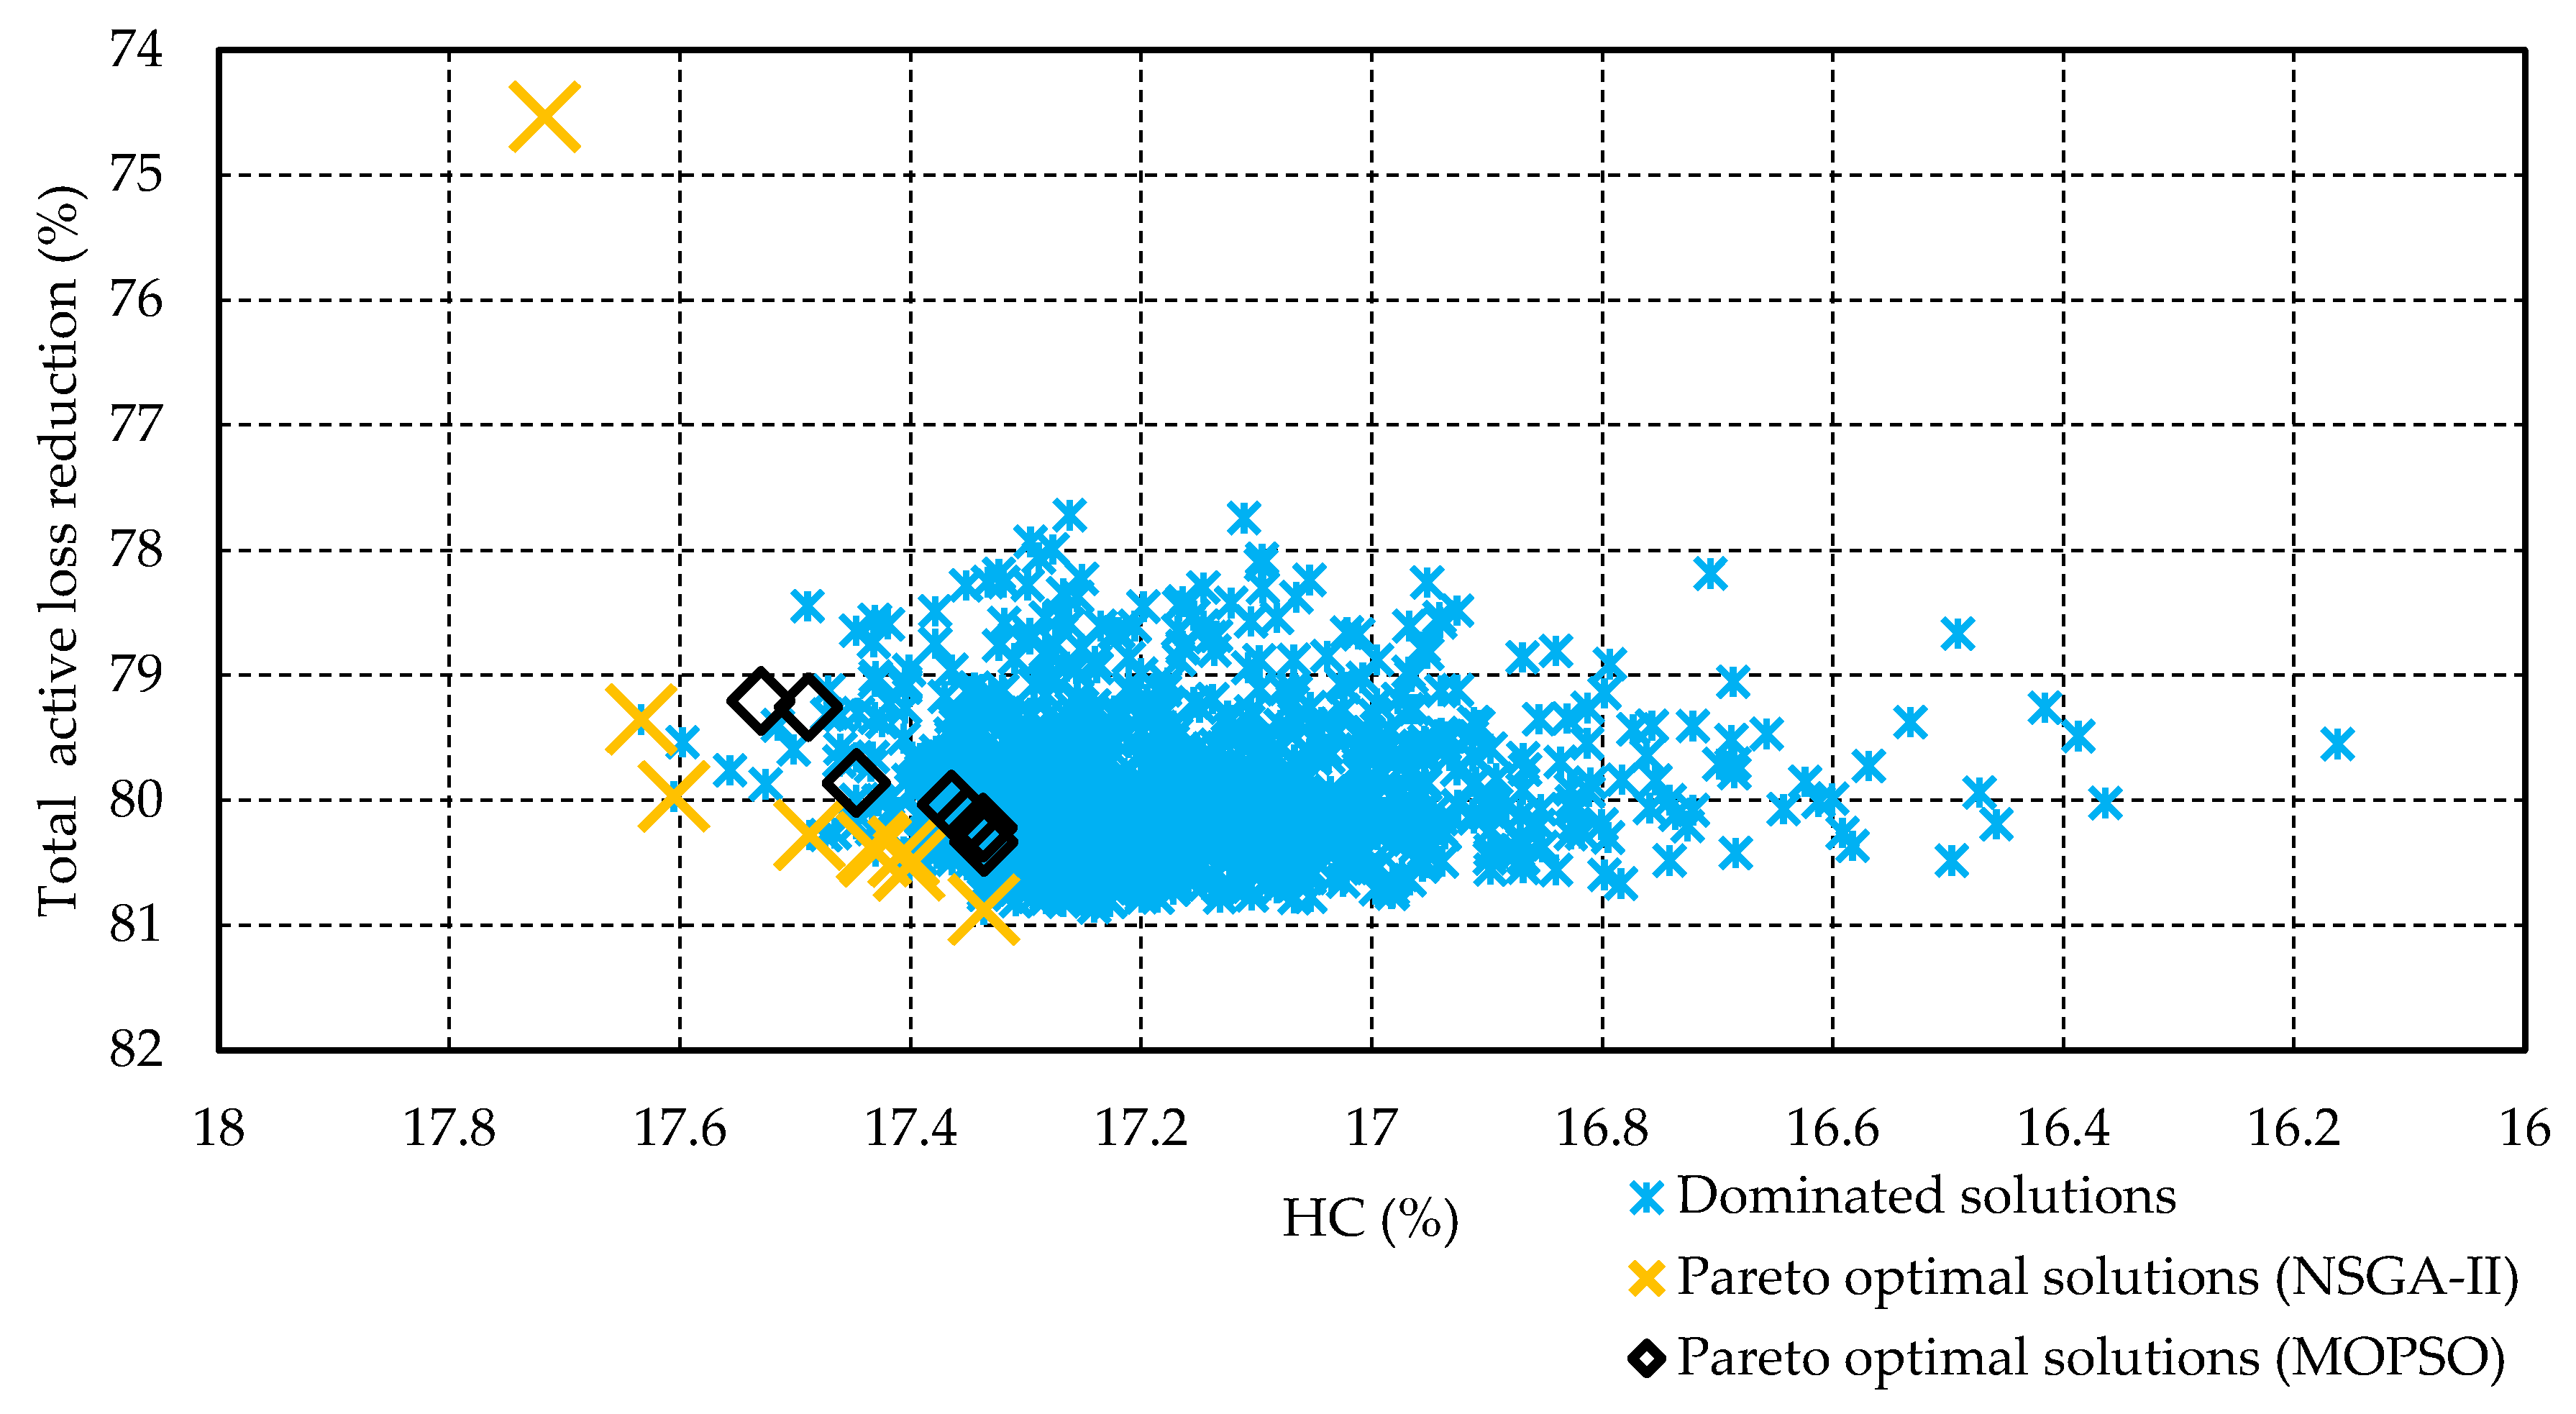


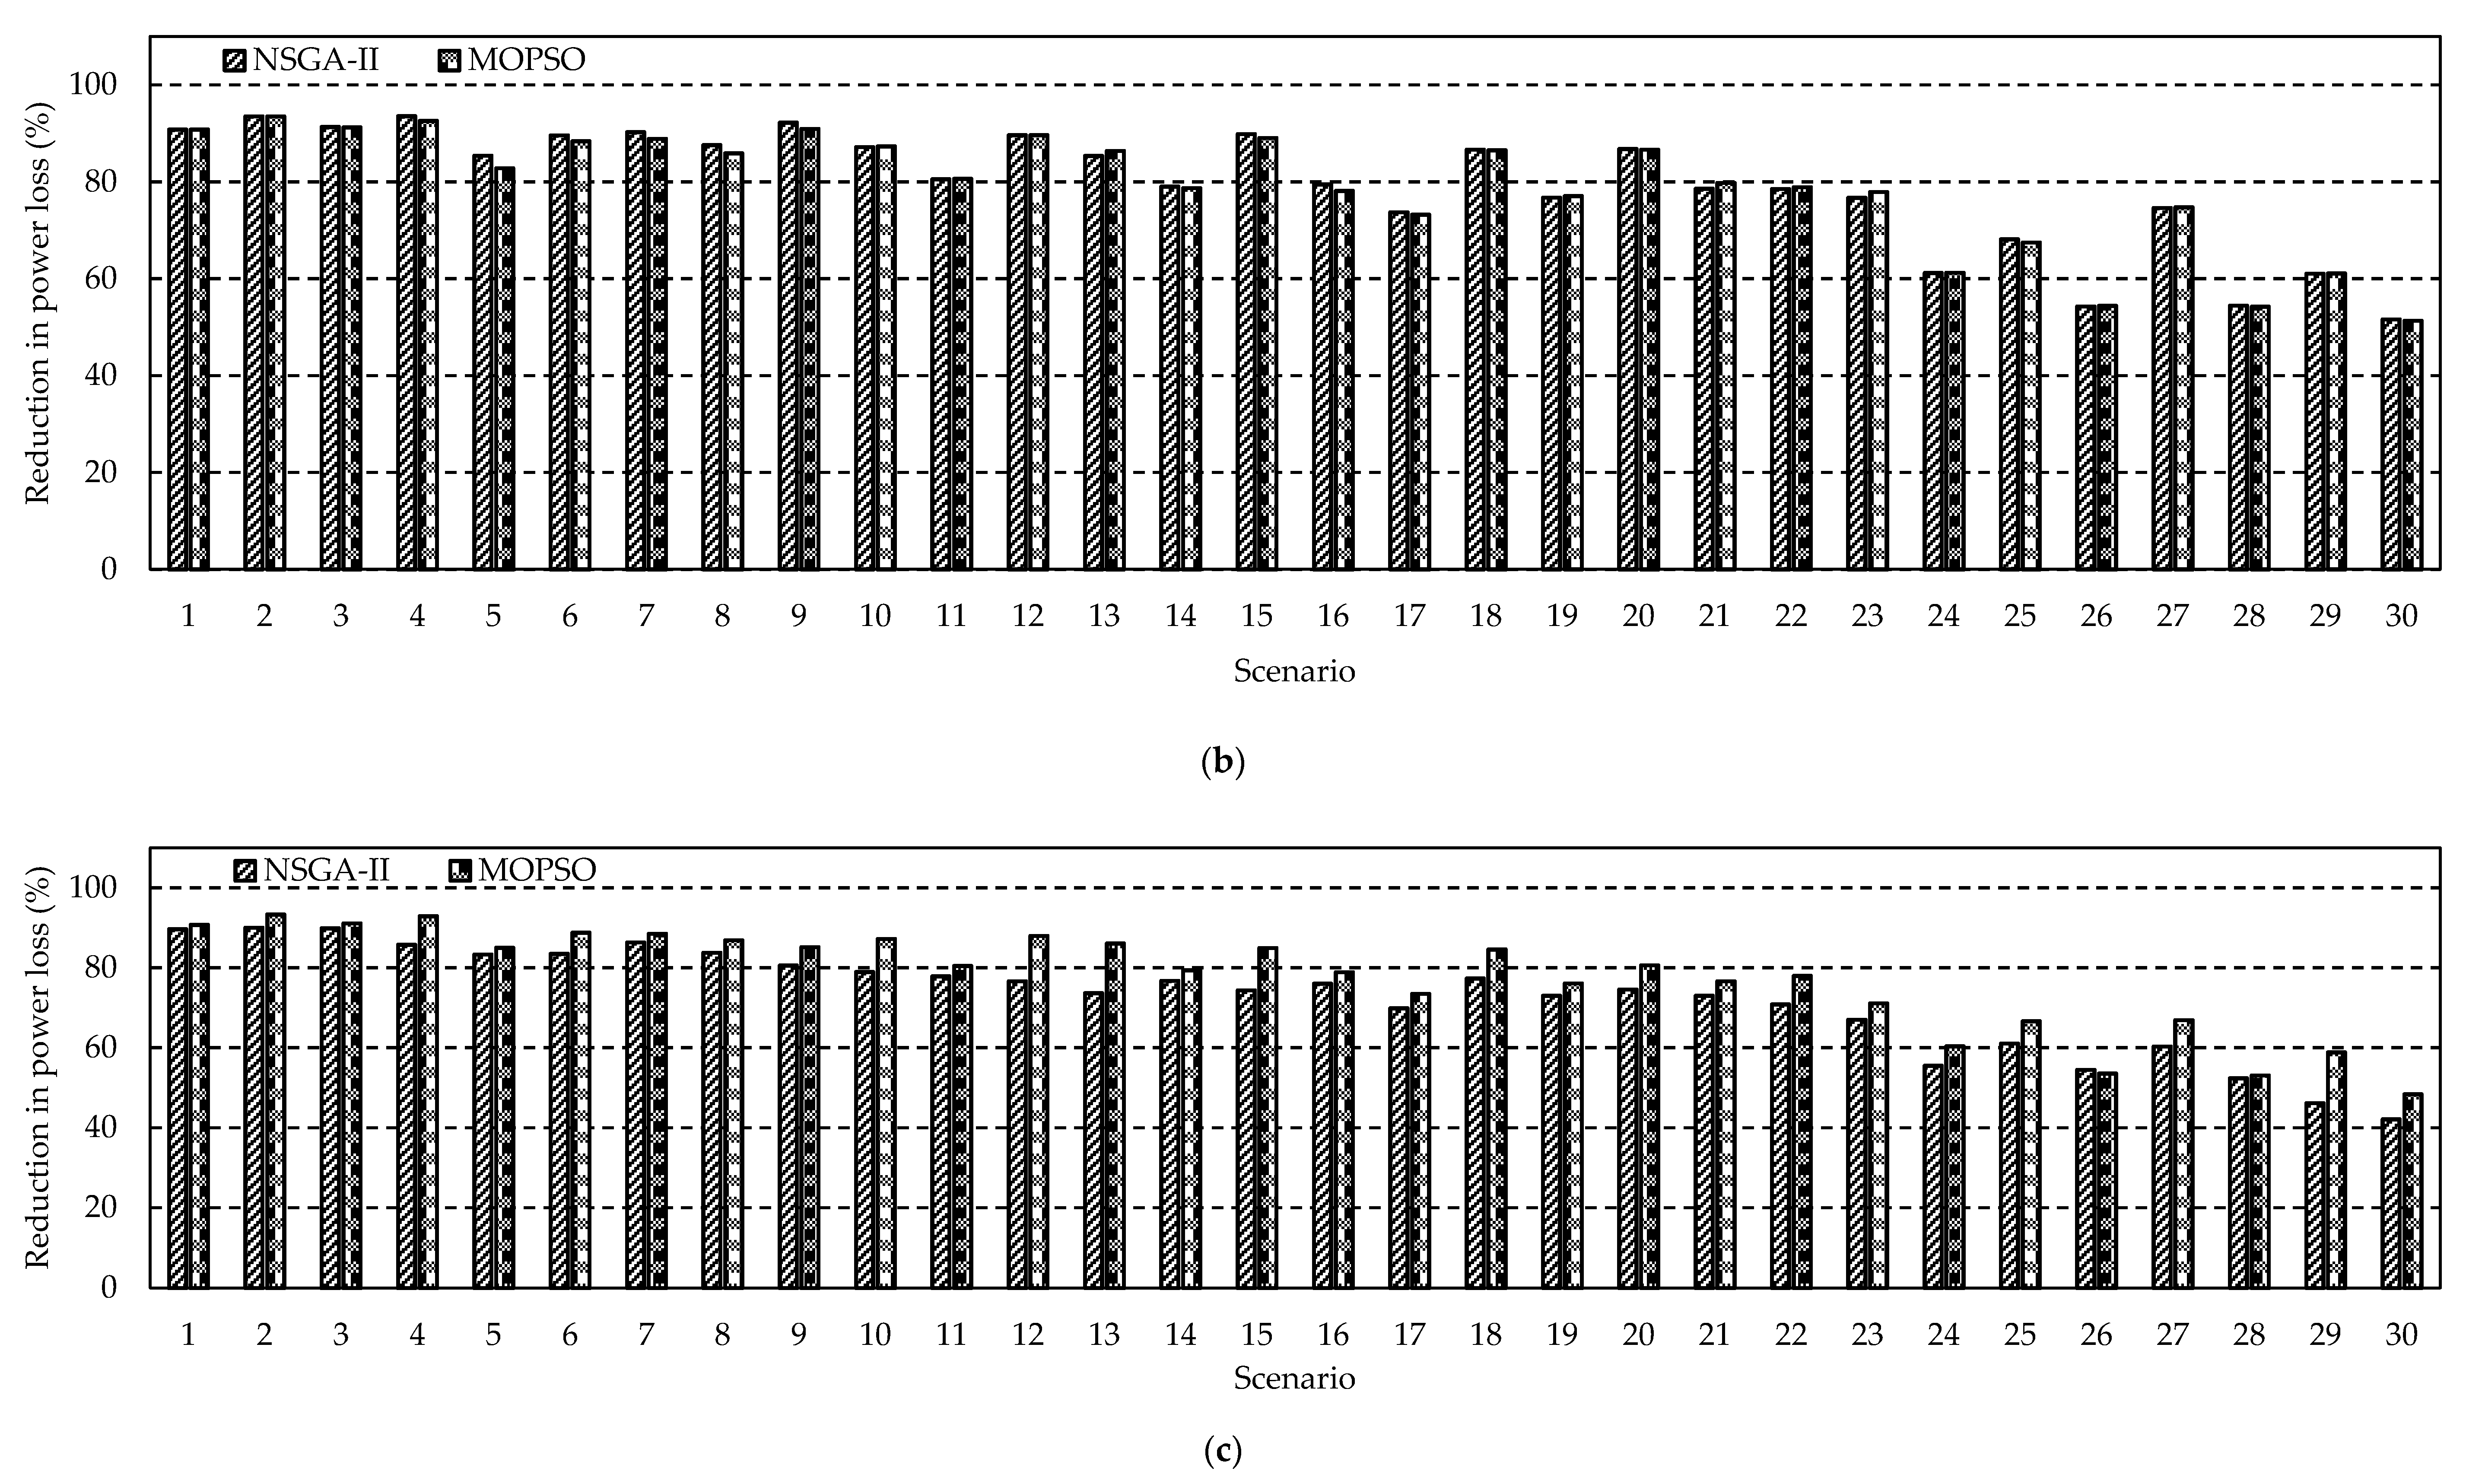
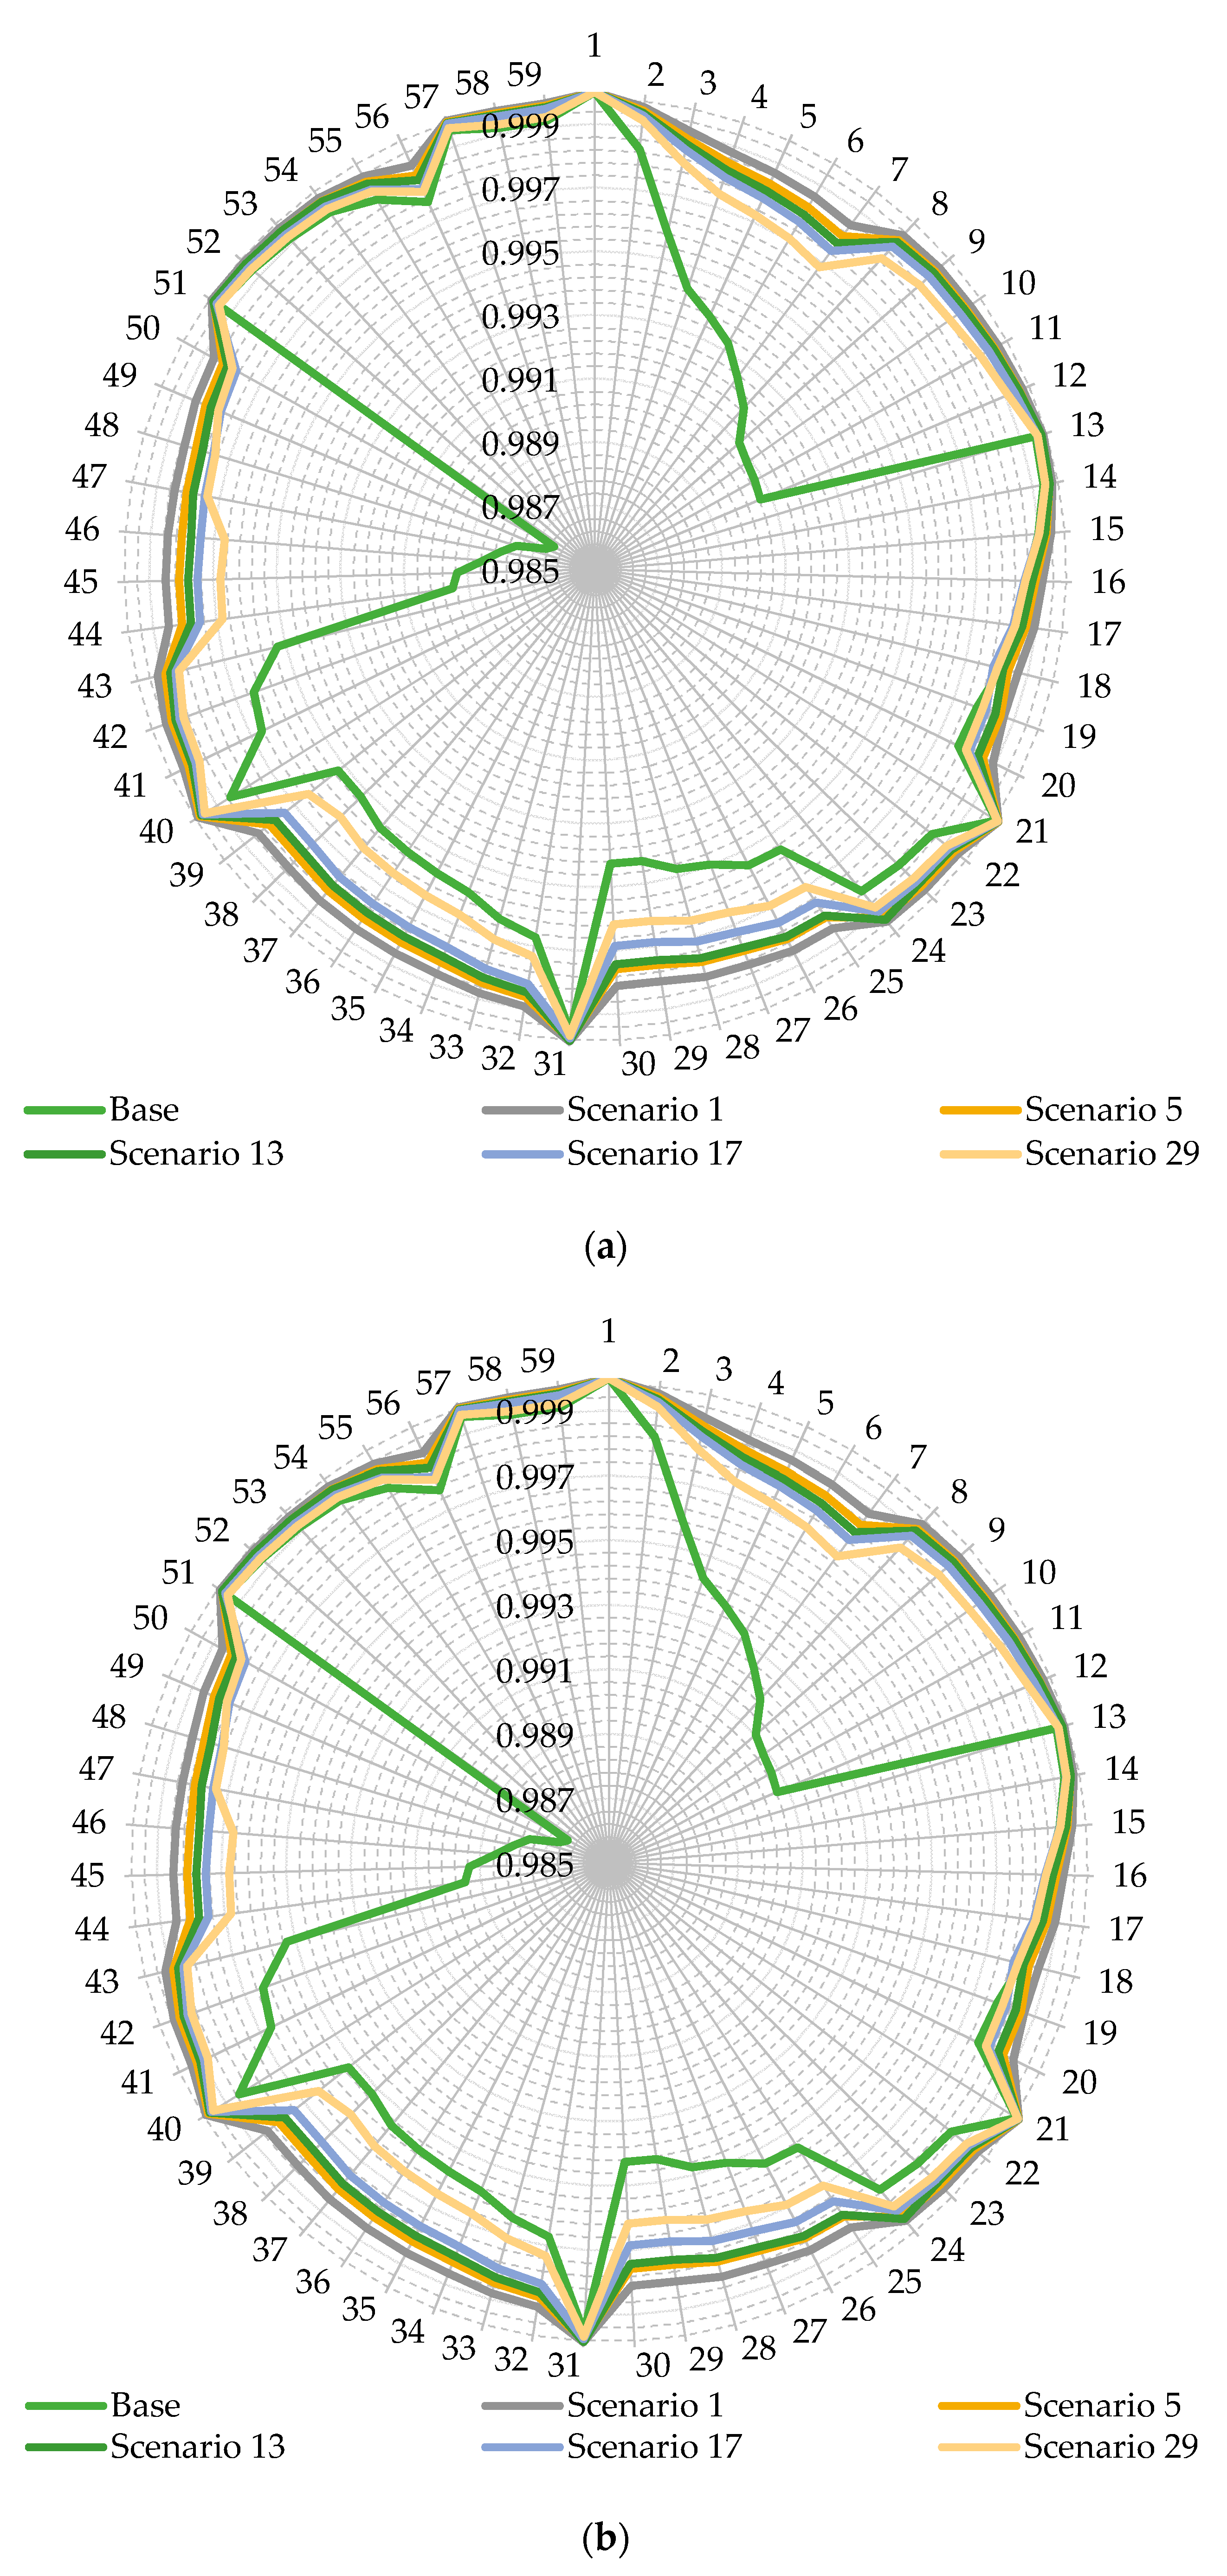
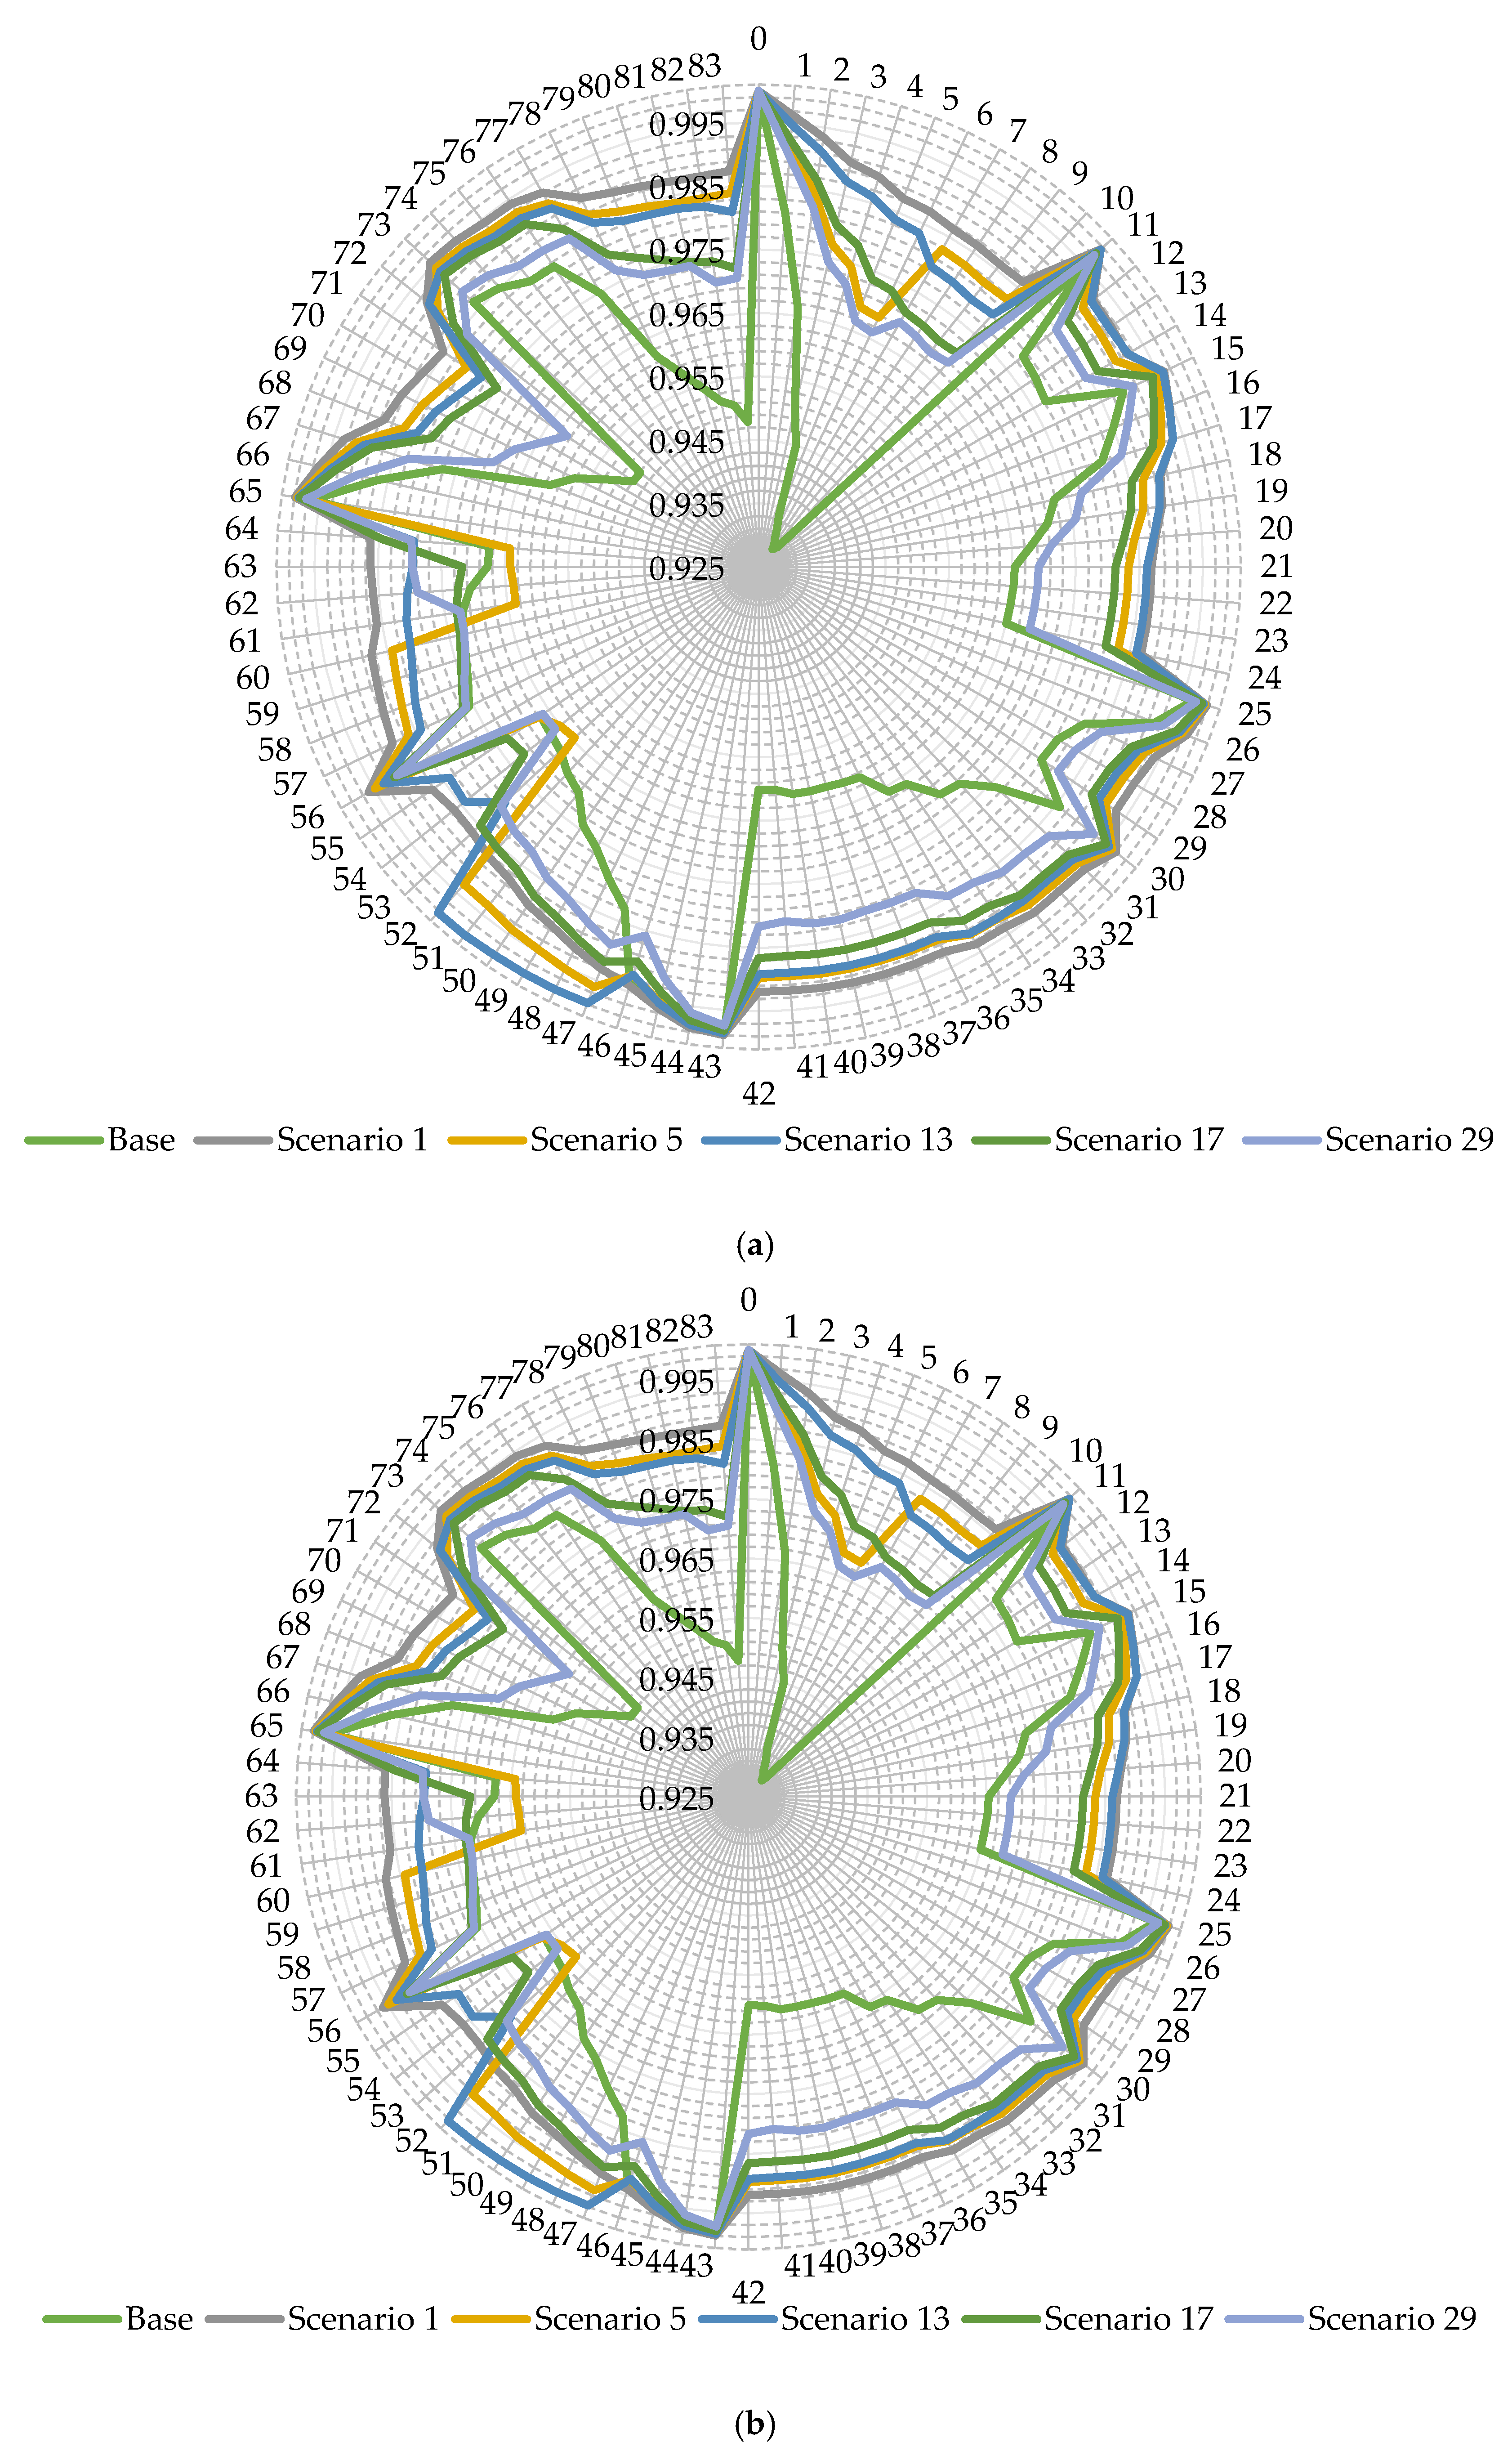
| s | (%) | (m/s) | s | (%) | (m/s) | ||||
|---|---|---|---|---|---|---|---|---|---|
| 1 | 33.09869 | 0 | 0 | 0.02363 | 16 | 54.70679 | 6.9 | 0 | 0.03664 |
| 2 | 33.82429 | 8.1 | 0 | 0.02432 | 17 | 54.97036 | 0 | 0 | 0.03916 |
| 3 | 34.79878 | 4.6 | 0 | 0.03139 | 18 | 55.89388 | 11.5 | 455 | 0.02603 |
| 4 | 34.85638 | 11.5 | 0 | 0.02454 | 19 | 55.97981 | 0 | 263 | 0.02180 |
| 5 | 42.43202 | 3.5 | 0 | 0.04030 | 20 | 58.78500 | 10.4 | 856 | 0.01712 |
| 6 | 43.78283 | 10.4 | 0 | 0.05023 | 21 | 59.61178 | 4.6 | 529 | 0.02957 |
| 7 | 44.43556 | 5.8 | 448 | 0.01507 | 22 | 60.01654 | 11.5 | 1 | 0.02546 |
| 8 | 45.37022 | 8.1 | 0 | 0.09349 | 23 | 65.52149 | 4.6 | 842 | 0.01507 |
| 9 | 46.58196 | 9.2 | 900 | 0.04692 | 24 | 69.68230 | 4.6 | 0 | 0.02386 |
| 10 | 46.80610 | 12.7 | 0 | 0.03744 | 25 | 70.07522 | 9.2 | 0 | 0.03219 |
| 11 | 47.00383 | 0 | 0 | 0.04441 | 26 | 72.52334 | 0 | 0 | 0.01393 |
| 12 | 47.66340 | 13.8 | 520 | 0.02420 | 27 | 76.89657 | 10.4 | 935 | 0.03984 |
| 13 | 48.58249 | 16.1 | 0 | 0.02877 | 28 | 78.68899 | 6.9 | 0 | 0.05479 |
| 14 | 49.39537 | 3.5 | 0 | 0.06975 | 29 | 86.35351 | 13.8 | 363 | 0.01062 |
| 15 | 49.46533 | 13.8 | 814 | 0.04384 | 30 | 93.01955 | 10.4 | 478 | 0.01564 |
| Distribution Network | Feeders | Nodes Count | Lines Count | Tie-Lines Count | Load (MVA) |
|---|---|---|---|---|---|
| 16-node | 3 | 13 | 16 | 3 | 28.7 + 17.3 |
| 59-node | 8 | 59 | 64 | 6 | 50.348 + 21.448 |
| 69-node | 1 | 69 | 73 | 5 | 3.80219 + 2.6946 |
| 83-node | 11 | 83 | 96 | 13 | 28.4 + 20.7 |
| 415-node | 55 | 415 | 480 | 65 | 141.8 + 103.5 |
| 880-node | 7 | 873 | 900 | 27 | 124.9 + 74.4 i |
| Parameter | Value | Parameter | Value |
|---|---|---|---|
| (m/s) | 3 | (W/) [29] | 150 |
| (m/s) | 26 | (MW) | [0,50] |
| (m/s) | 15 | (A) | 300 |
| (MW) | [0,50] | (p.u.) | 0.95 |
| (W/) [29] | 1000 | (p.u.) | 1.05 |
| System | WT Nodes | PV Nodes |
|---|---|---|
| 16-node | 4,5,16 | 8,9,12 |
| 59-node | 13,24,31,52,55,56 | 2,7,22,29,43,50 |
| 69-node | 7,8,16,17,18,37,40,54 | 11,12,21,38,39,48,50,53 |
| 83-node | 14,17,18,45,51,52,53,54,58,81 | 6,12,13,19,28,31,34,71,75,79 |
| 415-node | 24,27,28,62,63,64,68,91,118,121, 122,156,157,158,162,185,212,215,216,243, 249,250,251,252,256,279,305,306,309,310, 326,337,343,344,345,346,350,373,399,400, 403,404,420,431,437,438,439,440,444,467 | 16,22,23,29,38,41,44,55,61,81,85,89,110, 116,117,123,132,135,138,149,155,175,179, 183,204,210,211,217,226,229,232,269,273, 277,298,304,311,320,323,363,367,371,392, 398,405,414,417,457,461,465 |
| 880-node | 13,18,43,53,54,59,89,90,101,122,137,140, 144,146,151,171,174,196,214,219,244,254, 255,260,290,291,302,323,338,341,345,350, 351,362,383,389,393,398,399,410,416,420, 440,455,458,464,465,470,498,500,501,512, 533,548,551,555,558,560,561,593,599,603, 606,608,609,620,626,630,633,650,665,668, 670,672,673,705,720,723,727,730,732,733, 765,771,775,778,780,781,792,798,802,805, 822,837,840,842,848,852,855,872 | 11,19,20,33,40,52,70,80,85,87,94,95,111, 112,138,139,152,153,172,173,185,186,212, 220,221,234,241,253,271,281,286,288,295, 296,312,313,339,340,348,355,356,372,373, 387,388,396,403,414,415,423,429,430,456, 457,463,481,491,496,505,506,522,523,549, 550,565,566,582,583,597,598,613,624,625, 639,640,666,667,677,678,694,695,721,722, 737,738,754,755,769,770,785,796,797,811, 812,838,839,846,847,861,862 |
| System | Index | Initial | NSGA-II | MOPSO |
|---|---|---|---|---|
| 16-node | (%) | - | 17.9159 | 13.6892 |
| (%) | 0 | 79.5223 | 79.9342 | |
| 1.1432 | 0.7997 | 0.7858 | ||
| 0.1111 | 0.0750 | 0.0834 | ||
| 0.0539 | 0.0485 | 0.0452 | ||
| min (p.u.) | 0.9715 | 0.9778 | 0.9778 | |
| max (p.u.) | 1 | 1.0039 | 1.0056 | |
| Time (h) | - | 3.3254 | 5.7375 | |
| 59-node | (%) | - | 18.087 | 14.05 |
| (%) | 0 | 83.3078 | 81.8076 | |
| 3.6844 | 2.4137 | 2.9178 | ||
| 0.1407 | 0.0844 | 0.0847 | ||
| 0.0666 | 0.0549 | 0.0523 | ||
| min (p.u.) | 0.9874 | 0.9944 | 0.9931 | |
| max (p.u.) | 1 | 1.0004 | 1.0029 | |
| Time (h) | - | 5.3130 | 6.2609 | |
| 69-node | (%) | - | 17.0725 | 18.6119 |
| (%) | 0 | 89.1300 | 87.9905 | |
| 1.2040 | 0.5814 | 0.6098 | ||
| 0.9485 | 0.3513 | 0.3198 | ||
| 0.4003 | 0.2609 | 0.2681 | ||
| min (p.u.) | 0.9161 | 0.9554 | 0.9536 | |
| max (p.u.) | 1 | 1.0036 | 1.0140 | |
| Time (h) | - | 1.5584 | 0.9694 | |
| 83-node | (%) | - | 17.9875 | 17.6474 |
| (%) | 0 | 80.7985 | 80.3160 | |
| 4.3873 | 3.0877 | 3.0516 | ||
| 1.3348 | 1.0697 | 1.1120 | ||
| 0.6173 | 0.5900 | 0.6005 | ||
| min (p.u.) | 0.9339 | 0.9601 | 0.9589 | |
| max (p.u.) | 1 | 1 | 1 | |
| Time (h) | - | 9.1571 | 8.8585 | |
| 415-node | (%) | - | 17.7173 | 17.5299 |
| (%) | 0 | 74.5320 | 79.2044 | |
| 21.9362 | 19.3506 | 16.4757 | ||
| 6.6732 | 6.0285 | 5.3153 | ||
| 3.0863 | 3.0565 | 2.9472 | ||
| min (p.u.) | 0.9339 | 0.9511 | 0.9566 | |
| max (p.u.) | 1 | 1.0066 | 1.0040 | |
| Time (h) | - | 74.2285 | 74.3252 | |
| 880-node | (%) | - | 18.0692 | 18.0224 |
| (%) | 0 | 93.5010 | 93.4466 | |
| 4.1141 | 1.2709 | 1.3006 | ||
| 6.0015 | 1.7829 | 1.7772 | ||
| 0.2474 | 0.1490 | 0.1439 | ||
| min (p.u.) | 0.9593 | 0.9935 | 0.9936 | |
| max (p.u.) | 1 | 1 | 1.0004 | |
| Time (h) | - | 105.7501 | 104.7001 |
| WT Node | WT Size | WT Node | WT Size | PV Node | PV Size | PV Node | PV Size |
|---|---|---|---|---|---|---|---|
| 16-node distribution network | |||||||
| 4 | 2 | 5 | 1 | 8 | 2.8 | 9 | 3 |
| 16 | 5.9 | - | - | 12 | 1.8 | - | - |
| 59-node distribution network | |||||||
| 13 | 1.7 | 52 | 2.1 | 2 | 2.4 | 29 | 1.4 |
| 24 | 5.5 | 55 | 2.8 | 7 | 2.8 | 43 | 2.2 |
| 31 | 1.7 | 56 | 2.3 | 22 | 2.3 | 50 | 1.7 |
| 69-node distribution network | |||||||
| 7 | 0.1 | 18 | 0.1 | 11 | 0 | 39 | 0.2 |
| 8 | 0.2 | 37 | 0.2 | 12 | 0.2 | 48 | 0.2 |
| 16 | 0.1 | 40 | 0.1 | 21 | 0.2 | 50 | 0 |
| 17 | 0.1 | 54 | 0.1 | 38 | 0.2 | 53 | 0.2 |
| 83-node distribution network | |||||||
| 14 | 0.8 | 52 | 0.4 | 6 | 0.8 | 31 | 0.7 |
| 17 | 0.7 | 53 | 0.7 | 12 | 0.5 | 34 | 1 |
| 18 | 1 | 54 | 0.7 | 13 | 0.7 | 71 | 1.1 |
| 45 | 1.1 | 58 | 0.9 | 19 | 0.2 | 75 | 0.5 |
| 51 | 0.9 | 81 | 1.8 | 28 | 0.7 | 79 | 1 |
| 415-node distribution network | |||||||
| 24 | 0 | 279 | 3 | 16 | 0 | 210 | 0.2 |
| 27 | 0 | 305 | 2 | 22 | 0 | 211 | 0 |
| 28 | 0.9 | 306 | 0 | 23 | 0.3 | 217 | 1.8 |
| 62 | 0 | 309 | 3.3 | 29 | 0 | 226 | 2 |
| 63 | 2.2 | 310 | 2 | 38 | 0 | 229 | 0 |
| 64 | 0.5 | 326 | 0 | 41 | 3.3 | 232 | 1.1 |
| 68 | 0 | 337 | 0 | 44 | 2 | 269 | 0 |
| 91 | 0 | 343 | 1.5 | 55 | 0 | 273 | 0 |
| 118 | 3.5 | 344 | 0 | 61 | 2.2 | 277 | 0.8 |
| 121 | 2.8 | 345 | 3.3 | 81 | 0 | 298 | 0 |
| 122 | 2.8 | 346 | 3.5 | 85 | 1.7 | 304 | 0 |
| 156 | 0.9 | 350 | 0 | 89 | 0 | 311 | 1.5 |
| 157 | 0 | 373 | 0 | 110 | 2.8 | 320 | 2.9 |
| 158 | 2 | 399 | 0 | 116 | 0 | 323 | 0 |
| 162 | 1.9 | 400 | 0 | 117 | 0 | 363 | 0 |
| 185 | 0 | 403 | 0 | 123 | 0 | 367 | 0 |
| 212 | 0 | 404 | 1.7 | 132 | 0 | 371 | 0 |
| 215 | 0 | 420 | 3.6 | 135 | 0 | 392 | 0 |
| 216 | 0 | 431 | 0 | 138 | 0 | 398 | 0.4 |
| 243 | 0 | 437 | 0 | 149 | 0 | 405 | 1.2 |
| 249 | 0 | 438 | 0 | 155 | 0 | 414 | 1.7 |
| 250 | 0 | 439 | 0 | 175 | 0 | 417 | 0 |
| 251 | 0 | 440 | 0 | 179 | 0 | 457 | 1.9 |
| 252 | 0 | 444 | 0 | 183 | 2.1 | 461 | 2.5 |
| 256 | 0 | 467 | 2.8 | 204 | 0 | 465 | 3.3 |
| WT Node | WT Size | WT Node | WT Size | PV Node | PV Size | PV Node | PV Size |
|---|---|---|---|---|---|---|---|
| 16-node distribution network | |||||||
| 4 | 1 | 5 | 1 | 8 | 4.2 | 9 | 4.3 |
| 16 | 1 | - | - | 12 | 4.7 | - | - |
| 59-node distribution network | |||||||
| 13 | 1 | 52 | 1 | 2 | 2.1 | 29 | 1 |
| 24 | 1 | 55 | 1 | 7 | 4.4 | 43 | 0 |
| 31 | 1 | 56 | 1 | 22 | 2.9 | 50 | 12.2 |
| 69-node distribution network | |||||||
| 7 | 0 | 18 | 0.1 | 11 | 0 | 39 | 0.3 |
| 8 | 0.3 | 37 | 0 | 12 | 0.3 | 48 | 0 |
| 16 | 0.4 | 40 | 0 | 21 | 0.3 | 50 | 0 |
| 17 | 0 | 54 | 0.5 | 38 | 0 | 53 | 0 |
| 83-node distribution network | |||||||
| 14 | 1 | 52 | 0.9 | 6 | 0.7 | 31 | 0.6 |
| 17 | 0.7 | 53 | 0.8 | 12 | 1.4 | 34 | 0 |
| 18 | 0.5 | 54 | 0.9 | 13 | 0.3 | 71 | 0.7 |
| 45 | 0.6 | 58 | 1 | 19 | 1.7 | 75 | 0.5 |
| 51 | 1 | 81 | 1 | 28 | 0.8 | 79 | 1.2 |
| 415-node distribution network | |||||||
| 24 | 0 | 279 | 3 | 16 | 0 | 210 | 0.8 |
| 27 | 0 | 305 | 2 | 22 | 0 | 211 | 0 |
| 28 | 0.9 | 306 | 0 | 23 | 0 | 217 | 2.6 |
| 62 | 0 | 309 | 3.3 | 29 | 0.4 | 226 | 0.7 |
| 63 | 2.2 | 310 | 2 | 38 | 0 | 229 | 0 |
| 64 | 0.5 | 326 | 0 | 41 | 0 | 232 | 2.5 |
| 68 | 0 | 337 | 0 | 44 | 0.3 | 269 | 2.5 |
| 91 | 0 | 343 | 1.5 | 55 | 1.7 | 273 | 0 |
| 118 | 3.5 | 344 | 0 | 61 | 0 | 277 | 0 |
| 121 | 2.8 | 345 | 3.3 | 81 | 0 | 298 | 0 |
| 122 | 2.8 | 346 | 3.5 | 85 | 0.5 | 304 | 2.6 |
| 156 | 0.9 | 350 | 0 | 89 | 1.6 | 311 | 0 |
| 157 | 0 | 373 | 0 | 110 | 2.3 | 320 | 1.9 |
| 158 | 2 | 399 | 0 | 116 | 0.1 | 323 | 0.1 |
| 162 | 1.9 | 400 | 0 | 117 | 2.3 | 363 | 2.4 |
| 185 | 0 | 403 | 0 | 123 | 0 | 367 | 0 |
| 212 | 0 | 404 | 1.7 | 132 | 1.6 | 371 | 0.4 |
| 215 | 0 | 420 | 3.6 | 135 | 0 | 392 | 0 |
| 216 | 0 | 431 | 0 | 138 | 2.6 | 398 | 0 |
| 243 | 0 | 437 | 0 | 149 | 2.6 | 405 | 0 |
| 249 | 0 | 438 | 0 | 155 | 0 | 414 | 1.2 |
| 250 | 0 | 439 | 0 | 175 | 0.9 | 417 | 0.5 |
| 251 | 0 | 440 | 0 | 179 | 2.3 | 457 | 0 |
| 252 | 0 | 444 | 0 | 183 | 1.1 | 461 | 2 |
| 256 | 0 | 467 | 2.8 | 204 | 1.5 | 465 | 0 |
| Configuration (Tie-Lines) | ||
|---|---|---|
| NSGA-II | MOPSO | |
| 1 | 7,8,16 | 7,8,16 |
| 5 | ||
| 13 | 3,7,8 | |
| 17 | 7,8,16 | |
| 29 | 4,7,8 | |
| Configuration (Tie-Lines) | ||
|---|---|---|
| NSGA-II | MOPSO | |
| 1 | 7,18,46,60,63,64 | 7,19,46,60,63,64 |
| 5 | 7,17,47,60,63,64 | 7,18,46,60,63,64 |
| 13 | 7,17,37,47,60,63 | |
| 17 | 7,17,38,48,60,63 | |
| 29 | 7,18,38,46,60,63 | 7,18,38,46,60,63 |
| Configuration (Tie-Lines) | ||
|---|---|---|
| NSGA-II | MOPSO | |
| 1 | 14,47,50,69,70 | 14,46,50,69,70 |
| 5 | 14,44,50,69,70 | 14,18,45,50,69 |
| 13 | 13,44,50,69,70 | 14,20,46,50,69 |
| 17 | 14,45,50,69,70 | 13,20,45,50,69 |
| 29 | 13,46,50,69,70 | 12,13,47,50,69 |
| Configuration (Tie-Lines) | ||
|---|---|---|
| NSGA-II | MOPSO | |
| 1 | 6,12,33,38,41,54,60,71,82,85,88,89,91 | 6,33,41,54,60,71,82,85,87,88,89,91,92 |
| 5 | 6,33,38,41,54,60,71,82,85,87,88,89,91 | 6,33,41,52,60,71,82,85,87,88,89,91,92 |
| 13 | 6,33,41,53,60,71,78,85,87,88,89,91,92 | 6,33,41,52,53,71,85,87,88,89,90,91,92 |
| 17 | 6,32,41,53,60,71,81,85,87,88,89,91,92 | 6,33,41,53,63,71,85,87,88,89,90,91,92 |
| 29 | 6,32,41,54,60,71,82,85,87,88,89,91,92 | 6,33,38,41,53,61,71,81,85,87,88,89,91 |
| Configuration (Tie-Lines) | ||
|---|---|---|
| NSGA-II | MOPSO | |
| 1 | 6,54,142,143,154,164,220,255,302,320,330, | 6,33,38,41,54,61,71,82,89,116,121,124, |
| 336,338,417,418,419,420,421,422,423,424, | 144,154,165,172,199,204,207,219,226, | |
| 425,426,427,428,430,432,433,434,436,437, | 237,248,255,282,287,290,310,320,331, | |
| 438,439,442,443,444,445,446,447,448,449, | 338,344,365,370,373,385,392,403,414, | |
| 450,451,452,453,456,458,459,460,462,463, | 417,419,420,421,423,428,430,432,433, | |
| 464,465,466,469,470,471,472,473,474,475, | 434,436,443,445,446,447,449,454,456, | |
| 476,477,478,479 | 458,459,460,462,469,000,000,000 | |
| 5 | 6,54,141,143,154,164,220,255,301,302,320, | 6,33,38,41,54,61,71,82,89,116,121,124, |
| 330,336,338,417,418,419,420,421,422,423, | 144,154,165,172,199,204,207,219,226, | |
| 424,425,426,427,428,430,432,433,434,436, | 237,248,255,261,282,287,290,310,317, | |
| 437,438,439,442,443,444,445,446,447,448, | 331,338,344,365,370,373,385,392,403, | |
| 449,450,451,452,453,456,458,459,460,462, | 414,417,419,420,421,423,428,430,432, | |
| 463,464,465,469,470,471,472,473,474,475, | 433,434,436,443,445,446,447,449,454, | |
| 476,477,478,479 | 456,459,460,462,469,000,000,000 | |
| 13 | 52,54,140,143,151,164,172,220,255,301, | 6,33,38,41,53,61,71,82,89,116,121,124, |
| 302,320,330,338,417,418,419,420,421,422, | 144,154,165,172,199,204,207,219,226, | |
| 423,424,425,426,428,430,432,433,434,436, | 237,248,255,261,282,287,290,310,317, | |
| 437,438,439,443,444,445,446,447,448,449, | 331,338,344,365,370,373,384,392,403, | |
| 450,451,452,453,456,458,459,460,462,463, | 414,417,419,420,421,423,428,430,432, | |
| 464,465,467,469,470,471,472,473,474,475, | 433,434,436,443,445,446,447,449,454, | |
| 476,477,478,479 | 456,459,460,462,469,000,000,000 | |
| 17 | 52,54,141,143,151,164,172,220,255,287, | 6,33,38,41,53,61,71,82,89,116,121,124, |
| 301,302,320,330,338,417,418,419,420,421, | 144,154,165,172,199,204,207,219,226, | |
| 422,423,424,425,426,428,430,432,433,434, | 237,248,255,261,262,282,287,290,310, | |
| 436,437,438,439,443,444,445,446,447,448, | 319,331,338,344,365,370,373,385,392, | |
| 449,450,451,452,453,456,458,459,460,462, | 403,414,417,419,420,421,423,428,430, | |
| 464,465,467,469,470,471,472,473,474, | 432,433,434,436,443,445,446,447,449, | |
| 475,476,477,478,479 | 454,456,460,462,469,000,000,000 | |
| 29 | 6,12,33,38,41,54,61,71,82,89,95,116,121, | 6,33,38,41,54,61,71,82,89,116,121,124, |
| 124,137,144,152,165,172,178,199,204, | 137,144,154,165,172,199,204,207,219, | |
| 207,220,227,237,248,255,261,282,287, | 226,237,248,255,261,282,287,290,310, | |
| 290,310,320,331,338,344,365,370,373, | 317,331,338,344,365,370,373,385,392, | |
| 386,393,403,414,417,420,421,423,430, | 403,414,417,419,420,421,423,430,432, | |
| 433,434,436,443,446,447,449,454,456, | 433,434,436,443,445,446,447,449,454, | |
| 459,460,462,469,472,000,000 | 456,459,460,462,469,000,000,000 | |
| Number of Scenarios | NSGA-II | MOPSO | ||
|---|---|---|---|---|
| HC (%) | HC (%) | |||
| 10 | 17.1015 | 83.5396 | 12.23 | 72.037 |
| 20 | 18.8370 | 84.5515 | 12.02 | 80.411 |
| 30 | 18.0870 | 83.3078 | 14.05 | 81.807 |
| 40 | 18.5500 | 84.5329 | 11.13 | 78.225 |
| 50 | 17.0012 | 84.3349 | 11.37 | 80.124 |
| Average | 17.9153 | 84.0533 | 12.16 | 78.5208 |
| Standard deviation | 0.8336 | 0.5867 | 1.1491 | 3.8428 |
| Optimizer | Year | HC (%) | Average Time | |
|---|---|---|---|---|
| NSGA-II | 2002 | 18.0870 | 83.3078 | 5.3130 |
| MOPSO | 2002 | 14.0500 | 81.8070 | 6.2609 |
| MOFPA | 2014 | 12.3543 | 81.1698 | 4.0531 |
| MOMVO | 2017 | 12.3953 | 72.8587 | 2.6988 |
| Index | Initial | [15] | [41] | [44] | Proposed |
|---|---|---|---|---|---|
| HC (%) | 0 | N/A | 60.71 | N/A | 17.9875 |
| Power loss (kW) | 532.0 | 469.9 | N/A | 471.1 | 104.718 |
| Min voltage (p.u.) | 0.929 | 0.953 | 0.951 | 0.952 | 0.9589 |
| DGs uncertainty consideration | No | N/A | No | N/A | Yes |
| Load uncertainty consideration | No | N/A | Yes | N/A | Yes |
| Index | Initial | [15] | [15] | [45] | Proposed |
|---|---|---|---|---|---|
| HC (%) | 0 | N/A | N/A | 58.68 | 17.7173 |
| Power loss (kW) | 2660.0 | 2350.7 | 2359.9 | 1534.3 | 677.4488 |
| Min voltage (p.u.) | 0.929 | N/A | N/A | 0.951 | 0.9511 |
| DGs uncertainty consideration | No | N/A | N/A | No | Yes |
| Load uncertainty consideration | No | N/A | N/A | Yes | Yes |
| Index | Initial | [16] | [17] | Proposed |
|---|---|---|---|---|
| HC (%) | 0 | N/A | N/A | 18.0692 |
| Power loss (kW) | 1496.4 | 461.0 | 461.4 | 98.065 |
| Min voltage (p.u.) | 0.956 | 0.992 | 0.982 | 0.9511 |
| DGs uncertainty consideration | No | N/A | N/A | Yes |
| Load uncertainty consideration | No | N/A | N/A | Yes |
Publisher’s Note: MDPI stays neutral with regard to jurisdictional claims in published maps and institutional affiliations. |
© 2020 by the authors. Licensee MDPI, Basel, Switzerland. This article is an open access article distributed under the terms and conditions of the Creative Commons Attribution (CC BY) license (http://creativecommons.org/licenses/by/4.0/).
Share and Cite
Ali, Z.M.; Diaaeldin, I.M.; H. E. Abdel Aleem, S.; El-Rafei, A.; Abdelaziz, A.Y.; Jurado, F. Scenario-Based Network Reconfiguration and Renewable Energy Resources Integration in Large-Scale Distribution Systems Considering Parameters Uncertainty. Mathematics 2021, 9, 26. https://doi.org/10.3390/math9010026
Ali ZM, Diaaeldin IM, H. E. Abdel Aleem S, El-Rafei A, Abdelaziz AY, Jurado F. Scenario-Based Network Reconfiguration and Renewable Energy Resources Integration in Large-Scale Distribution Systems Considering Parameters Uncertainty. Mathematics. 2021; 9(1):26. https://doi.org/10.3390/math9010026
Chicago/Turabian StyleAli, Ziad M., Ibrahim Mohamed Diaaeldin, Shady H. E. Abdel Aleem, Ahmed El-Rafei, Almoataz Y. Abdelaziz, and Francisco Jurado. 2021. "Scenario-Based Network Reconfiguration and Renewable Energy Resources Integration in Large-Scale Distribution Systems Considering Parameters Uncertainty" Mathematics 9, no. 1: 26. https://doi.org/10.3390/math9010026
APA StyleAli, Z. M., Diaaeldin, I. M., H. E. Abdel Aleem, S., El-Rafei, A., Abdelaziz, A. Y., & Jurado, F. (2021). Scenario-Based Network Reconfiguration and Renewable Energy Resources Integration in Large-Scale Distribution Systems Considering Parameters Uncertainty. Mathematics, 9(1), 26. https://doi.org/10.3390/math9010026


