Abstract
Preclinical testing and validation of therapeutic strategies developed for patients with type 1 diabetes (T1D) require a cohort of virtual patients (VPs). However, current simulators provide a limited number of VPs, lack real-life scenarios, and inadequately represent intra- and inter-day variability in insulin sensitivity and blood glucose (BG) profile. The generation of a realistic scenario was achieved by using the meal patterns, insulin profiles (basal and bolus), and exercise sessions estimated as disturbances using clinical data from a cohort of 14 T1D patients using the Medtronic 640G insulin pump provided by the Hospital Clínic de Barcelona. The UVa/Padova’s cohort of adult patients was used for the generation of a new cohort of VPs. Insulin model parameters were optimized and adjusted in a day-by-day fashion to replicate the clinical data to create a cohort of 75 VPs. All primary and secondary outcomes reflecting the BG profile of a T1D patient were analyzed and compared to the clinical data. The mean BG 166.3 versus 162.2 mg/dL ( = 0.19), coefficient of variation 32% versus 33% ( = 0.54), and percent of time in range (70 to 180 mg/dL) 59.6% versus 66.8% ( = 0.35) were achieved. The proposed methodology for generating a cohort of VPs is capable of mimicking the BG metrics of a real cohort of T1D patients from the Hospital Clínic de Barcelona. It can adopt the inter-day variations in the BG profile, similar to the observed clinical data, and thus provide a benchmark for preclinical testing of control techniques and therapy strategies for T1D patients.
1. Introduction
Type 1 diabetes (T1D) is a disorder characterized by the destruction of insulin producing beta cells in the pancreas due to an autoimmune reaction [1]. A great amount of research effort has been made in the past few decades to automate the insulin delivery for the treatment of people with T1D, leading to a rapid increase in artificial pancreas (AP) technology. A basic AP system integrates a closed-loop control algorithm, continuous glucose monitoring (CGM), and subcutaneous continuous insulin infusion for optimum blood glucose (BG) control [2]. For pre-clinical testing and validation of therapeutic strategies used in AP technology, various simulators have been developed. The most well-known simulators used in AP research are the University of Virginia/Padova (UVa/Padova) simulator [3], Oregon Health and Science University (OHSU) simulator [4], and Cambridge Simulator [5]. The use of simulators is vital in the development of healthcare technologies, which allows significant research to be performed at an accelerated rate while circumventing unnecessary risks to the patient and costs related to animal or clinical testing [6]. Simulators have played a prominent role in the development of many important areas of biomedical research, such as anesthesia administration [7], HIV therapy [8], minimal invasive surgery techniques [9], acute ischemic stroke treatment [10], drugs’ cardiotoxicity assessment [11], drugs’ metabolism prediction [12], vaccine target identification (COVID-19) [13], etc. Due to its flexibility and relative low patient risk, in silico experimentation via simulators is becoming increasingly used in healthcare research centers [14]. In addition, in silico testing of therapeutic approaches for the management of T1D is considered a prerequisite before proceeding to clinical trials [15]. However, it is important to note that computer simulations provide a safe ground for testing the new therapeutic strategies but cannot substitute clinical trials.
The main challenges for BG regulation in T1D are the disturbances in terms of meals, exercise, stress, and variability (inter-patient and intra-patient). The UVa/Padova simulator allows the incorporation of different meal scenarios for the virtual patient (VP) population, allowing researchers to analyze the effectiveness of a control algorithm [16,17,18,19,20,21,22], validate optimization and adaptation strategies for insulin delivery [23,24,25,26], develop disturbance detection algorithms for meals [27,28,29] and exercise [30], develop methods for mitigating the risks of hypoglycemia [31,32], and integrate machine learning algorithms into conventional diabetes therapy and bolus calculator for the treatment of T1D patients [33,34,35]. In the literature, the meal scenarios used for testing BG regulation effectiveness are based on typical values considering three meals per day [36,37,38,39,40,41,42,43,44,45,46,47]. However, in real life, the amount of carbohydrate intake and number of meals per day may vary patient to patient. Data from a cohort of 14 T1D patients obtained from the Hospital Clinic de Barcelona shows that daily carbohydrate (median) intake ranges from 36.79 to 186.43 g (SD = 46.85) with 3 to 7 (SD = 1.27) meals (median) per day. This difference in conventional and real scenarios can lead to under- or over-performance of the tool or methodology developed for the treatment of T1D patients. Therefore, real-life scenarios that include meals, exercise, inter-day BG variability, and other variations for use in simulation are still lacking. These types of scenarios for developing T1D management technology are vital in providing key information about safety and limitations of proposed treatment strategies, while avoiding unnecessary expenses.
Additionally, the virtual patients (VPs) available in the current T1D simulators exclude certain sub-cohorts of patients, such as high variability, hypoglycemic-prone, hypoglycemia unawareness, pregnant, menstruating, and additional comorbidities. Moreover, current simulators only offer a limited number of VPs. An academic version of the UVa/Padova simulator available for researchers consists of three groups of 10 VPs corresponding to children, adolescent, and adult populations. The original Oregon Health and Science University (OHSU) (2004) [48] simulator is composed of 6 VPs, and Chassin et al. introduced a cohort comprised of 18 virtual subjects [49].
To address current downfalls of VP populations in simulators, several methodologies to generate larger cohorts of T1D VPs have been developed. Haider et al. [50] proposed a probabilistic method for the generation of virtual subjects. Clinical data from 12 young T1D patients was used to test the methodology. Resalat et al. [4] proposed a statistical method to generate a population of T1D VPs mainly based on variants of the Hovorka model. The selection criterion of VP was based on clinical data from 20 patients undergoing artificial pancreas (AP) trials. The parameters used for comparison were percent of time (PoT) in normoglycemia (BG in 70 to 180 mg/dL), hyperglycemia (BG > 180 mg/dL), and hypoglycemia (BG < 70 mg/dL). Orozco-Lopez et al. [51] proposed a methodology to generate a large cohort of VPs. An already available cohort in the OHSU simulator was utilized to generate more VPs by establishing a relationship between the subject’s parameters in terms of covariance illustrated in the Hovorka model.
The first UVa/Padova simulator was approved by the FDA in 2008 [3] for a single-meal scenario only. The VPs were represented by a set of model parameters which were extracted randomly from joint distributions of parameters. A new version was published in 2014 [52], in which improved glucose kinetics in hypoglycemia and glucagon dynamics were implemented. The virtual population was also improved in terms of clinical parameters such as carbohydrates ratio and correction factor. This version was also approved by the FDA for single-meal scenarios only. It was mentioned that including day-by-day variations in parameters was under investigation. The latest version was published in 2018 [53]. The diurnal variations in glucose due to insulin sensitivity were added to extend the scope of the simulator from single-meal to multiple meal and multiple day scenarios.
T1D simulators should offer cohorts of VPs capable of mimicking BG dynamics of real patients. In real life, the BG curves vary from day to day due to significant nonlinearities and time varying effects. In available simulators, the BG curves usually follow certain patterns depending on the meals delivered per day. In order to analyze and validate the treatment and therapeutic strategies developed for patients with T1D, VPs offering more realist BG behavior are required. This study is focused on capturing the day-to-day variations in BG and generating VPs to reflect the BG outcomes of specific real T1D cohorts.
In this work, a methodology to modify the cohort of UVa/Padova’s adult population is proposed to represent a cohort of T1D patients from the Hospital Clínic de Barcelona. This sub-cohort is not currently represented in the existing adult population. The novelty of the proposed scheme lies in the day-to-day adjustment of key physiological parameters that represent true phenomena in real T1D patients. Optimization of these parameters to capture the glycemic outcomes of the real cohort is a primary contribution of the presented study. This provides a benchmark for testing and validation of control algorithms and treatment strategies developed for AP under realistic scenarios, targeting a specific real-life cohort of T1D patients.
The paper is structured as follows: Section 2 explains the methodology used to extract real-life scenarios from clinical data and describes the modification of the adult population. Section 3 is devoted to the illustration of results, Section 4 presents a discussion of the results, and Section 5 concludes the paper.
2. Methodology
The methodology used for generating the VPs is shown in the schematic presented in Figure 1. It is composed of three steps, as explained below.
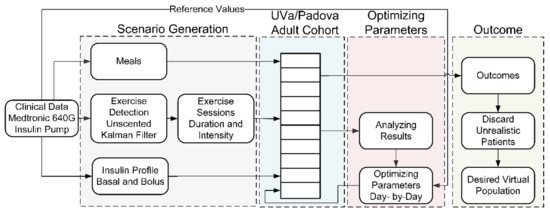
Figure 1.
Block diagram showing the steps involved in methodology.
2.1. Generating the Scenario
To generate the scenario, glucose, meal, and insulin data were extracted reviewing the electronic medical records and databases of individuals with T1D followed at the Diabetes Unit, Endocrinology and Nutrition Department at the Hospital Clínic of Barcelona. In the current analysis, patients with T1D using SAP therapy with the 640G Medtronic-Minimed system (Medtronic-Minimed, Northridge, CA, USA) linked to a glucometer (Contour Next 2.4®®, Ascensia Diebetes Care, Parsippany, NJ, USA) and a glucose sensor (Enlite®®, Medtronic-Minimed, Northridge, CA, USA) for at least 6 months were included. Demographic and clinical data were recorded from computerized clinical records. Data were collected from uploads from each patient including CGM data using CareLink Pro®® software. The study has been reviewed by the local ethics committee (HCB/2015/0683) and has therefore been performed in accordance with the ethical standards laid out in an appropriate version of the 1964 Declaration of Helsinki. All subjects gave informed consent. The demographic data of the patients is provided in Table 1.

Table 1.
Demographic data of the cohort.
Data for 14 days is selected corresponding to each patient in a cohort with at least 70% of CGM data available during this time period, which has been defined as the required minimum amount of CGM data for the attainment of meaningful results [54]. The amount of carbohydrates and time of ingestion from the clinical data is included as meals into the simulator. Within a timeframe of 14 days, the days with less than 50% of CGM data are also excluded from the scenario and simulations. Using a previously developed algorithm [30], which requires BG and insulin profiles as inputs, disturbances that are not described by other parameters in the UVa/Padova model are detected and included in the simulator in the form of aerobic exercise. For the correct inclusion of the detected exercise sessions, a reference table was generated using the UVa/Padova simulator for a range of intensity values. The value of intensity that matched the BG profile from the clinical data was selected for each detected exercise session. The exercise model [55] considered in this work was previously fit by our group using clinical data [31]. The basal and bolus insulin values from the pump are implemented in the simulator. A single immediate dose of bolus insulin was used 99% of the time for insulin administration. Details of the scenarios extracted from the clinical data of 14 T1D patients are presented in Table 2.
Table 2.
Details of the realistic scenarios extracted from the clinical data.
2.2. Parameter Optimization
A total of 14 scenarios (corresponding to 14 patients) were extracted from the clinical data. Each scenario was simulated using the UVa/Padova’s 10 adult patients. The adult population was modified to replicate the BG outcomes indicated by the clinical data.
The parameters that describe insulin sensitivity and baseline endogenous glucose production were optimized. In the case of the UVa/Padova VPs, the parameters and are considered for the purpose of modification. The model equations containing the parameters are provided below:
represents the insulin-dependent utilization of glucose in the remote compartment, is the insulin action, and the parameter (mg/kg/min per pmol/L) used for adjusting the BG profile is the sensitivity of insulin on glucose utilization. describes endogenous glucose production and (mg/kg/min) is proportional to the basal endogenous glucose production. To replicate the BG values found in the clinical data of real patients in which insulin action varies and appears different on different days, the parameters were adjusted accordingly.
Firstly, the and parameters were optimized in a day-by-day fashion to mimic the median BG value from clinical data subjected to the constraints of maximum and minimum BG limits. Next, the adjusted day-by-day parameters were smoothed using a transition period of 4 h applied at 10 pm. The p-values were calculated using the Wilcoxon signed rank test.
The flow chart of the algorithm is presented in Figure 2, which is adopted for the optimization of parameters corresponding to each day. The description of parameters used in the flow chart can be seen in Table 3. The parameters are incremented or decremented in order to minimize the error (see Table 3). The parameters are subjected to maximum and minimum limits constraints. A threshold of 0.5 mg/dL is considered for the acceptable error in median BG. Once this threshold is met, the values of the parameters are selected for that particular day.
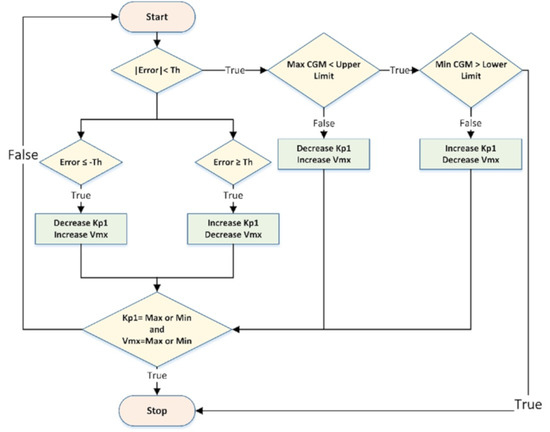
Figure 2.
Optimization algorithm flow chart.
Table 3.
Description of parameters used in flow chart.
The flow chart in Figure 2 depicts the iterations involved in the numerical simulations required for the optimization of the parameters. The chart reflects the process of optimizing the parameters for a single particular day. The primary goal of the optimization is to find a solution that will restrict the error below the threshold. These parameter changes result in BG outcomes similar to the clinical data.
2.3. Discarding Unrealistic Patients
After optimizing the parameters, patients were discarded based on two criteria. Firstly, VP with maximum BG value above 500 mg/dL and/or the minimum BG value below 30 mg/dL were discarded. Secondly, patients with two times the standard deviation of saturation points as compared to the clinical data were discarded from the final cohort of VPs. Saturation points represent the end range of a CGM and are defined as BG values equal or greater than 400 mg/dL or equal or less than 40 mg/dL.
3. Results
Overall results are presented in Table 4. A cohort of 75 VPs (54%) was generated as compared to the maximum possible number of 140 VPs. A total of 65 VPs were discarded based on maximum and minimum BG limits (31%) and saturation points (15%), resulting in a cumulative total of 46%.
Table 4.
A comparison of clinical data and simulation results.
3.1. Blood Glucose Outcomes
The results are provided in median and interquartile range (IQ). The performance indicators of BG profile presented to draw a comparison between clinical data and simulation results can be divided into four categories. Firstly, the absolute BG values, which include the mean, median, maximum, and minimum values corresponding to the entire duration (Table 2) of the scenario. Secondly, the CV (indicator of the glycemic variability) and glucose management index (GMI), which is an indicator for average glycemic exposure. Thirdly, the percentage of time BG values lie in various ranges. Finally, the percentage of saturation points are reported.
3.2. Inter-Subject Variability
The original inter-patient variability provided by the UVa/Padova cohort is retained for the newly generated VPs. To demonstrate this, a scenario of three meals per day for a duration of 14 days, which is the maximum length of simulation considered in this study, was used to analyze the inter-subject variability. The breakfast (45 g), lunch (70 g), and dinner (60 g) were delivered at 7:00, 13:00, and 20:00, respectively. Open loop insulin therapy was used for simulations with adjusted basal rates for the generated VPs. The results for real scenario 9 (see Table 2) are presented in Figure 3. The simulation results of all real scenarios are provided as Supplementary Materials (Figures S1–S11). The results for real scenarios 5 and 7 are not included because they were composed of only 1 acceptable VP.
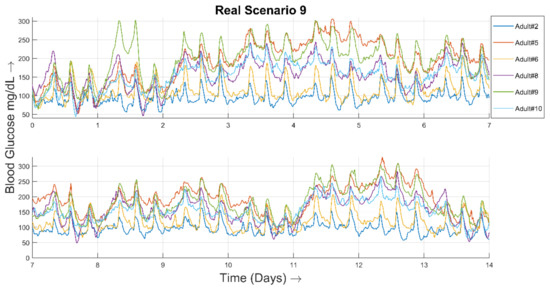
Figure 3.
Representative inter-patient variability simulation from 6 of the newly generated VPs. These VPs were based on the real scenario 9 and their parameters were tuned based on the clinical data.
The overall BG curve corresponding to all 75 generated VPs is shown in Figure 4. The BG curve is calculated as the mean ± standard deviation BG value of all VPs. The duration of the simulation study was 14 days, with three meals a day.
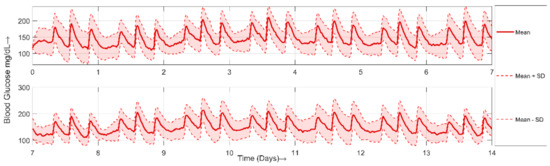
Figure 4.
A plot showing mean (red solid line), mean + standard deviation (upper red dashed line) and mean − standard deviation (lower red dashed line) BG curve of all 75 generated VPs.
3.3. Optimized Parameters
The distinct realistic scenarios considered are reflected in a set of optimized parameters which are significantly different. To illustrate this, box plots of the parameters ( and ) are presented in Figure 5 and Figure 6, respectively. The values of all parameters for 75 VPs are provided in the Supplementary Materials.
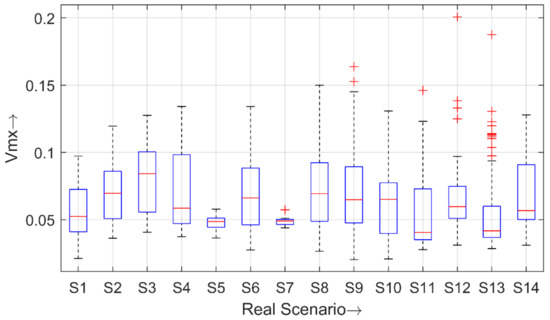
Figure 5.
Boxplot of the parameter for all 14 real scenarios.
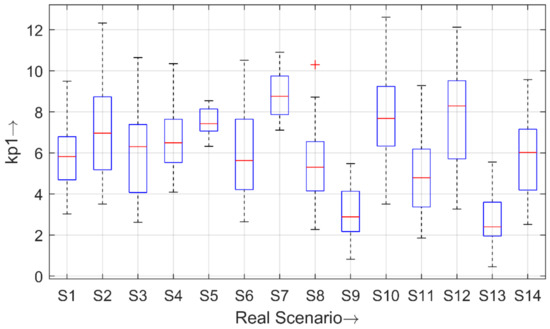
Figure 6.
Boxplot of the parameter for all 14 real scenarios.
3.4. Mapping Scenarios against VPs
The details of valid generated VPs and discarded VPs are presented in Table 5. The real scenarios are corresponding to clinical data (see Table 2). The adult patients are the modified VPs from the UVa/Padova’s adult cohort.
Table 5.
Mapping of real scenarios into valid VPs.
4. Discussion
Several methods have already been proposed in the literature for the generation of VPs, mainly focused on generating large cohorts of patients with T1D. In this work, the proposed methodology is focused on replicating a specific cohort of T1D patients. The treatment strategies developed for existing cohorts of VPs are prone to over- or under-perform for such sub-cohorts of patients with T1D. Therefore, the proposed methodology will provide a benchmark for in silico experimentation to develop T1D treatment strategies for sub-cohorts, allowing tight BG control to be achieved in these patient populations. The application of the proposed methodology can be extended to generate VPs replicating various sub-cohorts of patients with T1D by optimizing the parameters according to the clinical data of the targeted sub-cohort. Another contribution of this work is to provide real-life scenarios (meals, exercise, and glycemic variability) for testing and validating the treatment strategies developed for patients with T1D.
Utilizing the scenario attributes and insulin profiles from the clinical data, the adult population of the UVa/Padova simulator shows significant deviation in results as compared to the clinical data. This indicates that the adult population of the UVa/Padova simulator does not represent the cohort considered in this study. The effectiveness of the proposed methodology is demonstrated by achieving outcomes similar to the considered cohort of patients with T1D. Therefore, in this work, a cohort comprised of 75 VPs was generated to reflect the BG metrics of a cohort from the Hospital Clinic de Barcelona.
To demonstrate the contribution of meals in CV and BG outcomes, a comparison of simulation results with real meal scenario (RMSc), typical meal scenario (TMSc), and clinical data is presented in Table 6. RMSc is composed of the meals pattern extracted from the clinical data, whereas TMSc is composed of four meal scenarios (three with 3 meals per day and one with additional snacks per day) [38,39,56,57]. The results for TMSc are presented as median of simulation results for all individual four-meal scenarios. Open loop control and UVa/Padova’s adult cohort are used for simulations. The mean BG (129.2 mg/dL, 131.8 mg/dL) versus 166.3 mg/dL, CV (19.6%, 25.2%) versus 33%, and PoT in range 70 to 180 mg/dL (95.3%, 90.15%) versus 66.85% are reported for RMSc and TMSc, respectively. The CV in case of TMSc is 5.6% greater compared to the RMSc. The clinical data shows that meals consumed by real patients (considered in this study) are smaller than those used in traditional in silico simulations. Therefore, meals only account for a small portion of CV. The BG outcomes for RMSc and TMSc are somehow close to each other but significantly different from the clinical data. It implies that including only meals in the simulation scenario is not enough to achieve realistic BG outcomes. Therefore, in this study, insulin pump data was added to the simulator and a methodology was proposed to adjust the model parameters to replicate clinical BG outcomes. The day-to-day optimization of parameters and the smoothing of daily parameter transitions cumulatively allow for the achievement of the glycemic variability of real patients.
Table 6.
A comparison of clinical data and simulation results using UVa/Padova VPs in open loop control. Typical meal scenario results are the ones obtained using typical three meal or three meal plus snack scenarios as published in the literature. Real meal scenarios include the same meals as in clinical data.
The results presented in Table 4 reflect the BG profile of a cohort with T1D. The primary goal was to generate a virtual cohort of patients with T1D to mimic real patients. The performance indicators considered to compare the BG profile of the cohorts were statistically similar ( > 0.05), except the PoT BG values lie in a range of 70 to 140 mg/dL. The mean and median BG values reported were very close, but a rise of about 10 mg/dL was observed in the IQ range in case of the simulation results. The maximum BG value reported was 23 mg/dL lower in simulation results. However, the VPs generated showed significantly close results as compared to the clinical data ( = 0.71). The minimum BG value reported was 3 mg/dL lower as compared to the clinical data and the IQ range reported was almost identical. CV reported was lower by 1% and the IQ range differed by about 2%. The GMI reported was almost the same as indicated by the clinical data.
The performance indicators related to PoT of the BG values in a specific range reflected quite close behavior as compared to the clinical data, except in the range 70 to 140 mg/dL. The PoT in the very low range (<54 mg/dL) observed was 0.58% greater. However, the PoT in low range of 54 to 69 mg/dL appeared to replicate the clinical data. The PoT reported in a range of 70 to 140 mg/dL showed a decline of about 6%. The PoT in normoglycemia (70 to 180 mg/dL), which is the target range to achieve, showed a decrease of 6% in simulation results with an identical IQ range. The PoT reported in ranges 181 to 250 mg/dL and >250 mg/dL almost replicated the clinical data.
Moreover, the saturation points were also considered for the selection of VPs to prevent the use of the CGM limits (40–400 mg/dL) for parameter fitting. The results are presented in terms of percent of saturation points in the entire duration of the scenario. The durations for all considered scenarios are presented in Table 2. The percent of saturation points (40 and 400 mg/dL) reported are similar as compared to the clinical data. The saturation points correspond to PoT BG in very low range (<54 mg/dL) and very high range (>250 mg/dL). Therefore, this criterion results in achieving the PoT BG in ranges mentioned similar to the clinical data.
The detailed mapping of valid and discarded VPs is provided in Table 5.
As we expected, no original VP can be adjusted for all scenarios nor is any scenario likely to be adjusted for all patients. In fact, UVa/Padova adult 7 cannot be properly adjusted for any scenario and is discarded in all cases. Modification of the parameters for this patient resulted in out-of-range glycaemia values (>500 mg/dL) in all 14 cases. For scenario 5, only adult 10 resulted in a valid VP. Three of the ten VPs were discarded because they violated the saturation point criteria. The remaining VPs were discarded because blood glucose was out of range (>500 or <30 mg/dL). For scenario 7, only adult 2 is a valid VP. The other 9 VPs were discarded because BG values were out of range.
There may exist mismatches between real and detected exercise sessions, since proper detection may require accepting a certain false positive rate to obtain a high true positive rate. Despite this, the goal of this work is to demonstrate that the proposed algorithm can be used to cope with all possible scenario elements existing in real life, which can be integrated into the simulator. Clinical data that includes exercise details will allow that information to be used directly without need for the detection of exercise sessions, resulting in even more accurate scenario development.
The parameter has been extensively used by the Padova group to explain intraday variability of insulin sensitivity, and intra- and inter-patient variability [53,58], and is therefore a parameter that can be varied both between patients and within the same patient, as applied in this work. To account for inter-day variability in basal and postprandial endogenous glucose production, the parameter in UVa/Padova VPs is considered for modification in the methodology presented in this study.
The main limitation of this study is in forcing the 10 adult UVa/Padova VPs to replicate the BG metrics of the same real subject. This led to the rejection of about 46% generated VPs. The VPs in the UVa/Padova simulator that cannot be forced to match the outcomes of a real patient were discarded through the process explained in the methodology section. However, inter-patient variability is still retained, as it is reflected by the distinct set of parameters defining the VP in the UVa/Padova simulator. In case of the same UVa/Padova VP corresponding to different real subjects, this variability is retained in the parameters considered for modification in this study, which change day-by-day. The other limitation is that it is not possible to exactly replicate the BG variability of real patients due to the causes of variability (stress, illness, lifestyle, etc.), which are difficult to model because of their unpredictable nature. However, the goal is to minimize the gap between simulation environment and reality in terms of BG outcomes.
5. Conclusions
In this work, a novel algorithm to generate a virtual cohort of T1D patients was presented. The novelty of the proposed scheme lies in the optimal daily adjustment of the parameters to achieve the glycemic outcomes reflected by clinical data. The daily variation of parameters represents realistic daily changes in real patients with T1D that influence BG curves. The clinical data was exclusively taken into account to modify the parameters, resulting in more realistic BG outcomes in terms of generated VPs.
The algorithm is based on optimizing the parameters of virtual adult patients from the UVa/Padova simulator to replicate the BG profile of a targeted cohort of real patients. The targeted BG profile is replicated in a day-by-day manner by optimizing the parameters accordingly. A virtual cohort of 75 patients has been generated for a cohort of 14 patients with T1D from the Hospital Clinic de Barcelona. The cohort of VPs generated potentially represents the cohort from the Hospital Clinic de Barcelona in terms of BG performance indicators. The statistical similarity index in terms of p-values (Wilcoxon signed rank test) was presented to validate the effectiveness of the proposed algorithm.
This algorithm can be used to test the controllers and therapeutic strategies developed for the treatment of T1D patients. It provides testing under the realistic scenarios based on the clinical data and a challenging variable behavior of patients as the parameters are changing day-by-day. Moreover, it is based on the FDA-approved UVa/Padova simulator and can be utilized for the preclinical validation.
The presented study can be extended in two possible directions. Firstly, a greater number of parameters for the purpose of modification and optimization can be explored. This may better capture the inter-subject variability and is expected to increase the number of VPs generated. Secondly, the parameters can be adjusted hourly instead of daily to achieve the intraday variability in the BG curve, as shown by the real patients.
Supplementary Materials
The following are available online at https://www.mdpi.com/article/10.3390/math9111200/s1, Figure S1: Simulation results for real scenario 1, Figure S2: Simulation results for real scenario 2, Figure S3: Simulation results for real scenario 3, Figure S4: Simulation results for real scenario 4, Figure S5: Simulation results for real scenario 6, Figure S6: Simulation results for real scenario 8, Figure S7: Simulation results for real scenario 10, Figure S8: Simulation results for real scenario 11, Figure S9: Simulation results for real scenario 12, Figure S10: Simulation results for real scenario 13, Figure S11: Simulation results for real scenario 14. Table S1: Values of optimized parameters corresponding to real patient 1, Table S2: Values of optimized parameters corresponding to real patient 2, Table S3: Values of optimized parameters corresponding to real patient 3, Table S4: Values of optimized parameters corresponding to real patient 4, Table S5: Values of optimized parameters corresponding to real patient 5, Table S6: Values of optimized parameters corresponding to real patient 6, Table S7: Values of optimized parameters corresponding to real patient 7, Table S8A: Values of optimized parameters corresponding to real patient 8, Table S8B: Values of optimized parameters corresponding to real patient 8, Table S9: Values of optimized parameters corresponding to real patient 9, Table S10A: Values of optimized parameters corresponding to real patient 10, Table S10B: Values of optimized parameters corresponding to real patient 10, Table S11: Values of optimized parameters corresponding to real patient 11, Table S12: Values of optimized parameters corresponding to real patient 12, Table S13: Values of optimized parameters corresponding to real patient 13, Table S14: Values of optimized parameters corresponding to real patient 14.
Author Contributions
S.A. conceived, designed, implemented, and validated the methodology, performed the statistical analysis and wrote the manuscript; C.M.R. and A.B. contributed to the development of the methodology and critically revised the manuscript; I.C. and M.G. provided the clinical data and critically revised the manuscript; J.V. supervised all the simulation study, analyzed, interpreted data and critically revised the manuscript. All authors contributed to the review of the report and approved the final version for submission. All authors have read and agreed to the published version of the manuscript.
Funding
This work was partially supported by the Spanish Ministry of Science and Innovation through grant PID2019-107722RB-C22/AEI/10.13039/501100011033 and the Government of Catalonia under 2017SGR1551 and 2019 FI_B 01200.
Institutional Review Board Statement
The study was conducted in accordance with the Declaration of Helsinki, and the protocol was approved by the Ethics Committee of Hospital Clínic de Barcelona (protocol code HCB/2015/0683 and date of approval 22 September 2015).
Informed Consent Statement
Informed consent was obtained from all subjects involved in the study.
Data Availability Statement
Restrictions apply to the availability of these data. Data was obtained from the Spanish Consortium on Artificial Pancreas and Diabetes Technology and are available on request from the corresponding author with the permission of the Spanish Consortium on Artificial Pancreas and Diabetes Technology.
Conflicts of Interest
All authors have no conflict of interest related to this manuscript.
References
- Katsarou, A.; Gudbjörnsdottir, S.; Rawshani, A.; Dabelea, D.; Bonifacio, E.; Anderson, B.J.; Jacobsen, L.M.; Schatz, D.A.; Lernmark, Å. Type 1 Diabetes Mellitus. Nat. Rev. Dis. Prim. 2017, 3, 1–17. [Google Scholar] [CrossRef]
- Hernando, M.E.; García-Sáez, G.; Gómez, E.J.; Pérez-Gandía, C.; Rodríguez-Herrero, A. Automated Insulin Delivery: The Artificial Pancreas Technical Challenges. Am. J. Ther. 2020, 27, e62–e70. [Google Scholar] [CrossRef]
- Cobelli, C.; Dalla Man, C.; Sparacino, G.; Magni, L.; De Nicolao, G.; Kovatchev, B.P. Diabetes: Models, Signals, and Control. IEEE Rev. Biomed. Eng. 2009, 2, 54–96. [Google Scholar] [CrossRef] [PubMed]
- Resalat, N.; El Youssef, J.; Tyler, N.; Castle, J.; Jacobs, P.G. A Statistical Virtual Patient Population for the Glucoregulatory System in Type 1 Diabetes with Integrated Exercise Model. PLoS ONE 2019, 14, e0217301. [Google Scholar] [CrossRef] [PubMed]
- Wilinska, M.E.; Chassin, L.J.; Acerini, C.L.; Allen, J.M.; Dunger, D.B.; Hovorka, R. Simulation Environment to Evaluate Closed-Loop Insulin Delivery Systems in Type 1 Diabetes. J. Diabetes Sci. Technol. 2010, 4, 132–144. [Google Scholar] [CrossRef] [PubMed]
- Ciorap, R.; Luca, C.; Andriţoi, D. Realistic patient simulators for education in medicine and bioengineering. In Proceedings of the The International Scientific Conference eLearning and Software for Education, Bucharest, Romania, 19–20 April 2018; Volume 3, pp. 389–394. [Google Scholar]
- Soltész, K. On Automation in Anesthesia; Department of Automatic Control, Lund University: Lund, Sweden, 2013. [Google Scholar]
- Zurakowski, R.; Teel, A.R. A Model Predictive Control Based Scheduling Method for HIV Therapy. J. Theor. Biol. 2006, 238, 368–382. [Google Scholar] [CrossRef] [PubMed]
- Halvorsen, F.H.; Elle, O.J.; Fosse, E. Simulators in Surgery. Minim. Invasive Ther. Allied Technol. 2005, 14, 214–223. [Google Scholar] [CrossRef] [PubMed]
- Konduri, P.R.; Marquering, H.A.; van Bavel, E.E.; Hoekstra, A.; Majoie, C.B.; INSIST Investigators. In-Silico Trials for Treatment of Acute Ischemic Stroke. Front. Neurol. 2020, 11, 1062. [Google Scholar] [CrossRef]
- Rudy, Y. In Silico Pipeline for Drug Cardiotoxicity Assessment. Circ. Res. 2020, 126, 965–967. [Google Scholar] [CrossRef]
- Kazmi, S.R.; Jun, R.; Yu, M.-S.; Jung, C.; Na, D. In Silico Approaches and Tools for the Prediction of Drug Metabolism and Fate: A Review. Comput. Biol. Med. 2019, 106, 54–64. [Google Scholar] [CrossRef] [PubMed]
- Lee, C.H.; Koohy, H. In Silico Identification of Vaccine Targets for 2019-NCoV. F1000Research 2020, 9, 145. [Google Scholar] [CrossRef]
- Lateef, F. Simulation-Based Learning: Just like the Real Thing. J. Emergencies Trauma Shock 2010, 3, 348. [Google Scholar] [CrossRef] [PubMed]
- Kovatchev, B.P.; Breton, M.; Dalla Man, C.; Cobelli, C. In Silico Preclinical Trials: A Proof of Concept in Closed-Loop Control of Type 1 Diabetes. J. Diabetes Sci. Technol. 2009. [Google Scholar] [CrossRef]
- Soru, P.; De Nicolao, G.; Toffanin, C.; Dalla Man, C.; Cobelli, C.; Magni, L.; AP@ Home Consortium. MPC Based Artificial Pancreas: Strategies for Individualization and Meal Compensation. Annu. Rev. Control 2012, 36, 118–128. [Google Scholar] [CrossRef]
- Percival, M.W.; Wang, Y.; Grosman, B.; Dassau, E.; Zisser, H.; Jovanovič, L.; Doyle, F.J., III. Development of a Multi-Parametric Model Predictive Control Algorithm for Insulin Delivery in Type 1 Diabetes Mellitus Using Clinical Parameters. J. Process. Control 2011, 21, 391–404. [Google Scholar] [CrossRef]
- Colmegna, P.; Pena, R.S.S.; Gondhalekar, R.; Dassau, E.; Doyle, F.J., III. Reducing Risks in Type 1 Diabetes Using H∞ Control. IEEE Trans. Biomed. Eng. 2014, 61, 2939–2947. [Google Scholar] [CrossRef]
- Colmegna, P.; Sánchez-Peña, R.S.; Gondhalekar, R. Linear Parameter-Varying Model to Design Control Laws for an Artificial Pancreas. Biomed. Signal Process. Control 2018, 40, 204–213. [Google Scholar] [CrossRef]
- Colmegna, P.H.; Sanchez-Pena, R.S.; Gondhalekar, R.; Dassau, E.; Doyle, F.J. Switched LPV Glucose Control in Type 1 Diabetes. IEEE Trans. Biomed. Eng. 2015, 63, 1192–1200. [Google Scholar] [CrossRef]
- MohammadRidha, T.; Aït-Ahmed, M.; Chaillous, L.; Krempf, M.; Guilhem, I.; Poirier, J.Y.; Moog, C.H. Model Free IPID Control for Glycemia Regulation of Type-1 Diabetes. IEEE Trans. Biomed. Eng. 2017, 65, 199–206. [Google Scholar] [CrossRef]
- Herrero, P.; Bondia, J.; Adewuyi, O.; Pesl, P.; El-Sharkawy, M.; Reddy, M.; Toumazou, C.; Oliver, N.; Georgiou, P. Enhancing Automatic Closed-Loop Glucose Control in Type 1 Diabetes with an Adaptive Meal Bolus Calculator—In Silico Evaluation under Intra-Day Variability. Comput. Methods Programs Biomed. 2017, 146, 125–131. [Google Scholar] [CrossRef]
- Vettoretti, M.; Facchinetti, A.; Sparacino, G.; Cobelli, C. Predicting Insulin Treatment Scenarios with the Net Effect Method: Domain of Validity. Diabetes Technol. Ther. 2016, 18, 694–704. [Google Scholar] [CrossRef] [PubMed]
- Toffanin, C.; Messori, M.; Cobelli, C.; Magni, L. Automatic Adaptation of Basal Therapy for Type 1 Diabetic Patients: A Run-to-Run Approach. Biomed. Signal Process. Control 2017, 31, 539–549. [Google Scholar] [CrossRef]
- Torrent-Fontbona, F. Adaptive Basal Insulin Recommender System Based on Kalman Filter for Type 1 Diabetes. Expert Syst. Appl. 2018, 101, 1–7. [Google Scholar] [CrossRef]
- Campos-Náñez, E.; Layne, J.E.; Zisser, H.C. In Silico Modeling of Minimal Effective Insulin Doses Using the UVa/Padova Type 1 Diabetes Simulator. J. Diabetes Sci. Technol. 2018, 12, 376–380. [Google Scholar] [CrossRef] [PubMed]
- Turksoy, K.; Samadi, S.; Feng, J.; Littlejohn, E.; Quinn, L.; Cinar, A. Meal Detection in Patients with Type 1 Diabetes: A New Module for the Multivariable Adaptive Artificial Pancreas Control System. IEEE J. Biomed. Health Inform. 2015, 20, 47–54. [Google Scholar] [CrossRef] [PubMed]
- Xie, J.; Wang, Q. Meal Detection and Meal Size Estimation for Type 1 Diabetes Treatment: A Variable State Dimension Approach. Dyn. Syst. Control Conf. 2015, 57243, V001T15A003. [Google Scholar]
- Samadi, S.; Turksoy, K.; Hajizadeh, I.; Feng, J.; Sevil, M.; Cinar, A. Meal Detection and Carbohydrate Estimation Using Continuous Glucose Sensor Data. IEEE J. Biomed. Health Inform. 2017, 21, 619–627. [Google Scholar] [CrossRef]
- Ramkissoon, C.M.; Bertachi, A.; Beneyto, A.; Bondia, J.; Vehi, J. Detection and Control of Unannounced Exercise in the Artificial Pancreas without Additional Physiological Signals. IEEE J. Biomed. Health Inform. 2019, 24, 259–267. [Google Scholar] [CrossRef] [PubMed]
- Bertachi, A.; Beneyto, A.; Ramkissoon, C.M.; Vehi, J. Assessment of Mitigation Methods to Reduce the Risk of Hypoglycemia for Announced Exercise in a Uni-Hormonal Artificial Pancreas. Diabetes Technol. Ther. 2018, 20, 285–295. [Google Scholar] [CrossRef] [PubMed]
- Garcia-Tirado, J.; Colmegna, P.; Corbett, J.; Ozaslan, B.; Breton, M.D. Ensemble model predictive control strategies can reduce exercise hypoglycemia in type 1 diabetes: In silico studies. In Proceedings of the 2019 American Control Conference (ACC), Philadelphia, PA, USA, 10–12 July 2019; pp. 4752–4758. [Google Scholar]
- Aiello, E.M.; Wu, Z.; Christofides, P.D.; Toffanin, C.; Cobelli, C.; Magni, L. Improving Diabetes Conventional Therapy via Machine Learning Modeling. In Proceedings of the 2019 American Control Conference (ACC), Philadelphia, PA, USA, 10–12 July 2019; pp. 4136–4143. [Google Scholar]
- Zhu, T.; Li, K.; Georgiou, P. A Dual-Hormone Closed-Loop Delivery System for Type 1 Diabetes Using Deep Reinforcement Learning. arXiv 2019, arXiv:1910.04059. [Google Scholar]
- Cappon, G.; Vettoretti, M.; Facchinetti, A.; Sparacino, G. Smart Bolus Calculator for Personalized Insulin Dosing Using Continuous Glucose Monitoring Data and Patient Characteristics. Diabetes Technol. Ther. 2019, 21, A16–A17. [Google Scholar]
- Campos-Delgado, D.U.; Hernández-Ordoñez, M.; Femat, R.; Gordillo-Moscoso, A. Fuzzy-Based Controller for Glucose Regulation in Type-1 Diabetic Patients by Subcutaneous Route. IEEE Trans. Biomed. Eng. 2006, 53, 2201–2210. [Google Scholar] [CrossRef]
- Magni, L.; Raimondo, D.M.; Dalla Man, C.; De Nicolao, G.; Kovatchev, B.; Cobelli, C. Model Predictive Control of Glucose Concentration in Type I Diabetic Patients: An in Silico Trial. Biomed. Signal Process. Control 2009, 4, 338–346. [Google Scholar] [CrossRef]
- Incremona, G.P.; Messori, M.; Toffanin, C.; Cobelli, C.; Magni, L. Model Predictive Control with Integral Action for Artificial Pancreas. Control Eng. Pract. 2018, 77, 86–94. [Google Scholar] [CrossRef]
- Bertachi, A.; Ramkissoon, C.M.; Beneyto, A.; Vehí, J. Exercise-Induced Hypoglycemia in Type 1 Diabetes: In-Silico Comparison between Announced and Unannounced Strategies in Closed-Loop Control. IFAC PapersOnLine 2019, 52, 1000–1005. [Google Scholar] [CrossRef]
- Ahmad, S.; Ahmed, N.; Ilyas, M.; Khan, W. Super Twisting Sliding Mode Control Algorithm for Developing Artificial Pancreas in Type 1 Diabetes Patients. Biomed. Signal Process. Control 2017, 38, 200–211. [Google Scholar] [CrossRef]
- Nath, A.; Deb, D.; Dey, R.; Das, S. Blood Glucose Regulation in Type 1 Diabetic Patients: An Adaptive Parametric Compensation Control-Based Approach. IET Syst. Biol. 2018, 12, 219–225. [Google Scholar] [CrossRef] [PubMed]
- Djouima, M.; Azar, A.T.; Drid, S.; Mehdi, D. Higher Order Sliding Mode Control for Blood Glucose Regulation of Type 1 Diabetic Patients. Int. J. Syst. Dyn. Appl. 2018, 7, 65–84. [Google Scholar] [CrossRef]
- Beneyto, A.; Bertachi, A.; Bondia, J.; Vehi, J. A New Blood Glucose Control Scheme for Unannounced Exercise in Type 1 Diabetic Subjects. IEEE Trans. Control Syst. Technol. 2018, 7, 65–84. [Google Scholar] [CrossRef]
- Meneghetti, L.; Terzi, M.; Susto, G.A.; Del Favero, S.; Cobelli, C. Fault detection in artificial pancreas: A model-free approach. In Proceedings of the 2018 IEEE Conference on Decision and Control (CDC), Miami, FL, USA, 17–19 December 2018; pp. 303–308. [Google Scholar]
- Paoletti, N.; Liu, K.S.; Chen, H.; Smolka, S.; Lin, S. Data-Driven Robust Control for a Closed-Loop Artificial Pancreas. IEEE/ACM Trans. Comput. Biol. Bioinform. 2019, 17, 1981–1993. [Google Scholar] [CrossRef]
- Güemes, A.; Herrero, P.; Georgiou, P. A novel glucose controller using insulin sensitivity modulation for management of type 1 diabetes. In Proceedings of the 2019 IEEE International Symposium on Circuits and Systems (ISCAS), Sapporo, Japan, 26–29 May 2019; pp. 1–5. [Google Scholar]
- Nath, A.; Deb, D.; Dey, R. An Augmented Subcutaneous Type 1 Diabetic Patient Modelling and Design of Adaptive Glucose Control. J. Process. Control 2020, 86, 94–105. [Google Scholar] [CrossRef]
- Hovorka, R.; Canonico, V.; Chassin, L.J.; Haueter, U.; Massi-Benedetti, M.; Federici, M.O.; Pieber, T.R.; Schaller, H.C.; Schaupp, L.; Vering, T.; et al. Nonlinear Model Predictive Control of Glucose Concentration in Subjects with Type 1 Diabetes. Physiol. Meas. 2004, 25, 905. [Google Scholar] [CrossRef] [PubMed]
- Chassin, L.J. In Silico Testing of Glucose Controllers: Methodology and Sample Application. Ph.D. Thesis, City University London, London, UK, 2005. [Google Scholar]
- Haidar, A.; Wilinska, M.E.; Graveston, J.A.; Hovorka, R. Stochastic Virtual Population of Subjects with Type 1 Diabetes for the Assessment of Closed-Loop Glucose Controllers. IEEE Trans. Biomed. Eng. 2013, 60, 3524–3533. [Google Scholar] [CrossRef] [PubMed]
- Orozco-López, O.; Rodríguez-Herrero, A.; Castañeda, C.E.; García-Sáez, G.; Hernando, M.E. Method to Generate a Large Cohort In-Silico for Type 1 Diabetes. Comput. Methods Programs Biomed. 2020, 193, 105523. [Google Scholar] [CrossRef]
- Man, C.D.; Micheletto, F.; Lv, D.; Breton, M.; Kovatchev, B.; Cobelli, C. The UVa/PADOVA Type 1 Diabetes Simulator: New Features. J. Diabetes Sci. Technol. 2014, 8, 26–34. [Google Scholar] [CrossRef] [PubMed]
- Visentin, R.; Campos-Náñez, E.; Schiavon, M.; Lv, D.; Vettoretti, M.; Breton, M.; Kovatchev, B.P.; Dalla Man, C.; Cobelli, C. The UVa/Padova Type 1 Diabetes Simulator Goes from Single Meal to Single Day. J. Diabetes Sci. Technol. 2018, 12, 273–281. [Google Scholar] [CrossRef] [PubMed]
- Huffman, J.L.; McNeil, G.; Bismilla, Z.; Lai, A. Essentials of scenario building for simulation-based education. In Comprehensive Healthcare Simulation: Pediatrics; Springer: Berlin/Heidelberg, Germany, 2016; pp. 19–29. [Google Scholar]
- Dalla Man, C.; Breton, M.D.; Cobelli, C. Physical Activity into the Meal Glucose—Insulin Model of Type 1 Diabetes: In Silico Studies. J. Diabetes Sci. Technol. 2009. [Google Scholar] [CrossRef] [PubMed]
- Schiavon, M.; Dalla Man, C.; Cobelli, C. Physiology-based run-to-run adaptation of insulin to carbohydrate ratio improves type 1 diabetes therapy: Results from an in silico study. In Proceedings of the 2019 American Control Conference (ACC), Philadelphia, PA, USA, 10–12 July 2019; pp. 4124–4129. [Google Scholar]
- Moscardö, V.; Herrero, P.; Díez, J.L.; Giménez, M.; Rossetti, P.; Bondia, J. In silico evaluation of a parallel control-based coordinated dual-hormone artificial pancreas with insulin on board limitation. In Proceedings of the 2019 American Control Conference (ACC), Philadelphia, PA, USA, 10–12 July 2019; pp. 4759–4764. [Google Scholar]
- Visentin, R.; Dalla Man, C.; Kudva, Y.C.; Basu, A.; Cobelli, C. Circadian Variability of Insulin Sensitivity: Physiological Input for in Silico Artificial Pancreas. Diabetes Technol. Ther. 2015, 17, 1–7. [Google Scholar] [CrossRef]


Publisher’s Note: MDPI stays neutral with regard to jurisdictional claims in published maps and institutional affiliations. |
© 2021 by the authors. Licensee MDPI, Basel, Switzerland. This article is an open access article distributed under the terms and conditions of the Creative Commons Attribution (CC BY) license (https://creativecommons.org/licenses/by/4.0/).