
Implied Tail Risk and ESG Ratings


Abstract
:1. Introduction
2. Implied Moments
2.1. Concept of Implied Moments
2.2. Calculation of Implied Moments
3. Data and Methodology
3.1. Data and Summary Statistics
3.2. Methodology
4. Results and Discussion
4.1. ESG Ratings and Implied Moments
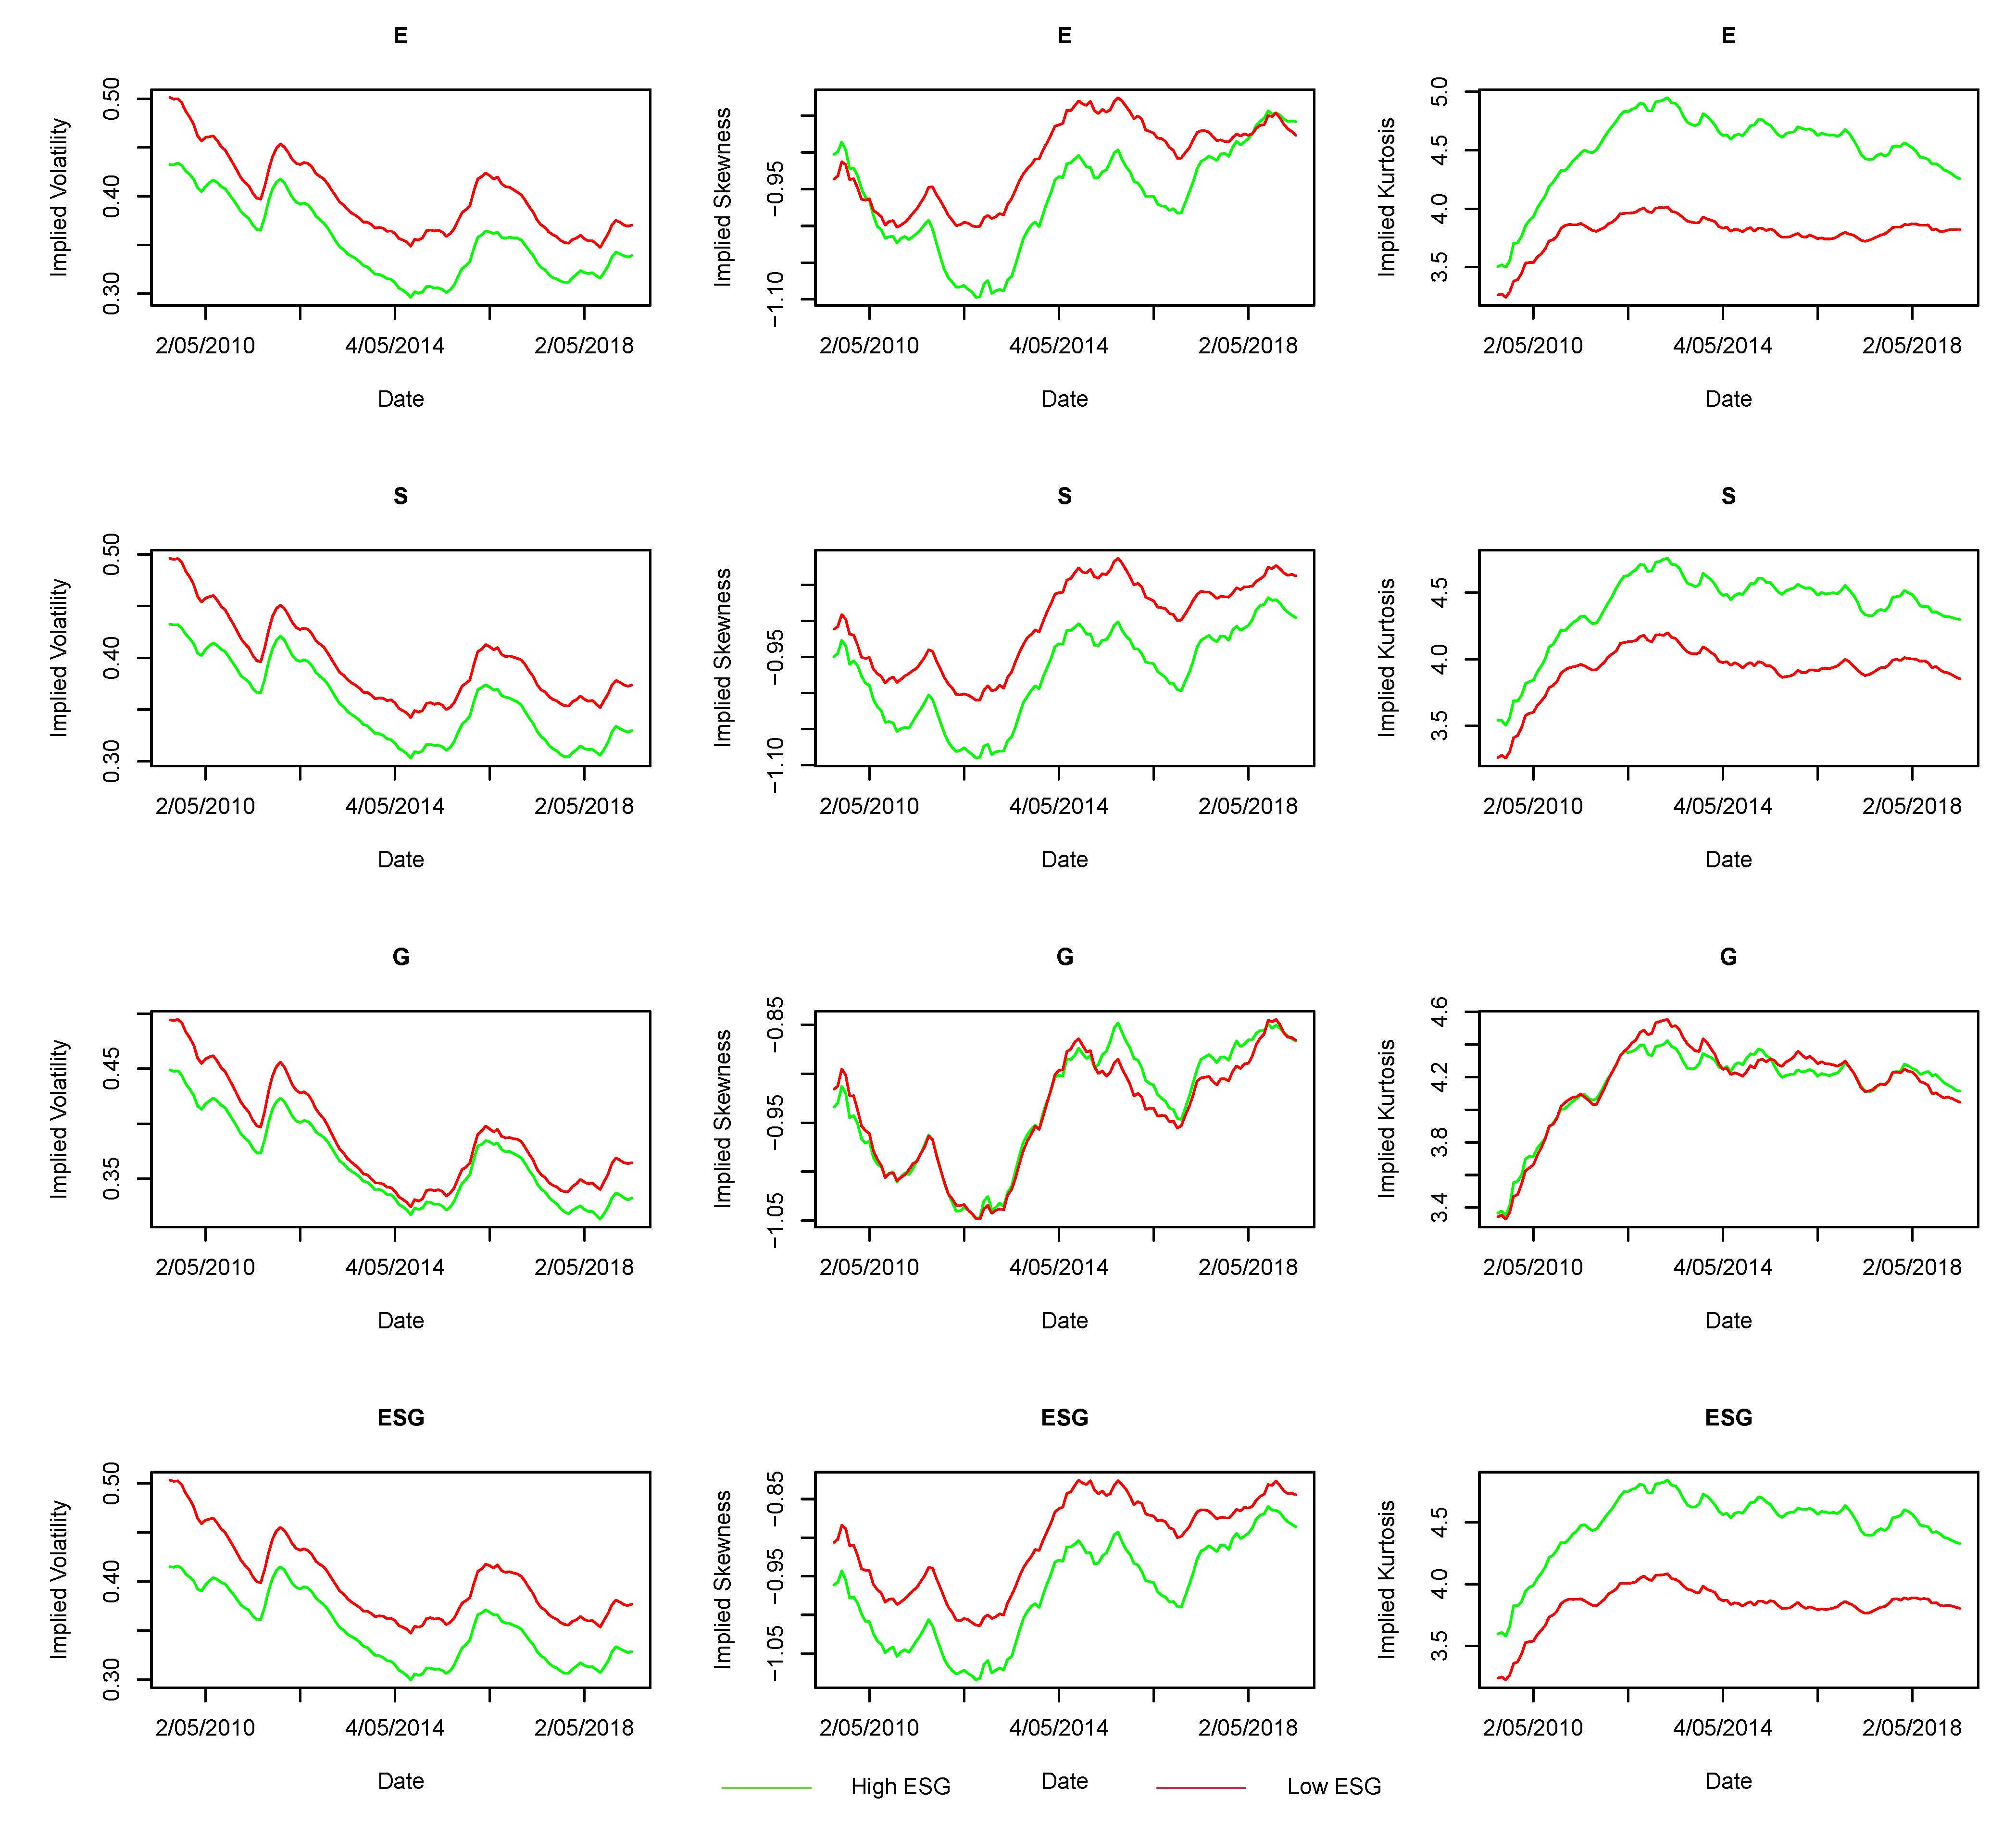
- There are 118 months in which the average value of implied volatility in the high ESG rating group is lower than that in the low ESG rating group, which means that the high ESG rating group has a lower average implied common risk than the low ESG rating group. A similar finding also holds for individual E, S, and G ratings.
- There are only 12 months in which the average value of implied skewness in the high ESG rating group is less negative than that in the low ESG ratings. Since 12 months do not exceed half of the total number of months, this shows that the high ESG rating group has a higher implied tail risk than the low ESG rating group. A similar finding also holds for individual E and G ratings.
- There are 0 months in which the average value of implied kurtosis in the high ESG rating group is lower than that in the low ESG rating group. Hence, we draw the similar results as above, namely, that the high ESG rating group has a higher implied tail risk than the low ESG rating group. A similar finding also holds for individual E, S, and G ratings.
4.2. ESG Ratings and Implied Moments Divided by Sector
4.3. Discussion
5. Conclusions
Author Contributions
Funding
Institutional Review Board Statement
Informed Consent Statement
Data Availability Statement
Acknowledgments
Conflicts of Interest
Abbreviations
| ESG | Environmental, social, and governance |
| SRI | Socially responsible investment |
| IV | Implied volatility |
| IS | Implied skewness |
| IK | Implied kurtosis |
References
- Hong, H.; Kacperczyk, M. The price of sin: The effects of social norms on markets. J. Financ. Econ. 2009, 93, 15–36. [Google Scholar] [CrossRef]
- Hamilton, S.; Jo, H.; Statman, M. Doing well while doing good? The investment performance of socially responsible mutual funds. Financ. Anal. J. 1993, 49, 62–66. [Google Scholar] [CrossRef]
- Halbritter, G.; Dorfleitner, G. The wages of social responsibility—Where are they? A critical review of ESG investing. Annu. Rev. Financ. Econ. 2015, 26, 25–35. [Google Scholar] [CrossRef]
- De, I.; Clayman, M.R. The benefits of socially responsible investing: An active manager’s perspective. J. Investig. 2015, 24, 49–72. [Google Scholar] [CrossRef]
- Edmans, A. Does the stock market fully value intangibles? Employee satisfaction and equity prices. J. Financ. Econ. 2011, 101, 621–640. [Google Scholar] [CrossRef] [Green Version]
- Nagy, Z.; Kassam, A.; Lee, L.E. Can ESG add alpha? An analysis of ESG tilt and momentum strategies. J. Investig. 2016, 25, 113–124. [Google Scholar] [CrossRef] [Green Version]
- Becker, G.S. The Economics of Discrimination; University of Chicago Press: Chicago, IL, USA, 2010. [Google Scholar]
- Renneboog, L.; Ter Horst, J.; Zhang, C. The price of ethics and stakeholder governance: The performance of socially responsible mutual funds. J. Corp. Financ. 2008, 14, 302–322. [Google Scholar] [CrossRef]
- Statman, M. Socially responsible mutual funds (corrected). Financ. Anal. J. 2000, 56, 30–39. [Google Scholar] [CrossRef]
- Heinkel, R.; Kraus, A.; Zechner, J. The effect of green investment on corporate behavior. J. Financ. Quant. Anal. 2001, 36, 431–449. [Google Scholar] [CrossRef]
- Pedersen, L.H.; Fitzgibbons, S.; Pomorski, L. Responsible investing: The ESG-efficient frontier. J. Financ. Econ. 2020. [Google Scholar] [CrossRef]
- Ashwin Kumar, N.; Smith, C.; Badis, L.; Wang, N.; Ambrosy, P.; Tavares, R. ESG factors and risk-adjusted performance: A new quantitative model. J. Sustain. Financ. Investig. 2016, 6, 292–300. [Google Scholar] [CrossRef]
- Boubaker, S.; Cellier, A.; Manita, R.; Saeed, A. Does corporate social responsibility reduce financial distress risk? Econ. Model. 2020, 91, 835–851. [Google Scholar] [CrossRef]
- Lins, K.V.; Servaes, H.; Tamayo, A. Social capital, trust, and firm performance: The value of corporate social responsibility during the financial crisis. J. Financ. 2017, 72, 1785–1824. [Google Scholar] [CrossRef] [Green Version]
- Chan, P.T.; Walter, T. Investment performance of “environmentally-friendly” firms and their initial public offers and seasoned equity offers. J. Bank. Financ. 2014, 44, 177–188. [Google Scholar] [CrossRef] [Green Version]
- Nofsinger, J.; Varma, A. Socially responsible funds and market crises. J. Bank. Financ. 2014, 48, 180–193. [Google Scholar] [CrossRef]
- Shafer, M.; Szado, E. Environmental, social, and governance practices and perceived tail risk. Account. Financ. 2018. [Google Scholar] [CrossRef]
- Hoepner, A.G.; Oikonomou, I.; Sautner, Z.; Starks, L.T.; Zhou, X. ESG Shareholder Engagement and Downside Risk. 2018. Available online: https://papers.ssrn.com/sol3/papers.cfm?abstract_id=2874252 (accessed on 5 April 2020).
- Diemont, D.; Moore, K.; Soppe, A. The downside of being responsible: Corporate social responsibility and tail risk. J. Bus. Ethics 2016, 137, 213–229. [Google Scholar] [CrossRef]
- Verheyden, T.; Eccles, R.G.; Feiner, A. ESG for all? The impact of ESG screening on return, risk, and diversification. J. Appl. Corp. Financ. 2016, 28, 47–55. [Google Scholar]
- Brunnermeier, M.; Crockett, A.; Goodhart, C.A.; Persaud, A.; Shin, H.S. The Fundamental Principles of Financial Regulation; GENEVA: ICMB, Internat. Center for Monetary and Banking Studies: London, UK, 2009; Volume 11. [Google Scholar]
- Chang, B.Y.; Christoffersen, P.; Jacobs, K.; Vainberg, G. Option-implied measures of equity risk. Rev. Financ. 2012, 16, 385–428. [Google Scholar] [CrossRef] [Green Version]
- Buss, A.; Vilkov, G. Measuring equity risk with option-implied correlations. Rev. Financ. Stud. 2012, 25, 3113–3140. [Google Scholar] [CrossRef]
- Ruan, X.; Zhang, J.E. Risk-neutral moments in the crude oil market. Energy Econ. 2018, 72, 583–600. [Google Scholar] [CrossRef]
- Datta, D.D.; Londono, J.M.; Ross, L.J. Generating options-implied probability densities to understand oil market events. Energy Econ. 2017, 64, 440–457. [Google Scholar] [CrossRef] [Green Version]
- Neudorfer, P. Tail risk in the fossil fuel industry: An option implied analysis around the unburnable carbon news. Account. Financ. 2021. [Google Scholar] [CrossRef]
- Molino, A.; Sala, C. Forecasting Value at Risk and Conditional Value at Risk using Option Market Data. J. Forecast. 2020. [Google Scholar] [CrossRef]
- Pan, G.G.; Shiu, Y.M.; Wu, T.C. Can risk-neutral skewness and kurtosis subsume the information content of historical jumps? J. Financ. Mark. 2020, 100614. [Google Scholar] [CrossRef]
- Bakshi, G.; Kapadia, N.; Madan, D. Stock return characteristics, skew laws, and the differential pricing of individual equity options. Rev. Financ. Stud. 2003, 16, 101–143. [Google Scholar] [CrossRef]
- Bibbona, E.; Negri, I. Higher moments and prediction-based estimation for the COGARCH (1, 1) model. Scand. J. Stat. 2015, 42, 891–910. [Google Scholar] [CrossRef] [Green Version]
- Schindelhauer, K.; Zhou, C. Value-at-Risk prediction using option-implied risk measures. Ned. Bank Work. Pap. 2018. Unpublished working paper. [Google Scholar] [CrossRef] [Green Version]
- Faias, J.A.; Castel-Branco, T. Out-of-Sample Stock Return Prediction Using Higher-Order Moments. Int. J. Theor. Appl. Financ. 2018, 21, 1850043. [Google Scholar] [CrossRef]
- Bakshi, G.; Madan, D. Spanning and derivative-security valuation. J. Financ. Econ. 2000, 55, 205–238. [Google Scholar] [CrossRef]
- Madan, D.; Schoutens, W. Applied Conic Finance; Cambridge University Press: Cambridge, UK, 2016. [Google Scholar]
- Garz, H.; Volk, C. The ESG Risk Ratings: Moving up the innovation curve, White Paper. Sustainalytics 2018, 1, 1–69. [Google Scholar]


| Mean | Median | Min. | Max. | Std. dev | Skewness | Kurtosis | |
|---|---|---|---|---|---|---|---|
| E | |||||||
| S | |||||||
| G | |||||||
| ESG | |||||||
| Implied volatility | |||||||
| Implied skewness | |||||||
| Implied kurtosis |
| Less IV Months | Mean | t-Test | p-Value | Less IS Months | Mean | t-Test | p-Value | Less IK Months | Mean | t-Test | p-Value | |
|---|---|---|---|---|---|---|---|---|---|---|---|---|
| (2) | (3) | (4) | (5) | (6) | (7) | (8) | (9) | (10) | (11) | (12) | (13) | |
| High E | 118/118 | 0.3463 | −5.7574 | 0.0000 | 25/118 | −0.9592 | −3.8083 | 0.0002 | 0/118 | 4.5750 | 17.1110 | 0.0000 |
| Low E | 0/118 | 0.3894 | −5.7574 | 0.0000 | 93/118 | −0.9067 | −3.8083 | 0.0002 | 118/118 | 3.8405 | 17.1110 | 0.0000 |
| High S | 118/118 | 0.3474 | -5.1830 | 0.0000 | 6/118 | −0.9690 | −5.2600 | 0.0000 | 0/118 | 4.4538 | 11.6278 | 0.0000 |
| Low S | 0/118 | 0.3861 | −5.1830 | 0.0000 | 112/118 | −0.8971 | −5.2600 | 0.0000 | 118/118 | 3.9713 | 11.6278 | 0.0000 |
| High G | 111/118 | 0.3567 | −2.5651 | 0.0110 | 61/118 | −0.9300 | 0.5448 | 0.5864 | 59/118 | 4.2156 | −0.2175 | 0.8280 |
| Low G | 7/118 | 0.3763 | −2.5651 | 0.0110 | 57/118 | −0.9373 | 0.5448 | 0.5864 | 59/118 | 4.2247 | −0.2175 | 0.8280 |
| High ESG | 118/118 | 0.3445 | −6.1413 | 0.0000 | 12/118 | −0.9650 | −4.7110 | 0.0000 | 0/118 | 4.5425 | 16.2281 | 0.0000 |
| Low ESG | 0/118 | 0.3900 | −6.1413 | 0.0000 | 106/118 | −0.9008 | −4.7110 | 0.0000 | 118/118 | 3.8736 | 16.2281 | 0.0000 |
| Less IV Months | Mean | t-Test | p Value | Less IS Months | Mean | t-Test | p Value | Less IK Months | Mean | t-Test | p Value | |
|---|---|---|---|---|---|---|---|---|---|---|---|---|
| (2) | (3) | (4) | (5) | (6) | (7) | (8) | (9) | (10) | (11) | (12) | (13) | |
| High E | 77/118 | 0.3517 | −0.5343 | 0.5936 | 99/118 | −0.8624 | 4.3130 | 0.0000 | 56/118 | 3.8709 | 0.2732 | 0.7850 |
| Low E | 41/118 | 0.3556 | −0.5343 | 0.5936 | 19/118 | −0.9192 | 4.3130 | 0.0000 | 62/118 | 3.8599 | 0.2732 | 0.7850 |
| High S | 116/118 | 0.3440 | −2.4495 | 0.0150 | 43/118 | −0.9015 | −1.2258 | 0.2215 | 41/118 | 3.9060 | 2.1810 | 0.0302 |
| Low S | 2/118 | 0.3617 | −2.4495 | 0.0150 | 75/118 | −0.8853 | −1.2258 | 0.2215 | 77/118 | 3.8185 | 2.1810 | 0.0302 |
| High G | 94/118 | 0.3475 | −1.4596 | 0.1458 | 86/118 | −0.8748 | 2.7567 | 0.0063 | 89/118 | 3.8095 | −2.8054 | 0.0055 |
| Low G | 24/118 | 0.3582 | −1.4596 | 0.1458 | 32/118 | −0.9113 | 2.7567 | 0.0063 | 29/118 | 3.9207 | −2.8054 | 0.0055 |
| High ESG | 114/118 | 0.3449 | −2.1086 | 0.0361 | 89/118 | −0.8751 | 2.5409 | 0.0117 | 56/118 | 3.8695 | 0.3350 | 0.7379 |
| Low ESG | 4/118 | 0.3600 | −2.1086 | 0.0361 | 29/118 | −0.9091 | 2.5409 | 0.0117 | 62/118 | 3.8560 | 0.3350 | 0.7379 |
| E | S | G | ESG | |||||||||
|---|---|---|---|---|---|---|---|---|---|---|---|---|
| IV | IS | IK | IV | IS | IK | IV | IS | IK | IV | IS | IK | |
| Energy | 91/118 | 63/118 | 57/118 | 88/118 | 44/118 | 47/118 | 87/118 | 64/118 | 72/118 | 101/118 | 52/118 | 58/118 |
| Materials | 82/118 | 28/118 | 28/118 | 66/118 | 37/118 | 58/118 | 26/118 | 61/118 | 49/118 | 84/118 | 18/118 | 39/118 |
| Industrial | 41/118 | 74/118 | 46/118 | 53/118 | 75/118 | 59/118 | 26/118 | 85/118 | 56/118 | 45/118 | 70/118 | 47/118 |
| Consumer discretionary | 89/118 | 84/118 | 54/118 | 78/118 | 86/118 | 55/118 | 76/118 | 89/118 | 72/118 | 87/118 | 84/118 | 53/118 |
| Consumer staples | 108/118 | 65/118 | 86/118 | 96/118 | 53/118 | 69/118 | 114/118 | 48/118 | 74/118 | 109/118 | 51/118 | 87/118 |
| Healthcare | 68/118 | 39/118 | 28/118 | 111/118 | 22/118 | 25/118 | 79/118 | 32/118 | 32/118 | 105/118 | 16/118 | 18/118 |
| Financial | 63/118 | 67/118 | 41/118 | 40/118 | 61/118 | 60/118 | 94/117 | 69/117 | 65/117 | 62/118 | 67/118 | 38/118 |
| Information technology | 42/118 | 107/118 | 51/118 | 35/118 | 86/118 | 60/118 | 63/118 | 43/118 | 63/118 | 39/118 | 95/118 | 56/118 |
| Communication services | 96/118 | 31/118 | 81/118 | 68/116 | 56/116 | 71/116 | 89/118 | 37/118 | 67/118 | 101/118 | 49/118 | 79/118 |
| Utilities | 85/118 | 53/118 | 51/118 | 73/114 | 57/114 | 50/114 | 19/54 | 41/54 | 34/54 | 77/118 | 58/118 | 49/118 |
| Real estate | 46/118 | 81/118 | 85/118 | 44/118 | 82/118 | 81/118 | 52/118 | 94/118 | 94/118 | 24/118 | 92/118 | 91/118 |
| E | S | G | ESG | |||||||||
|---|---|---|---|---|---|---|---|---|---|---|---|---|
| IV | IS | IK | IV | IS | IK | IV | IS | IK | IV | IS | IK | |
| Energy | 93/113 | 61/113 | 46/113 | 95/118 | 45/118 | 59/118 | 99/118 | 66/118 | 80/118 | 105/117 | 60/117 | 62/117 |
| Materials | 88/118 | 30/118 | 28/118 | 79/118 | 37/118 | 54/118 | 32/118 | 54/118 | 52/118 | 94/118 | 19/118 | 39/118 |
| Industrial | 37/118 | 75/118 | 48/118 | 61/118 | 76/118 | 58/118 | 35/118 | 78/118 | 63/118 | 44/118 | 86/118 | 50/118 |
| Consumer discretionary | 91/118 | 90/118 | 51/118 | 72/118 | 88/118 | 59/118 | 63/118 | 92/118 | 72/118 | 90/118 | 97/118 | 66/118 |
| Consumer staples | 101/115 | 72/115 | 88/115 | 97/118 | 49/118 | 75/118 | 116/118 | 46/118 | 78/118 | 109/118 | 56/118 | 84/118 |
| Healthcare | 70/112 | 28/112 | 20/112 | 110/118 | 20/118 | 32/118 | 77/118 | 27/118 | 28/118 | 102/118 | 14/118 | 15/118 |
| Financial | 64/118 | 70/118 | 34/118 | 49/118 | 70/118 | 73/118 | 97/117 | 67/117 | 72/117 | 65/117 | 66/117 | 38/117 |
| Information technology | 38/118 | 107/118 | 42/118 | 28/118 | 83/118 | 56/118 | 55/118 | 28/118 | 42/118 | 37/118 | 100/118 | 51/118 |
| Communication services | 97/118 | 41/118 | 88/118 | 79/98 | 46/98 | 78/98 | 90/117 | 33/117 | 67/117 | 92/116 | 50/116 | 86/116 |
| Utilities | 94/118 | 48/118 | 50/118 | 47/56 | 20/56 | 8/56 | 7/34 | 25/34 | 19/34 | 60/89 | 56/89 | 44/89 |
| Real estate | 33/118 | 86/118 | 87/118 | 33/118 | 79/118 | 78/118 | 45/118 | 104/118 | 94/118 | 31/118 | 92/118 | 95/118 |
| All companies | 98/118 | 102/118 | 49/118 | 114/118 | 49/118 | 48/118 | 88/118 | 96/118 | 94/118 | 113/118 | 99/118 | 58/118 |
Publisher’s Note: MDPI stays neutral with regard to jurisdictional claims in published maps and institutional affiliations. |
© 2021 by the authors. Licensee MDPI, Basel, Switzerland. This article is an open access article distributed under the terms and conditions of the Creative Commons Attribution (CC BY) license (https://creativecommons.org/licenses/by/4.0/).
Share and Cite
Zhang, J.; De Spiegeleer, J.; Schoutens, W. Implied Tail Risk and ESG Ratings. Mathematics 2021, 9, 1611. https://doi.org/10.3390/math9141611
Zhang J, De Spiegeleer J, Schoutens W. Implied Tail Risk and ESG Ratings. Mathematics. 2021; 9(14):1611. https://doi.org/10.3390/math9141611
Chicago/Turabian StyleZhang, Jingyan, Jan De Spiegeleer, and Wim Schoutens. 2021. "Implied Tail Risk and ESG Ratings" Mathematics 9, no. 14: 1611. https://doi.org/10.3390/math9141611
APA StyleZhang, J., De Spiegeleer, J., & Schoutens, W. (2021). Implied Tail Risk and ESG Ratings. Mathematics, 9(14), 1611. https://doi.org/10.3390/math9141611