Article

Carbon Trading Mechanism, Low-Carbon E-Commerce Supply Chain and Sustainable Development

1
School of Public Finance and Taxation, Shandong University of Finance and Economics, Jinan 250014, China
2
Physical Education College, Shandong University of Finance and Economics, Jinan 250014, China
3
School of Management Science and Engineering, Shandong University of Finance and Economics, Jinan 250014, China
4
Department of Industrial and System Engineering, University of Tennessee, Knoxville, TN 37996, USA
*
Author to whom correspondence should be addressed.
Mathematics 2021, 9(15), 1717; https://doi.org/10.3390/math9151717
Submission received: 28 May 2021 / Revised: 15 July 2021 / Accepted: 18 July 2021 / Published: 21 July 2021
(This article belongs to the Special Issue Mathematical Methods for Operations Research Problems)

Abstract

:
Considering the carbon trading mechanism and consumers’ preference for low-carbon products, a game decision-making model for the low-carbon e-commerce supply chain (LCE-SC) is constructed. The influences of commission and carbon trading on the optimal decisions of LCE-SC are discussed and then verified through numerical analysis. On this basis, the influence of carbon trading on regional sustainable development is empirically analyzed. The results show that the establishment of carbon trading pilots alleviates the negative impact of unfair profit distribution. Increasing the commission rate in a reasonable range improves the profitability of LCE-SC. Nevertheless, with the enhancement of consumers’ low-carbon preference, a lower commission rate is more beneficial to carbon emission reduction. The total carbon emission is positively related to the commission rate. However, the unit carbon emission decreases first and then increases with the commission rate. The influence of the carbon price sensitivity coefficient on the service level is first positive and then negative, while the influence on the manufacturer’s profit goes the opposite. The empirical analysis confirms that the implementation of carbon trading is conducive to regional sustainable development and controlling environmental governance intensity promotes carbon productivity.

1. Introduction

At present, global climate change caused by greenhouse gas has become a serious threat to sustainable development [1], and it has become a global consensus to take reasonable and effective measures to control carbon emission [2]. As early as 1960, Coase [3] proposed that the problem of externalities can be solved by defining property rights and trading voluntarily in the market. Stern [4] and Yang et al. [5] also mentioned that establishing a carbon trading market pricing by the market is an effective emission-reduction measure since the external cost for carbon emission can be internalized. Since the establishment of carbon trading pilots in Beijing, Shanghai, Tianjin, Fujian Province, Guangdong Province, Hubei Province, and Chongqing in 2013, the Chinese carbon trading market has been active. At the end of 2017, carbon trading was officially launched in China [6]. According to data from taipaifang.com (http://www.tanjiaoyi.com, accessed date 20 July 2021), the total transaction volume of the seven pilots amounted to RMB 94.9 million in 2019.
Implementing the carbon trading mechanism exerts manifold impacts. For low-emission enterprises, production costs are directly suppressed and even economic benefits can be obtained through carbon trading. For high-emission enterprises, excessive carbon emission brings greater production costs and social pressure, which impels them to invest more manual labor and materials in carbon emission reduction (CER) and promote the transformation of development mode [7]. For instance, as the first wave of enterprises included in the emission management in Hubei Province, Huaxin Cement emitted carbon exceeding the quota by 1.153 million tons and spent more than RMB 30 million to purchase the carbon quota in 2014. In 2015, the enterprise achieved a surplus carbon quota of 424,000 tons through investment in CER, and its net income from carbon trading exceeded RMB 9 million [8].
As the burgeoning commercial form, the e-commerce platform has changed the operation mode of the traditional supply chain. Due to convenience and efficiency, the e-commerce platform has won the favor of lots of consumers. Data from the National Bureau of Statistics of China show that Chinese online retail sales amounted to RMB 10.63 trillion in 2019, an increase of 16.5% over 2018. In practice, there are two working forms of the e-commerce platform, reselling and agency selling. Since the enterprise can directly decide key factors such as retail price and thus control market demand through pricing power, the majority of e-commerce platform’s suppliers prefer agency selling. As a result, the e-commerce platform and the supplier form an e-commerce supply chain (E-SC) that is different from the offline one [9]. As the revolution of the supply chain in the Internet era, the E-SC has become the main supply chain operation mode and the most important network economic carrier.
Considering the impact of implementing carbon trading on corporate profitability and the change of enterprise operation mode in the Internet era, the decision-making of emission-dependent enterprises has changed. However, existing research on the low-carbon supply chain centers on enterprises in traditional supply chains [10,11,12], so it is innovative to discuss the decision-making of the E-SC under the carbon trading mechanism. Thus, our research focuses on the following issues. Firstly, in the context of carbon trading, how should the low-carbon e-commerce supply chain (LCE-SC) make decisions? Secondly, what impacts does fluctuation of the carbon market and platform fee exert on the LCE-SC’s optimal decisions, including the decisions on production and environmental protection? Thirdly, as an important measure to achieve sustainable development, how does the carbon trading mechanism influence corporate economic and environmental performance, and further influence regional sustainable development? The goals of our work are to identify the operation mode of LCE-SC under carbon trading and examine the aforementioned issues. Then, we expect to verify the significance of carbon trading implementation and put forward relevant suggestions for enterprise operation and government policymaking.
Game theory is a typical method to study the decision-making of e-commerce supply chains and low-carbon supply chains. For example, the literature [13,14] uses game theory to solve the equilibrium decision of the e-commerce supply chain model, proving the feasibility of using game theory to explore the decision-making of LCE-SC. Besides, game theory can well reflect the confrontation between the e-commerce platform and suppliers. PSM-DID is recognized as an excellent empirical method to study the implementation effect of a policy. For example, using PSM-DID, Jia et al. [15] demonstrated the positive impact of high-speed rail construction on China’s regional economic development, and Liu et al. [16] analyzed the impact of environmental regulation on enterprise green innovation. However, the two methods have not been combined to study carbon trading. This is exactly our innovation, that is, to combine micro modeling research with macro empirical research to explore the implementation effect of carbon trading.
Specifically, this paper firstly constructs an LCE-SC decision-making model which consists of a manufacturer with a certain carbon cap and an agency-selling e-commerce platform that provides the manufacturer with sales service. Then, the influence of carbon trading on the decisions and performance of LCE-SC is discussed. On this basis, empirical analysis is conducted to further study the influence on the sustainable development of the enterprise group, that is, regional sustainable development. The results are as follows.
Different from existing studies [17,18,19], an LCE-SC considering the carbon trading mechanism and consumers’ low-carbon preference is constructed in this paper. It is found that the increased carbon price sensitivity coefficient leads to an increase and then a decline in the e-commerce platform’s service level. The influence of the commission rate on the total carbon emission is positive, but the influence on unit carbon emission is first negative and then positive. Compared with the low-cap manufacturer, the high-cap one’s sales price is higher but profit is lower. The e-commerce platform cooperating with the high-cap manufacturer can make more profits.
The moderating effect of carbon parameters is discussed. Different from the existing research conclusion [20], it is found that within a certain range, with the increase in the commission rate, the e-commerce platform’s and supply chain system’s profits both increase. However, when the threshold is exceeded, the overall profit of LCE-SC decreases; and although the e-commerce platform gains a high percentage of profit, its actual profit declines. Besides, as consumers’ low-carbon preference is enhanced, a lower commission rate is more beneficial to reducing emissions and improving supply chain profit. This study also indicates that the carbon price sensitivity coefficient exerts a non-linear effect on the manufacturer’s profit: with the increase in the coefficient, the manufacturer’s profit decreases first and then increases. Moreover, the higher the coefficient, the more significant the marginal impacts of optimizing emission-reduction cost on the manufacturer’s and the e-commerce platform’s profits.
This paper combines micro research with macro research and adopts theoretical modeling and empirical analysis to study the implementation effect of carbon trading. Based on numerical simulation, this paper proposes a preliminary assumption that the carbon trading mechanism positively affects regional carbon productivity. Using panel data of 30 provincial administrative regions in China from 2009 to 2017, an empirical analysis is conducted. It is found that implementing the carbon trading mechanism is conducive to regional sustainable development in China’s provinces. Resource endowment, industrial structure, environmental governance, and demographic factors also have a certain impact on regional sustainable development. It is also noteworthy that excessive environmental regulation is not beneficial to regional sustainable development, which shows that environmental governance programs should be optimized.
The rest of this paper consists of the following parts. Firstly, a literature review is provided in Section 2. Section 3 is the description and assumptions of the LCE-SC decision-making model. The optimal decisions of LCE-SC are deduced and the influence mechanism of commission rate and carbon trading is discussed in Section 4. Section 5 is the empirical research on the influence of carbon trading on regional sustainable development. The conclusions and managerial insights are proposed in Section 6.

2. Literature Review

The literature closely related to this study is organized into the following three streams: decision-making of LCE-SC, the influence of the carbon trading mechanism on decisions of low-carbon supply chains, and the influence of carbon trading on regional sustainable development.

2.1. Decision-Making of LCE-SC

The decision-making problem of LCE-SC is a hot spot in current research. Ji and Sun [21] constructed four decision-making models of e-commerce delivery strategies with diverse emission restriction intensities and analyzed the influence of the restriction intensity on e-commerce enterprises’ decisions. Considering customers’ low-carbon awareness, Han and Wang [20] discussed the pricing strategy of LCE-SC and designed a coordination mechanism of the system. Wang and Huang [22] studied the return strategy, pricing, and CER decisions under online sales and carbon tax. Wang et al. [23] discussed the impact of government low-carbon subsidy on the recycling strategy of the closed-loop E-SC. These studies focused on the influence of CER on the supply chain operation, without consideration of carbon trading. Unlike existing research, this paper explores the influence mechanism of carbon trading on LCE-SC decision-making.

2.2. Influence of Carbon Trading on Decisions of Low-Carbon Supply Chains

The carbon policy is internalized in the operation cost and influences the supply chain decision-making together with economic factors [24]. More and more scholars tend to consider the impacts of both the carbon trading market and product market on supply chain members’ performances. The aim is to establish a supply chain model that follows the Triple Bottom Line Principle of economic-social-environmental [25,26]. Focusing on the management of the two-echelon supply chain, Dong et al. [27] discussed the impact of carbon trading on the output and sales price. Du et al. [28] found that the carbon trading policy is easier to implement and more effective to save public resources than other government punitive measures. Xu et al. [29] studied the decision-making of CER and coordination in the supply chain considering carbon trading. Xu et al. [30] discussed the influence of carbon trading on the production and pricing decisions of the make-to-order supply chain. Wang et al. [31] focused on the fresh supply chain and discussed its optimal decisions under cap-and-trade. The above literature studies the influence of emission policies on the decision-making of offline supply chains. Unlike existing studies, this paper extends carbon trading to the rapidly developing LCE-SC and discusses its influence mechanism.

2.3. Influence of Carbon Trading on Regional Sustainable Development

The influence of carbon trading on regional sustainable development has been studied. The carbon trading market was first launched in the United States, the United Kingdom, and the European Union, and has contributed to CER [32]. Wang et al. [33] built a CGE model for Guangdong Province to analyze the influence of carbon trading on the province’s economy of China and found that the mechanism can effectively reduce GDP losses and achieve the strict emission-reduction targets. Zhao et al. [34] constructed a dynamic simulation model and found that the negative effect of carbon trading on the GDP of the Beijing-Tianjin-Hebei region is far less than the positive effect on energy saving and CER. Zhou et al. [35] proved empirically that the implementation of carbon trading has caused a decline in China’s carbon intensity. However, from the provincial perspective, the establishment of pilots only has an obvious negative effect on the carbon intensities of Beijing and Guangdong Province [36]. Using semi-structured interviewing, Hamzah et al. [37] confirmed that the implementation of carbon trading is consistent with Malaysia’s sustainable development goals. With carbon emission intensity as one of the control variables, the carbon trading mechanism affects both CER and economic growth, and the effect extent is diverse in different provinces [38]. Zheng et al. [39] adopted a multi-agents technique and found by model simulation that the carbon trading mechanism harms the growth of GDP while reducing emission. It is recommended that in order to maintain economic stability, different regions need to set different emission restrictions.
Most of the existing literature uses carbon intensity as the dependent variable to empirically study the implementation effect of carbon trading. However, carbon intensity emphasizes CER rather than economic growth, which is the opposite of what developing countries seek. Therefore, this paper adopts carbon productivity as the dependent variable to explore the impact of the carbon trading mechanism on enterprise group behavior, that is, the impact on regional sustainable development.
The differences between our research and the related literature are shown in Table 1.

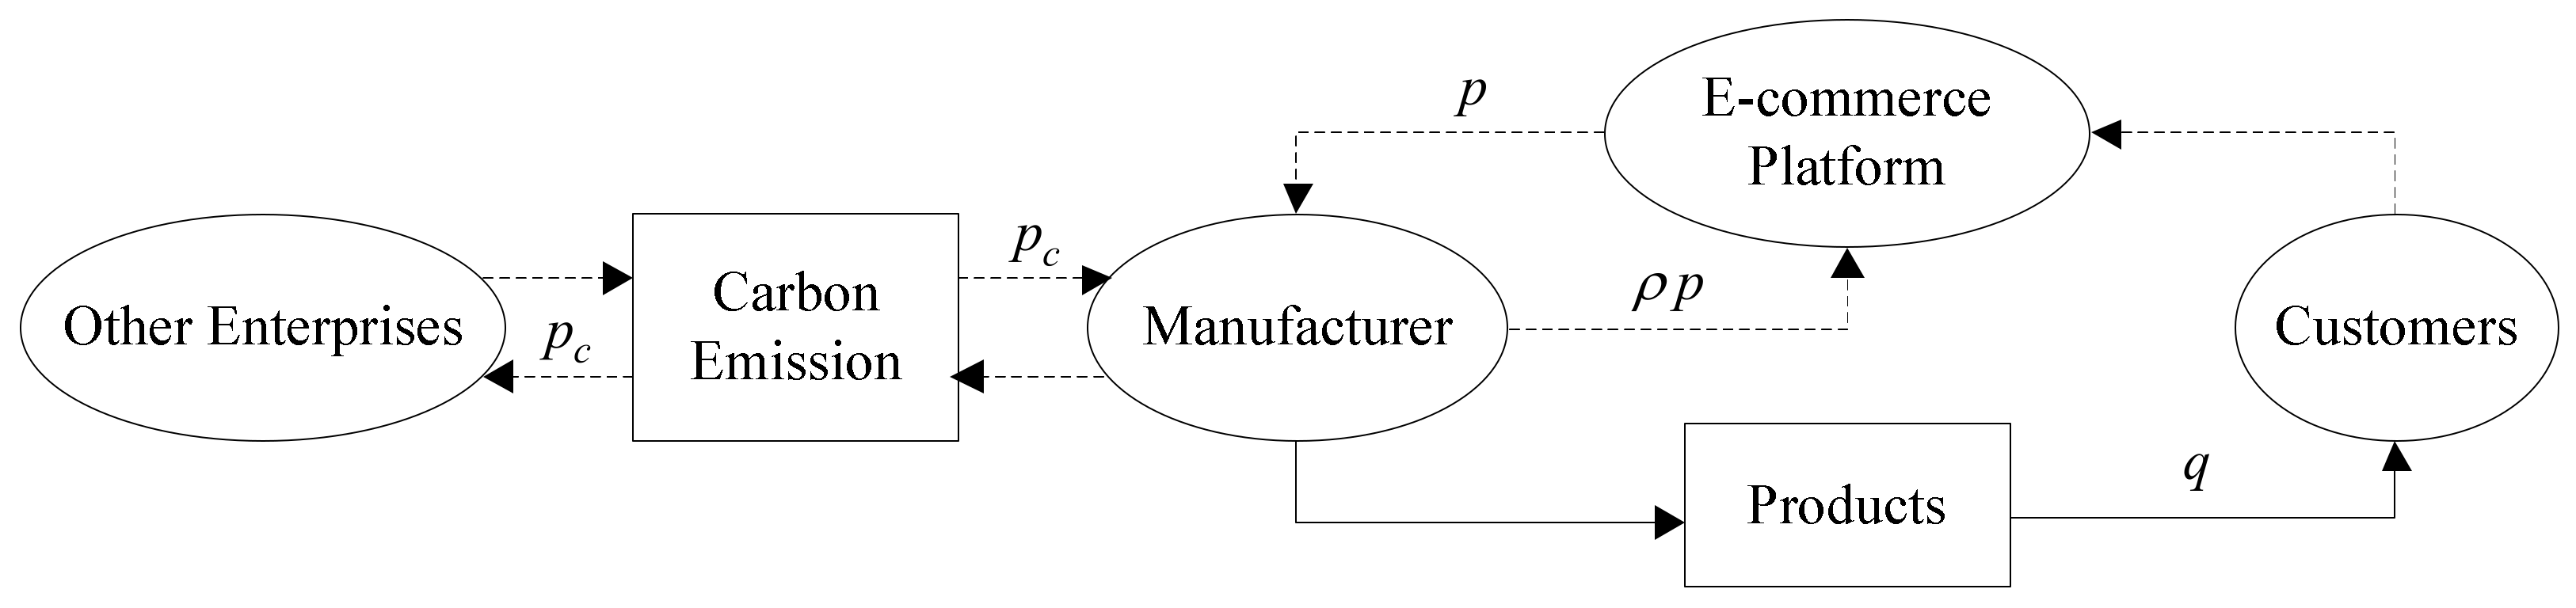
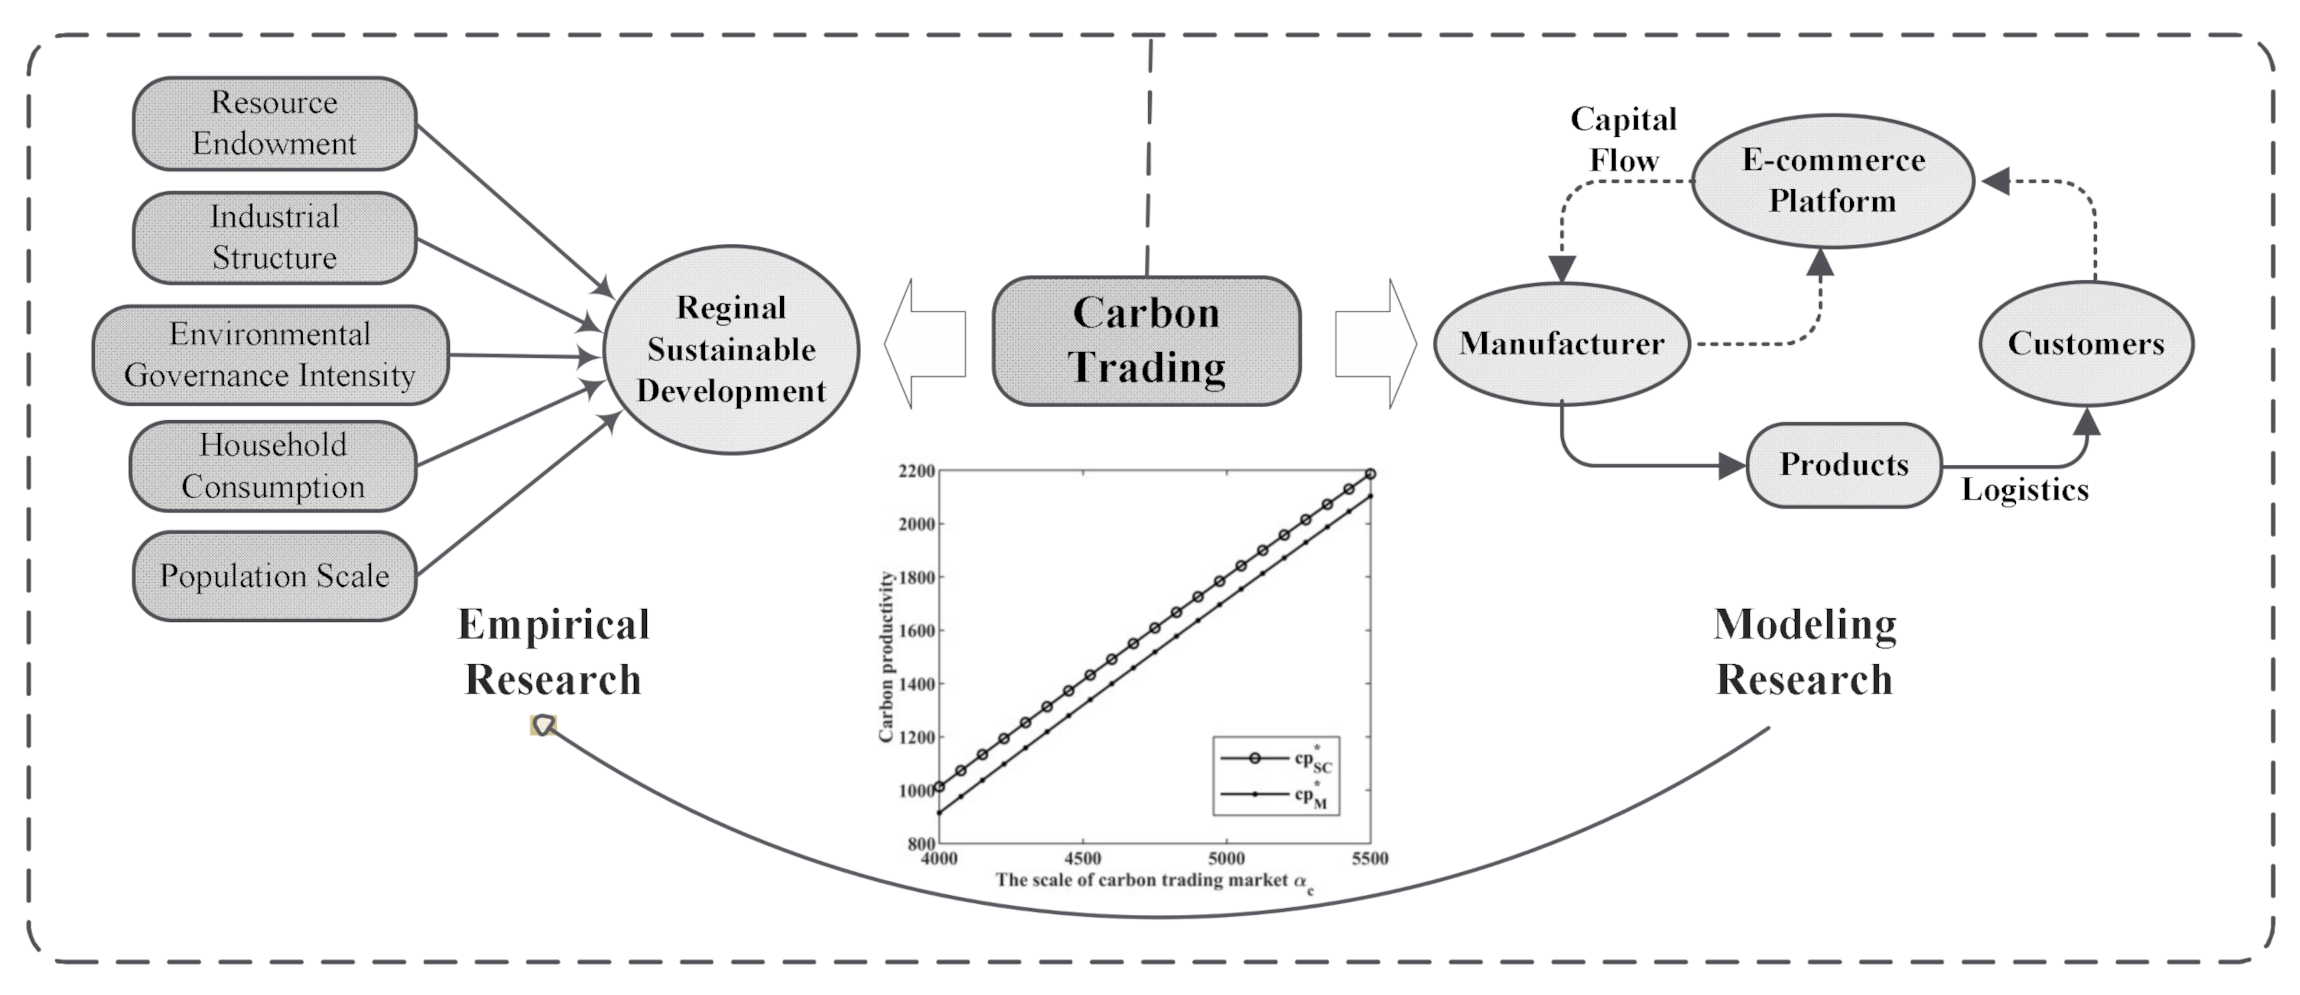
3. Problem Description and Assumptions

An LCE-SC model composed of an emission-dependent manufacturer and an agency-selling e-commerce platform is constructed in this paper and the model structure is shown in Figure 1. The manufacturer reaches cooperation with the e-commerce platform before production and sells products to online consumers through the platform. In return, the e-commerce platform charges a constant proportion of commission per unit of product [44]. Exogenous commission rate has been widely used in the research of the e-commerce supply chain [45]. In this working form, the manufacturer has the pricing power and can control the market demand through sales price. Settling in the platform, the manufacturer produces products and decides sales price. Carbon emissions are generated during production. If the carbon emissions are excessive, the manufacturer needs to purchase the carbon quota from other enterprises; otherwise, the surplus carbon quota is sold. The e-commerce platform provides the manufacturer with sales promotion services, such as online-store display, advertising, online customer service, and credit maintenance. Online consumers purchase products through the platform. Subsequently, the platform transmits the order to the manufacturer in charge of delivery. After consumers receive the product, the platform returns the payment to the manufacturer and charges a commission [46].
Assume that the carbon trading market has been established in the country or region, where the manufacturer can sell or purchase carbon emission. Similar to the product market, carbon trading price is affected by carbon emission.
The model symbols are described as follows:
c —unit production cost without consideration of the cost of CER.
p —unit sales price of products, the manufacturer’s decision variable.
ρ —commission rate, which represents the platform fee for the unit sales. The parameter is assumed to satisfy 0 < ρ < 1 c p to ensure that manufacturing is more lucrative.
s —service level of sales promotion for low-carbon products, the e-commerce platform’s decision variable. According to Nair and Narasimhan [47], the cost function is assumed to be C s = l s 2 / 2 , among which l l > 0 is the coefficient of service cost, specifically referring to the cost of improving the unit service level.
Y —total carbon emission, the manufacturer’s decision variable. Assuming that the emission cap of the manufacturer is Y U , which is the amount of carbon emission produced by the conventional production, and there is Y Y U . As the manufacturer invests in emission-reduction equipment, the cost for reducing carbon emission is assumed as I ( Y ) = h ( Y U Y ) 2 I ( Y ) = h ( Y U Y ) 2 I Y = h Y U Y 2 , where h h > 0 is the coefficient of emission-reduction cost. There are I Y 0 , I Y 0 , I Y > 0 , which mean that as CER increases (i.e., carbon emission decreases), the cost increases, and the marginal cost increases.
q —market demand for low-carbon products. Since the e-commerce platform’s sales service directly affects consumers’ online shopping experience, the market demand is sensitive to service level. Drawing on the demand function form of Xia et al. [48], it is supposed that the demand function is
q = α β p + γ s + k Y U Y
where α is the size of the product market, β , γ and k , respectively, represent sensitivity coefficients of price, service level, and CER for product demand.
p c —carbon price. The pricing mechanism of the carbon market is similar to the product market, which means that p c is affected by supply and demand. The inverse demand function is
p c = α c r Y
where α c is the scale of the carbon market, and r is the carbon price sensitivity coefficient which measures the punishment intensity for carbon emissions.
To ensure that the manufacturer who emits much carbon is punished, p c in the inverse demand function (i.e., Equation (2)) is allowed to be negative. p c > 0 means that the manufacturer invests in CER and sells the redundant carbon emission to obtain profits. The higher the carbon emission, the lower the profit. When p c < 0 , namely the emission is higher than α c / r , the manufacturer is obliged to purchase carbon emission or get punished due to high emission, thus paying a cost.
To ensure the practical meaning of the research problem, it is assumed that a c r Y U < 0 , which means the high-emission manufacturer suffers punishment. Moreover, 4 h + r β k 2 1 ρ > 0 , 2 r Y U α c > c k , α 1 ρ > c β , c k + 4 h Y U + 2 α c > A k l 1 ρ α + k Y U l β A 2 B , which can ensure that the optimal solutions of the model exist and are positive.
On the basis of the model assumptions, the manufacturer’s profit function in the product market is:
π M 1 = p c ρ p α β p + γ s + k Y U Y
The manufacturer’s profit function in the carbon market is:
π M 2 = a c r Y Y h ( Y U Y ) 2
The manufacturer’s total profit function is:
π M = π M 1 + π M 2 = p c ρ p α β p + γ s + k Y U Y + a c r Y Y h ( Y U Y ) 2
The e-commerce platform’s profit function is:
π E = ρ p α β p + γ s + k Y U Y l s 2 / 2

4. Optimal Decisions of LCE-SC and the Influence Mechanism of Carbon Trading

4.1. Optimal Decisions

In practice, the e-commerce platform formulates and publishes the conditions of entry for the manufacturer to settle in the platform, and most large-scale e-commerce companies, such as Tmall (https://www.tmall.com, accessed date 20 July 2021) and Youpin (https://www.xiaomiyoupin.com, accessed date 20 July 2021), set higher entry thresholds to maintain brand benefits. Only when the manufacturer satisfies the conditions can it enter and cooperate with the platform. Thus, with consideration of the actual operation of e-business, the leading enterprise in LCE-SC is assumed to be the e-commerce platform. The manufacturer, as the follower, follows the sale rules to sell low-carbon products. Thus, the platform and the manufacturer constitute a Stackelberg game model. In decision-making, the platform first decides its service level s . The manufacturer subsequently makes decisions on the carbon emission Y and the sales price p . The solutions of backward induction are shown as follows.
It can be derived from Equation (5) that the Hessian matrix of π M is H = 2 π M p 2 2 π M p Y 2 π M Y p 2 π M Y 2 = 2 1 ρ β k 1 ρ k 1 ρ 2 h + r and d e t ( H ) = 4 h + r β 1 ρ k 2 ( 1 ρ ) 2 > 0 . Besides, since 2 π M p 2 < 0 , there is a maximum of π M . The reaction functions of p and Y are the simultaneous solution of π M / p = 0 and π M / Y = 0 .
p = 2 h + r c β + 2 h + r α + s γ + k 2 r Y U α c c k 1 ρ 4 h + r β 1 ρ k 2 ( 1 ρ ) 2
Y = c k + 4 h Y U + 2 α c β k 1 ρ k Y U + α + s γ 4 h + r β k 2 1 ρ .
Substituting Equations (7) and (8) into Equation (6), 2 π E / s 2 = l < 0 can be derived, so the maximum of π E exists. According to π E / s = 0 , the e-commerce platform’s optimal service level is
s * = 2 B 4 α h + r c k 2 + 2 k 2 r Y U α c γ A 2 l 8 B h + r
The optimal sales price is derived by substituting Equation (9) into Equation (7).
p * = F 2 + c F 3 + F 6 1 ρ F 3
Similarly, according to Equations (8) and (9), the optimal carbon emission is
Y * = A l β 2 B c k + 4 h Y U + 2 α c A k l 1 ρ α + k Y U A 2 l 8 B h + r
According to y = Y / q , the optimal unit carbon emission of the product can be calculated.
y * = 1 ρ F 4 β 8 B c h + r + F 2 + F 6
Correspondingly, the manufacturer’s profit in the product market is
π M 1 * = 2 h + r β F 1 + F 2 2 h + r F 1 + F 2 F 3 2 1 ρ
The manufacturer’s profit in the carbon market is
π M 2 * = α c F 3 F 4 r F 4 2 h ( Y U F 3 F 4 ) 2 F 3 2
The manufacturer’s total profit is
π M * = 2 h + r β F 1 + F 2 2 h + r F 1 + F 2 F 3 2 1 ρ + α c F 3 F 4 r F 4 2 h ( Y U F 3 F 4 ) 2 F 3 2
The e-commerce platform’s profit is
π E * = 1 F 3 2 β ρ 2 h + r F 1 + F 2 2 h + r F 1 + F 2 + c F 3 ( 1 ρ ) 2 2 l h + r β ρ F 5 2
The common factors are as follows: A = 4 h + r β k 2 1 ρ , B = h + r β γ 2 ρ , F 1 = 2 B c + A l α c β α ρ , F 2 = A k l 1 ρ 2 r Y U α c , F 3 = A 2 l 8 B h + r , F 4 = A l β 2 B c k + 4 h Y U + 2 α c A k l 1 ρ α + k Y U , F 5 = 4 α h + r c k 2 + 2 k 2 r Y U α c , F 6 = 2 A l h + r α c β α ρ .

4.2. Analysis of LCE-SC Model

Proposition 1.
Manufacturer’s optimal carbon emission Y * and the unit carbon emission y * are positively related to Y U , α c , and h , while Y * and y * are negatively related to k and r . Y * is positively related to ρ , while there are two cases of the relationship between y * and ρ : when ρ satisfies ρ < 1 F 2 + 8 h + r B c + F 6 k l k Y U + α 1 ρ 2 A k 2 1 ρ + c k + 4 h Y U + 2 α c β F 7 F 4 2 c β h + r 4 h + r γ 2 k 2 l l 2 h + r β k 2 1 ρ F 5 + c k 2 , y * is negatively related to ρ ; otherwise, y * is positively related to ρ .
Note that F 7 = 2 k 2 l 1 ρ + 2 h + r γ 2 2 ρ 1 4 h + r l β .
Proof of Proposition 1.
See Appendix A. □
According to Proposition 1, except ρ , the correlations of other parameters with Y * and y * are similar. Thus, these two decision variables are represented by carbon emission here.
For the manufacturer, the carbon emission increases with the emission cap Y U . Therefore, the carbon emission of the high-cap manufacturer is still high under carbon trading and CER. With the increase in the coefficient of emission-reduction cost h , the manufacturer pays more for CER, and the revenues from the products market and carbon market are insufficient to cover the cost. Therefore, the manufacturer prefers high carbon emissions to ensure profit.
With the increase in the commission rate ρ , in order to obtain a high profit after paying commission, appropriate depression of CER is an alternative method for the manufacturer to control costs. However, the unit carbon emission decreases first and then increases with the commission rate. The reason lies in the significant increase in product demand caused by the increase in the commission. Hence, the total carbon emission increases, but the unit emission decreases. Once the threshold of the commission rate is exceeded, a serious distribution inequity erodes the manufacturer’s enthusiasm for production, which means that the market demand drops off and the unit carbon emission goes up. The practical significance of this conclusion is that increasing the commission rate leads to environmental deterioration, and once the commission rate is too high, the market share of the product will be seriously damaged. It is more advantageous to control the commission rate in a lower range to realize the benign operation of the supply chain. In addition, the higher the sensitivity coefficient of CER k , the higher the market demand for low-carbon products, which further motivates the manufacturer to control emissions.
Changes in the scale of the carbon market α c and the carbon price sensitivity coefficient r reflect the influence mechanism of the carbon market. A larger scale of carbon market means a higher threshold for the manufacturer to bear high-emission punishment, which lowers the enthusiasm for CER and results in higher carbon emissions. Moreover, a larger carbon price sensitivity coefficient means that high emissions can lead to an excessively low or negative carbon price, causing substantial economic loss. In this situation, the manufacturer tends to reduce emissions to obtain profit. This shows that the carbon market directly affects the carbon emission of the manufacturer, and government departments can regulate the carbon emissions of manufacturing enterprises by adjusting the supply and demand relationship in the carbon market.
Proposition 2.
The e-commerce platform’s optimal service level s * is positively related to Y U , ρ , and k , while s * is negatively related to α c and h . There are two cases of the relationship between s * and r : when r satisfies c k + 4 h Y U + 2 α c > 2 k l A 1 ρ F 5 / F 3 , s * is positively related to r ; otherwise, s * is negatively related to r .
Proof of Proposition 2.
See Appendix B. □
As can be seen from Proposition 2, with the increase in the emission cap Y U , carbon emission and emission reduction ( Y U Y * ) both increase. The e-commerce platform is willing to provide a better sales promotion service for low-carbon products. It is indicated that in Proposition 1, a higher coefficient of emission-reduction cost h leads to more carbon emission. As a result, the e-commerce platform puts less emphasis on the products, and the service level decreases accordingly. With the increase in the sensitivity coefficient of CER k , the market demand increases. The increasing profit impels the platform to improve sales service to promote its brand value. When referring to the carbon market, the influence mechanism of the scale of the carbon market α c is found to be similar to h . Besides, the correlation between the optimal service level and the carbon price sensitivity coefficient r is first positive and then negative. When r is small, increasing the coefficient impels the manufacturer to reduce emission, and its low-carbon products can gain more favor from e-commerce platform; when r is large, the manufacturer’s profit gained for emission reduction is far less than the cost, so the increment of emission reduction decreases, and a lower service level is provided by the e-commerce platform. The carbon price sensitivity coefficient indirectly affects the sales promotion service of the e-commerce platform, that is, blindly strengthening the punishment intensity for carbon emissions is not conducive to improving the service level, which will affect consumers’ online shopping experience. The practical significance of this conclusion is that the government should control environmental regulation within a certain intensity range.
Proposition 3.
The optimal sale price p * is positively related to Y U , ρ , k , and r , while p * is negatively related to α c and h .
Proof of Proposition 3.
Similar to that of Proposition 1. □
According to Proposition 1, as the emission cap Y U increases, the manufacturer suffers more punishment in the carbon market. Therefore, Proposition 3 shows that the sales price increases to make up for this loss. This means that the high-cap manufacturer’s sales price is higher than the low-cap one’s. However, an increased coefficient of emission-reduction cost h erodes the enthusiasm of the manufacturer for reducing emission, and the decline in variable costs leads to a lower sales price. Similarly, increasing the sensitivity coefficient of CER k can help lower carbon emissions. For the sake of maximizing its profit, the manufacturer increases sales price to compensate for the emission-reduction cost. As for the commission rate ρ , the increase in this parameter means that the e-commerce platform divides more profit. As a result, the manufacturer tends to guarantee its own profit by increasing sales price. Since the increase in the carbon-market scale α c implies a decrease in the punishment for carbon emissions, the impact of α c on the sales price is the same as the impact of h . On the contrary, increasing the carbon price sensitivity coefficient r causes the high-emission manufacturer to purchase carbon emissions and the low-emission one to pay more for CER according to the law of increasing marginal cost. As a result, the sales price increases. This conclusion is consistent with the research of Xing et al. [49] which shows that increasing sales price is the optimal strategy for the manufacturer under carbon trading.
Proposition 4.
(1) The optimal manufacturer’s profit π M * is positively related to α c and k , while π M * is negatively related to Y U , h , and ρ . (2) The optimal e-commerce platform’s profit π E * is positively related to Y U , r , and k , while π E * is negatively related to α c and h .
Proof of Proposition 4.
Similar to that of Proposition 1. □
As can be seen from Proposition 4, with the increase in the emission cap Y U , the manufacturer’s profit decreases, and the e-commerce platform’s profit increases. In the context of carbon trading and CER, the profit of the high-cap manufacturer is lower, and the e-commerce platform cooperating with the high-cap manufacturer gains a higher profit. Moreover, as the coefficient of emission-reduction cost h increases, the sales price and market demand of the products decrease but the carbon emission increases. The manufacturer’s revenues in the product market and the carbon market are insufficient to cover the increasing emission-reduction costs, which results in a decline in the profits of both members in LCE-SC. On the contrary, increasing the sensitivity coefficient of CER k causes an increase in the product demand, which boosts the manufacturer’s revenue in the product market as well as the e-commerce platform’s profit. Similarly, the carbon price sensitivity coefficient r increases the platform’s profit. Understandably, a higher commission rate ρ brings less profit to the manufacturer. Since the expansion of the carbon market α c causes a decrease in sales price and demand, the sales revenue and the profit shared by e-platform decline. However, the increase in the manufacturer’s carbon revenue and the decline in the cost of CER boost its own profit.
Different from the previous conclusion that reducing carbon emission harms the profits of supply chain members [41,50], this paper points out that emission reduction does not erode the profits of supply chain members by comparing Proposition 1 and Proposition 4. On the contrary, by enhancing consumers’ low-carbon preference or reducing the manufacturer’s emissions-reduction cost, profits of the members in LCE-SC all increase, and carbon emission decreases, thus improving supply chain operation.

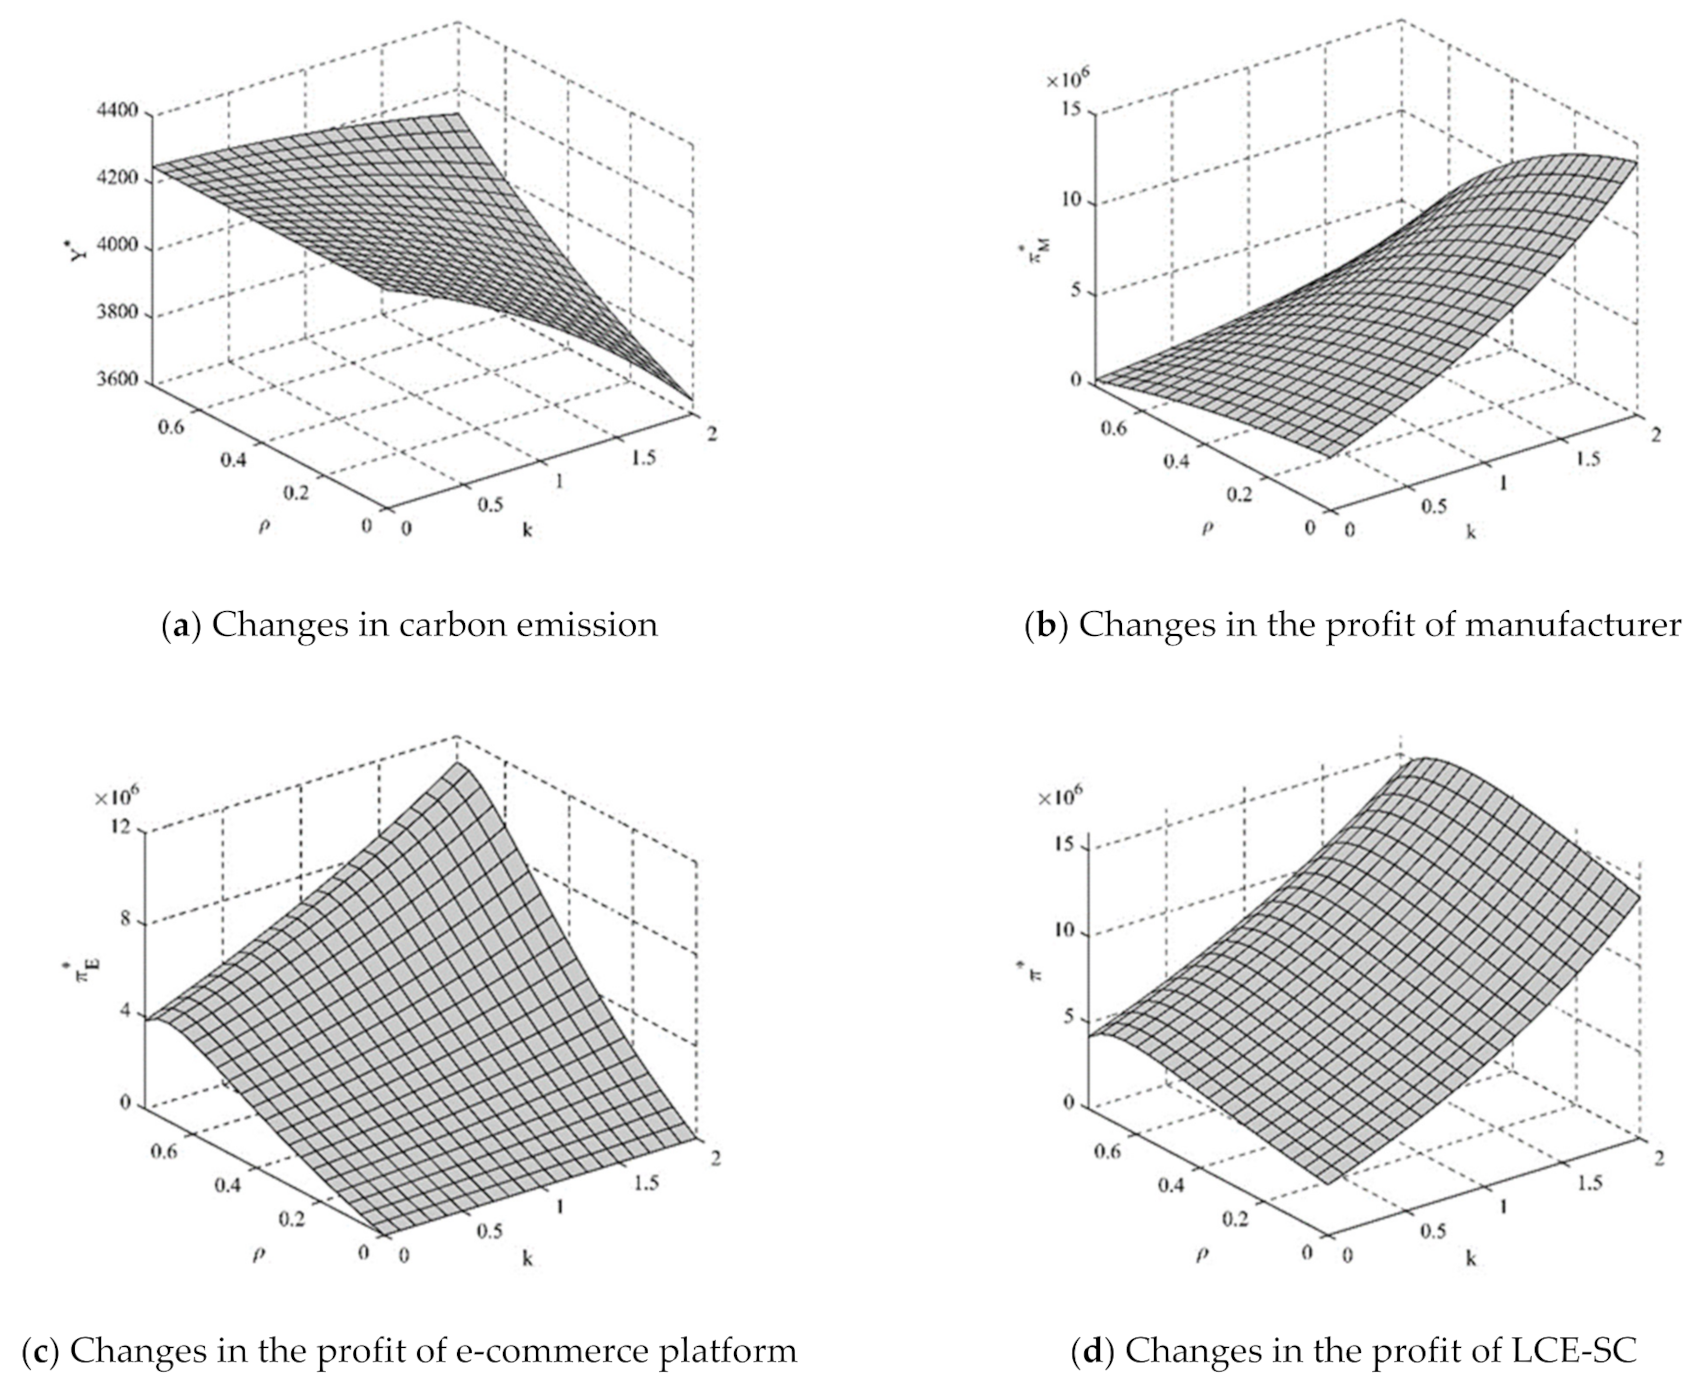
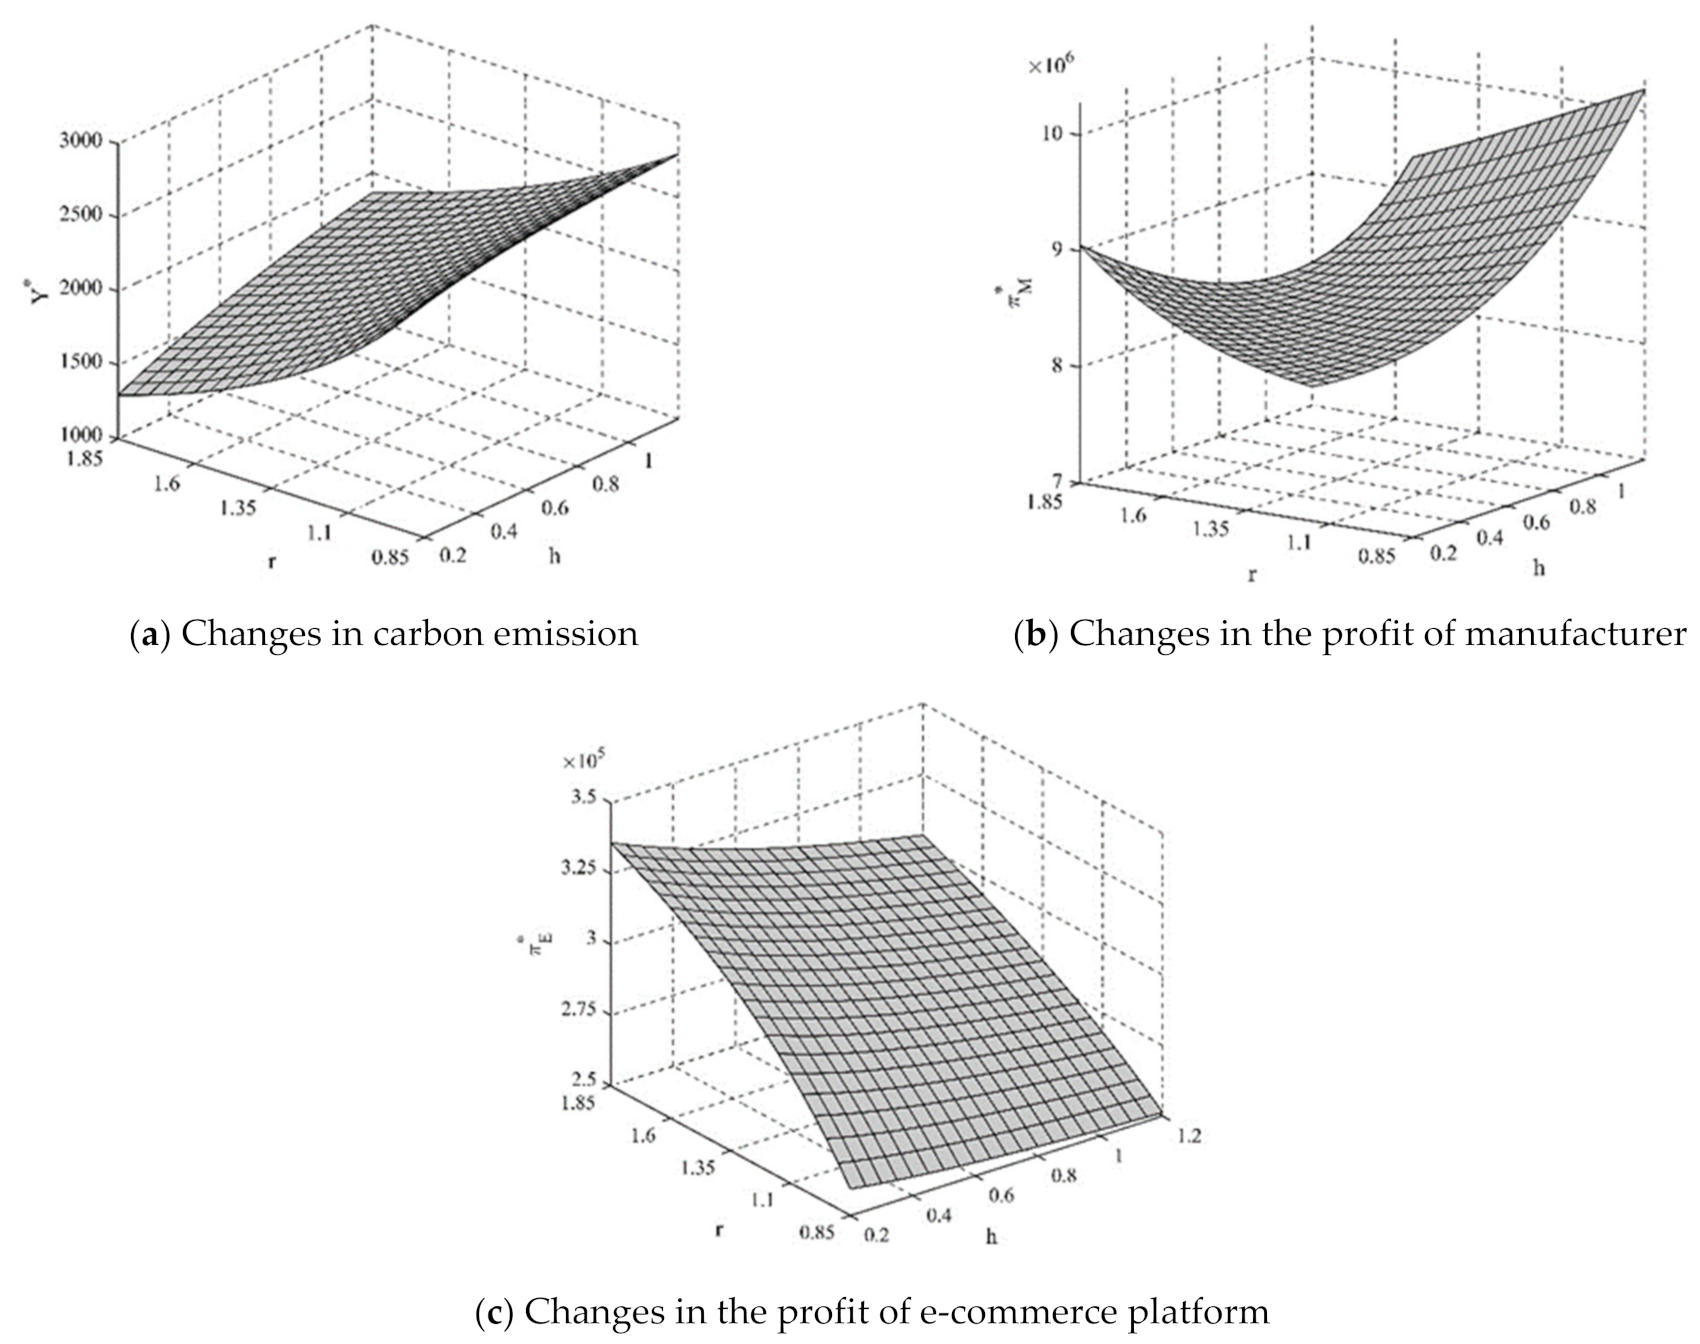
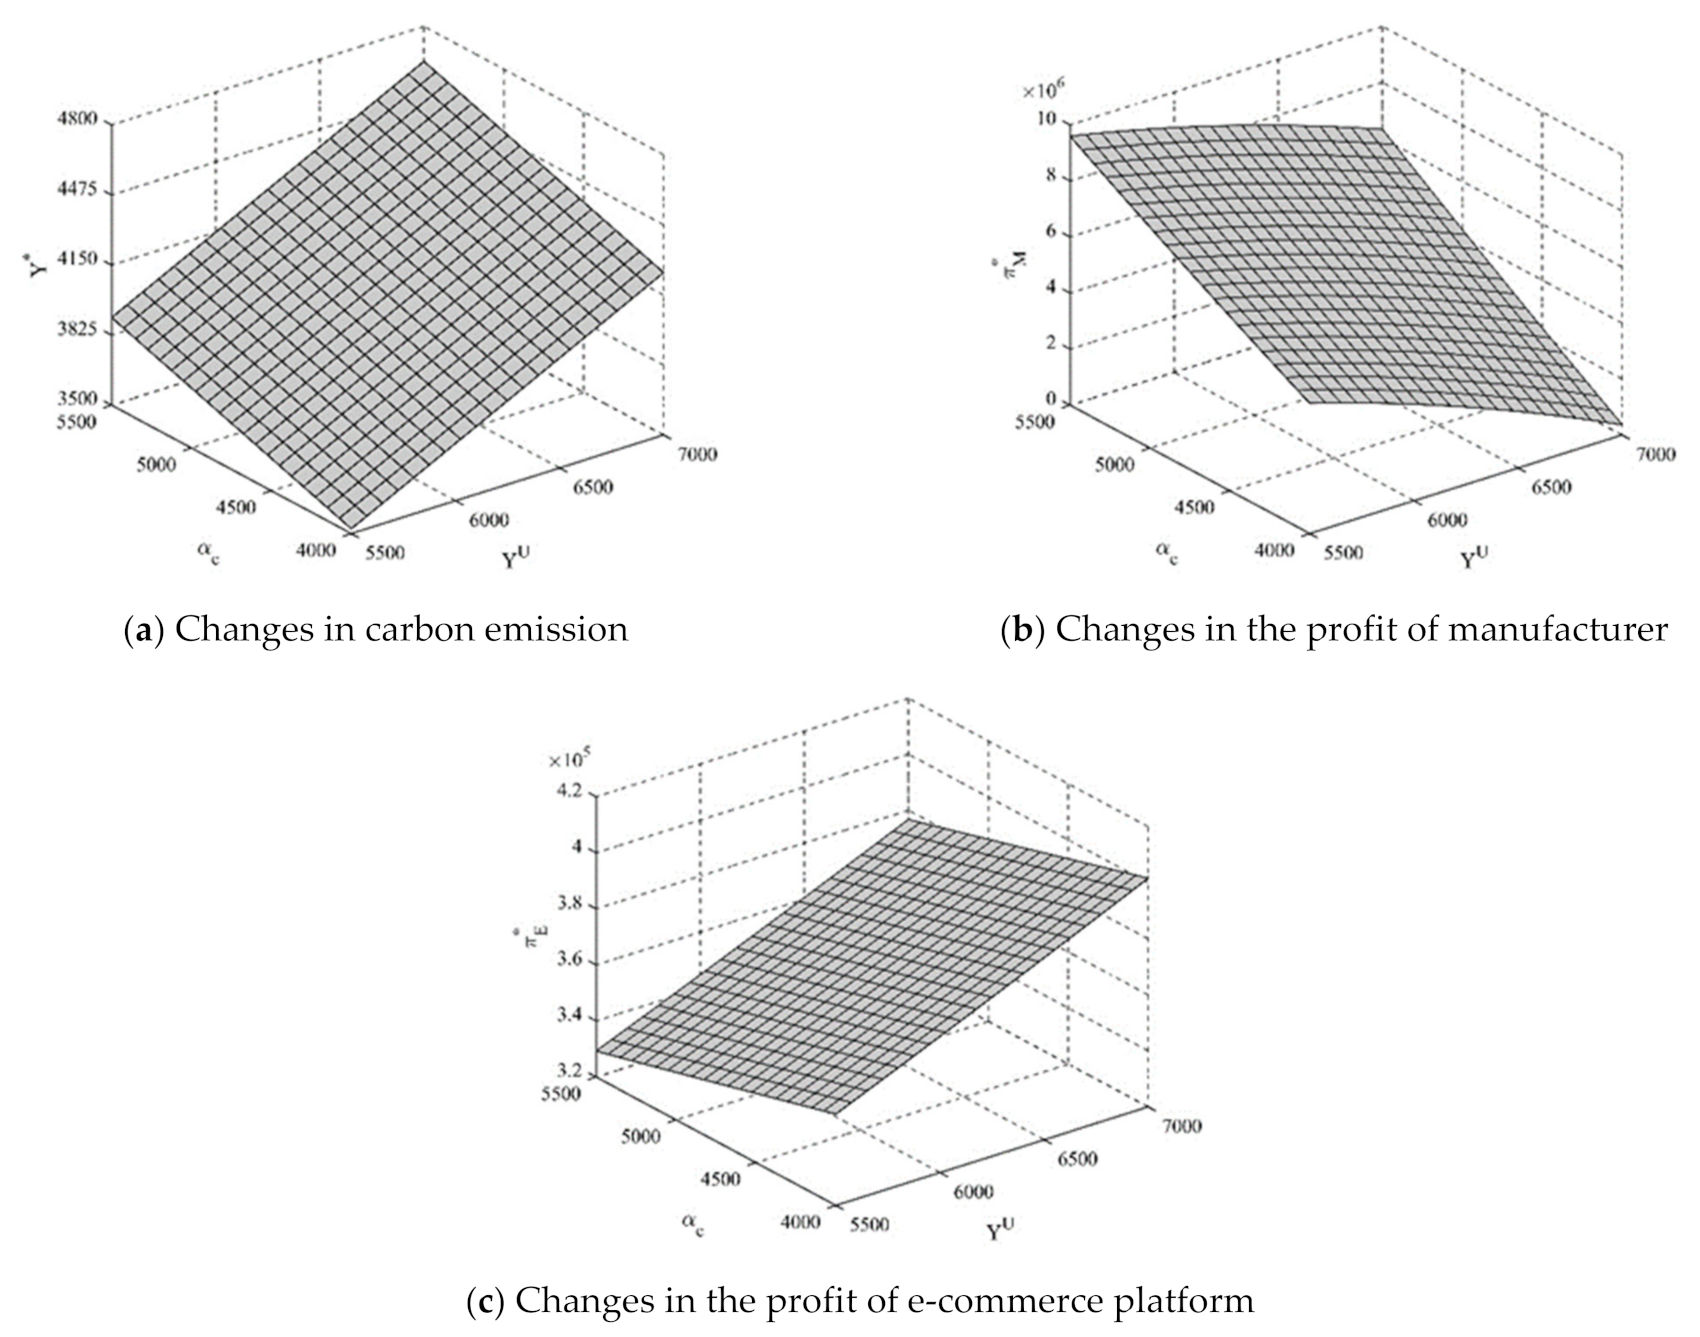
4.3. Numerical Analysis

In order to verify the above propositions and further discuss the influence of the parameters on the decision-making of LCE-SC, numerical examples are given below. Drawing on the research of Shen and Wang [51] and Wang et al. [23], the base parameters are supposed to be α = 10000 , β = 5 , γ = 2 , c = 500 , l = 1 .
Analyze the impact of commission rate ρ and the sensitivity coefficient of CER k on the LCE-SC’s performances. Based on the base parameters, assume that Y U = 6000 , α c = 5000 , h = 1 , and r = 1 , and take ρ and k as independent variables. The changing surfaces of economic and environmental performances are shown in Figure 2.
As can be seen from Figure 2d, with the appropriate increase in the commission rate ρ , the optimal profit of the LCE-SC increases. This is because the increase within a reasonable range in the commission rate causes an increase in market demand, which makes the supply chain maintain high profitability. It can be concluded that for LCE-SC, the implementation of carbon trading alleviates the negative impact of the unfair profit distribution. However, a high commission rate loses its coordinating role, and market demand drops significantly, which results in a decline in the overall profit of LCE-SC. Although the e-commerce platform obtains a high percentage of profit, its actual profit declines, which can explain why the commission rates set by major e-commerce platforms often do not exceed 30%. Additionally, no matter how the commission rate changes, increasing consumers’ preference for low-carbon products is conducive to CER and also increases the profits of both parties. Moreover, the lower the commission rate, the more significant the marginal influence of the sensitivity coefficient of CER k on reducing emission and manufacturer’s profit, which shows that as consumers’ low-carbon preference is enhanced, a lower commission rate is beneficial to environmental protection.
Analyze the impact of the coefficient of emission-reduction cost h and carbon price sensitivity coefficient r on the LCE-SC’s performances. Based on the base parameters, assume that ρ = 0.05 , k = 1 , α c = 5000 , and Y U = 6000 , and take h and r as independent variables. The changing surfaces of economic and environmental performances are shown in Figure 3.
It is graphically shown in Figure 3b that the influence of the carbon price sensitivity coefficient r on the manufacturer’s profit is first negative and then positive. With the increase in r , carbon emission decreases according to Figure 3a, and the manufacturer’s revenue is not enough to cover the ever-growing emission-reduction cost, resulting in a decrease in its profit. When r is too high, the manufacturer still chooses to reduce emission, but the extent of reduction becomes smaller. At this time, boosting sales revenue can make up for the emission-reduction cost, and the profit increases. It is illustrated in Figure 3b,c that, as r increases, the marginal impacts of emission-reduction cost coefficient h on profits of both members in LCE-SC increase. This shows that when r is in the low-value range, the method to optimize the emission-reduction program for reducing cost has a certain limitation; when r is larger, the marginal profit by optimizing the emission-reduction program is higher.
Analyze the impact of carbon emission cap Y U and the scale of the carbon market α c on the LCE-SC’s performances. Based on the base parameters, assume that ρ = 0.05 , k = 1 , h = 1 , and r = 1 , and take Y U and α c as independent variables. The changing surfaces of economic and environmental performances are shown in Figure 4.
As illustrated in Figure 4, the changing surface of each variable with the carbon emission cap Y U and the scale of the carbon market α c is almost flat. It can be concluded that the changes in the carbon-market scale have the same impacts on the carbon emissions of both high-cap and low-cap enterprises and the profits of both members in LCE-SC. According to Proposition 1, the government can regulate carbon emissions through the scale of the carbon market, and the above conclusion indicates that this measure cannot produce differentiated CER effects for high-cap and low-cap enterprises, which causes a certain limitation.
With the rapid growth of the national economy, environmental issues related to the over-consumption of resources and energy have become more serious in China. Excess carbon emission has caused the greenhouse effect, which attracts widespread attention [52]. In the context of low carbon, enterprises seek a balance between maintaining profit growth and controlling carbon emission. However, the existing research centers on the impact of carbon trading on the industry from a macro perspective or the impact on corporate decision-making from a micro perspective [11], and there is no research combining the two. On the one hand, as important micro-units in the regional economy [53], enterprises are the main force to drive regional economic development. On the other hand, industrial enterprises are the focus to control carbon emissions, and their total amount of CER reflects the whole industry’s effort to conserve energy and reduce emissions. Therefore, it is of practical significance to expand the micro research to the macro level.
The key to balancing economic development and emission reduction is to increase carbon productivity which is also the unique way for developing countries to achieve sustainable development [54]. To ascertain the influence of carbon trading on carbon productivity, assuming that ρ = 0.05 , k = 1 , h = 1 , r = 1 , and Y U = 6000 , α c is taken as the explanatory variable. Changes in LCE-SC’s carbon productivity ( π M * + π E * Y * ) and emission-dependent manufacturer’s carbon productivity ( π M * Y * ) are shown in Figure 5. As shown in this figure, increasing the scale of the carbon market promotes the carbon productivities of both LCE-SC and the manufacturer. It can be preliminarily inferred from the micro perspective that enterprises’ carbon productivity is improved due to the implementation of carbon trading. Then, what is the implementation effect of the carbon trading mechanism on the macro level? In the next section, the issue is addressed by empirical analysis. Considering the authority and availability of statistical data, regional carbon productivity is selected as the indicator to measure the sustainable development level of the enterprise group. The research relationships from the micro perspective and the macro perspective are shown in Figure 6.

5. An Empirical Analysis of the Influence of Carbon Trading on Regional Enterprises’ Sustainable Development

5.1. The Method of Empirical Analysis

Based on natural experiments and pooled cross-sections, the Difference-in-Difference method (DID) is widely adopted in evaluating the implementation effect of specific policies [55]. The advantage of DID lies in controlling the discrepancy between the experimental group and the control group before and after implementing the policy to eliminate some uncontrollable and unpredictable factors [56]. The basic form of DID is: Y g t = β 0 + β 1 T g + β 2 P t + β 3 T g × P t + ε g t , among which T g and P t are dummy variables with g = 1 , , G indexing cross-sectional units and t = 1 , , T indexing periods. The interaction item is the estimation of the treatment effect under the parallel trend assumption [57]. In recent years, the DID gradually became the mainstream method for measuring the effect of carbon trading. For example, Zhang et al. [36] and Dong et al. [58] empirically analyzed the implementation effect of carbon trading policy on the basis of provincial panel data and the DID method. Zhu et al. [59] explored whether the carbon trading policy promotes green development efficiency in China by DID.
However, the selection of carbon trading pilots is not arbitrary. Instead, it is dependent on the regional economic level, historical data of carbon emission, environmental regulation, and other important indicators, which causes heterogeneity. Among such observational studies, scholars tend to choose the Propensity Score Matching (PSM) to overcome the selective bias in causality assessment [60]. Rosenbaum and Rubin [61] proved that among the observation subjects that match the propensity scores, the treatment group and the control group have similar baseline characteristic distribution. Therefore, scholars tend to combine the PSM and DID methods to verify the policy effect. For example, based on provincial panel data, Zhou et al. [35] conducted an empirical study to assess the influence of carbon trading policy using PSM-DID. With reference to previous research, this paper adopts PSM-DID to empirically analyze the influence of the carbon trading mechanism on regional sustainable development.

5.2. Variable Selection and Data Sources

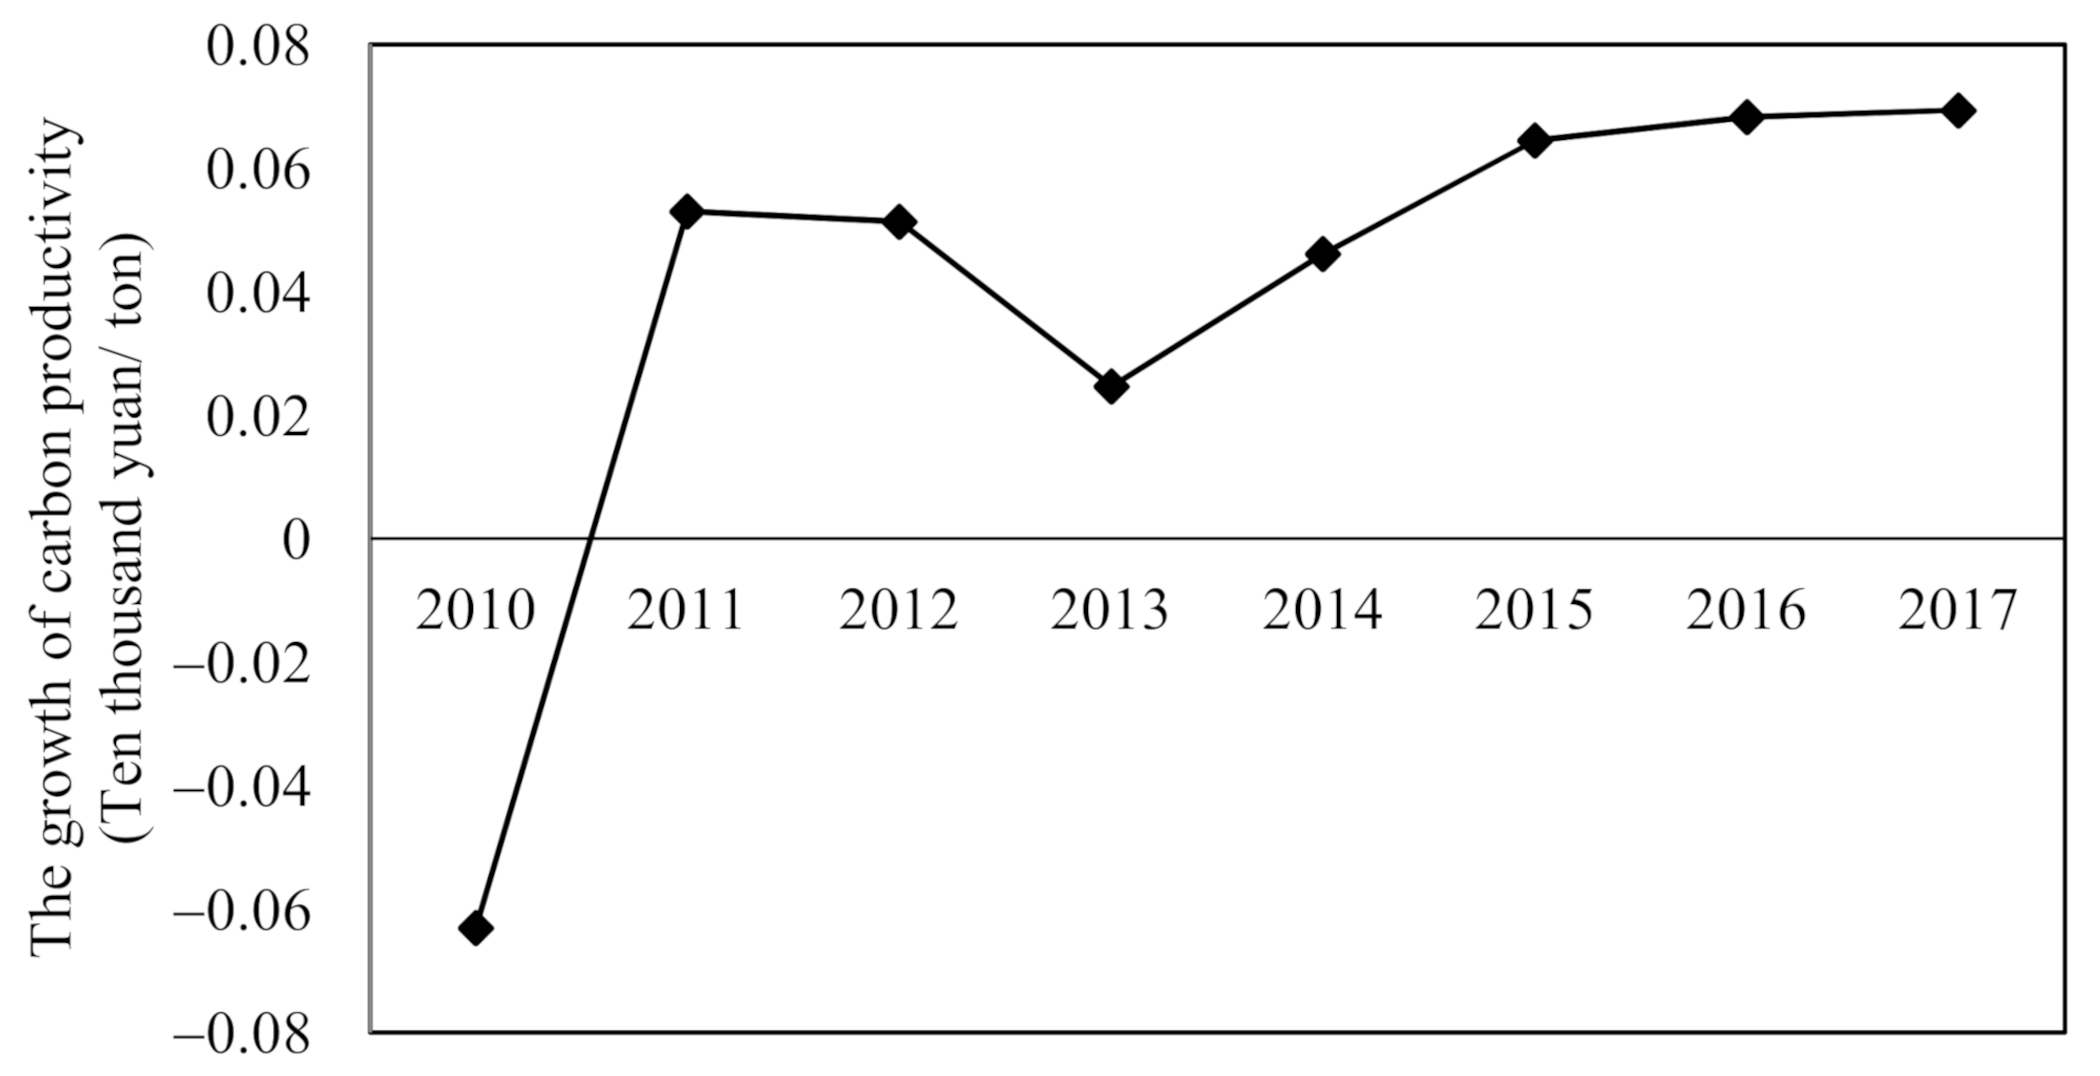
5.2.1. Carbon Productivity

The research object of this section is the influence of the carbon trading mechanism on regional sustainable development. With reference to Zhang et al. [62], it is found that scholars prefer to choose carbon intensity as the dependent variable for empirical research. However, for developing countries, carbon intensity is more suited to measuring carbon emission reduction rather than stressing economic development. Thus, referring to Wang et al. [63], carbon productivity, which reflects GDP per unit carbon emission, is selected as the dependent variable. The higher carbon productivity means greater economic output and lower carbon emission, so carbon productivity can measure a country’s or a region’s effort to deal with the global warming problem, and place more emphasis on economic growth.

5.2.2. Control Variables

With reference to Yan et al. [64] and Hu et al. [65], resource endowment and industrial structure are selected as control variables in this paper. According to Proposition 2, environmental governance intensity is added. On this basis, referring to Xu et al. [66], household consumption and population scale are supplemented to reduce the endogenous deviation between the treatment group and the control group due to demographic factors. Table 2 shows the specific measurement methods of these variables.

5.2.3. Data Sources and Descriptive Statistics

Taking into account the availability and timeliness of the data, provincial panel data from 2009 to 2017 are used. The data of Tibet, Hong Kong, Macao, and Taiwan are excluded from the research since there are relatively more defaults. The original data sources for calculating the variables are as follows: GDP, investment in fixed assets of the mining industry (excluding rural households), investment of fixed assets in the whole society, GDP of the secondary industry, investment completed in the treatment of industrial pollution, and population at year-end come from the China Statistical Yearbook of 2010 to 2018 and the provincial annual database of the National Bureau of Statistics. The household consumption is from the China Energy Statistical Yearbook of 2010 to 2018. Table 3 shows the descriptive statistics of variables in the model.
According to Table 3, from 2009 to 2017, carbon productivity increased year by year, while resource endowment generally showed a downward trend, but rebounded slightly in 2011. Industrial structure showed an upward trend from 2009 to 2011 and began to decline in 2012. Environmental governance intensity was in an unstable fluctuation, peaking in 2014, and it reached the lowest in 2017. Household consumption and population scale increased from 2009 to 2017. It can be seen that the changing trends of each control variable and the explained variable are not exactly the same or the opposite. Therefore, whether these control variables have a significant impact on carbon productivity needs to be further verified.

5.3. Model Construction

Calculate the ring growth of China’s carbon productivity, and draw a line chart in time series. As shown in Figure 7, before 2013, the changes in China’s carbon productivity were in an unstable fluctuation, but since the carbon trading mechanism was implemented, carbon productivity has been steadily increasing. It is preliminarily inferred that the carbon trading mechanism improves carbon productivity. Therefore, the implementation of the carbon trading mechanism is regarded as a natural trial, where pilot provinces and cities constitute the treatment group and the control group includes other provinces. Specifically, Beijing, Shanghai, Guangdong Province (Shenzhen is included in Guangdong Province), Tianjin, Hubei Province, Chongqing, and Fujian Province compose the treatment group, while the control group consists of other provinces excluding Tibet, Hong Kong, Macao, and Taiwan. Since the pilots were initiated in 2013, 2009–2012 is regarded as the pre-implementation period with 2013–2017 as the implementation period. Carbon trading’s implementation effect is evaluated by contrasting the changes in the two periods between the treatment group and the control group. The absolute variables such as carbon productivity, household consumption, and population scale are logarithmically processed. The regression model based on the DID method with the control variables added is as follows:
l n   C P i t = β 0 + β 1 p e r i o d t + β 2 t r e a t e d i + β 3 d i d i t + β 4 C V i t + μ i t
Among the model, i indexes region, hile t indexes year. d i d i t = p e r i o d t × t r e a t e d i is the interactive item that reports the net implementation effect of carbon trading and is the core explanatory variable of the regression model. p e r i o d t is the time dummy variable. p e r i o d t = 1 indicates that carbon trading has been implemented that year, while p e r i o d t = 0 indicates the opposite. t r e a t e d i is the region dummy variable. t r e a t e d i = 1 indicates the province or city is the pilot area, while t r e a t e d i = 0 indicates the opposite. l n   C P i t represents the logarithm of carbon productivity, and C V i t represents the set of control variables.

5.4. Analysis of Regressive Results

5.4.1. Preliminary DID Analysis

The influence of carbon trading on regional carbon productivity is analyzed by DID. Table 3 shows the regressive results of Stata15.1. The results point out that the effect of the interactive item on the carbon productivity of pilot regions is positive with the 1% significant level, which implies that the carbon trading mechanism has a positive impact on regional sustainable development.
Although the regressive results preliminarily verify the implementation effect of carbon trading, the parallel trend assumption that the pilot regions and other regions possess the same changing trend of carbon productivity should be satisfied. Therefore, data in the respective four years before and after implementing the carbon trading mechanism are selected to test the parallel trend. A regression model is constructed with the interaction item and l n   C P as the independent and dependent variables, respectively. As shown in Table 4, B e f o r e variables are all significant and the parallel trend assumption is not satisfied, which implies the self-selection bias in the pilot region cannot be ruled out.

5.4.2. Analysis of PSM Results

In order to eliminate the self-selection bias and make the pilot regions and other regions meet the parallel trend assumption, the PSM method is selected to improve the matching degree between the two groups. After the nearest neighbor matching, the estimated value of the average treatment effect on the treated (ATT) is 0.405 and the t value is 3.48 at the 1% significant level. Therefore, the ATT is significantly positive, which indicates that the establishment of carbon trading pilots significantly promotes regional carbon productivity.
To test whether the distribution of each control variable in the treatment group and the control group is balanced after matching, a t-test is adopted. As shown in Table 5, after matching, the biases of resource endowment, environmental governance intensity, and household consumption are reduced by more than 90%, and deviations of industrial structure and population scale have also been improved to a certain extent. Moreover, the p values of each control variable do not pass the test of significance at the level of 10%. It can be deduced from the results that the null hypothesis that there is no systematic difference between the two groups is accepted. The result of PSM is valid, and PSM-DID can be used to estimate the implementation effect of carbon trading.

5.4.3. PSM-DID Regression Analysis

After PSM, observations that did not satisfy the common support assumption are deleted. Then the DID method is used for regression, the results are shown in Table 6 where control variables are not added in Model 1 but added in Model 2. Comparatively analyzing the two models, it is found that there is an obvious improvement of R 2 in Model 2 compared with Model 1, which shows that adding control variables increases the goodness of fit. Thus, analysis of the influence of each control variable on carbon productivity has practical significance.
The results in Table 7 are as follows:
Whether or not the regression model is added control variables, the coefficient of the core explanatory variable, d i d , is significantly positive at the 5% significant level. This shows that after eliminating the self-selection bias as much as possible, the net implementation effect of carbon trading on carbon productivity is significantly positive. This suggests that carbon trading is conducive to regional sustainable development, and the model is robust.
The higher the fixed assets investment of the mining industry, the lower the regional carbon productivity; the higher the gross annual value of the secondary industry, the more disadvantageous to regional sustainable development. The impact of R E on carbon productivity is significantly negative at the level of 0.1%, which indicates that resource endowment is an important factor that affects carbon productivity. It is also worth noting that dependence on resources is not conducive to the development of technologically innovative industries. Since the impact of I S is significantly negative at the 1% significant level, it is imperative to promote the industrial transformation to achieve sustainable development.
The greater the intensity of environmental governance, the lower the regional carbon productivity. The impact of E G I on carbon productivity is significantly negative at the 0.1% significant level, which indicates that excessive environmental regulation is unbeneficial to regional development. It is of significance to optimizing environmental governance programs.
The enlargement of the population scale is conducive to regional sustainable development, while the increase in household consumption drops regional carbon productivity. The impacts of l n   H C and l n   P O P on l n   C P are significant at the level of 0.1%, but the former’s coefficient is negative and the latter’s is positive. It is shown that the low-carbon lifestyle plays a positive role in promoting carbon productivity, and appropriate population growth fills the labor shortage of high-tech industries and promotes regional sustainable development.

5.4.4. Placebo Test

In order to verify the validation of the DID model after PSM, a placebo test was conducted. We randomly assigned the treated group and the control group, randomly assigned the time node of policy implementation, and re-estimated the model. This process is repeated 1000 times. If the estimated coefficient of the interaction item is not significant, the regression model of PSM-DID in Section 5.4.3 is proved valid. The result of the placebo test is shown in Figure 8. It can be seen that the estimated coefficient of the interaction term is distributed around 0 and obeys the normal distribution, which shows that the DID model passes the placebo test.

6. Results and Discussion

By establishing the LCE-SC model and conducting empirical analysis, we achieve the goal of finding the influences of carbon trading on optimal decisions and sustainable development. The important results are summarized below.
The existing literature shows that increasing the commission rate will harm the revenue of the E-SC [20]. However, we found that in the LCE-SC, increasing the commission rate within a reasonable range improves the profitability of LCE-SC, which indicates that implementing carbon trading can effectively alleviate the negative impact of unfair profit distribution. Moreover, as consumers’ low-carbon preference is gradually enhanced, a lower commission rate is more conducive to CER. However, the unit carbon emission decreases first and then increases with the commission rate. Compared with the low-cap manufacturer, the high-cap one’s sales price is higher but profit is lower. The e-commerce platform cooperating with the high-cap manufacturer can make more profits.
When discussing carbon trading, the extant literature assumes that the carbon price is a fixed exogenous variable [40,41,42,43]. However, we assumed that the carbon price is affected by Demand and Supply and found that with the increase in the carbon price sensitivity coefficient, the e-commerce platform’s sales promotion service first increases and then declines, and the manufacturer’s profit first declines and then increases. The higher the carbon price sensitivity coefficient, the higher the marginal profits that members in LCE-SC can obtain by optimizing the coefficient of emission-reduction cost. Besides, changes in the carbon market scale have the same impacts on the decisions of both high-cap and low-cap enterprises.
We find from both the modeling analysis and empirical research that the implementation of carbon trading significantly improves regional carbon productivity, and it is noteworthy that controlling the intensity of environmental regulation is conducive to regional sustainable development. In addition, promoting industrial transformation, advocating a low-carbon lifestyle, and appropriately relaxing population restriction are empirically proven to be effective in increasing carbon productivity.
As the impact of carbon trading expands, and the cultivation of sinking markets promotes the continuous and rapid development of the e-commerce industry, it is imperative to explore the impact of carbon trading on LCE-SC and regional sustainable development. Compared with existing studies, the innovation of our research includes two aspects: on the one hand, the existing research only considers the production and inventory decisions of the traditional offline supply chain affected by carbon trading, such as in [67,68,69]. This paper introduces the carbon trading mechanism into the e-commerce supply chain for the first time, complementing the research on the interaction of carbon trading and supply chain management.
On the other hand, the existing research discussing the policy effect adopts micro research methods only, such as in [50,70] showing the influences of carbon tax and carbon quota by modeling analysis, respectively, or macro research methods only, such as in [71,72] studying the effects of subsidy and carbon trading by empirical analysis respectively, lacking the transition between the two. This paper combined micro modeling analysis with macro empirical research and found it a feasible way to better study the implementation effect of a policy.

7. Conclusions

In the low-carbon context, the carbon trading mechanism and consumers’ low-carbon preference are introduced into the decision-making model of LCE-SC, which differs from the models in existing studies. The optimal decisions of LCE-SC have been gained by the Stackelberg game. On this basis, this paper analyzes how the commission rate and carbon trading influence the decision-making and performance of LCE-SC. The moderating effects of these parameters are discussed by numerical simulation. Then, based on the initial hypothesis that the carbon trading mechanism promotes carbon productivity, further empirical research on the implementation effect of carbon trading is conducted. As expected, we got the following conclusions that play a directive role in enterprise operation and policymaking.
Firstly, for emission-dependent manufacturers, producing low-carbon products not only generates higher variable costs but also brings environmental benefits, that is, better brand image and higher profits for enterprises. Therefore, considering consumers’ low-carbon preference and the e-commerce platform’s sales rules, manufacturers should optimize emission-reduction programs to control emission-reduction costs for the sake of higher profits and fewer carbon emissions.
Secondly, CER relies on the investment of low-carbon manufacturers, as well as the cooperation of e-commerce enterprises. As the core factor for coordinating e-commerce platforms and settled-in manufacturers, the commissions need to be kept in a low range to reduce emissions. Thus, e-commerce platforms should consider the impact of the commission rate on CER and set an appropriate commission rate for the win-win result of economic benefits and environmental performance in LCE-SC.
Thirdly, as implementing carbon trading contributes to both the economy and the environment, the government should actively promote the carbon trading mechanism with a way to standardize the operation of pilot carbon trading markets. By doing this, the role of carbon trading in mitigating unfair profit distribution and promoting regional sustainability can be fully utilized. Besides, the government should appropriately relax population restrictions and foster more high-tech professionals. Meanwhile, the intensity of environmental governance should also be controlled. Since the cost of CER brings pressure for emission-dependent enterprises, the government can consider providing emission-reduction subsidies.
Finally, increased consumers’ low-carbon preference can improve low-carbon enterprises’ economic and environmental benefits. Therefore, the government should help promote the publicity of low-carbon products and advocate the low-carbon lifestyle, which is advantageous to regional sustainable development. In the current big data era, e-commerce platforms have the most direct contact with consumers. They can track consumers’ consumption behavior and analyze their information by technical means for personally recommending low-carbon products.
Although our research fills the gap of the literature on carbon trading to some extent, there are certain research limitations. Since the carbon price is influenced by the government instead of determined entirely by the market, more factors can be considered in LCE-SC, such as subsidy for the carbon price and differential carbon pricing for enterprises in different regions. The consideration that can make the model more realistic is the direction of future work.

Author Contributions

Conceptualization, Y.W.; methodology, Y.W. and L.S.; software, L.L. and X.W.; formal analysis, L.L. and Q.L.; data curation, Q.L.; Visualization, X.W.; writing—original draft preparation, X.W., Y.W. and L.S.; writing—review and editing, L.S. and R.T.; funding acquisition Y.W. All authors have read and agreed to the published version of the manuscript.

Funding

This research was funded by National Natural Science Foundation of China, grant number 7197129 and Science and Technology Support Program for Youth Innovation of Colleges and Universities in Shandong Province, grant number 2019RWG017.

Institutional Review Board Statement

Not applicable.

Informed Consent Statement

Not applicable.

Data Availability Statement

The data presented in this study are available on request from the corresponding author.

Conflicts of Interest

The authors declare no conflict of interest.

Appendix A

Proof of Proposition 1.
 
Y * Y U = 4 h l β A 2 B k 2 l A 1 ρ F 3 > 0 ; Y * α c = 2 l β A 2 B F 3 > 0 ; Y * ρ = k l β 4 h + r α + 2 k 2 r Y U α c c k 2 { k 4 l ( 1 ρ ) 2 + 8 ( h + r ) 2 β γ 2 2 k 2 h + r 1 ρ 4 l β γ 2 1 + ρ } F 3 2 > 0 . The same procedure is adapted to prove that Y * h > 0 , Y * r < 0 , Y * k < 0 , y * Y U > 0 , y * α c > 0 , y * h > 0 , y * r < 0 , y * k < 0 .
According to y * ρ = β 8 B c h + r + F 2 + F 6 k l k Y U + α 1 ρ 2 A k 2 1 ρ + c k + 4 h Y U + 2 α c β F 7 β 2 [ 8 B c h + r + F 2 + F 6 ] 2 β 1 ρ F 4 2 c β h + r 4 h + r γ 2 k 2 l l 2 h + r β k 2 1 ρ F 5 + c k 2 β 2 [ 8 B c h + r + F 2 + F 6 ] 2 , if 1 ρ > F 2 + 8 h + r B c + F 6 k l k Y U + α 1 ρ 2 A k 2 1 ρ + c k + 4 h Y U + 2 α c β F 7 F 4 2 c β h + r 4 h + r γ 2 k 2 l l 2 h + r β k 2 1 ρ F 5 + c k 2 , y * ρ < 0 ; if 1 ρ < F 2 + 8 h + r B c + F 6 k l k Y U + α 1 ρ 2 A k 2 1 ρ + c k + 4 h Y U + 2 α c β F 7 F 4 2 c β h + r 4 h + r γ 2 k 2 l l 2 h + r β k 2 1 ρ F 5 + c k 2 , y * ρ > 0 . □

Appendix B

Proof of Proposition 2.
 
s * Y U = 8 B k r F 3 γ > 0 , s * ρ = 2 l h + r β γ A F 5 4 h + r β k 2 1 + ρ F 3 2 > 0 , s * α c = 4 B k F 3 γ < 0 . The same procedure is adapted to prove that s * k > 0 , s * h < 0 .
According to s * r = 2 β γ ρ k F 3 4 h Y U + 2 α c + c k 2 k l A 1 ρ F 5 F 3 2 , if 4 h Y U + 2 α c + c k > 2 k l A 1 ρ F 5 F 3 , s * r > 0 ; if 4 h Y U + 2 α c + c k < 2 k l A 1 ρ F 5 F 3 , s * r < 0 . □

References

  1. Zhang, L.; Zhou, H.; Liu, Y.; Lu, R. The optimal carbon emission reduction and prices with cap and trade mechanism and competition. Int. J. Environ. Res. Public Health 2018, 15, 2570. [Google Scholar] [CrossRef] [PubMed] [Green Version]
  2. Ding, H.; Huang, H.; Tang, O. Sustainable supply chain collaboration with outsourcing pollutant-reduction service in power industry. J. Clean. Prod. 2018, 186, 215–228. [Google Scholar] [CrossRef]
  3. Coase, R.H. The Problem of Social Cost. Econ. Anal. Law Sel. Read. 2007, 1–13. [Google Scholar] [CrossRef]
  4. Stern, N. The Economics of Climate Change. Am. Econ. Rev. Pap. Proc. 2008, 98, 1–37. [Google Scholar] [CrossRef] [Green Version]
  5. Yang, L.; Zheng, C.; Xu, M. Comparisons of low carbon policies in supply chain coordination. J. Syst. Sci. Syst. Eng. 2014, 23, 342–361. [Google Scholar] [CrossRef]
  6. Zhou, K.; Li, Y. Influencing factors and fluctuation characteristics of China’s carbon emission trading price. Phys. A Stat. Mech. Its Appl. 2019, 524, 459–474. [Google Scholar] [CrossRef]
  7. Qiyan, Z.; Weibin, C.; Xiang, W. The Effect and Influence of Carbon-Emission Trading on the Concept and Action of Energy Conservation and Emission Reduction of Enterprises. Available online: http://www.cncete.com/magazine/show-525.html (accessed on 15 October 2016).
  8. Zhang, K.; Yao, Y.; Liang, Q.; Saren, G. How should China prioritize the deregulation of electricity prices in the context of carbon pricing? A computable general equilibrium analysis. Energy Econ. 2021, 96, 105187. [Google Scholar] [CrossRef]
  9. Pagès-Bernaus, A.; Ramalhinho, H.; Juan, A.A.; Calvet, L. Designing e-commerce supply chains: A stochastic facility–location approach. Int. Trans. Oper. Res. 2019, 26, 507–528. [Google Scholar] [CrossRef]
  10. Cao, K.; Xu, X.; Wu, Q.; Zhang, Q. Optimal production and carbon emission reduction level under cap-and-trade and low carbon subsidy policies. J. Clean. Prod. 2017, 167, 505–513. [Google Scholar] [CrossRef]
  11. Fan, Y.; Wang, M.; Zhao, L. Production-inventory and emission reduction investment decision under carbon cap-and-trade policy. RAIRO Oper. Res. 2018, 52, 1043–1067. [Google Scholar] [CrossRef] [Green Version]
  12. Jiang, W.; Yuan, L.; Wu, L.; Guo, S. Carbon emission reduction and profit distribution mechanism of construction supply chain with fairness concern and capand-trade. PLoS ONE 2019, 14, e0224153. [Google Scholar] [CrossRef]
  13. Dumrongsiri, A.; Fan, M.; Jain, A.; Moinzadeh, K. A supply chain model with direct and retail channels. Eur. J. Oper. Res. 2008, 187, 691–718. [Google Scholar] [CrossRef]
  14. Yan, N.; Liu, Y.; Xu, X.; He, X. Strategic dual-channel pricing games with e-retailer finance. Eur. J. Oper. Res. 2020, 283, 138–151. [Google Scholar] [CrossRef]
  15. Jia, S.; Zhou, C.; Qin, C. No difference in effect of high-speed rail on regional economic growth based on match effect perspective? Transp. Res. Part A Policy Pract. 2017, 106, 144–157. [Google Scholar] [CrossRef]
  16. Liu, Y.; Wang, A.; Wu, Y. Environmental regulation and green innovation: Evidence from China’s new environmental protection law. J. Clean. Prod. 2021, 297, 126698. [Google Scholar] [CrossRef]
  17. Yang, L.; Wang, G.; Ke, C. Remanufacturing and promotion in dual-channel supply chains under cap-and-trade regulation. J. Clean. Prod. 2018, 204, 939–957. [Google Scholar] [CrossRef]
  18. Kang, K.; Zhao, Y.; Zhang, J.; Qiang, C. Evolutionary game theoretic analysis on low-carbon strategy for supply chain enterprises. J. Clean. Prod. 2019, 230, 981–994. [Google Scholar] [CrossRef]
  19. Mishra, M.; Hota, S.K.; Ghosh, S.K.; Sarkar, B. Controlling waste and carbon emission for a sustainable closed-loop supply chain management under a cap-and-trade strategy. Mathematics 2020, 8, 466. [Google Scholar] [CrossRef] [Green Version]
  20. Han, Q.; Wang, Y. Decision and coordination in a low-carbon E-supply chain considering the manufacturer’s carbon emission reduction behavior. Sustainability 2018, 10, 1686. [Google Scholar] [CrossRef] [Green Version]
  21. Ji, S.; Sun, Q. Low-carbon planning and design in B & R logistics service: A case study of an E-commerce big data platform in China. Sustainability 2017, 9, 2052. [Google Scholar] [CrossRef] [Green Version]
  22. Wang, J.; Huang, X. The optimal carbon reduction and return strategies under carbon tax policy. Sustainability 2018, 10, 2471. [Google Scholar] [CrossRef] [Green Version]
  23. Wang, Y.; Fan, R.; Shen, L.; Miller, W. Recycling decisions of low-carbon e-commerce closed-loop supply chain under government subsidy mechanism and altruistic preference. J. Clean. Prod. 2020, 259, 120883. [Google Scholar] [CrossRef]
  24. Benjaafar, S.; Li, Y.; Daskin, M. Carbon footprint and the management of supply chains: Insights from simple models. IEEE Trans. Autom. Sci. Eng. 2013, 10, 99–116. [Google Scholar] [CrossRef]
  25. Barbosa-Póvoa, A.P.; da Silva, C.; Carvalho, A. Opportunities and challenges in sustainable supply chain: An operations research perspective. Eur. J. Oper. Res. 2018, 268, 399–431. [Google Scholar] [CrossRef]
  26. Chai, Q.; Xiao, Z.; Lai, K.H.; Zhou, G. Can carbon cap and trade mechanism be beneficial for remanufacturing? Int. J. Prod. Econ. 2018, 203, 311–321. [Google Scholar] [CrossRef]
  27. Dong, C.; Shen, B.; Chow, P.S.; Yang, L.; Ng, C.T. Sustainability investment under cap-and-trade regulation. Ann. Oper. Res. 2016, 240, 509–531. [Google Scholar] [CrossRef]
  28. Du, S.; Ma, F.; Fu, Z.; Zhu, L.; Zhang, J. Game-theoretic analysis for an emission-dependent supply chain in a ‘cap-and-trade’ system. Ann. Oper. Res. 2015, 228, 135–149. [Google Scholar] [CrossRef]
  29. Xu, X.; He, P.; Xu, H.; Zhang, Q. Supply Chain Coordination with Green Technology under Cap-and-Trade Regulation. Int. J. Prod. Econ. 2017, 183 Pt B, 433–442. [Google Scholar] [CrossRef]
  30. Xu, X.; Zhang, W.; He, P.; Xu, X. Production and pricing problems in make-to-order supply chain with cap-and-trade regulation. Omega (UK) 2017, 66, 248–257. [Google Scholar] [CrossRef]
  31. Wang, M.; Zhao, L.; Herty, M. Joint replenishment and carbon trading in fresh food supply chains. Eur. J. Oper. Res. 2019, 277, 561–573. [Google Scholar] [CrossRef]
  32. Smith, S.; Swierzbinski, J. Assessing the performance of the UK Emissions Trading Scheme. Environ. Resour. Econ. 2007, 37, 131–158. [Google Scholar] [CrossRef]
  33. Wang, P.; Dai, H.C.; Ren, S.-Y.; Zhao, D.-Q.; Masui, T. Achieving Copenhagen target through carbon emission trading: Economic impacts assessment in Guangdong Province of China. Energy 2015, 79, 212–227. [Google Scholar] [CrossRef]
  34. Zhao, X.; Zhang, Y.; Liang, J.; Li, Y.; Jia, R.; Wang, L. The sustainable development of the economic-energy-environment (3E) system under the carbon trading (CT) mechanism: A Chinese case. Sustainability 2018, 10, 98. [Google Scholar] [CrossRef] [Green Version]
  35. Zhou, B.; Zhang, C.; Song, H.; Wang, Q. How does emission trading reduce China’s carbon intensity? An exploration using a decomposition and difference-in-differences approach. Sci. Total Environ. 2019, 676, 514–523. [Google Scholar] [CrossRef] [PubMed]
  36. Zhang, W.; Zhang, N.; Yu, Y. Carbon mitigation effects and potential cost savings from carbon emissions trading in China’s regional industry. Technol. Forecast. Soc. Chang. 2019, 141, 1–11. [Google Scholar] [CrossRef]
  37. Hamzah, T.A.A.T.; Zainuddin, Z.; Yusoff, M.M.; Osman, S.; Abdullah, A.; Saini, K.M.; Sisun, A. The conundrum of carbon trading projects towards sustainable development: A review from the palm oil industry in Malaysia. Energies 2019, 12, 3530. [Google Scholar] [CrossRef] [Green Version]
  38. Zhang, H.; Zhang, R.; Li, G.; Li, W.; Choi, Y. Sustainable feasibility of carbon trading policy on heterogenetic economic and industrial development. Sustainability 2019, 11, 6869. [Google Scholar] [CrossRef] [Green Version]
  39. Zheng, J.; Yang, M.; Ma, G.; Xu, Q.; He, Y. Multi-agents-based modeling and simulation for carbon permits trading in China: A regional development perspective. Int. J. Environ. Res. Public Health 2020, 17, 301. [Google Scholar] [CrossRef] [PubMed] [Green Version]
  40. Xu, L.; Wang, C.; Miao, Z.; Chen, J. Governmental subsidy policies and supply chain decisions with carbon emission limit and consumer’s environmental awareness. RAIRO Oper. Res. 2019, 53, 1675–1689. [Google Scholar] [CrossRef] [Green Version]
  41. Ma, X.; Wang, J.; Bai, Q.; Wang, S. Optimization of a three-echelon cold chain considering freshness-keeping efforts under cap-and-trade regulation in Industry 4.0. Int. J. Prod. Econ. 2020, 220. [Google Scholar] [CrossRef]
  42. Xia, X.; Li, C.; Zhu, Q. Game analysis for the impact of carbon trading on low-carbon supply chain. J. Clean. Prod. 2020, 276, 123220. [Google Scholar] [CrossRef]
  43. Liu, X.; Du, W.; Sun, Y. Green supply chain decisions under different power structures: Wholesale price vs. revenue sharing contract. Int. J. Environ. Res. Public Health 2020, 17, 7737. [Google Scholar] [CrossRef]
  44. Zhang, J.; Cao, Q.; He, X. Contract and product quality in platform selling. Eur. J. Oper. Res. 2019, 272, 928–944. [Google Scholar] [CrossRef]
  45. Tan, Y.R.; Carrillo, J.E. Strategic Analysis of the Agency Model for Digital Goods. Prod. Oper. Manag. 2017, 26, 724–741. [Google Scholar] [CrossRef]
  46. Adida, E.; Ratisoontorn, N. Consignment contracts with retail competition. Eur. J. Oper. Res. 2011, 215, 136–148. [Google Scholar] [CrossRef]
  47. Nair, A.; Narasimhan, R. Dynamics of competing with quality- and advertising-based goodwill. Eur. J. Oper. Res. 2006, 175, 462–474. [Google Scholar] [CrossRef]
  48. Xia, L.; Hao, W.; Qin, J.; Ji, F.; Yue, X. Carbon emission reduction and promotion policies considering social preferences and consumers’ low-carbon awareness in the cap-and-trade system. J. Clean. Prod. 2018, 195, 1105–1124. [Google Scholar] [CrossRef]
  49. Xing, E.; Shi, C.; Zhang, J.; Cheng, S.; Lin, J.; Ni, S. Double third-party recycling closed-loop supply chain decision under the perspective of carbon trading. J. Clean. Prod. 2020, 259. [Google Scholar] [CrossRef]
  50. Wang, W.; Zhou, C.; Li, X. Carbon reduction in a supply chain via dynamic carbon emission quotas. J. Clean. Prod. 2019, 240, 118244. [Google Scholar] [CrossRef]
  51. Shen, L.; Wang, Y. Supervision mechanism for pollution behavior of Chinese enterprises based on haze governance. J. Clean. Prod. 2018, 197, 571–582. [Google Scholar] [CrossRef]
  52. Zhang, J.; Jiang, H.; Liu, G.; Zeng, W. A study on the contribution of industrial restructuring to reduction of carbon emissions in China during the five Five-Year Plan periods. J. Clean. Prod. 2018, 176, 629–635. [Google Scholar] [CrossRef]
  53. Li, X.; Luo, Q.; Hai, B.; Li, L. Progress in the micro-perspective studies of economic geography in China since 1980s. J. Geogr. Sci. 2016, 26, 1041–1056. [Google Scholar] [CrossRef]
  54. Zhang, K.; Xu, D.; Li, S.; Zhou, N.; Xiong, J. Has China’s pilot emissions trading scheme influenced the carbon intensity of output? Int. J. Environ. Res. Public Health 2019, 16, 1854. [Google Scholar] [CrossRef] [PubMed] [Green Version]
  55. Wang, L.; Watanabe, T. Effects of environmental policy on public risk perceptions of haze in Tianjin City: A difference-in-differences analysis. Renew. Sustain. Energy Rev. 2019, 109, 199–212. [Google Scholar] [CrossRef]
  56. Li, J.; Lin, B. Environmental impact of electricity relocation: A quasi-natural experiment from interregional electricity transmission. Environ. Impact Assess. Rev. 2017, 66, 151–161. [Google Scholar] [CrossRef]
  57. Wing, C.; Simon, K.; Bello-Gomez, R.A. Designing Difference in Difference Studies: Best Practices for Public Health Policy Research. Annu. Rev. Public Health 2018, 39, 453–469. [Google Scholar] [CrossRef] [PubMed] [Green Version]
  58. Dong, F.; Dai, Y.; Zhang, S.; Zhang, X.; Long, R. Can a carbon emission trading scheme generate the Porter effect? Evidence from pilot areas in China. Sci. Total Environ. 2019, 653, 565–577. [Google Scholar] [CrossRef]
  59. Zhu, B.; Zhang, M.; Huang, L.; Wang, P.; Su, B.; Wei, Y.M. Exploring the effect of carbon trading mechanism on China’s green development efficiency: A novel integrated approach. Energy Econ. 2020, 85, 104601. [Google Scholar] [CrossRef]
  60. Austin, P.C. Some methods of propensity-score matching had superior performance to others: Results of an empirical investigation and monte carlo simulations. Biom. J. 2009, 51, 171–184. [Google Scholar] [CrossRef]
  61. Rosenbaum, P.R.; Rubin, D.B. The central role of the propensity score in observational studies for causal effects. Matched Sampl. Causal Eff. 2006, 170–184. [Google Scholar] [CrossRef] [Green Version]
  62. Zhang, C.; Wang, Q.; Shi, D.; Li, P.; Cai, W. Scenario-based potential effects of carbon trading in China: An integrated approach. Appl. Energy 2016, 182, 177–190. [Google Scholar] [CrossRef]
  63. Wang, H.; Chen, Z.; Wu, X.; Nie, X. Can a carbon trading system promote the transformation of a low-carbon economy under the framework of the porter hypothesis?—Empirical analysis based on the PSM-DID method. Energy Policy 2019, 129, 930–938. [Google Scholar] [CrossRef]
  64. Yan, D.; Kong, Y.; Ren, X.; Shi, Y.; Chiang, S.W. The determinants of urban sustainability in Chinese resource-based cities: A panel quantile regression approach. Sci. Total Environ. 2019, 686, 1210–1219. [Google Scholar] [CrossRef] [PubMed]
  65. Hu, Y.; Ren, S.; Wang, Y.; Chen, X. Can carbon emission trading scheme achieve energy conservation and emission reduction? Evidence from the industrial sector in China. Energy Econ. 2020, 85, 104590. [Google Scholar] [CrossRef]
  66. Xu, S.C.; He, Z.X.; Long, R.Y. Factors that influence carbon emissions due to energy consumption in China: Decomposition analysis using LMDI. Appl. Energy 2014, 127, 182–193. [Google Scholar] [CrossRef]
  67. Chang, X.; Xia, H.; Zhu, H.; Fan, T.; Zhao, H. Production decisions in a hybrid manufacturing-remanufacturing system with carbon cap and trade mechanism. Int. J. Prod. Econ. 2015, 162, 160–173. [Google Scholar] [CrossRef]
  68. Halat, K.; Hafezalkotob, A. Modeling carbon regulation policies in inventory decisions of a multi-stage green supply chain: A game theory approach. Comput. Ind. Eng. 2019, 128, 807–830. [Google Scholar] [CrossRef]
  69. Xiong, S.; Feng, Y.; Huang, K. Optimal MTS and MTO hybrid production system for a single product under the cap-and-trade environment. Sustainability 2020, 12, 2426. [Google Scholar] [CrossRef] [Green Version]
  70. Konstantaras, I.; Skouri, K.; Benkherouf, L. Optimizing inventory decisions for a closed–loop supply chain model under a carbon tax regulatory mechanism. Int. J. Prod. Econ. 2021, 239, 108185. [Google Scholar] [CrossRef]
  71. Kong, D.; Xia, Q.; Xue, Y.; Zhao, X. Effects of multi policies on electric vehicle diffusion under subsidy policy abolishment in China: A multi-actor perspective. Appl. Energy 2020, 266, 114887. [Google Scholar] [CrossRef]
  72. Wang, L.; Cui, L.; Weng, S.; Liu, C. Promoting industrial structure advancement through an emission trading scheme: Lessons from China’s pilot practice. Comput. Ind. Eng. 2021, 157, 107339. [Google Scholar] [CrossRef]
Figure 1. Model structure of LCE-SC.
Mathematics 09 01717 g001
Figure 2. Changes in the LCE-SC’s performances with ρ and k .
Mathematics 09 01717 g002
Figure 3. Changes in optimal decisions with h and r .
Mathematics 09 01717 g003
Figure 4. Changes in optimal decisions with Y U and α c .
Mathematics 09 01717 g004
Figure 5. Changes in carbon productivity with the scale of carbon market.
Mathematics 09 01717 g005
Figure 6. Relationship between the micro research and the macro research.
Mathematics 09 01717 g006
Figure 7. Annual carbon productivity growth.
Mathematics 09 01717 g007
Figure 8. Placebo test.
Mathematics 09 01717 g008
Table 1. Papers that are most related to our research.
Author(s)Supply Chain SystemPolicyResearch MethodCustomers’ Environmental AwarenessEmission Reduction InvestmentVariable Carbon Price
Xu et al. [29]A manufacturer and a retailerCarbon tradingModeling and numerical simulationYesYesNo
Fan et al. [11]A manufacturer and a retailerCarbon tradingModeling and numerical simulationNoYesNo
Xu et al. [40]A manufacturer and a retailerGovernmental subsidyModeling and numerical simulationYesYesNo
Ma et al. [41]A supplier, a third-party logistics service provider, and a retailerCarbon trading and carbon taxModeling and numerical simulationNoNoNo
Wang et al. [31]A supplier and multiple retailersCarbon tradingModeling and numerical simulationNoNoNo
Xia et al. [42]A manufacturer; an ordinary manufacturer and a low-carbon manufacturerCarbon tradingModeling and numerical simulationYesNoNo
Liu et al. [43]A manufacturer and a retailerPower control structureModeling and numerical simulationYesYes-
This paperA manufacturer and an e-commerce platformCarbon tradingModeling, numerical simulation, and empirical analysisYesYesYes
Table 2. Measurement methods of control variables.
VariableMeasurement MethodSymbol
Resource EndowmentProportion of investment in fixed assets of the mining industry (excluding rural households) to the total investment in fixed assets R E
Industrial StructureProportion of secondary industry to regional GDP I S
Environmental Governance IntensityProportion of investment completed in the treatment of industrial pollution to regional GDP E G I
Household ConsumptionHousehold consumption in the total consumption of energy H C
Population ScalePopulation at year-end P O P
Table 3. Descriptive statistics of variables.
Variables ln   C P R E I S E G I ln   H C ln   P O P
2009Mean7.766020.046200.474610.001596.861598.16080
Std. Dev.0.525690.045310.076270.001160.693720.76387
2010Mean7.828370.043740.490710.001136.959888.17059
Std. Dev.0.525320.045160.075860.000890.705200.75837
2011Mean7.911610.045540.495650.001077.040848.17772
Std. Dev.0.542930.045070.080640.000670.704800.75428
2012Mean7.969740.041190.486480.001107.116168.18518
Std. Dev.0.553570.039210.079030.000850.697780.75045
2013Mean8.010210.038320.467810.001727.129478.19240
Std. Dev.0.609770.035220.079520.001310.678140.74697
2014Mean8.066010.033130.459840.001897.158858.19891
Std. Dev.0.617770.030360.078150.001800.663340.74442
2015Mean8.117620.027780.432550.001227.237688.20539
Std. Dev.0.624950.025020.077900.000730.665240.74327
2016Mean8.184630.019710.415530.001337.299918.21142
Std. Dev.0.676530.018240.077690.001420.668080.74330
2017Mean8.214420.018610.407070.000907.350828.21709
Std. Dev.0.672780.018520.075780.000740.675530.74345
Mean8.007630.034910.458920.001337.128368.19106
Table 4. The results of preliminary DID regression.
ln   C P
p e r i o d 0.122 *
(2.53)
t r e a t e d 0.396 ***
(5.55)
d i d 0.233 **
(2.67)
R E −6.122 ***
(−8.93)
I S −0.881 **
(−3.36)
E G I −143.706 ***
(−7.18)
ln   H C −0.229 ***
(−4.18)
ln   P O P 0.283 ***
(5.12)
_ c o n s 7.934 ***
(33.35)
N 270
R 2 0.7598
* p < 0.05 , ** p < 0.01 , *** p < 0.001 .
Table 5. The results of the parallel trend test in the DID model.
ln   C P
B e f o r e 4 0.457 *
(2.09)
B e f o r e 3 0.514 *
(2.35)
B e f o r e 2 0.608 **
(2.78)
B e f o r e 1 0.692 **
(3.17)
C u r r e n t 0.796 ***
(3.64)
A f t e r 1 0.863 ***
(3.95)
A f t e r 2 0.929 ***
(4.25)
A f t e r 3 1.097 ***
(5.02)
A f t e r 4 1.093 ***
(5.00)
_ c o n s 7.825 ***
(76.63)
N 270
R 2 0.3551
* p < 0.05 , ** p < 0.01 , *** p < 0.001 .
Table 6. Validity test of PSM.
VariableMean ControlMean TreatedReduct |bias|t Valuep Value
R E 0.014240.0140899.5−0.050.958
I S 0.475000.4516941.7−1.520.132
E G I 0.000940.0009094.4−0.360.723
ln   H C 7.287407.2877099.80.000.998
ln   P O P 8.276008.2357055.6−0.260.797
Table 7. The results of PSM-DID regression.
Model 1Model 2
p e r i o d 0.174 *
(2.55)
0.160 **
(3.27)
_ t r e a t e d 0.420 ***
(4.00)
0.363 ***
(5.24)
d i d 0.287 *
(2.11)
0.202 *
(2.35)
R E −8.478 ***
(−6.22)
I S −0.933 **
(−3.16)
E G I −163.073 ***
(−5.81)
ln   H C −0.255 ***
(−4.31)
ln   P O P 0.297 ***
(4.42)
_ c o n s 7.890 ***
(146.95)
8.101 ***
(31.84)
N 206206
a d j R 2 0.31790.7350
* p < 0.05 , ** p < 0.01 , *** p < 0.001 .
Publisher’s Note: MDPI stays neutral with regard to jurisdictional claims in published maps and institutional affiliations.

