Abstract
The purpose of this research was to develop a measurement scale, the Pet Affection Scale (PAS), to understand owners’ personalities and attachment to their pets. The data were collected through two waves. There were 401 valid data collected from the first wave to develop the pet affection scale (PAS). An exploratory factor analysis (EFA) was tested, and three factors were extracted and identified as (1) joy, (2) anthropomorphism, and (3) protection, respectively. Furthermore, 901 valid data collected from the second wave were used to analyze and propose a research model to examine the PAS influence on the owners’ behavioral intention toward pet hotels. These research findings show that all three pet affections have positive significant effects on pet hotels’ behavioral intention. The implications, limitations, and future research of this research were suggested and discussed.
1. Introduction
In the past, pets have been fed as watchdogs; nevertheless, they have gradually become members of the family. According to a survey of Euromonitor International, the pet-related market has grown by more than 66% while the global economy has grown by 43% over the past ten years. This shows that the furkid industry is becoming larger-scale [1]. At present, the fastest-growing market in the world is the pet market, and the turnover of the global pet market in 2018 was US$124.6 billion, an increase of 4.3% from US$119.5 billion in 2017 [2]. Statistically, it is also found that from 2009 to 2019, the number of Americans spending on pets increased from 34 billion U.S. dollars to more than 52 billion U.S. dollars, which represents fast growth [1]. In addition, in Taiwan, the demand of the pet industry has increased annually. According to the statistics of Council of Agriculture in Taiwan, people raised more than 2.51 million dogs and cats in 2017 [3]. Therefore, it is considered that pets have been some of human beings’ best friends [4].
There are a number of researchers who have investigated the human/companion–animal bond for thousands of years [5]. A two-way interaction viewpoint is perceived as the complication of human–animal bonds [6]. The American Veterinary Medical Association defines the human–nonhuman animal bond as “a mutually beneficial and dynamic relationship between people and other animals that is influenced by behaviors that are essential to the health and well-being of both” [7]. Despite the fact that owners can obtain direct and substantial benefits (for example, eliminating potential thieves, reducing harmful animals), there is research that reveals that pets can also provide their owners with some positive psychological implications [8]. Therefore, today, people emphasize the interaction and relationship between owners and pets, since pets can give benefits to human beings not only physically but also psychologically. For instance, it is advised that the owners of pets have the following characteristics: living longer, recovering sooner from sickness [9], having a lower chance of suffering a depressive episode [10,11], relishing their lives (Francs et al., 1985), being generally content with their lives, and experiencing more satisfaction [10,12].
Due to the advantages pets provide to their owners, many researchers have studied the relationship between pets and their owners, and some researchers have developed a series of pet scales relevant to pet attachment and attitude. In 1981, the Pet Attitude Scale (PAS) was developed to illustrate its psychometric properties [13,14]. Prior scholars wanted to measure people’s attachment to their pets, so they developed the Pet Attachment Survey (PAS) [15]. The Comfort from Companion Animals Scale (CCAS) was developed to measure the degree of emotional comfort owners perceived from pets [16,17]. The prior scholars also developed the Pet Attachment Scale (PAS)m including the Lexington Attachment to Pets Scale (LAPS; [5])m to measure the behaviors and the relationship between the pets and owners.
Because there are a variety of relevant pet attitude and attachment scales, this study unifies diverse studies and concepts into one general Pet Affection Scale, which mainly adopts the Pet Attitude Scale (PAS) developed by Templer et al. [13] and the Pet Attachment Scale [17] conceived.
Traveling with pets has been on the rise in recent years, and this has also attracted many hoteliers to try to find some strategies to attract such consumers, but not all consumers like pets, so there is more to consider when considering pets. To attract pet owners, it is also necessary to consider the mentality of these consumers who do not have pets. Kongtaveesawas and Namwong [18] indicated that three factors should be considered for the formulation of relevant marketing strategies, including (1) hotel stakeholders, (2) pet-owner consumers, and (3) non-pet-owner consumers. According to Booking.com, there are 374 pet-friendly accommodations in Dubrovnik; however, there are only 10 hotels that are allowing pets out of 374 pet-friendly hotels [19]. From Booking.com in Taiwan, this research finds there are 425 star hotels in Taipei; out of 425, there are 12 pet-friendly hotels, and only three of them allow pets. According to the information on the above, hotels that allow customers to stay with pets are still not very common. Therefore, pet hotels have a certain potential market.
The purpose of this study is to develop a scale to measure the attitude and attachment of pet owners toward pets. It reports the measurement device, which typically focuses on the bond of affection and behavior between pets and their owners.
These research issues are conducted empirically in the following literature review, methodology, results, and conclusion.
2. Literature Review
2.1. Attachment (Pet Affection Scale, PAS)
Considerable anecdotal explanations exist for the importance of people’s attachment to their pets [20]. The conceptualization of child–parent relationships is the initial original concept of attachment [21], so attachment was originally referred to as “the child plays the role of a needy, dependent partner, while the parent plays the role of a stronger and wiser caregiver or attachment”. Voith [22] indicated that building and maintaining attachments between human beings also exists between human beings and their pets. Because kids and pets are equipped with the same attributes, numerous interactions occurring between children and adults are similar to those taking place between adults and their children or pets [15]. Therefore, numerous articles and books have addressed pet treatment of disturbed and mentally handicapped children, adult mental patients, the elderly, and physically handicapped people; they hope to establish positive relationships with young animals in this way, and often dogs produce positive mental health [23].
Templer et al. [13] developed the frequently used Pet Attitude Scale (PAS) to measure attitudes toward pets and found that kennel employees achieve higher scores than students who work in society [14]. They later modified the Pet Attitude Scale and enlisted 203 college students to test the wording clarity and precision of four items in their previous study [24]. Zasloff [16] developed the Comfort from Companion Animals Scale (CCAS) to measure human–animal interactions. Furthermore, [14] further validated evidence for the Pet Attitude Scale (PAS) and it proved to be a reliable scale. In addition, Shore et al. [17] researched the promising advantageous behaviors related to the names people gave to their animals, as well as their personal affection for their pets. Shore et al. [17] categorized 67 behavior questions to measure levels of care and observed low attachment scores related to poor pet care [25].
2.2. Behavioral Intention
The definition of behavioral intention (BI) is the perceptual or subjective possibility of a person engaging in a certain behavior. Customer behavioral intentions are substantially involved in decision-making, particularly in repurchase decisions [26]. Moreover, customer positive satisfaction results in customer intention to revisit and stay in a service space [27,28,29]. Particularly after service recovery, customers have a higher intention to diffuse word-of-mouth [30]. Numerous prior studies have conducted research related to the relationship between attitude and behavior intention. The theory of reasoned action (TRA) is an expected value model that emphasized attitudes, subjective norms, intentions, and behaviors for a specific group of people and is constructed to enhance understanding of relationships among variables [31]. Moreover, the theory of planned behavior (TPB) extends TRA, which is also one of the most critical theories adopted, to explain and predict behavior and has been frequently used to predict behavioral research [30]. According to the above-mentioned, previous studies have been devoted to clarifying the customer satisfaction variable to increase customer behavioral intention; thus, creating a significantly positive customer behavioral intention is definitely beneficial to pet hotel practitioners.
2.3. Pet Attachment on Behavioral Intention
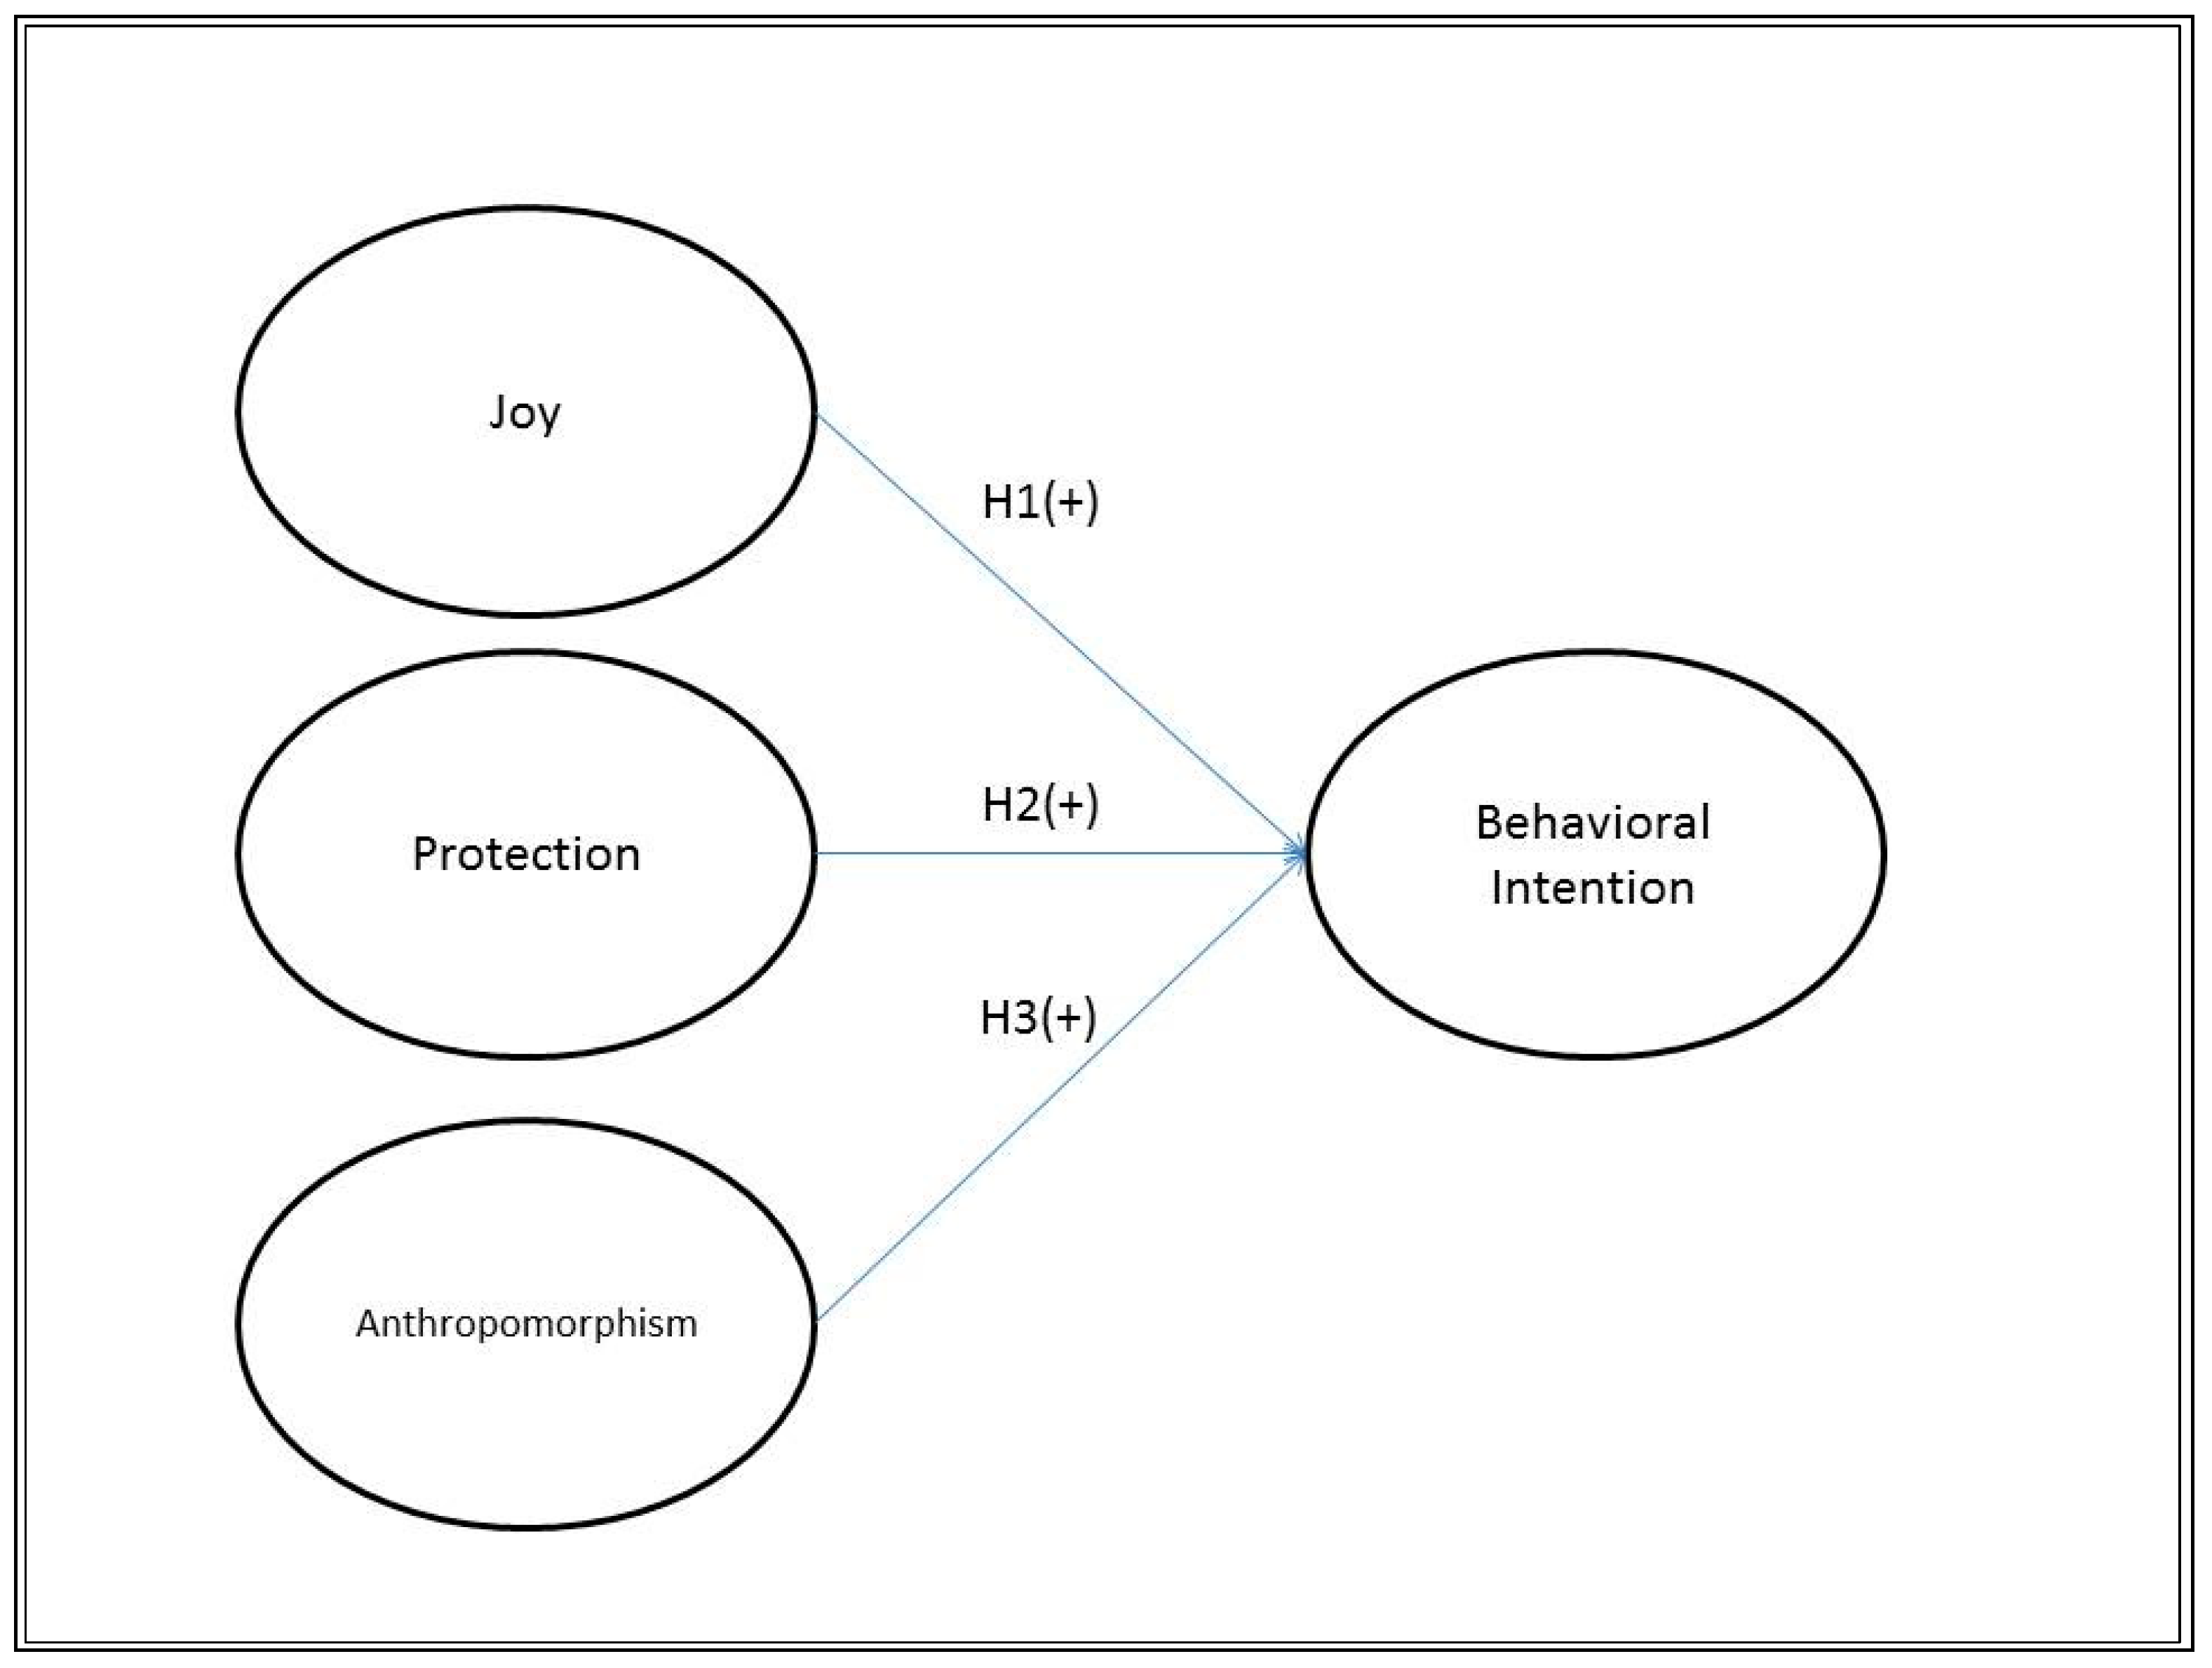
Bowlby [32] first proposed the attachment term, meaning that the relationship between parent and infant also exists in other species. Askew [33] indicated that pet owner behavior is definitely parental behavior toward their companion animals. Pet owners generate three features: joy, caregiving (protecting), and anthropomorphism. Joy occurs when humans live with other species [34]. Pet owners who provide caregiving (or protecting) provide a source of security and protection to other species as well [20]. Anthropomorphism refers to humans applying their own emotions, thoughts, and feelings to animals or inanimate objects [35]. Albert and Bulcroft [36] observed a significantly high degree of anthropomorphism among unmarried and divorced people and couples without children. An increasing level of attachment of pet owners means they are willing to direct increasing efforts to their pets. Therefore, this study proposes the following hypotheses:
Hypothesis 1 (H1).
Joy will positively influence the behavioral intention of pet owners.
Hypothesis 2 (H2).
Protection will positively influence the behavioral intention of pet owners.
Hypothesis 3 (H3).
Anthropomorphism will positively influence the behavioral intention of pet owners.
Figure 1 shows the research conceptual framework.
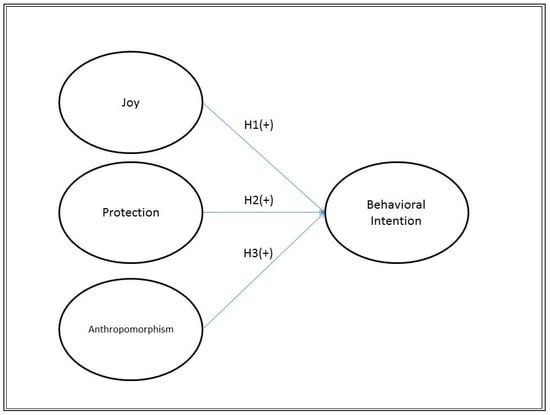
Figure 1.
Research conceptual framework.
3. Methodology
3.1. Developing Initial Items
All the construct items were derived from previous literature and the opinions of experts. Furthermore, all the items in this study were modified from previous literature to fit the pet hotel industry. This study developed the measurement of the Pet Affection Scale into two steps. First, after reviewing the related literature and eliminating the similar items, this research primarily adopted the items of the Pet Attitude Scale (PAS) by Templer et al. [13], including 5 items, and the Pet Attachment Scale conducted by Shore et al. [17], comprising 10 items, which were modified to generate 15 items. After conducting EFA analysis, three subdimensions were adopted: five items of joy, six items of protection, and four items of anthropomorphism. The construct items of behavioral intention were modified from Ryu et al. [37] to generate four construct items.
3.2. Sampling and Data Collection
In the first wave, after generating the initial items and examining the readability, the scale comprised 15 items to verify EFA. This study included two completely different survey methods to collect data: face-to-face surveys/interviews in Taipei, Taiwan, and feedback using online investigation. Respondents to the online questionnaire are currently raising or have raised pets and have heard of or been to a pet hotel. Respondents of the face-to-face interview are likely to frequently interact with their pet. This research distributed the survey through the Internet and posted it on the mySurvey website in Taiwan. The public interview survey was conducted in Taipei in which approximately 19,000 dogs and cats were kept in Taipei. Moreover, the population of feeding pets has increased annually. Therefore, this study chose people in Taipei who were qualified as the target population in the current research. A total of 450 data were returned, of which 49 questionnaires were invalid. A total of 401 valid data were collected as useful data for this research. Among the 401 valid questionnaires, female respondents (62.1%) were more prevalent than male respondents (37.9%). Among useful respondents, 228 people were between 21 and 30 (56.9%) years of age, and 87 people were between 31 and 40 (21.7%) years of age. More than half of the respondents held a college/university degree (60.6%) and 23.7% of respondents held a graduate school degree. Regarding total monthly household income, 133 respondents (33.2%) earned a total monthly household income of NT$30,000 or less, and 14.7% of respondents earned a total monthly household income of NT$30,001 to NT$40,000. Moreover, 71.8% raised dogs, whereas 28.2% kept cats. Most respondents raised one pet (69.3%), whereas others raised two pets (16.2%).
In the second wave, to verify the research model, the study collected two similar surveys in the first wave. A total of 1050 questionnaires in total were collected, comprising 901 valid questionnaires and 149 invalid questionnaires regarded as formal data for research models. A total of 901 valid questionnaires were received. More than half of the respondents were females (58.0%). Furthermore, in this study, 393 respondents were between 21 and 30 years of age, and 301 respondents were between 31 and 40 years of age. Most of them held a college/university degree (68.0%). For monthly household income, a proportion of respondents in this study were even. More than half of respondents kept dogs, and most of them raised only one pet.
3.3. Data Analysis Methods
SPSS 20.0 and AMOS 20.0 statistical software programs were adopted to analyze the data of this research. Both SPSS and AMOS are statistical software programs frequently used in the social sciences. With flexibility, customization, and automation options, SPSS is easy for beginners to learn. The researchers can use AMOS to draw models graphically simply and perform the computations for SEM quickly to display the results. The fitness of the model structure was tested by confirmatory factor analysis (CFA). The framework fitness of the research model was clarified by structural equation modeling (SEM).
3.3.1. Exploratory Factor Analysis (EFA)
Exploratory factor analysis was used to extract the underlying structure of a relatively large set of variables. This study adopted EFA with orthogonal varimax rotation to simplify the complex components. Three indicators were included to evaluate the adequacy and appropriateness of EFA.
The KMO was used to measure sample adequacy. The KMO statistic exceeded 0.9 [38], so the sample is regarded as adequate. Bartlett’s sphericity tests [39] determined whether the correlation matrix was an identity matrix. In this study, the significance value was less than 0.05; therefore, the factor analysis was adequate. Communality means that an item correlates with all other items. Communalities for all variables should exceed 0.50 [40], and factors with eigenvalue should be above 1 [41]. In this study, all the items achieved these criteria, so the levels of explanations were acceptable.
3.3.2. Reliability and Validity Analysis
Reliability measures the consistency. To test reliability, this study measured composite reliability (CR) and Cronbach’s alpha. Cronbach’s alpha should exceed 0.7 [42], and CR should exceed 0.6 [43].
Validity measures the accuracy. Convergent validity and discriminant validity assess the validity. The average variance extracted (AVE) values of convergent validity should exceed 0.5 [44], and factor loading of all the items should exceed 0.5 [45]. Fornell and Larcker [44] indicated that the t-value should exceed 1.96. Regarding discriminative validity, based on the χ2 difference test, the χ2 difference should exceed 3.84 [44].
3.3.3. Structural Equation Model (SEM)
AMOS 20.0 was adopted to explore the relationship among variables in a research model. Chi-square, the root mean square error of approximation (RMSEA), the goodness-of-fit index (GFI), the adjusted goodness-of-fit index (AGFI), the normed fit index (NFI), the incremental fit index (IFI), the relative fit index (RFI), and the comparative fit index (CFI) are indicators to identify the fitness of the CFA result and the SEM model. Furthermore, moderating effects on the variable were tested in the research model.
4. Results
4.1. Scale Development Results (the 1st Wave)
- Kaiser–Meyer–Olkin (KMO) and Bartlett’s Test of Sphericity
Fifteen items were pooled together to identify the dimensionality of pet owners’ attitudes toward their pets, and all the factors were analyzed. The adequacy and appropriateness of EFA were also examined. The analysis results of KMO and Bartlett’s test are shown in Table 1. The KMO measure of sampling adequacy was 0.920, which indicated that the correlation patterns were relatively compact, and distinct and reliable factors should be generated by factor analysis [40]. Regarding the Bartlett’s test of sphericity, the overall significance of the correlation matrix was <0.001, and the Chi-square value was 3504.293, indicating that the correlation matrix is not identical. Therefore, it is considered to be appropriate for EFA analysis.

Table 1.
KMO and Bartlett’s Test of EFA: KMO > 0.9 and Bartlett’s test of sphericity with the overall significance of the correlation matrix and the Chi-square value, indicating it is considered to be appropriate for EFA analysis.
- Communality
This research formalized the subscales by conducting an EFA using principal components with varimax rotation. After a set of EFA, 15 items were factor-analyzed, and three dimensions were extracted. The three dimensions were labeled as (a) joy, (b) protection, and (c) anthropomorphism (see Table 2). Table 3 shows each measurement’s mean, standard deviation, and communality of the three dimensions.
Table 2.
EFA results of dimensions: varimax rotated loading matrix.
Table 3.
The statistics of measurements: mean, standard deviation, and communality of joy, protection, and anthropomorphism dimensions.
- CFA Results and Model Fit
This study used the AMOS statistics software to compute the CFA model. All the model fit values were appropriate ( = 206.78, df = 84, /df = 2.46, p < 0.00, SRMR = 0.05, RMSEA = 0.06, GFI = 0.94, CFI = 0.96, AGFI = 0.91, NFI = 0.94, IFI = 0.96.) These criteria indicate a good model fit to the derived three-dimension structure (see Table 4).
Table 4.
CFA Model Fits of the Scale: /df, SRMR, RMSEA, GFI, CFI, AGFI, NFI, and IFI.
- Scale Reliability
The factor loadings, t-values, CR, Cronbach’s α, and AVE of the results are presented in Table 5. The CR values from 0.80 to 0.89 revealed that the CRs all exceeded 0.6 [43], and all Cronbach’s alphas ranging from 0.80 to 0.88 exceeded 0.7 [42]. Additionally, all factor loadings of the scale items between 0.60 and 0.90 exceeded 0.60, indicating satisfactory reliability [45]. Consequently, the results presented evidence of reliability.
Table 5.
Measurement accuracy analysis statistics (the first wave): factor loading and its t-value, Cronbach’s α value, composite reliability (CR), and average variance extracted (AVE).
- Scale Validity
The convergent validity and discriminant validity access the scale validity.
To examine convergent validity requires two main measurements: all factor loadings of items should be with significant t-values (exceeding 1.96) and the AVE should exceed 0.50 [44]. In this study, the value of AVE ranged from 0.50 to 0.62, and the t-value ranged from 12.70 to 22.72, both reaching the criteria. Accordingly, all scale constructs showed convergent validity in this study (see Table 5).
Two methods were used to investigate discriminant validity. First, discriminant validity was evidenced by the chi-squared difference testing two constructs by compelling the estimated correlation between 1.0, and a series of Chi-squared tests was implemented in order to obtain the constrained and unconstrained models (i.e., Δ > 3.84, p < 0.001) [46]. The Chi-square differences of the scale all exceeded 3.84, ranging from 6.25 to 22.82 (see Table 6). Second, this study measured the confidence interval (CI) correlation of two constructs (±two standard errors). Anderson and Gerbing [47] proposed that CIs should not include 1.0, which revealed that the two constructs were unequal. In this study, the CIs were between 0.291 and 0.890. The difference between the Chi-square and the CIs in this study revealed a significant difference and provided positive support for discriminative validity (see Table 7).
Table 6.
Chi-square difference results of the scale (the 1st wave): The Chi-square differences of the items all exceeded 3.84 showing that the discriminative validity fell in an acceptable range.
Table 7.
Confidence interval of the scale (the 1st wave): the confidence interval (CI) correlation of two constructs (±two standard errors) not including 1.0 provided support for discriminative validity.
4.2. Measurement Model Results (the 2nd Wave)
4.2.1. CFA Results and Model Fit
This study used AMOS statistical software to compute the CFA model. All the goodness-of-fit values were acceptable in the research model ( = 532.37, df = 146, /df = 3.65, p < 0.00, SRMR = 0.03, RMSEA = 0.05, GFI = 0.94, CFI = 0.96, AGFI = 0.92, NFI = 0.94, IFI = 0.96). All criteria indicated a good model fit.
4.2.2. Reliability Analysis
The factor loadings, t-values, CR, Cronbach’s α, and AVE of the results are shown in Table 8. The CR values ranging from 0.80 to 0.91 indicated that the CRs all exceeded 0.6 [43], and all Cronbach’s alphas were between 0.80 and 0.91, all exceeding 0.7 [42]. Additionally, all factor loadings of the items were from 0.64 to 0.90, exceeding 0.60, indicating satisfactory reliability [45]. These results presented evidence of reliability.
Table 8.
Measurement accuracy analysis statistics (the second wave): factor loading and its t-value, Cronbach’s α value, composite reliability (CR), and average variance extracted (AVE).
4.2.3. Validity Analysis
To evaluate the validity, convergent validity, and discriminant validity were used.
Two main measurements were used to examine convergent validity: Table 8 shows the value of AVE from 0.50 to 0.72, and the t-value ranging from 19.66 to 33.85 both reached the criteria. Consequently, all the model constructs reached convergent validity.
Two methods were used to examine discriminant validity. First, the Chi-squared difference tested two constructs by compelling the estimated correlation between 1.0, and a series of chi-squared tests was implemented in order to obtain the constrained and unconstrained models. The chi-square differences of the items all exceeded 3.84, ranging from 66.40 to 331.97 (see Table 9). Second, this study measured the CI correlation of the two constructs (±two standard errors). Anderson and Gerbing [47] proposed that CIs should not include 1.0, which revealed that the two constructs were unequal. The CIs were between 0.261 and 0.815. The confidence intervals do not include 1.0, showing that the discriminative validity fell in an acceptable range (see Table 10). The difference between the Chi-square and the CIs of this study revealed a significant difference and provided support for discriminative validity.
Table 9.
Chi-square difference results (the second wave): The Chi-square differences of the items all exceeded 3.84, showing that the discriminative validity fell in an acceptable range.
Table 10.
Confidence intervals (the second wave): the confidence interval (CI) correlation of two constructs (±two standard errors) not including 1.0. provided support for discriminative validity.
4.3. Structural Equation Model Results
4.3.1. Overall Model Validation
This study used AMOS 20.0 statistical software to test SEM in order to verify the overall model validation and the path interrelationship among constructs in the conceptual models and hypotheses. The overall model fit measures of the SEM were all acceptable ( = 532.37, df = 146, /df = 3.6463, p < 0.00, SRMR = 0.03, RMSEA = 0.05, GFI = 0.94, CFI = 0.96, AGFI = 0.92, NFI = 0.94, IFI = 0.96). According to the statistics, all were in accordance with the criteria, indicating a good model fit.
4.3.2. Structural Equation Model Evaluation Hypothesis Test
In accordance with the SEM analysis of this study, the path coefficient from joy to behavioral intention was 0.210 (p < 0.01), the path coefficient from protection to behavioral intention was 0.173 (p < 0.05), and the path coefficient from anthropomorphism to behavioral intention was 0.154 (p < 0.01). Therefore, H1, H2, and H3 are supported (see Table 11).
Table 11.
Hypothesis test analysis: the path coefficient from joy, protection, and anthropomorphism to behavioral intention.
5. Conclusions
5.1. Discussion
Because people are increasingly raising pets, research on the relationship between pet owners and pets is conducted annually. In Korea, Kim et al. [48] claimed that due to the increase in the number of companion animals and the positive changes in public perceptions of them, it is necessary to study the relationship between humans and animals. The pet industry in Taiwan and worldwide has been booming, increasing the need for the pet hotel industry. The most important articles discussing PTS in recent years are [13,24], but these two articles were published in 1981 and 2004, respectively, which is at least 17 years ago. In the past 17 years, many changes have taken place in the world, and human behavior will also change due to various factors. Especially in recent years, more and more people have started to keep pets, and it is necessary to re-discuss this topic. Therefore, this study sorted out the relevant literature in recent years, re-collected data, and performed a new analysis to provide conclusions and recommendations that are closest to the status quo. Although the data in this study are mainly from Taiwan, the design of the questionnaire is based on the literature from all over the world. Therefore, even if all the respondents are from Taiwan, all the questions are not designed for Taiwan, so the results are applicable to other countries. For example, a study in 2015 pointed out that they compared the attitudes of people in Taiwan and Malaysia toward keeping pets, and the results showed that there are no significant differences in personality traits [49], indicating that the attitudes of people toward keeping pets in the two countries are totally the same.
This study developed a pet affection scale to measure the behavior of pet owners and their attachment to their pets. Using EFA, 15 usable items extracted three factors, and the reliability and validity were confirmed by CFA. Therefore, three factors of 15 reliable and valid items, referred to as the Pet Affection Scale (PAS), were labeled as (a) joy, (b) protection, and (c) anthropomorphism.
This study discusses the influence of joy, protection, and anthropomorphism on the pet hotels’ behavioral intention of pet owners. The findings indicate that pet owner attachment has a significant positive influence on the behavioral intention of pet owners, meaning that the high level of attachment between owners and their pets increases their willingness to exert more efforts to care for and take their pets to pet hotels.
5.2. Theoretical Implications
As to the theoretical implication, the Pet Affection Scale (PAS) confirmed that the attachment level of pet owners is related to pet owner behavior [17]; thus, future research can adopt the PAS to foresee owners’ consumption behavior. Owners’ attachment has positive effects on their behavioral intention, consistent with previous studies [50,51], indicating that customers are expected to revisit or recommend. Therefore, future research can consider the influence of the PAS on other variables such as consumer satisfaction and loyalty. A previous study noted that employee expertise, behavior, and service attitude have significant effects on consumer satisfaction [52].
5.3. Managerial Implications
Practically, because of the annual increasing population of people raising pets and the increasing demand for pet hotels, the relationship between pet owners and their pets has become a crucial topic for marketers. This study developed a scale to explore the attachment between pets and their owners. Based on the PAS, the level of attachment owners have for their pets determines their willingness to exert efforts to care for their pets, including attention, money, and time. Therefore, marketers can base their promotion and advertising on the degree of pet owner attachment in the PAS to emphasize the affection between owners and their pets.
5.4. Limitations and Future Research
This study has several limitations that future research should improve. The population of pet owners raising dogs and cats is distinct, so future research should improve the proportion of dog and cat owners to conduct an in-depth investigation. This study did not discuss the number of years people raise pets. Therefore, it can be used as a factor to explore whether raising pets for longer periods has an influence on pet owner attachment and affection.
Author Contributions
Conceptualization, Y.-H.L. and C.-M.L.; methodology, Y.-H.L.; software, C.-M.L.; validation, Y.-H.L. and C.-M.L.; formal analysis, Y.-H.L. and C.-M.L.; investigation, Y.-H.L.; resources, C.-M.L.; data curation, C.-M.L.; writing—original draft preparation, C.-M.L.; writing—review and editing, Y.-H.L.; supervision, Y.-H.L.; project administration, Y.-H.L. All authors have read and agreed to the published version of the manuscript.
Funding
This research received no external funding.
Institutional Review Board Statement
Not applicable.
Informed Consent Statement
Not applicable.
Data Availability Statement
All data is obtained by questionnaire.
Conflicts of Interest
The authors declare no conflict of interest.
References
- Wu, Y. The Pet Industry is Booming-Americans Spend More than 52 Billion on Furkids. Animal Friendly. 2020. Available online: https://animal-friendly.co/2020/03/03/520/ (accessed on 27 April 2021).
- Chaves, D.S.A. The importance of the pet market for the development of new products based on medicinal plants and their derivatives. Ann. Phytomed. 2020, 9, 1–5. [Google Scholar] [CrossRef]
- Trendsightinc. 2020 Golden Cross, Taiwanese Hairy Children Surpassed Children for the First Time. Expert in Identifying Trends & Deriving Insights. 2020. Available online: https://www.trendsightinc.com/insight/2020%E9%BB%83%E9%87%91%E4%BA%A4%E5%8F%89%EF%BC%8C%E5%8F%B0%E7%81%A3%E8%B2%93%E7%8B%97%E6%95%B8%E9%A6%96%E6%AC%A1%E8%B6%85%E9%81%8E%E5%85%92%E7%AB%A5/ (accessed on 27 April 2021).
- Zilcha-Mano, S.; Mikulincer, M.; Shaver, P.R. An attachment perspective on human–pet relationships: Conceptualization and assessment of pet attachment orientations. J. Res. Personal. 2011, 45, 345–357. [Google Scholar] [CrossRef]
- Johnson, S.B.; Rule, W.R. Personality Characteristics and Self-esteem in Pet Owners and Non-owners. Int. J. Psychol. 1991, 26, 241–252. [Google Scholar] [CrossRef]
- Walsh, F. Human-Animal Bonds I: The Relational Significance of Companion Animals. Fam. Process. 2009, 48, 462–480. [Google Scholar] [CrossRef] [PubMed]
- Wollrab, T.I. Human-animal bond issues. J. Am. Vet. Med. Assoc. 1998, 212, 1675. [Google Scholar]
- McConnell, A.R.; Brown, C.M.; Shoda, T.M.; Stayton, L.E.; Martin, C.E. Friends with benefits: On the positive consequences of pet ownership. J. Personal. Soc. Psychol. 2011, 101, 1239–1252. [Google Scholar] [CrossRef] [PubMed] [Green Version]
- Friedmann, E.; Katcher, A.H.; Lynch, J.J.; Thomas, S.A. Animal companions and one-year survival of patients after discharge from a coronary care unit. Public Health Rep. 1980, 95, 307–312. [Google Scholar]
- Francis, G.; Turner, J.; Johnson, S. Domestic animal visitation as therapy with adult home residents. Int. J. Nurs. Stud. 1985, 22, 201–206. [Google Scholar] [CrossRef]
- Katcher, A.H. Interactions between people and their pets: Form and function. In Interrelations between People and their Pets; Fogle, B., Ed.; Charles C. Thomas: Springfield, IL, USA, 1981. [Google Scholar]
- Connell, M.S.; Lago, D.J. Favorable attitudes towards pets and happiness among the elderly. In The Pet Connection Minneapolis: Center to Study Human-Animal Relationships and Environments; Anderson, R.K., Hart, B.L., Hart, L.A., Eds.; University of Minnesota: South St. Paul, MN, USA, 1983. [Google Scholar]
- Templer, D.I.; Salter, C.A.; Dickey, S.; Baldwin, R.; Veleber, D.M. The construction of the Pet Attitude Scale. Psychol. Rec. 1981, 31, 343–348. [Google Scholar] [CrossRef]
- Morovati, R.D.; Steinberg, L.A.; Taylor, C.L.; Lee, B.H. Further Validation Evidence for the Pet Attitude Scale. N. Am. J. Psychol. 2008, 10, 543–552. [Google Scholar]
- Marks, S.G.; Koepke, J.E.; Bradleya, C.L. Pet attachment and generativity among young adults. J. Psychol. 1994, 128, 641–650. [Google Scholar] [CrossRef]
- Zasloff, R.L. Measuring attachment to companion animals: A dog is not a cat is not a bird. Appl. Anim. Behav. Sci. 1996, 47, 43–48. [Google Scholar] [CrossRef] [Green Version]
- Shore, E.R.; Douglas, D.K.; Riley, M.L. What’s in it for the Companion Animal? Pet Attachment and College Students’ Behaviors toward Pets. J. Appl. Anim. Welf. Sci. 2005, 8, 1–11. [Google Scholar] [CrossRef]
- Kongtaveesawas, N.; Namwong, S. Pet-Friendly Policy in Upscale and Luxury Tourism Accommodations: Service Customizations under SERVQUAL. J. DTC 2020, 14, 500–514. [Google Scholar]
- Glavočić, I. Dubrovnik as a Pet Friendly Tourist Destination. 2019. Available online: https://repository.acmt.hr/islandora/object/acmt:62 (accessed on 15 July 2021).
- Archer, J. Why Do People Love Their Pets? Evol. Hum. Behav. 1996, 18, 237–259. [Google Scholar] [CrossRef]
- Ainsworth, M.D.S.; Blehar, M.C.; Waters, E.; Wall, S. Patterns of Attachment: Assessed in the Strange Situation and at Home; Erlbaum: Hillsdale, NJ, USA, 1978. [Google Scholar]
- Voith, V. Attachment of people to companion animals. Vet. Clin. N. Am. Small Anim. Pract. 1985, 15, 289–295. [Google Scholar] [CrossRef]
- Corson, S.A.; Corson, E.O.; Gwynne, P.H. Pet-facilitated psychotherapy. In Pet Animals and Society; Anderson, R.S., Ed.; Bailliere Tindall: London, UK, 1975. [Google Scholar]
- Munsell, K.L.; Canfield, M.; Templer, D.I.; Tangan, K.; Arikawa, H. Modification of the Pet Attitude Scale. Soc. Anim. 2004, 12, 137–142. [Google Scholar]
- Chumley, P.R.; Gorski, J.D.; Saxton, A.M.; Granger, B.P.; New, J.C. Companion animal attachment and military transfer. Anthrozoös 1993, 6, 258–273. [Google Scholar] [CrossRef]
- White, C.; Yu, Y.T. Satisfaction emotions and consumer behavioral intentions. J. Serv. Mark. 2005, 19, 411–420. [Google Scholar] [CrossRef]
- Bitner, M.J. Servicescapes: The impact of physical surroundings on customers and employees. J. Mark. 1992, 56, 57–71. [Google Scholar] [CrossRef]
- Lucas, A.F. The determinants and effects of slot servicescape satisfaction in a Las Vegas hotel casino. UNLV Gaming Res. Rev. J. 2003, 7, 1–19. [Google Scholar]
- Wakefield, K.L.; Blodgett, J.G. The effect of the servicescape on customers’ behavioral intentions in leisure service settings. J. Serv. Mark. 1996, 10, 45–61. [Google Scholar] [CrossRef]
- Silverman, G. How to harness the awesome power of word of mouth. Dir. Mark. 1997, 60, 32–37. [Google Scholar]
- Ajzen, I.; Fishbein, M. Understanding Attitudes and Predicting Social Behavior; Prentice-Hall: Englewood Cliffs, NJ, USA, 1980. [Google Scholar]
- Bowlby, J. Attachment and Loss: Attachment, 2nd ed.; Basic Books: New York, NY, USA, 1982; Volume 1. [Google Scholar]
- Askew, H.R. Treatment of Behavior Problems in Dogs and Cats: A Guide for the Small Animal Veterinarian; Blackwell: London, UK, 1996. [Google Scholar]
- Herzog, H. The Impact of Pets on Human Health and Psychological Well-Being: Fact, Fiction, or hypothesis? Curr. Dir. Psychol. Sci. 2011, 20, 236–239. [Google Scholar] [CrossRef]
- Anderson, P.E. The powerful Bond between People and Pets: Our Boundless Connections to Companion Animals; Praeger: Westport, CT, USA, 2008. [Google Scholar]
- Albert, A.; Bulcroft, K. Pets, Families, and the Life Course. J. Marriage Fam. 2014, 50, 543–552. [Google Scholar] [CrossRef]
- Ryu, K.; Lee, H.R.; Kim, W.G. The influence of the quality of the physical environment, food, and service on restaurant image, customer perceived value, customer satisfaction, and behavioral intentions. Int. J. Contemp. Hosp. Manag. 2012, 24, 200–223. [Google Scholar] [CrossRef]
- Hutcheson, G.; Sofroniou, N. The Multivariate Social Scientist; Sage: London, UK, 1999. [Google Scholar]
- Snedecor, G.W.; Cochran, W.G. Statistical Methods, 8th ed.; Lowa State University Press: Ames, IA, USA, 1989. [Google Scholar]
- Field, A. Discovering Statistics Using SPSS, 2nd ed.; SAGE Publications Ltd.: London, UK, 2005. [Google Scholar]
- Kaiser, H.F. The application of electronic computers to factor analysis. Educ. Psychol. Meas. 1960, 2, 141–151. [Google Scholar] [CrossRef]
- Nunnally, J.C. Psychometric Theory; McGraw-Hill: New York, NY, USA, 1978. [Google Scholar]
- Bagozzi, R.P.; Yi, Y. On the Evaluation of Structural Equation Models. J. Acad. Mark. Sci. 1988, 16, 74–94. [Google Scholar] [CrossRef]
- Fornell, C.; Larcker, D.F. Evaluating structural equation models with unobservable variables and measurement error. J. Mark. Res. 1981, 18, 39–50. [Google Scholar] [CrossRef]
- Hair, J.F.; Black, W.C.; Babin, B.J.; Anderson, R.E. Multivariate Data Analysis, 7th ed.; Prentice Hall: Upper Saddle River, NJ, USA, 2010. [Google Scholar]
- Hightower, R., Jr.; Brady, M.K.; Baker, T.L. Investigating the role of the physical environment in hedonic service consumption: An exploratory study of sporting events. J. Bus. Res. 2002, 55, 697–707. [Google Scholar] [CrossRef]
- Anderson, J.C.; Gerbing, D.W. An updated paradigm for scale development incorporating unidimensionality and its assessment. J. Mark. Res. 1988, 25, 186–192. [Google Scholar]
- Kim, W.H.; Min, K.D.; Cho, S.I.; Cho, S. The Relationship Between Dog-Related Factors and Owners’ Attitudes Toward Pets: An Exploratory Cross-Sectional Study in Korea. Front. Vet. Sci. 2020, 7, 493. [Google Scholar] [CrossRef] [PubMed]
- Kwek, A.Y. Influences of Personal Traits of Dog Owners and Relationship Between Dog and Human on Purchase Intention. 2015. Available online: http://ir.lib.cyut.edu.tw:8080/bitstream/310901800/31629/1/103CYUT0615002-001.pdf (accessed on 21 July 2021).
- Loureiro, S.M.C. The role of the rural tourism experience economy in place attachment and behavioral intentions. Int. J. Hosp. Manag. 2014, 40, 1–9. [Google Scholar] [CrossRef]
- Yuksel, A.; Yuksel, F.; Bilim, Y. Destination attachment: Effects on customer satisfaction and cognitive, affective and conative loyalty. Tour. Manag. 2010, 31, 274–284. [Google Scholar] [CrossRef]
- Ekinci, Y.; Dawes, P.L. Consumer perceptions of frontline service employee personality traits, interaction quality, and consumer satisfaction. Serv. Ind. J. 2009, 29, 503–521. [Google Scholar] [CrossRef]
Publisher’s Note: MDPI stays neutral with regard to jurisdictional claims in published maps and institutional affiliations. |
© 2021 by the authors. Licensee MDPI, Basel, Switzerland. This article is an open access article distributed under the terms and conditions of the Creative Commons Attribution (CC BY) license (https://creativecommons.org/licenses/by/4.0/).