Abstract
Conventionally, a market research and strategy for a product depends on the interviews and an explicit cluster/society to identify the customer’s needs. Customer-created information (CCI), such as call-center data, online reviews, and social media posts, provides an opportunity to recognize the customer’s needs more efficiently. Moreover, developed conventional approaches are not compatible with large CCI datasets because most of the CCI-contents are repetitive and uninformative. In this paper, a machine learning approach for identifying the customer needs from the CCI dataset is proposed and its performance is evaluated for targeting and recommending a new product for project management. After the identification of the needs of the customer, information can be used to develop a market strategy, new product launching, brand positioning and much more long/short term planning.
1. Introduction
In the modern scenario, most businesses are innovations centric and fail to maintain their brand with customer’s needs (CN) [1]. As per one survey, customer-focused companies gain ~60% more profit than the companies, which are not customer-centric. Generally, the specific CNs are the influencing factors (IFs) that activate the customer to buy and/or target and/or recommend the product. Therefore, with the intention of recognizing the CNs, it is essential to identify the reasons behind customer’s decision and take care of their actions. To identify the CNs, a deep market research analysis needs to be carried out, which includes the following key-action reasons: (1) survey (such as call-center data, online reviews, and social media post): it helps to get the product’s market value and relevant position in the market; (2) social listening: it helps to find out the customer’s different value interaction with the product; (3) touchpoint maps: it helps to uncover hidden satisfiers/non-satisfiers; (4) journey maps between product and customer uses: it shows the higher relevance of the product for the customers, (5) predictive analysis: it helps to discover the unmet CNs, (6) adaptive conjoint analysis: it helps to evaluate the product valuation as per the customer, (7) personas: it helps to identify the personality of each customer segment/group, and (8) segments: it helps to identify the group/segments of customers concerning the product [2].
The CNs have to be understood first to meet the competitive market demands in an appropriate manner, which leads to a better experience by exceeding the customer expectations. The CNs are classified based on available market customers in a particular demographic region, as shown in Figure 1 in two main verticals (such as product needs and service needs). The key points are highlighted in Figure 1. There are several other key points that may be considered for product needs (i.e., functionality, convenience, experience, design, reliability, performance, efficiency, compatibility, etc.) and service needs (i.e., transparency, control, fairness, option, accessibility, etc.).
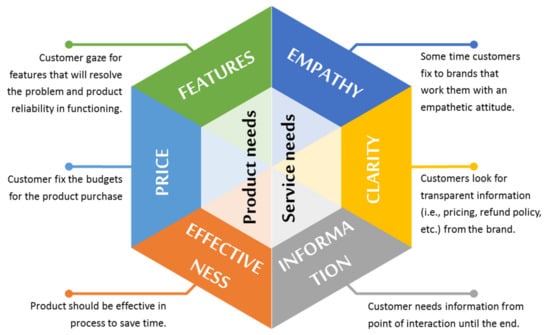
Figure 1.
Type of CNs and its two verticals such as product needs and service needs.
There is a challenge for the business owner to address CNs, which focus the customer retention with good customer relationships. In this regard, several key points need to be addressed while doing market research analysis for any product. These key-points are: (1) deliver quality support for customers: customer expect real-time support (i.e., to provide real-time support: live chat, live assistant solution: live video chat/co-browsing, automatic customer support: deploy chatbot for 24/7 basis, etc.) when it is required; (2) customer journey mapping with product: to get visualization through customer touchpoints via meetings/experiences/loyalties, (3) customer satisfaction measurement: use correct communication way to collect the CSAT (customer satisfaction score), NPS (net premotor score), CES (customer effort score); (4) high customer communication consistency: to avoid the high rate of frustration reported, (5) create a customer centric culture (CCC): try to focus customer experience first and collect all minute touchpoints from the customer; (6) improve the USP (Unique Selling Proposition) of the product: try to make good product quality, which inclines the market attention, acquisition, and/or consumption; (7) collect feedback from the customer: it is very important for a successful product business [3].
In the research domain, there is voluminous published research related to the CNs and their related market strategies and analysis. These studies are: (1) analysis of CNs identify the new product opportunity [4]; (2) CNs fulfilment based on strategic positioning [5]; (3) CNs analysis enhance the new product design [6,7,8]; (4) CNs help to manage the portfolios of the product [9]; (5) CNs support to recognize the variables utilized in the conjoint analysis [10]; (6) CNs investigation enhance the available products and its related services [11]; (7) investigation of CNs is useful for product development [12,13]; (8) quality function deployment (QFD) based on identifying customer solutions or product attributes that address CNs [14]; (9) QFD to map CNs for solution [15]; (10) CNs for product design, testing, and product launch [16]; (11) CNs based attributes identification for conjoint analysis [17,18]; (12) focused group based reviewing the input to identify the CNs manually [19,20,21]; (13) web interface based entry of CNs [22,23]; (14) unstructured textual data (UTD) based on addressing the managerial questions [24,25]; (15) Analyze UTD word groupings by linking them to sales, sentiment, or product ratings [26,27,28]; (16) word groupings identification for product discussion [29,30,31]; (17) CNs mapping for product preference in a specific customer segment [32]; (18) engineering characteristics based identification of product attributes for product development [33,34]; (19) intangible attributes together with physical product attributes with supervised classification techniques [35]; (20) online product configurator design, conjoint analysis, voice of customer analysis, and affective engineering [8,36,37]; (21) CNs analysis based on opinion mining [38]; (22) CNs analysis based on clustering and deep learning [39]; (23) CNs analysis based on classification techniques [40,41,42], and (24) modern techniques based recommendation systems for various product of the market [43,44,45,46,47,48,49,50,51,52], etc.
From the detailed analysis of the literature as above mentioned, most of the work is related to CNs need analysis for different market product analysis point of view (such as product opportunity, strategic analysis, product design, manage the portfolios, attribute identification, services management, etc.) in a general way [4,5,6,7,8,9,10,11,12,13] (Table 1). The developed conventional methods for CNs analysis and their importance for product selection and targeting the new product are mentioned in [14,15,16,17,18,19,20,21,22,23] (Table 2). All these methods are highly dependent on expert skills and required analysis intervention and are time-consuming. The Customer created information (CCI) based text analysis in marketing and product development methods are presented in [24,25,26,27,28,29,30,31,32,33,34,35] (Table 3). In these methods, a huge volume of data with intangible attributes and unstructured textual data are processed, for which is required a large volume of memory and processing time. Apart from these, online product configuration, identification, and recommendation system using advanced techniques/methods are presented in [36,37,38,39,40,41,42,43,44,45,46,47,48,49,50,51,52] (Table 4). Apart from this, [53,54,55], they represent the recommendation system based on personal behavior, ML, and survey respectively. However, most of the above-mentioned techniques are very complex, not too easy to understand, and operation by the operator/researchers, time-consuming and required a huge volume of data storage. For all cited works, the summary of the main contribution and information of developed method along with its drawbacks are shown in Table 1, Table 2, Table 3 and Table 4.

Table 1.
Summary of work related to CNs need analysis for different market product analysis point of view (such as product opportunity, strategic analysis, product design, management of portfolios, attribute identification, services management, etc.) in a general way.
Table 2.
Summary of the developed conventional methods for CNs analysis and their importance for product selection and targeting the new product.
Table 3.
Summary of the Customer created information (CCI)-based text analysis in marketing and product development methods.
Table 4.
Summary of the online product configuration, identification, recommendation system using advanced techniques/methods.
The main aim of this study is to develop a type of solution which is simple in operation with less expert skill and requires minimal operator intervention, providing the recommendations online by using customer-created information (CCI), such as call-center data, online reviews, and social media post. The proposed solution provides an opportunity to recognize the customer needs more efficiently to select the new product for the project management.
The organization of the paper is as follows: the introduction about the problem and its associated work is represented in Section 1. The proposed approach and methodology are represented in Section 2, which includes detailed information and mathematical modeling of the neural network-based recommendation method. In Section 3, the demonstration and discussion of the results are presented. Finally, the conclusion followed by the future scope of the study is represented in Section 4.
2. Methodology and Proposed Approach
The machine learning-based proposed approach for targeting and recommending a new product in the market for project management is shown in Figure 2, which is the marriage of seven parts, as follows:
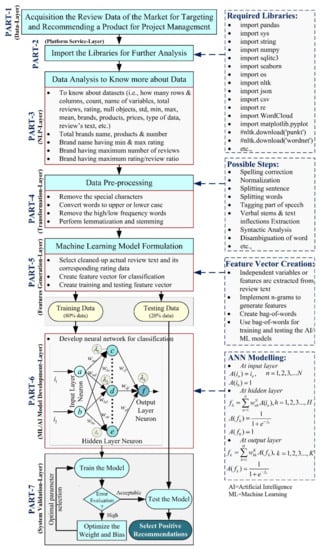
Figure 2.
A proposed approach for targeting and recommending a new product in the market for project management.
- (1)
- PART-1: Acquisition of the review dataset of the market related to a brand/product;
- (2)
- PART-2: Import of the intelligent data analytics libraries;
- (3)
- PART-3: Review data analysis to know more about the dataset;
- (4)
- PART-4: Data pre-processing;
- (5)
- PART-5: Machine learning model formulation;
- (6)
- PART-6: AI/ML model development to select the informative and/or non-informative information and recommendation;
- (7)
- PART-7: Model validation and its performance visualization.
The proposed approach is totally different and more advanced (based on CCI dataset only) than the model mentioned in the literature [56,57,58]. In [56], the author represents a state-of-the-art related to software project management using ML techniques based on Web Science, Science Directs, and IEEE Explore. A total of 111 research papers have been categorized into four categories. In [57], the author represented the digital twin-based ML application for product optimization in the industry. In [58], a statistical and ML approach based on the two Bass models is developed for forecasting the demand. The main advancement of the proposed approach is that these three ML approaches [56,57,58] are not based on CCI datasets.
In this study, several software/emulation platforms are required to develop the different types of algorithms and methods for distinct operation with the huge volume of the product’s review dataset (Amazon dataset of “Cell Phones and Accessories”: 10,063,255 reviews for 590,269 products). Therefore, several libraries (i.e., import pandas, import sys, import string, import numpy, import sqlite3, import seaborn, import os, import nltk, import json, import csv, import re, import WordCloud, import matplotlib.pyplot, #nltk.download(‘punkt’), #nltk.download(‘wordnet’), etc.) are imported in PART-2 to perform the big-data analysis/analytics (BDA). Generally, BDA is the utilization of the advanced analytic algorithms/techniques for diverse, very large data sets, which include unstructured and/or semi-structured, and/or structure data of different size from different sources [59]. After imported these libraries, data analysis is performed in PART-3 to know more about the reviews dataset, such as (1) to know about datasets (i.e., how many rows and columns, count, name of variables, total reviews, rating, null objects, std, min, max, mean, brands, products, prices, type of data, review’s text, etc.); (2) total brand names, products, and number; (3) brand name having min. and max. ratings; (4) brand having a maximum number of reviews; and (5) brand having maximum rating/review ratio, etc.
The data pre-processing (PART-4) is used to clean and make the data useful (well-formed data sets), which includes the four main functions such as removing the special characters (‘!’, ‘“’, ‘#’, ‘$’, ‘%’, ‘&’, “‘”, ‘(‘,’)’, ‘*’, ‘+’, ‘,’, ‘-’, ‘.’, ‘/’, ‘:’, ‘;’, ‘<’, ‘=’, ‘>’, ‘?’, ‘@’, ‘[‘,’]’, ‘^’, ‘_’, ‘`’, ‘{‘,’}’, ‘~’, ‘§’, ‘®’ etc.), converting the words to upper or lower case (for example, ‘COm’, ‘CoMe’ etc.), removing the high/low frequency words and performing lemmatization (i.e., morphological analysis of the words), and stemming (i.e., cutting off the beginning or the end of the word). These four functions are performed and analyzed by using following steps: (1) spelling correction, (2) normalization, (3) splitting of the sentence, (4) splitting of words, (5) tagging the part of speech (PoS), (6) extracting of the verbal stems and text inflections, (7) syntactic analysis, and (8) disambiguation of the word.
Now, the clean and useful data (obtained from PART-4) are used to develop the machine learning-based targeting and recommending a new product. In this stage, three main functions are performed: (1) select cleaned-up actual review text and its corresponding rating data; (2) create a feature vector for classification; (3) create training and testing feature vectors; (4) develop the AI/ML model; and (5) perform the training, testing, and validation for the developed model to visualize its performance for targeting and recommending a new product in the market for project management. In the process of feature vector generation, the independent variables or features are extracted from the review text. The following stepwise procedure is performed to extract the features: (1) implement n-grams to generate features, (2) create bag-of-words (BoW), and (3) wse bag-of-words for generating the training and testing data files for the classifier model. The implementation of n-grams for feature extraction has more advantages (i.e., retain the structure and analyze the word in context) than disadvantages (i.e., the dimension of the feature vector is extremely large). Moreover, the featurization of the data can be performed by three methods (BoW, TF-IDF, and WEM: word embeddings model). The implementation of the BoWs procedure is similar to the count-based representations of the review data. Once BoWs are created, the feature vector is divided into training and test datasets, which interpreted the positive or negative trend of the market product. Apart from the BoW method, the TF-IDF (Term Frequency-Inverse Document Frequency) method can be featured in the review data, which is highly dependent on the normalized TF (Equation (1)) and IDF (Equation (2)) as given below:
Moreover, both (BoW and TF-IDF) methods are not adept at capturing the context of a word in the document. Therefore, WEM is implemented to capture the context of a word in a document and its relation with other words. This method is widely used for an image-based approach for targeting and recommending a new product in the market. After feature vector extraction, a neural network (NN) based classifier is designed to classify the positive and negative recommendations, as mentioned in PART-6 of Figure 2. The mathematical implementation of a three-layered NN architecture is given below [60,61]:
Let us assume the input data of s samples with the labeled output value for the two-class problem of positive and negative recommendations of the product in the market. The weight matrix at input-hidden and hidden-output layer is and , respectively; n and h are the numbers of neurons associated with the number of inputs (i); hidden layer, which is connected through the weight vector , and is the weight vector used to connect the hidden and output layer of two neurons (as a problem is a two-class classification). The activation function used for modeling is for the neuron; then, the computation of the value at the input and output sides of each neuron is as follows:
- (1)
- Modelling at input-layer for nth neurons:
- (2)
- Modelling at hidden-layer for hth neurons:
- (3)
- Modeling at output-layer for fth neurons:
The performance of the NN highly depends on the number of hidden layer neurons, which are chosen by the hidden-and-trial method, or it can be evaluated by Equation (10). But Equation (10) provides a maximum range of neurons, starting from 1.
The overall performance accuracy of the NN model is evaluated by Equation (11) for all project management problems.
where and are the correctly classified positive and negative responses, respectively. and are incorrectly classified as positive and negative responses, respectively.
3. Results Demonstration and Discussion
3.1. Dataset Used for the Performance Demonstration
The performance demonstration and validation of the proposed approach is represented by using Amazon review data (2018) [62] of 233.1 million reviews, which include the reviews of the product from May 1996 to October 2018. The metadata have the following basic information for each review of the product: product information consists of the product package type (electronics/hardcover etc.), size (black/white), color (small/large), and product image. The complete review data include the reviews for the following brands/categories: (1) Amazon Fashion data; (2) All Beauty data; (3) Appliances reviews data; (4) Arts, Crafts and Sewing data; (5) Automotive reviews data; (6) Books reviews data; (7) CDs and Vinyl reviews data; (8) Cell Phones and Accessories reviews data; (9) Clothing Shoes and Jewelry reviews data; (10) Digital Music reviews data; (11) Electronics reviews data; (12) Gift Cards reviews data; (13) Grocery and Gourmet Food reviews data; (14) Home and Kitchen reviews data; (15) Industrial and Scientific reviews data; (16) Kindle Store reviews data; (17) Luxury Beauty reviews data; (18) Magazine Subscriptions reviews data; (19) Movies and TV reviews data; (20) Musical Instruments reviews data; (21) Office Products reviews data; (22) Patio, Lawn, and Garden reviews data; (23) Pet Supplies reviews data; (24) Prime Pantry reviews data; (25) Software reviews data; (26) Sports and Outdoors reviews data; (27) Tools and Home Improvement reviews data; (28) Toys and Games reviews data, and (29) Video Games reviews data.
In this study, cellphone review dataset is used to demonstrate the result and model performance. The reviews data related to the Amazon mobile is segregated and utilized further in the study.
3.2. Case Study: Analyzing the Cellphone Market Status
To analyze the cellphone market status for a particular brand and/or product, the amazon product reviews on cellphone data are used, which include the information about the brand, rating, prices, categories, dateAdded, dateUpdated, keys, manufacturer, reviewer id, reviews text, ASINs (Amazon Standard Identification Number), title, URL, image, etc. Firstly, the following analysis is performed for targeting and recommending a cell phone for project management as given below: (1) to identify the total number of available brands in the market, (2) to analyze and identify the maximum and minimum rating of each brand, (3) to analyze the number of reviews, (4) to evaluate the MRR (ration between maximum rating and review), (5) to identify the brand which has a maximum and a minimum number of reviews.
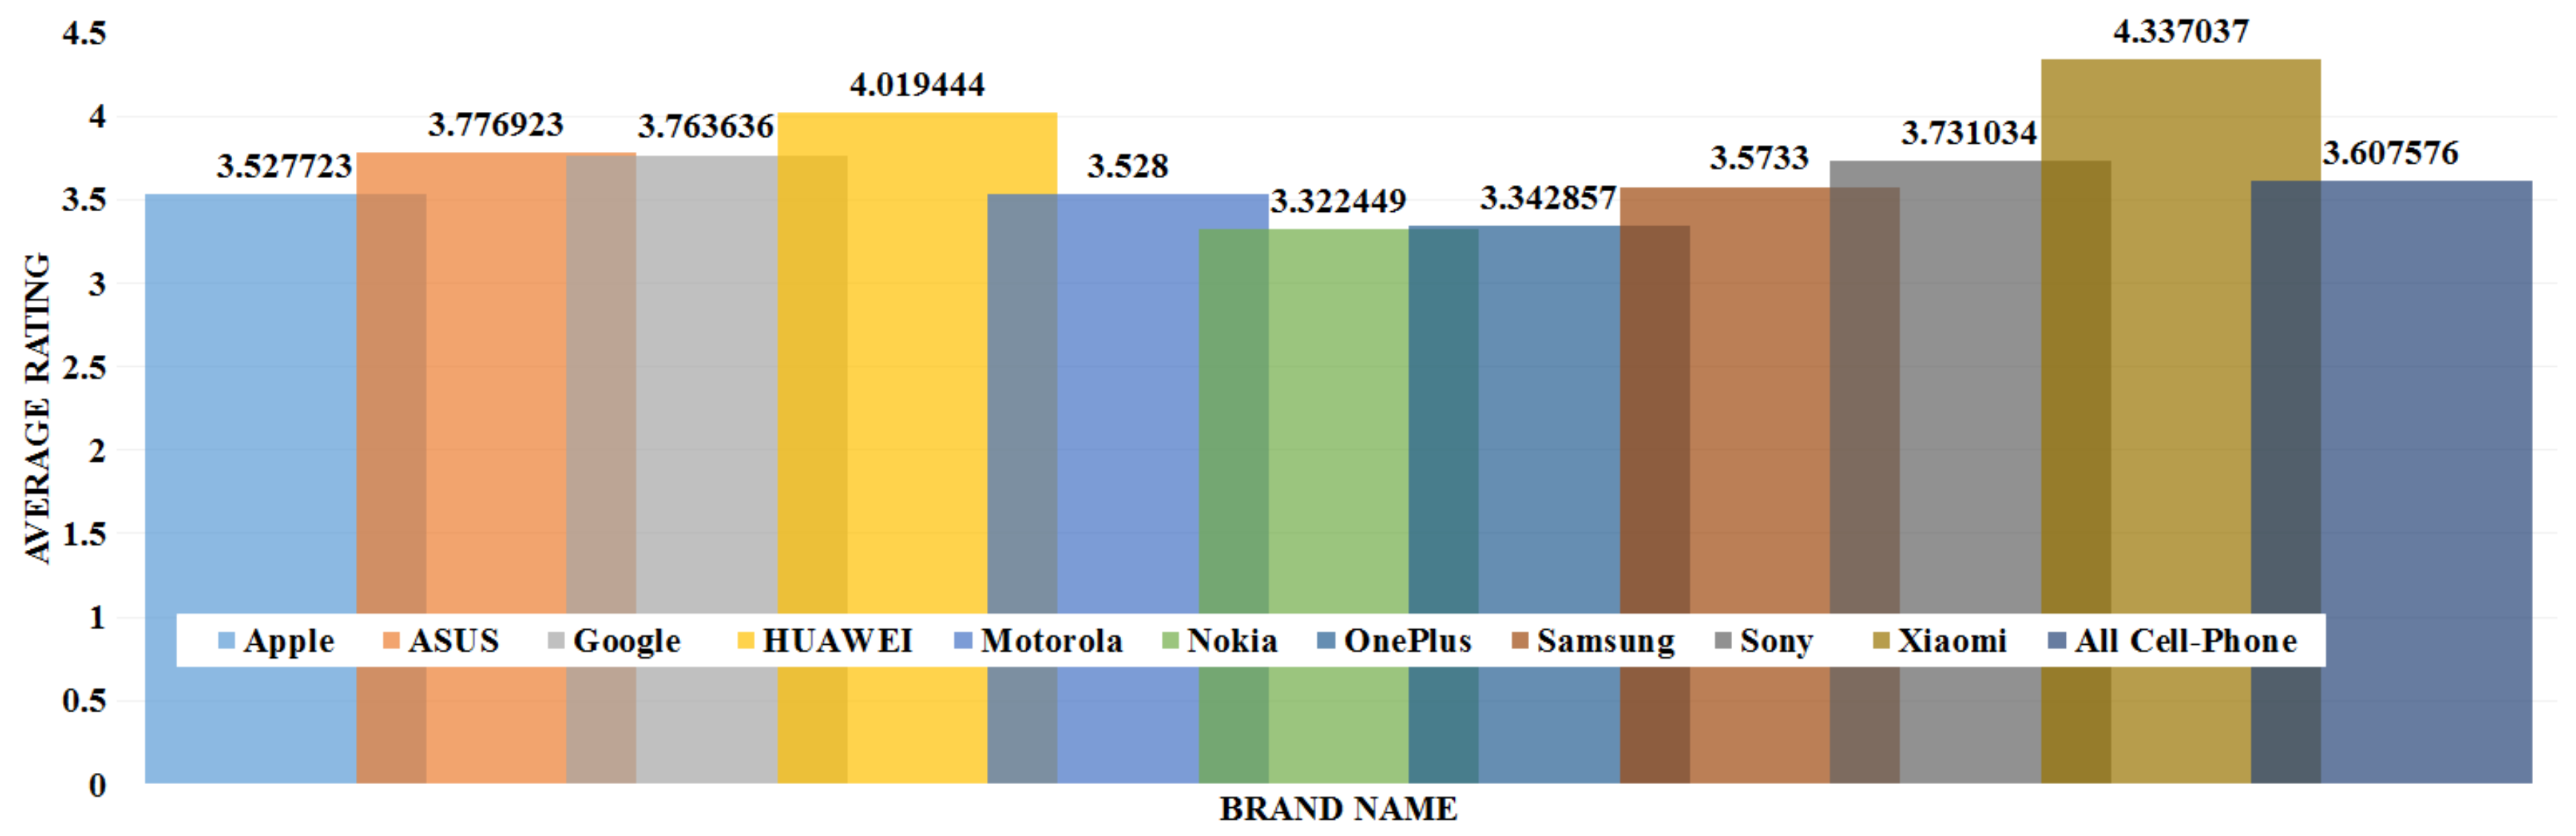
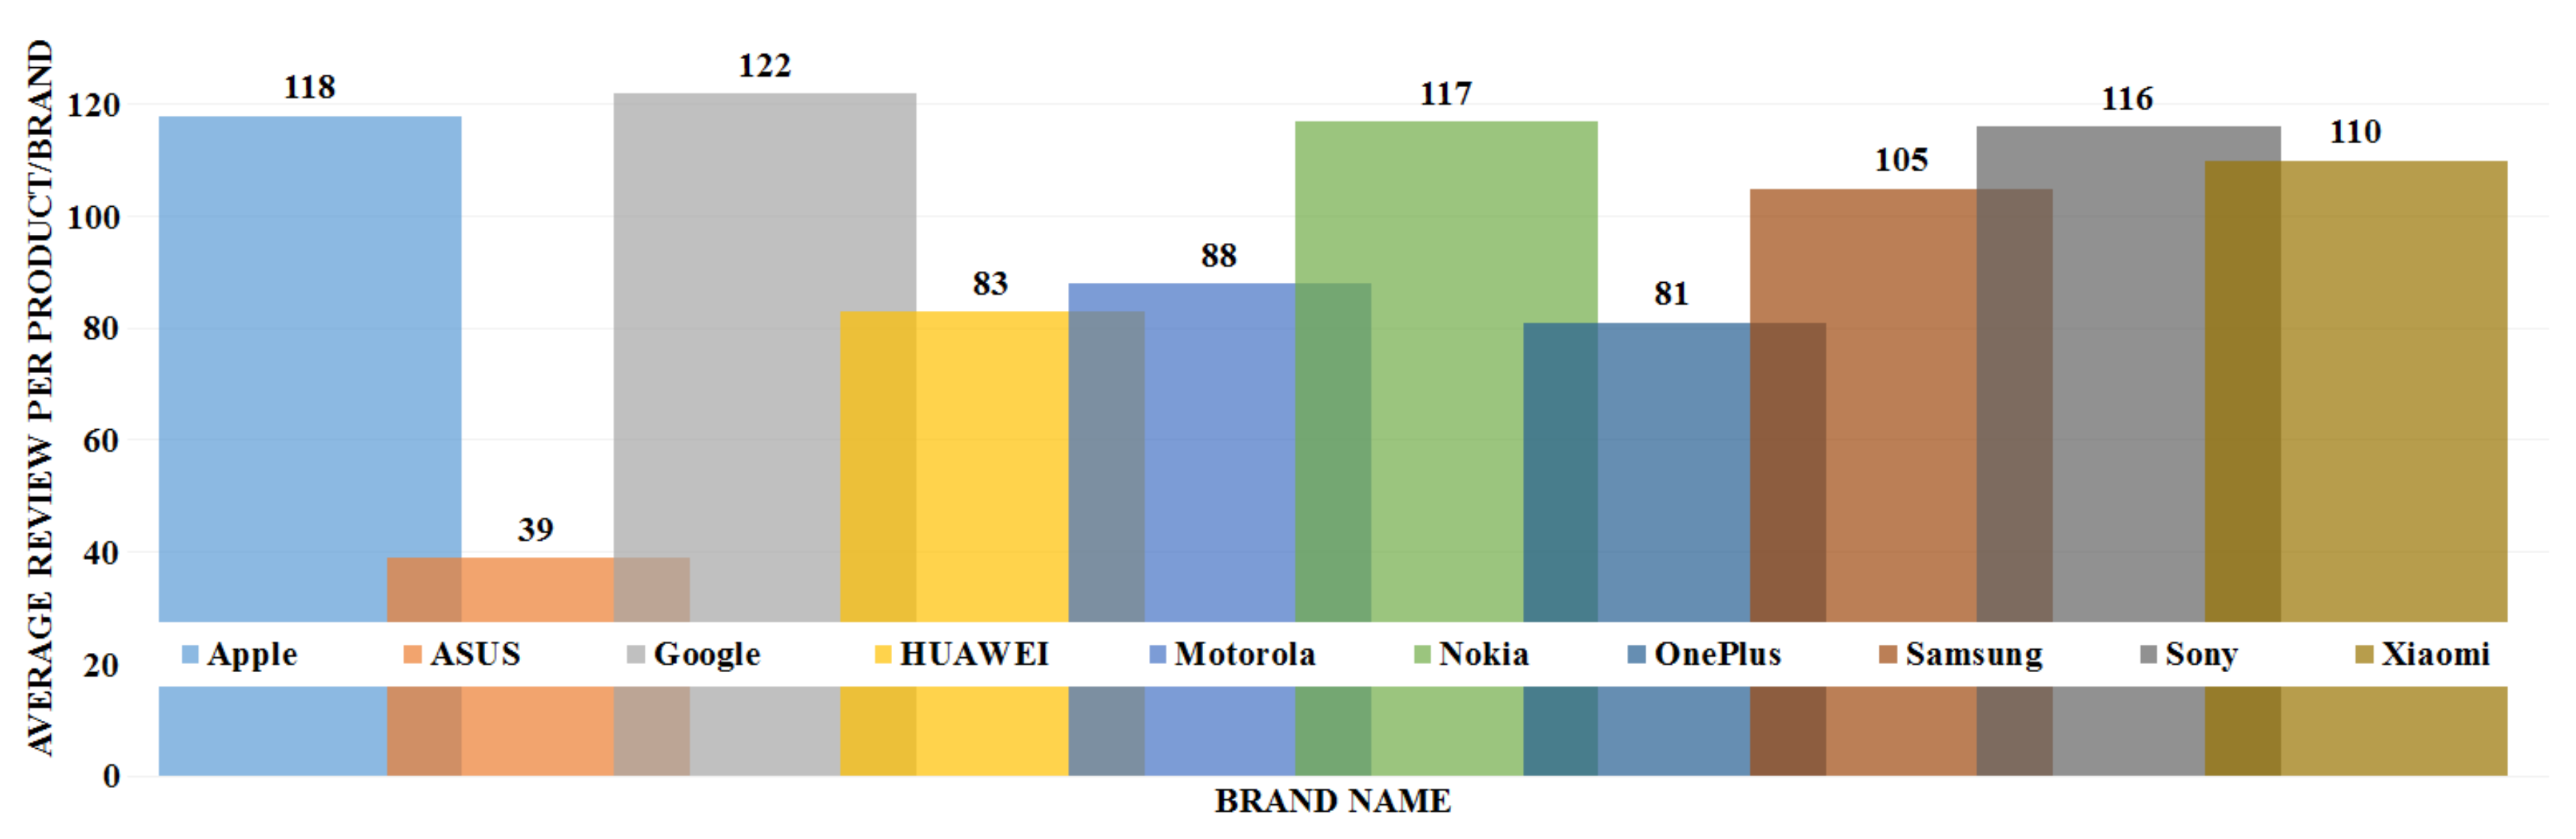
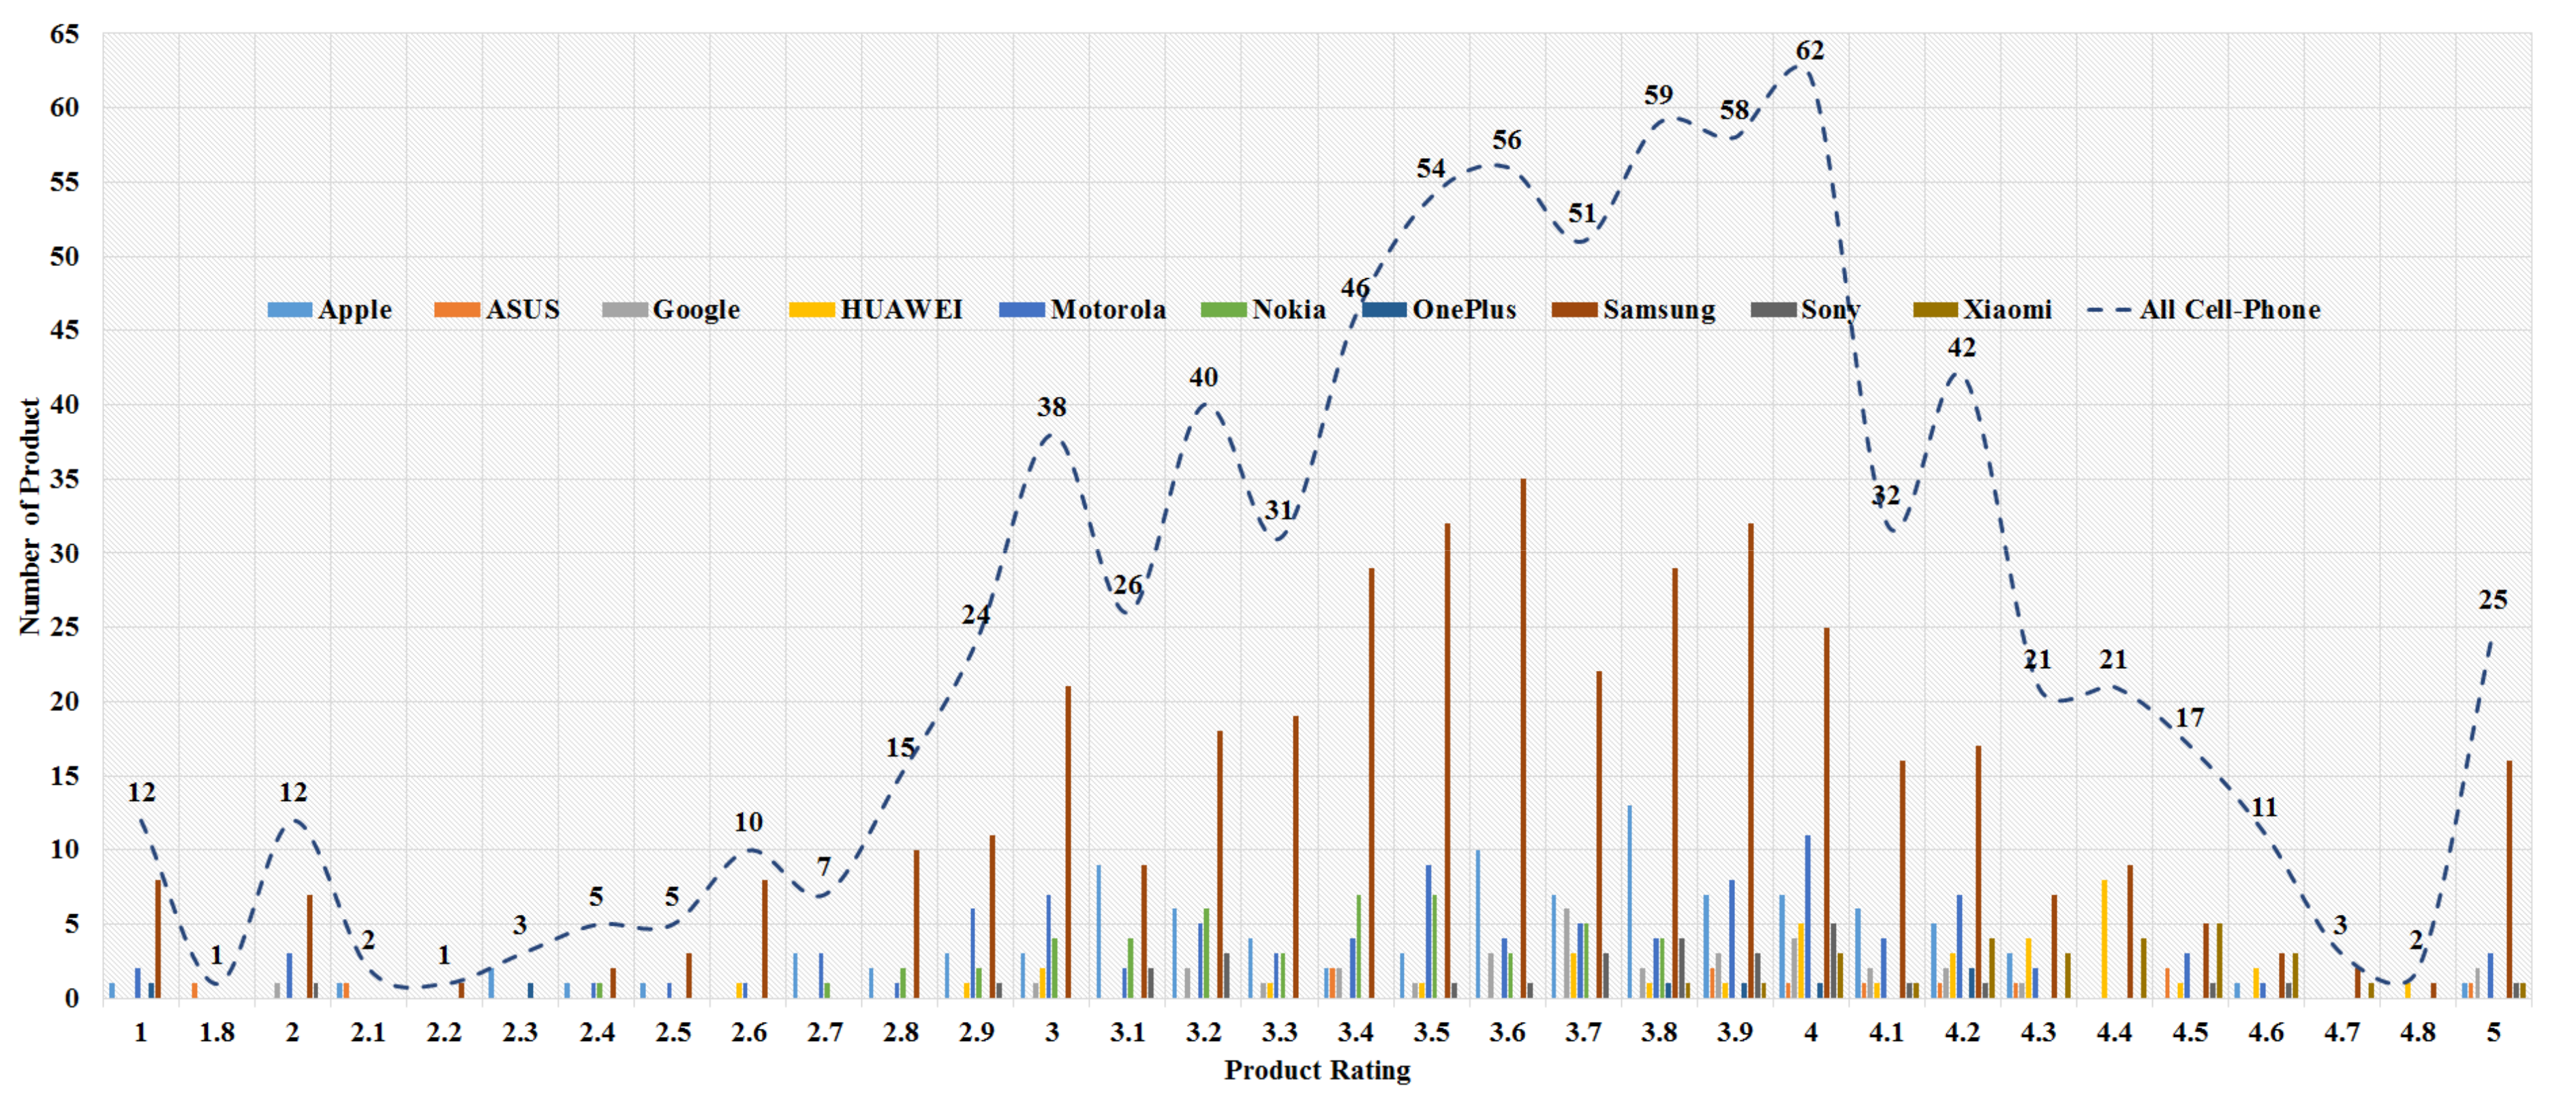
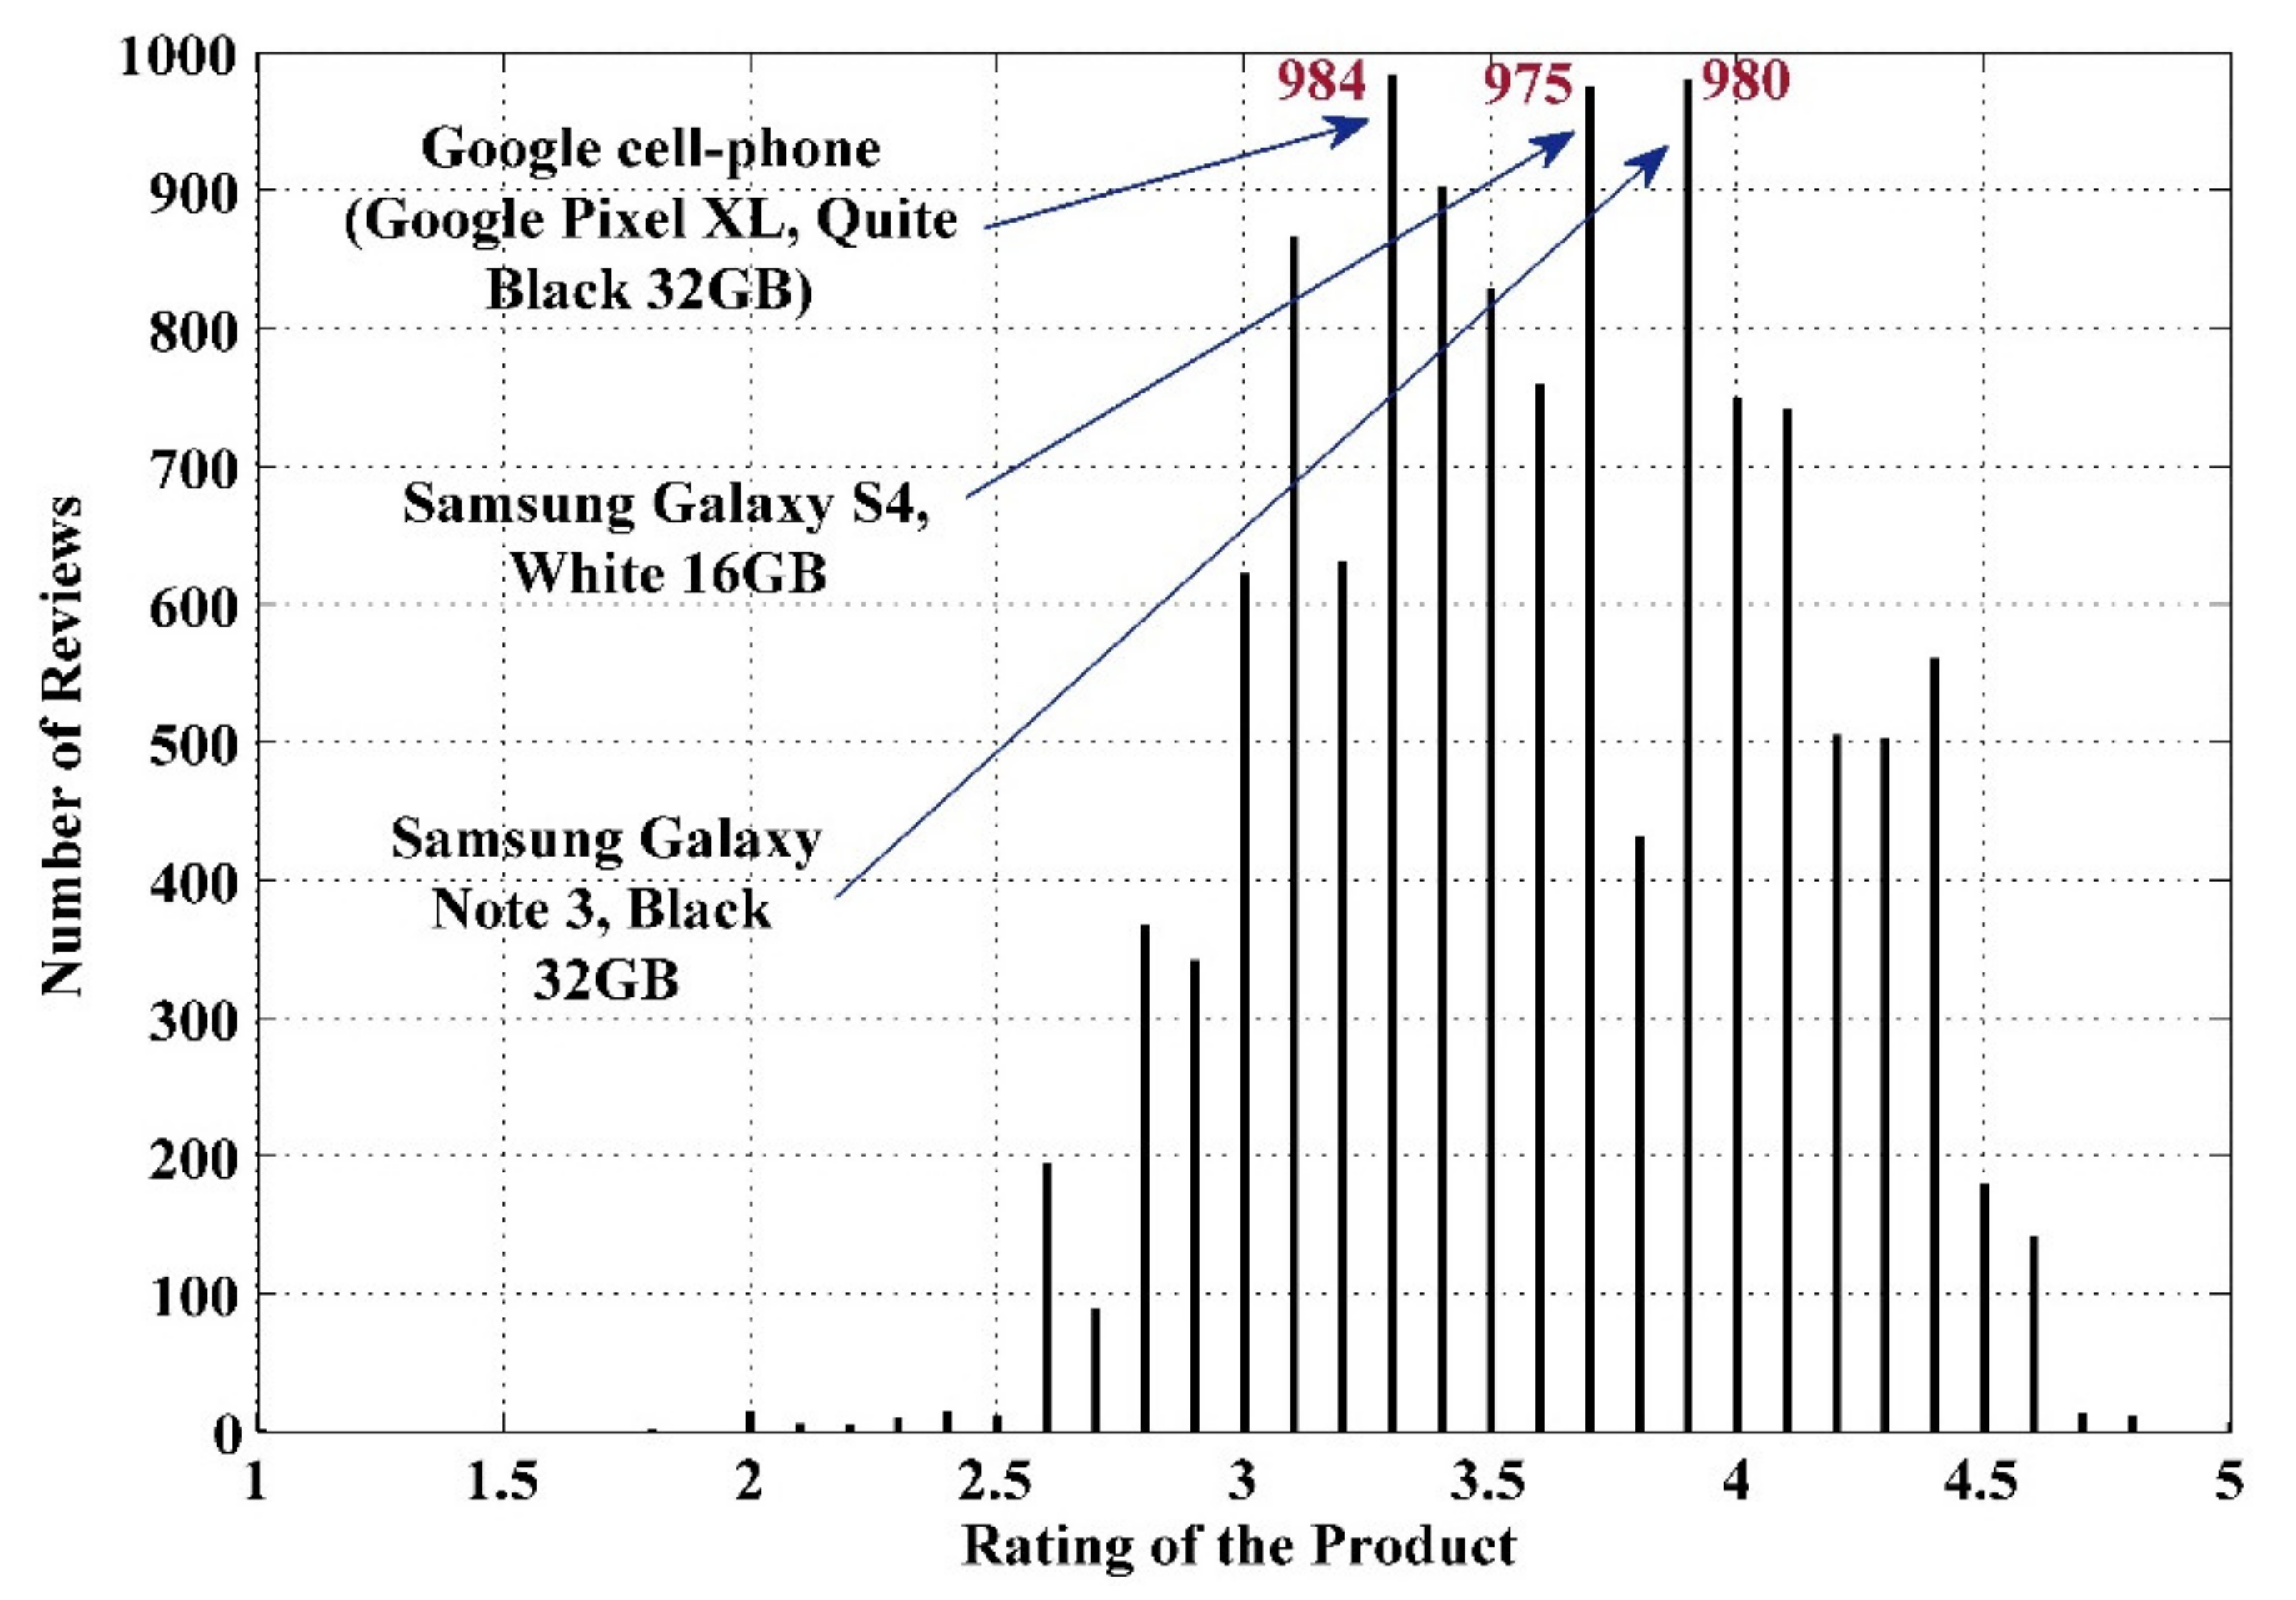
The data analysis to know more information about the data and its properties is represented in Table 5 and Figure 3, Figure 4, Figure 5, Figure 6, Figure 7, Figure 8, Figure 9, Figure 10, Figure 11, Figure 12, Figure 13, Figure 14, Figure 15, Figure 16, Figure 17 and Figure 18. The table represents the information related to brands, the number of items/products per brand, product rating information, and the total number of reviews for each brand. Figure 3 shows the percentage (%) rating of the available brands in the market, which indicates that Xiaomi cell phone has the highest percentage rating in the market. Figure 4 represents the analysis of the average rating provided by the customer for each brand in the market. Xiaomi has the highest average rating in comparison with other brands because people like it due to its low price and high feature value and it being a very popular brand. The average number of reviews for each brand is shown in Figure 5, which shows that Google mobile has the highest number of average reviews, which indicates that Google has the maximum average reviews per product because of people writing a lot of reviews for google products. Moreover, Figure 6 shows the brand-wise and rating-wise number of products in the market for review, whereas Figure 7 represents the brand-wise and rating-wise number of total reviews of products in the market. The highest number of products in the market is launched by Samsung and hence highest reviews are written for Samsung by the customer, followed by the Apple brand. In Figure 8, it is analyzed that the product which has the highest number of reviews (984) is Google cell phone (Google Pixel XL, Quite Black 32 GB), which is followed by Samsung Galaxy S4 (White 16 GB) with 980 reviews.
Table 5.
Data analysis representation for cellphone reviews data.
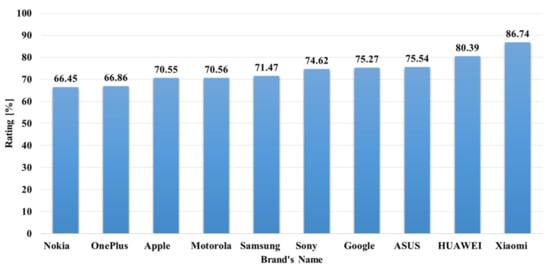
Figure 3.
Rating analysis of the mobile phone brands.

Figure 4.
Average rating of the mobile phone brands.
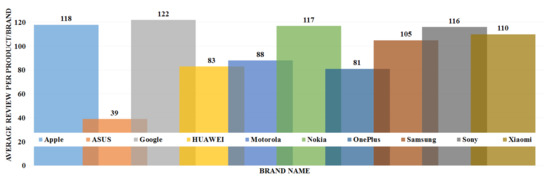
Figure 5.
Average number of reviews per product per brand.
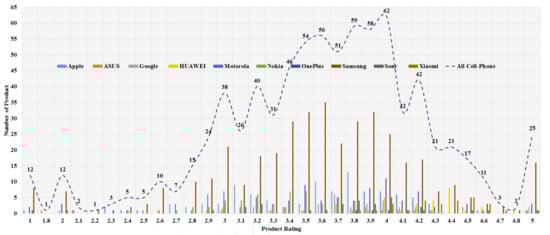
Figure 6.
Brand wise and rating wise number of products in the market for review.
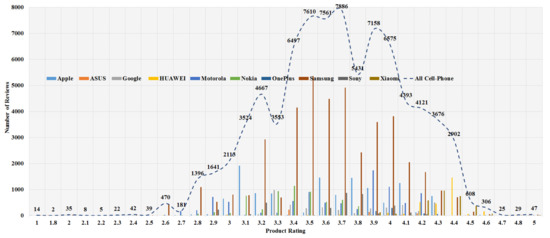
Figure 7.
Brand wise and rating wise number of total reviews of products in the market.

Figure 8.
Rating wise number of maximum reviews of the products in the market.
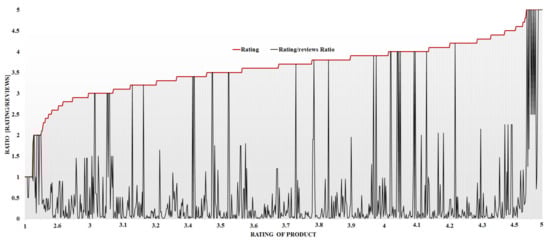
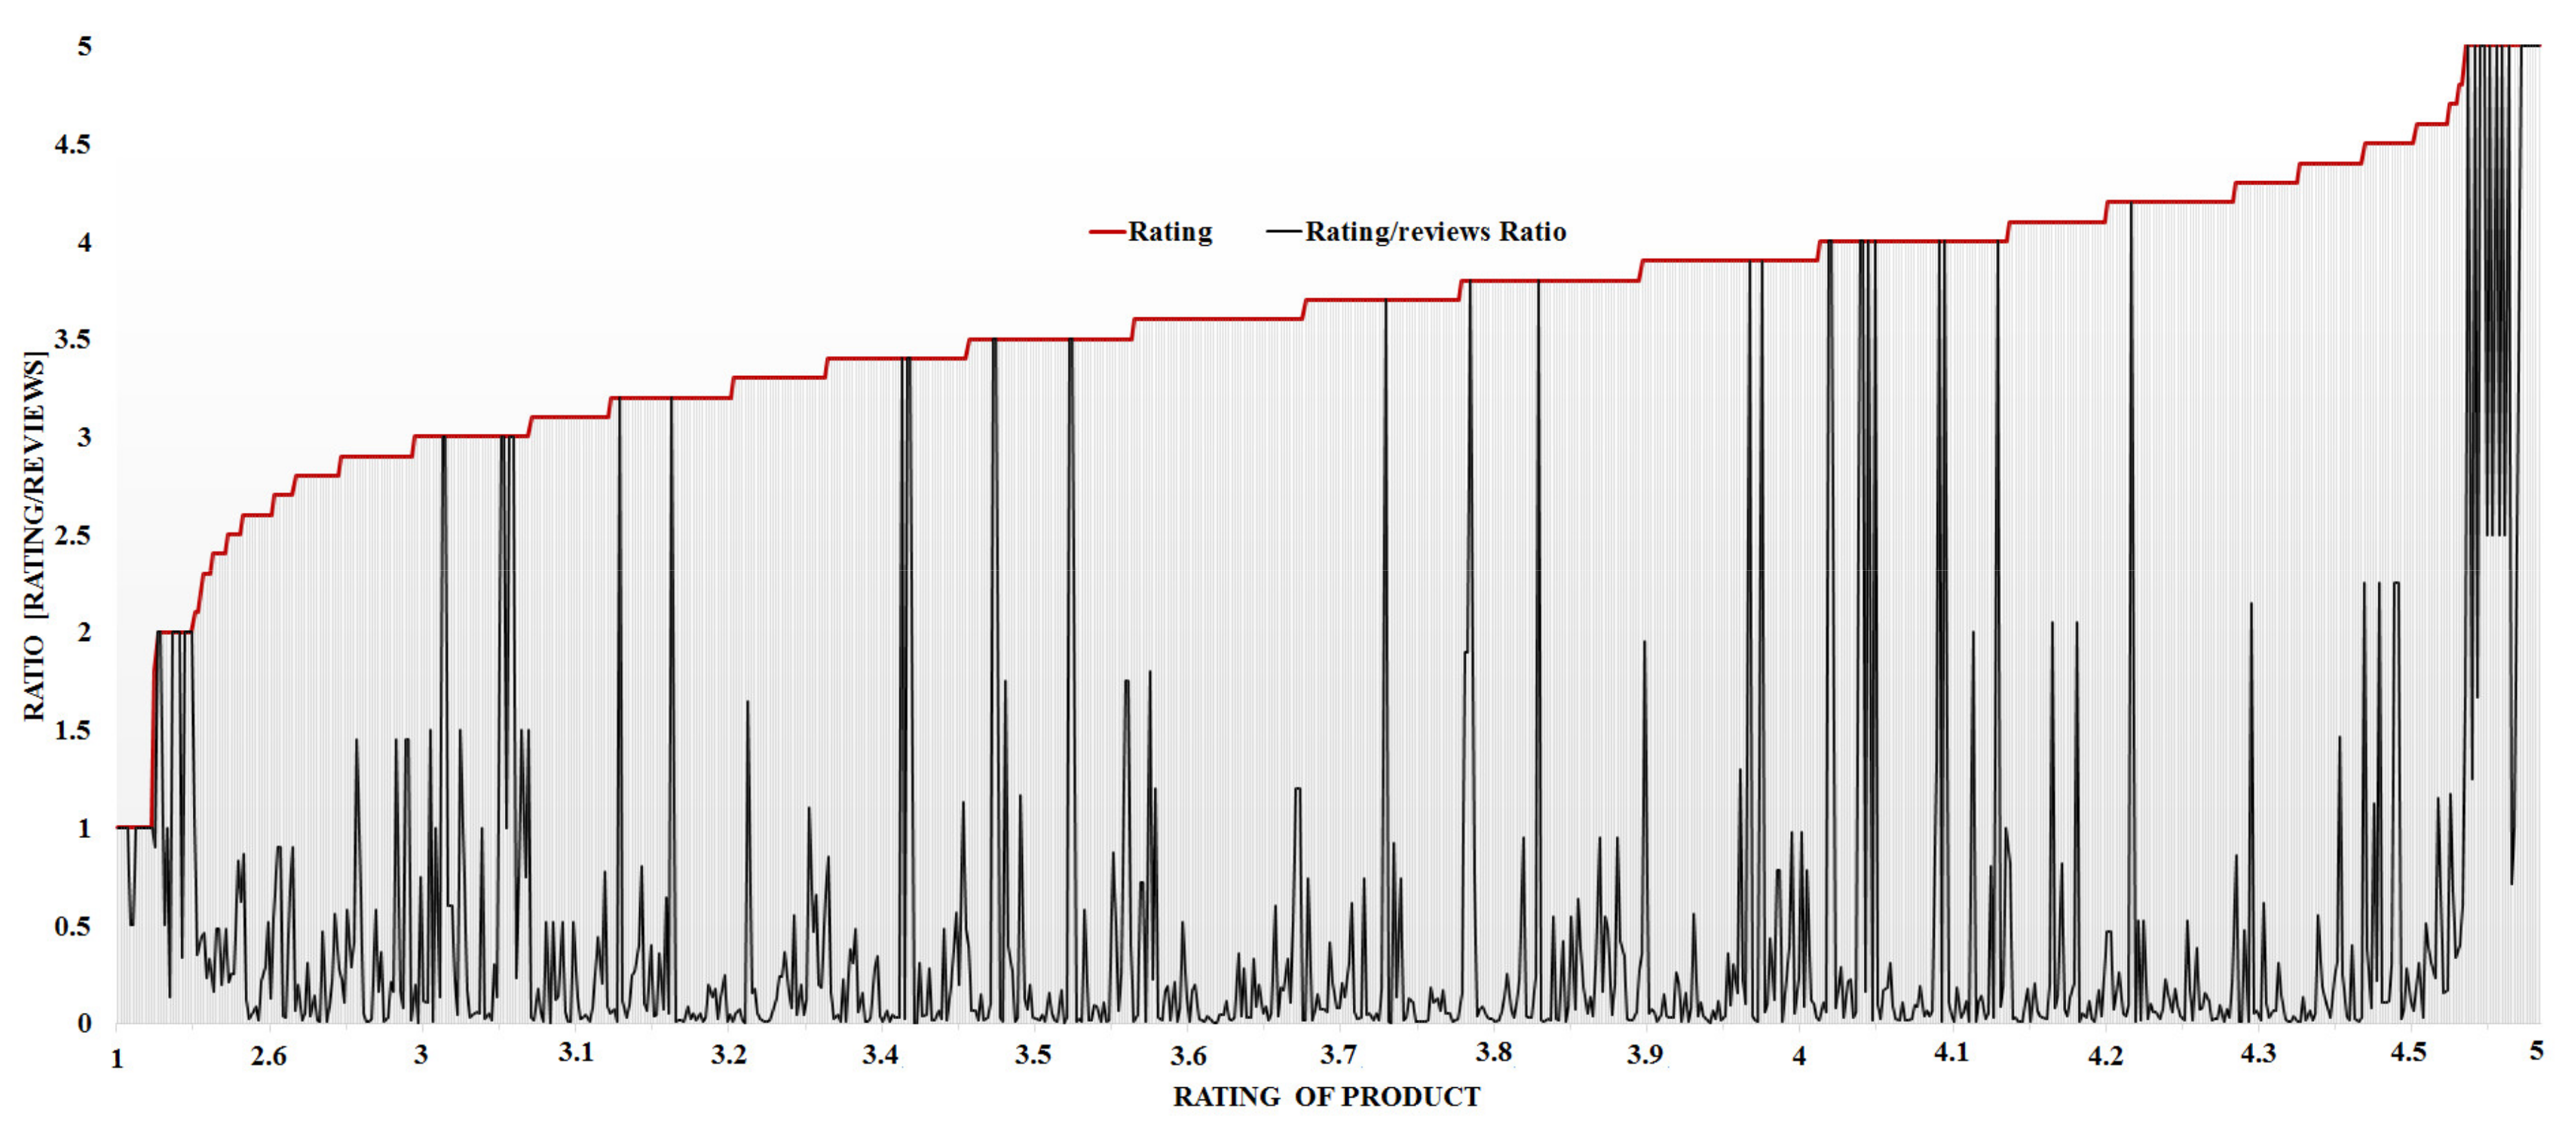
Figure 9.
Product wise evaluated MRR value as per product rating for all cellphones in the market.
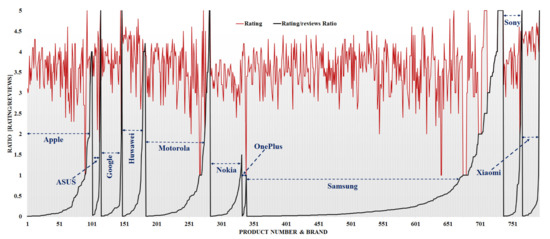
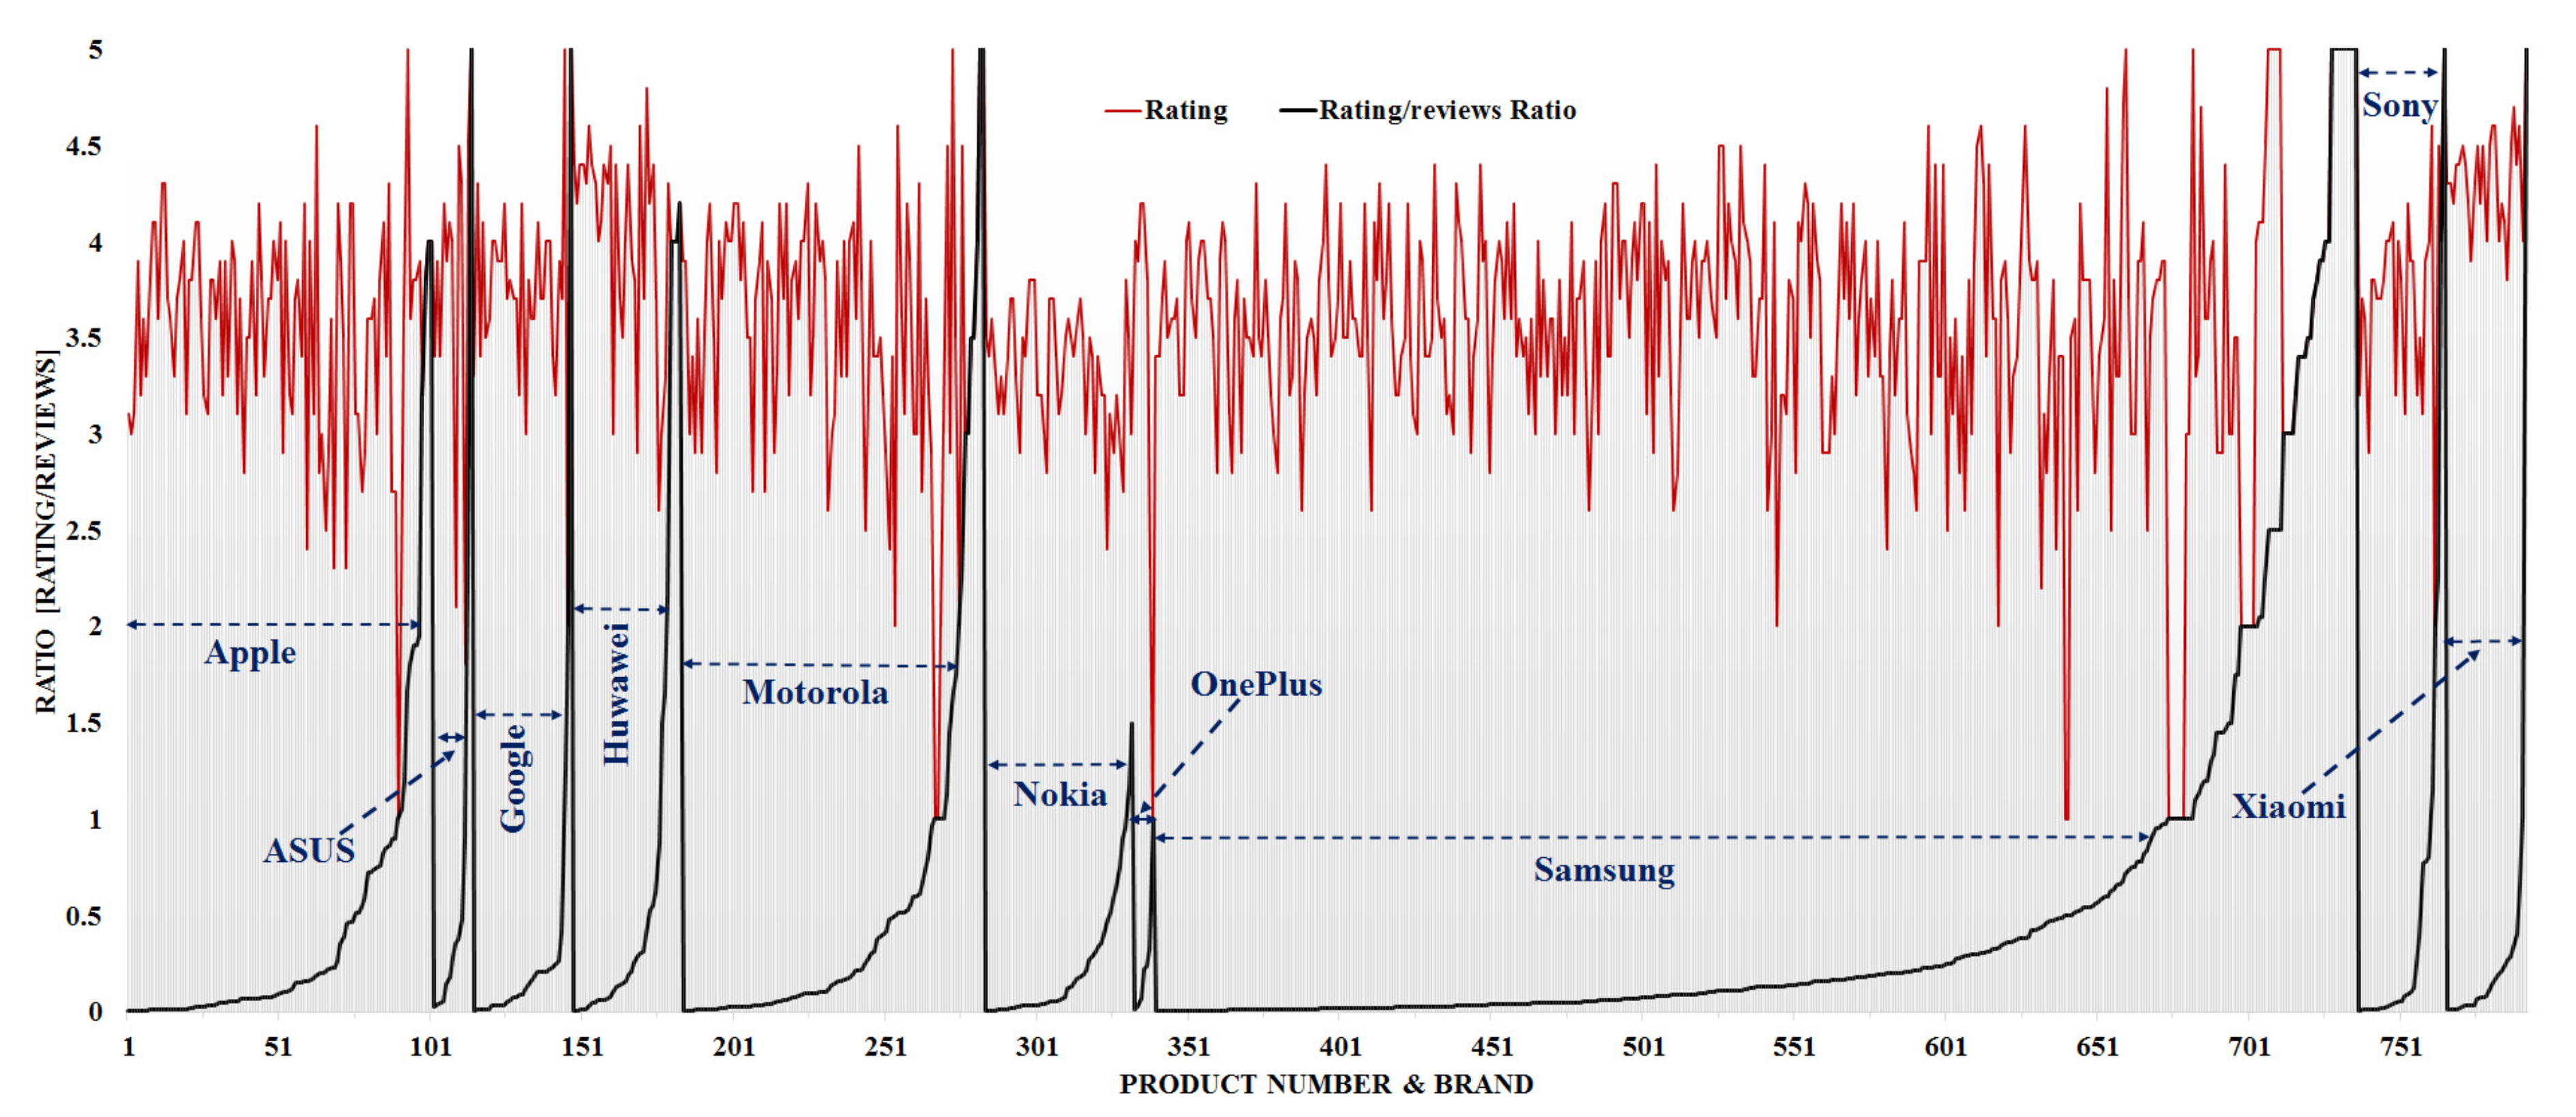
Figure 10.
Brand wise evaluated MRR value as per product rating for all cellphones in the market.
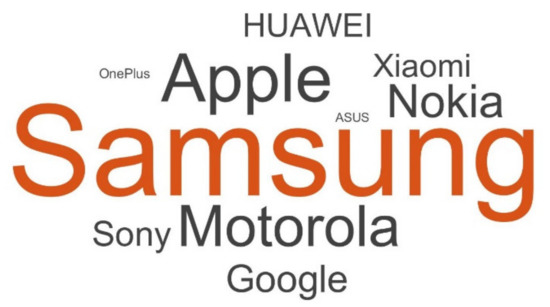
Figure 11.
Word-cloud plot analysis for brand and its total number of reviews.
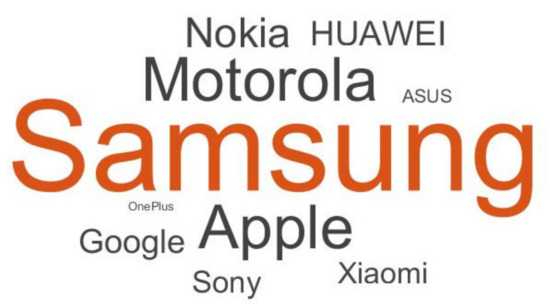
Figure 12.
Word-cloud plot analysis for brand and its total number of items.
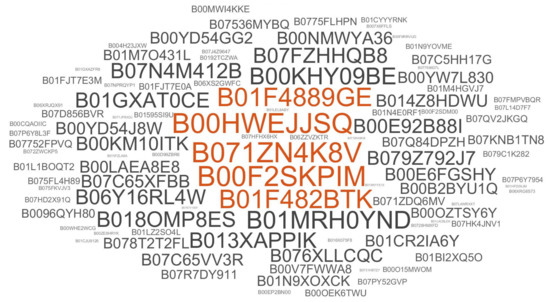
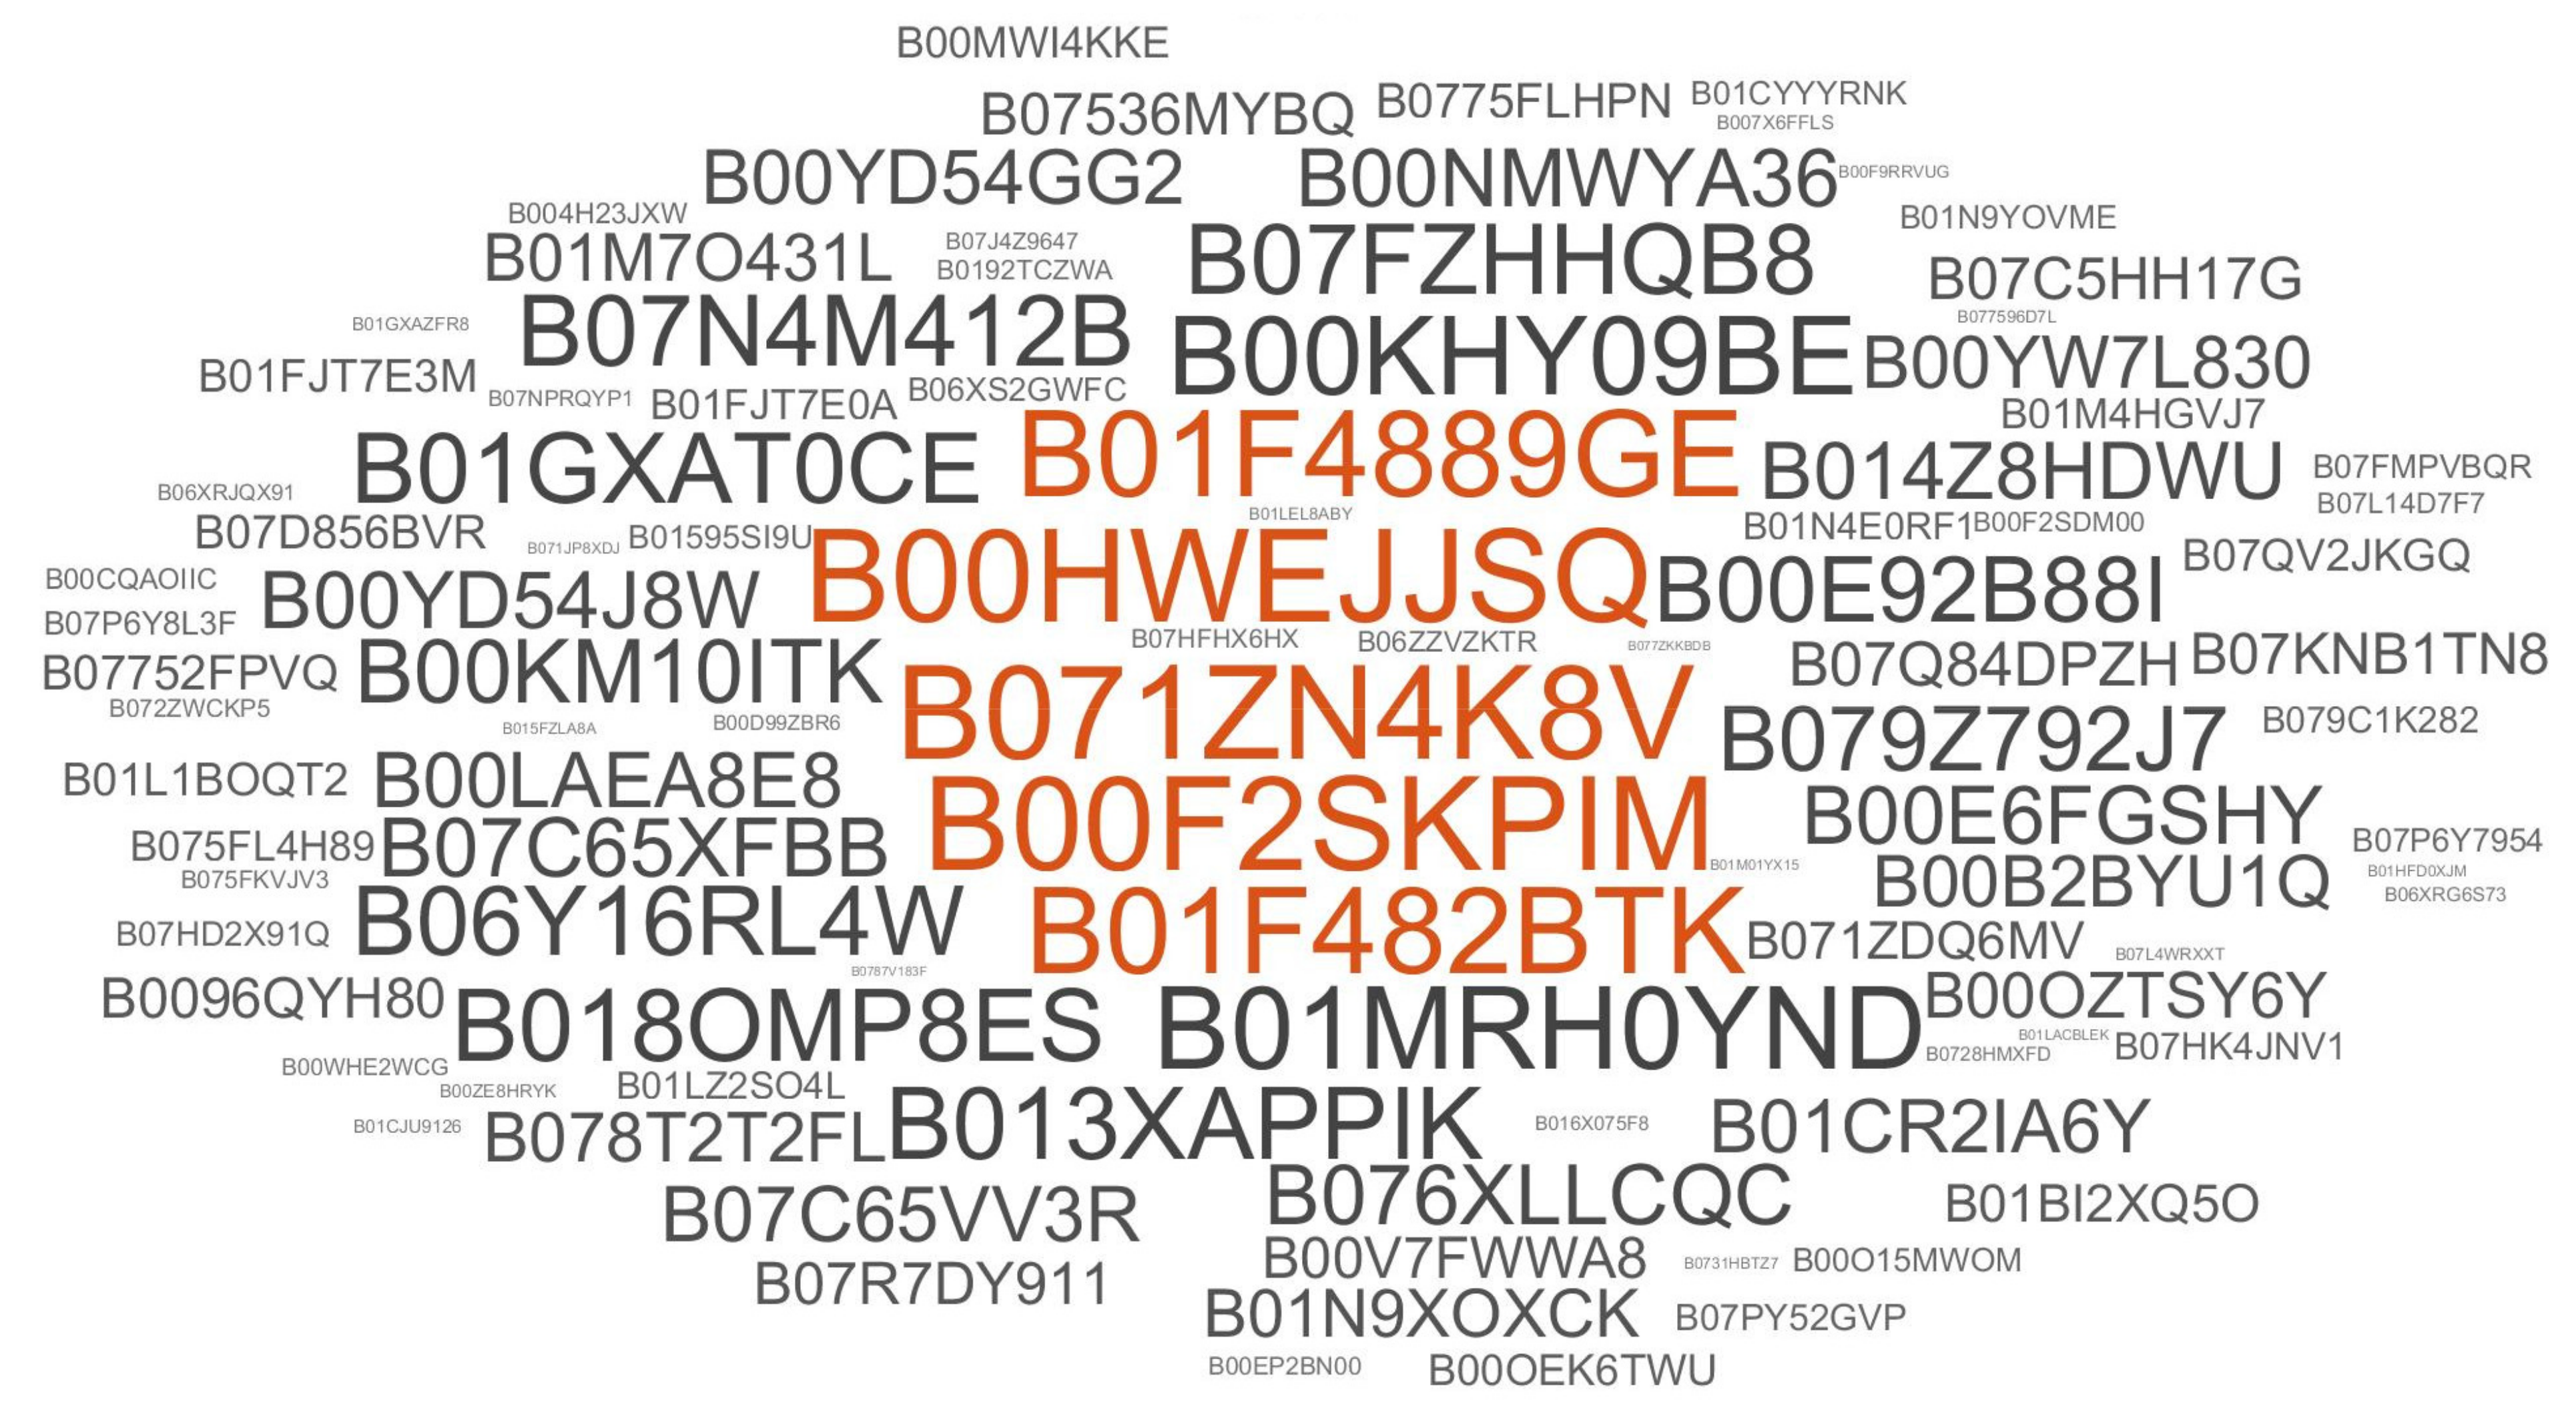
Figure 13.
Word-cloud plot analysis for products and their total number of reviews.
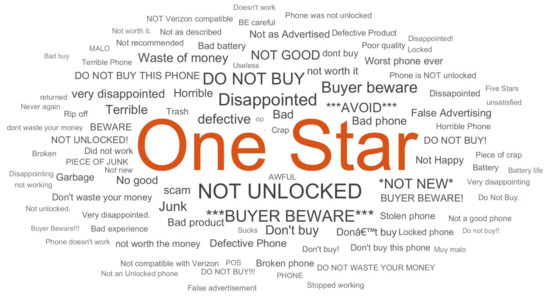
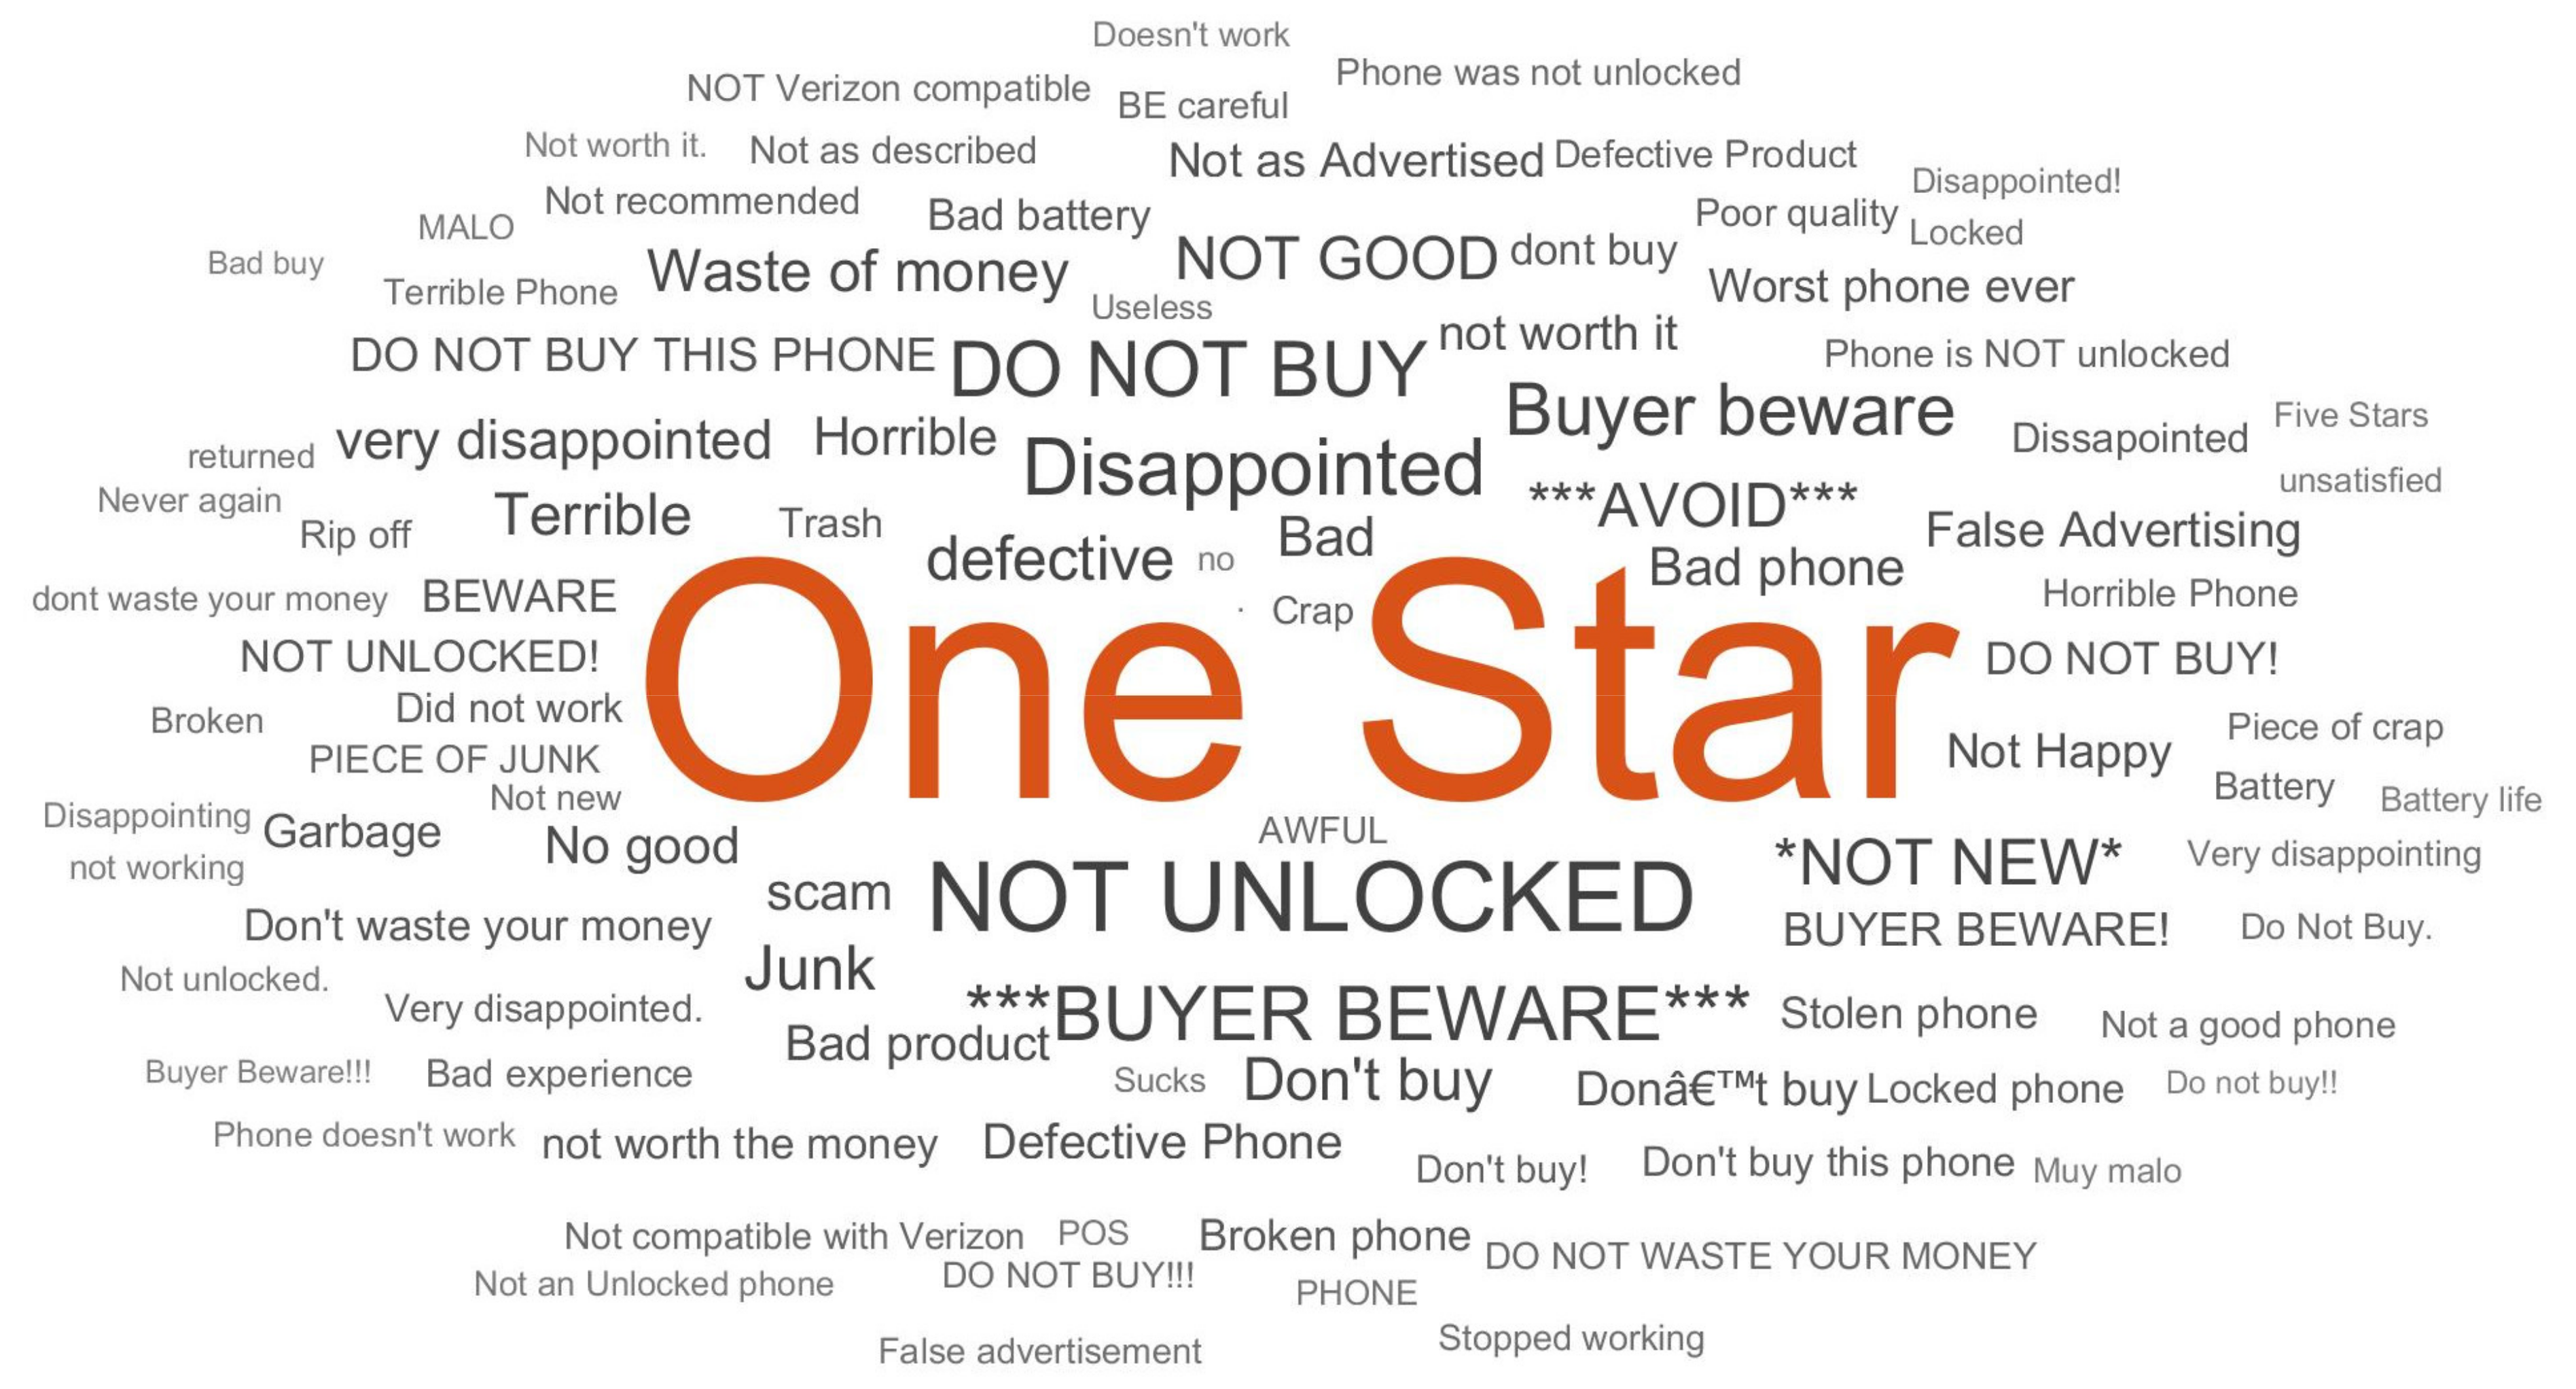
Figure 14.
Word-cloud plot analysis for words with review score one.
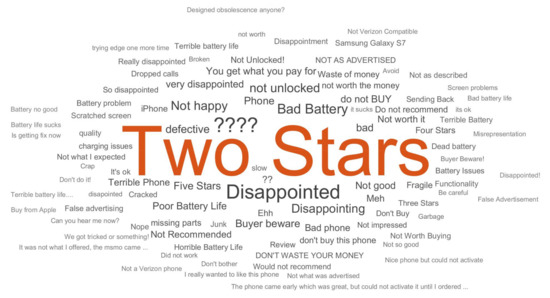
Figure 15.
Word-cloud plot analysis for words with review score two.
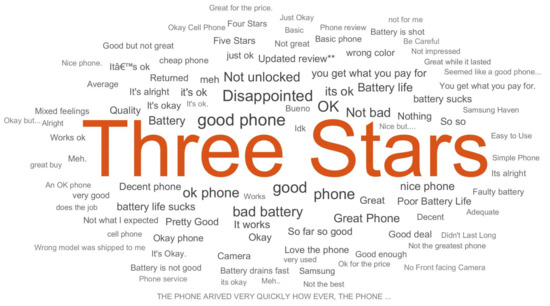
Figure 16.
Word-cloud plot analysis for words with review score three.
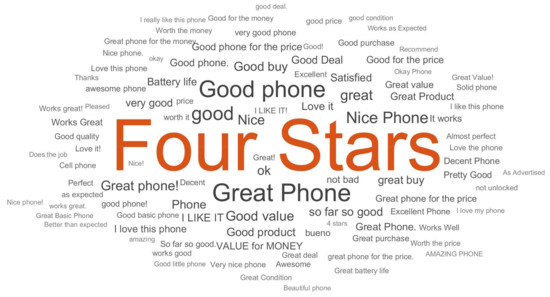
Figure 17.
Word-cloud plot analysis for words with review score four.

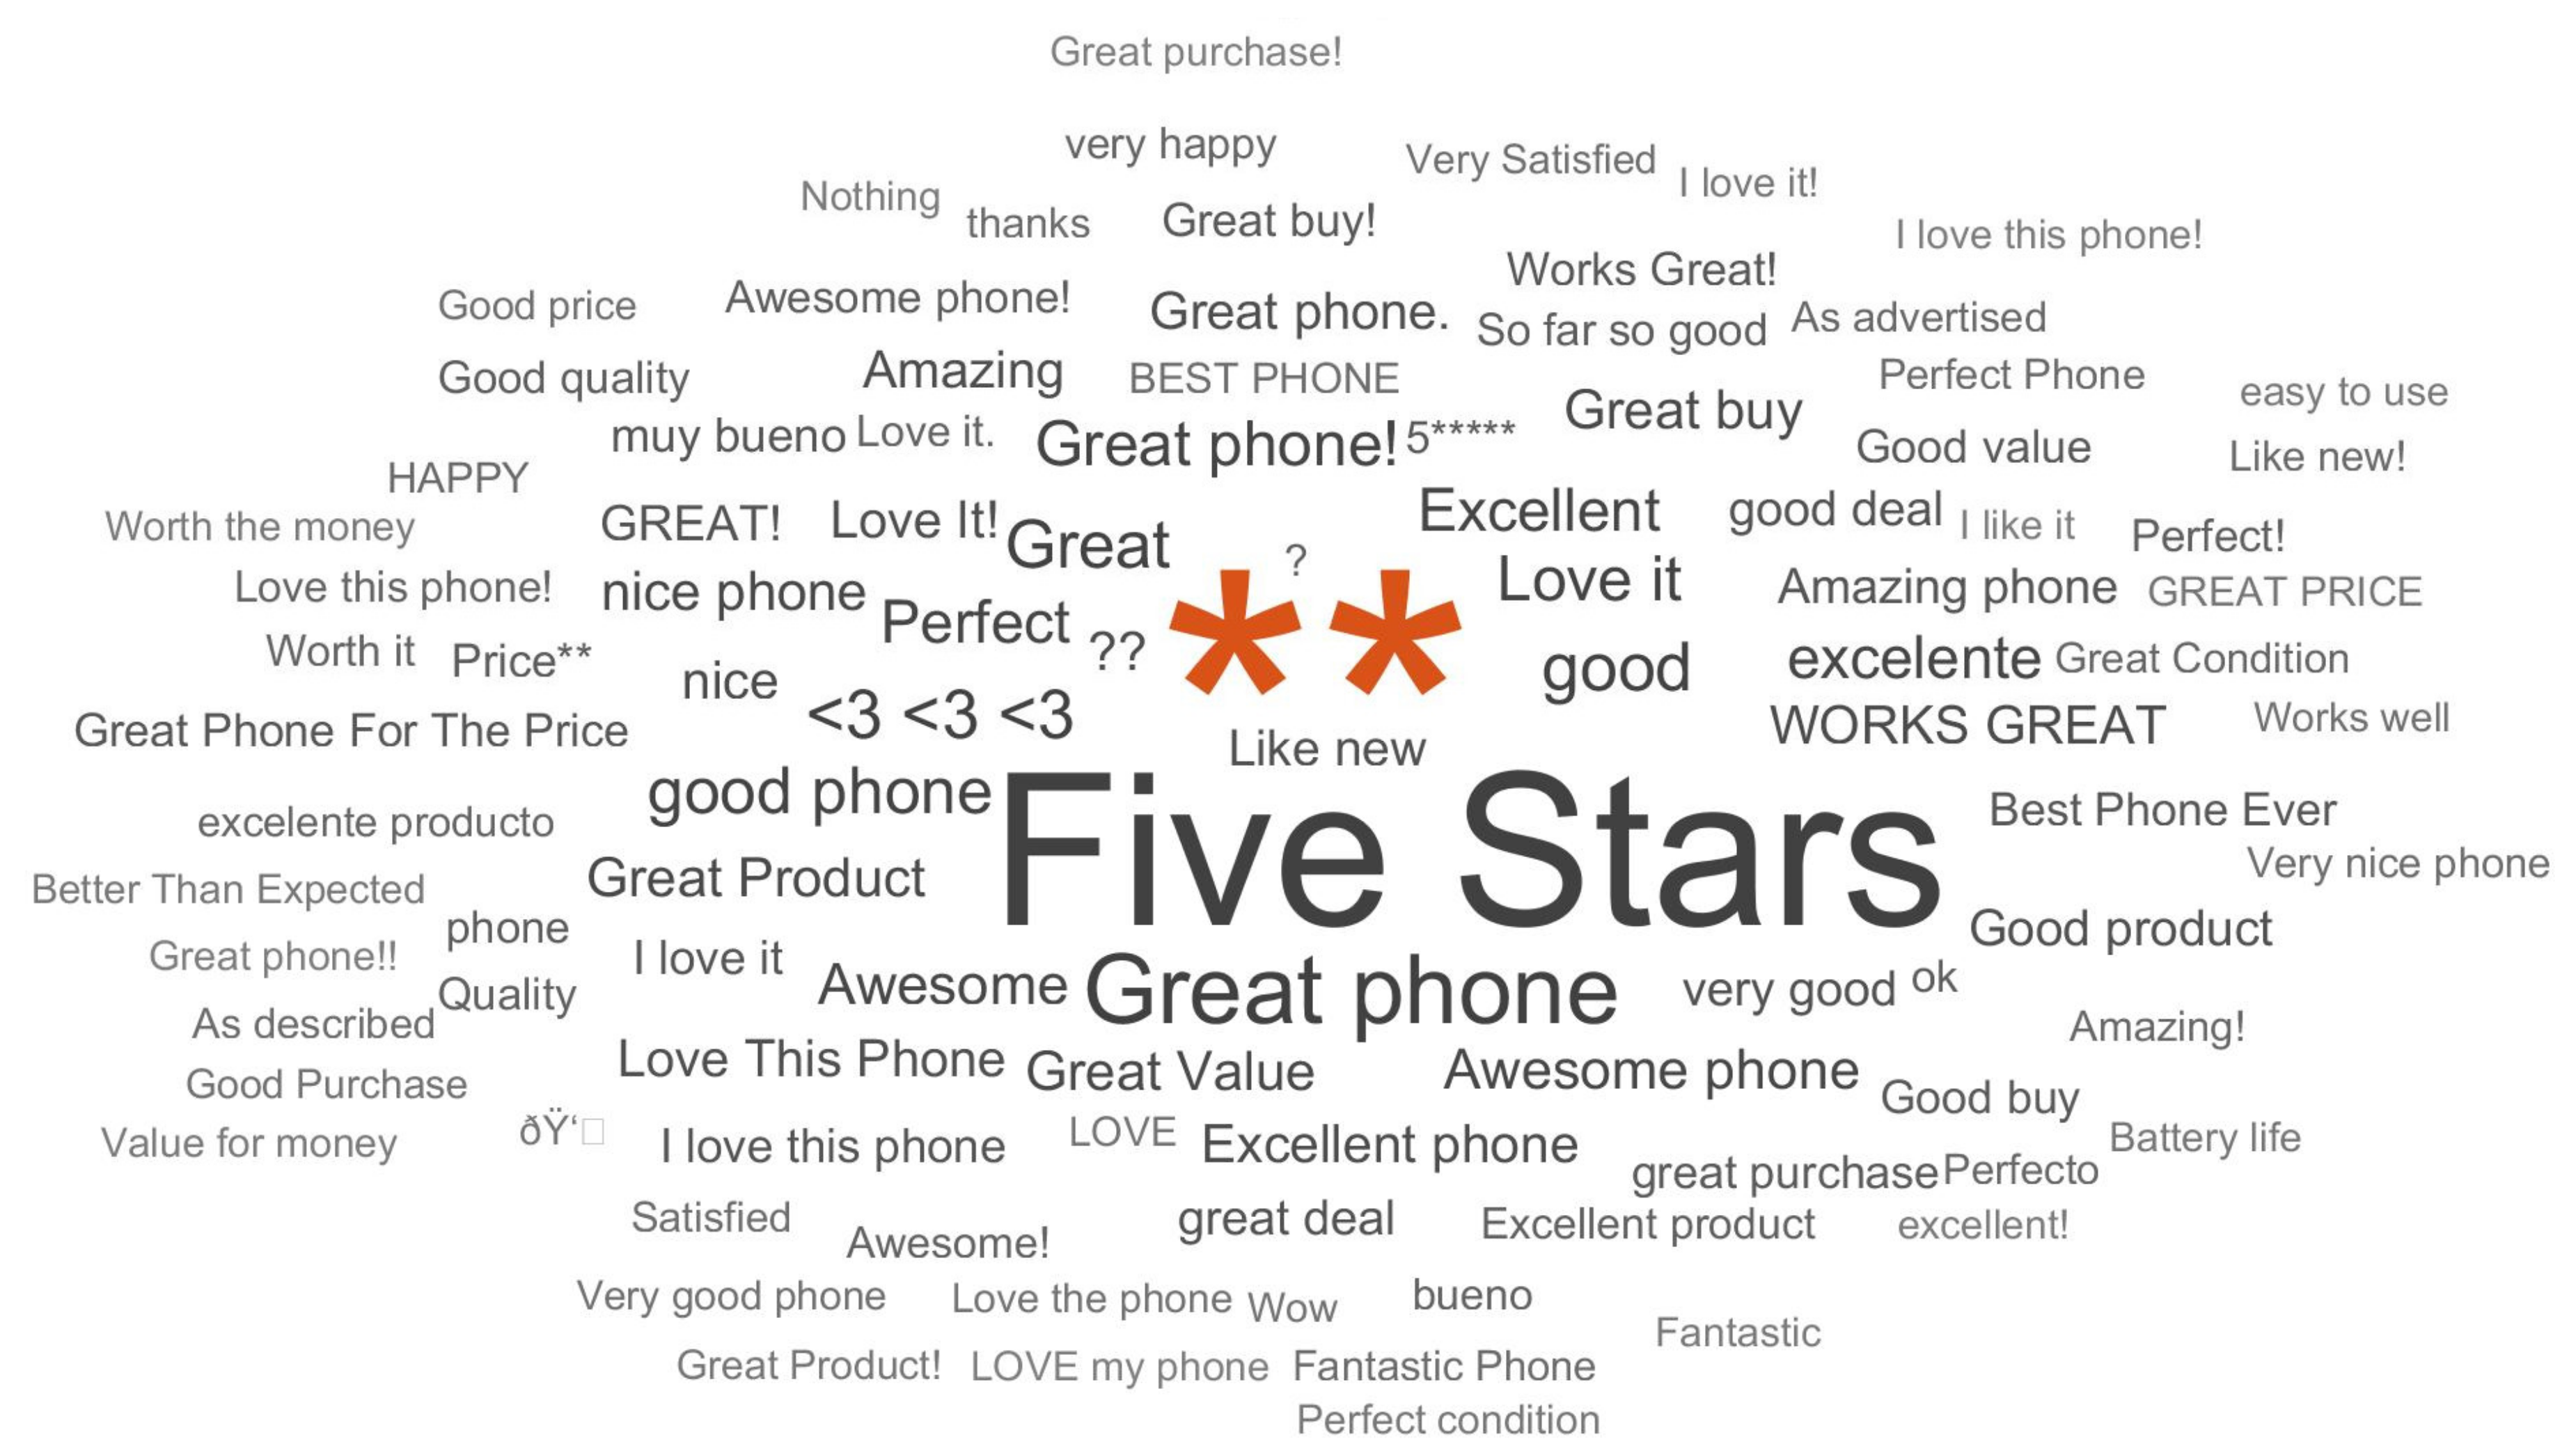
Figure 18.
Word-cloud plot analysis for words with review score five.
The MMR value represents the significance/importance of the brand/product, which is liked by the customer at a higher priority in the market. Figure 9 and Figure 10 represent the MMR analysis of the product and brand, respectively. Figure 9 shows the product-wise evaluated MRR value as per product rating for all cellphones in the market, whereas Figure 10 shows the brand-wise evaluated MRR value as per product rating for all cellphones in the market.
The word-cloud analysis of the review data based on CCI is very important, representing the graphical representation of the used word in the review/dataset as per its importance level. The higher size level of the word in the plot represents the high importance among all and vice versa. As per the received total number of reviews for cellphone brand, the word-cloud plot analysis is presented in Figure 11, which shows that Samsung has a higher number of the reviews. Similarly, Figure 12 shows the word-cloud plot analysis for brand and its associated total number of items, which recognize that Samsung has a higher number of products in the market. Moreover, Figure 13 shows the word-cloud plot analysis for all products (available in the dataset) and its total number of reviews. The product B00HWEJJSQ (asin) has the highest number of reviews provided by the customers. The word-cloud plots as per the rating of the product are represented in Figure 14, Figure 15, Figure 16, Figure 17 and Figure 18 for the words with review scores one to five, respectively. These figures recognize the exact word utilized by the customer in the review text. For example, the word “One Star” is used repeatedly (maximum time) by the customer to review the product with a rating of “1”. Similarly, the word “Two Stars” is used again and again by the customer in the review-text of the product with a rating of “2”. Generally, “1”, “2”, and sometimes “3” rating products have negative reviews. The utilized word-to-do review can be seen in the word-cloud plots in Figure 14, Figure 15 and Figure 16. Apart from the highlighted word “One Star”, “Two Stars”, and “Three Stars”, there are several key-words (i.e., not unlocked, not new, disappointed, do not buy, avoid, junk, waste of money, defective, not good, terrible, bad battery, bad phone, poor battery life, charging issue, do not recommended, battery life, not great, etc.), which represents the negative responses of the customers (as shown in the word-cloud plot 14–16). With the good responses and rating for the product, the word-cloud plots are represented in Figure 17 and Figure 18 for review scores 4 and 5, respectively. The most frequently used words are “Four Stars” and “**” followed by several good words such as Good phone, great, OK, I like, good value, love it, battery life, excellent, satisfied, great value, price, decent, great deal, value for money, best phone, good product, best phone ever, better than expected, worth of money, works good, works great, wow, etc. (as shown in the word-cloud plots 17–18).
In summary, the following points need to be highlighted for a product review data analysis:
- -
- Seven brands (Apple, ASUS, Google, Motorola, Samsung, Sony, and Xiaomi) have a maximum rating of 5.
- -
- Four brands (Apple, Motorola, OnePlus, and Samsung) have a minimum rating of 1.
- -
- Google cell phone (Google Pixel XL, Quite Black 32GB) has a maximum number of reviews of 984.
- -
- The brand that has the maximum number of reviews is Samsung with 41,660.
- -
- The Samsung brand has a maximum number of items in the market with 397.
- -
- The maximum value of the “rating/review” ratio tells about the good brand that can be recommended. The following brands have maximum ratios: Samsung, Sony, Xiaomi, ASUS, Motorola, and Google.
In the machine learning-based data analysis of CCI customer reviews for a product/brand to identify the positive and negative responses and/or recommendation using available keywords/words in the review text dataset, the NN model is implemented. The developed NN model for classification of the positive/negative responses is shown in Figure 2, and its validation analysis for the training and testing phase is represented in Figure 19, Figure 20, Figure 21, Figure 22, Figure 23, Figure 24, Figure 25, Figure 26 and Figure 27. Figure 19, Figure 20, Figure 21, Figure 22, Figure 23 and Figure 24 represent the NN model performance validation during the training phase, whereas Figure 25, Figure 26 and Figure 27 represent the performance validation during the testing phase of the model.
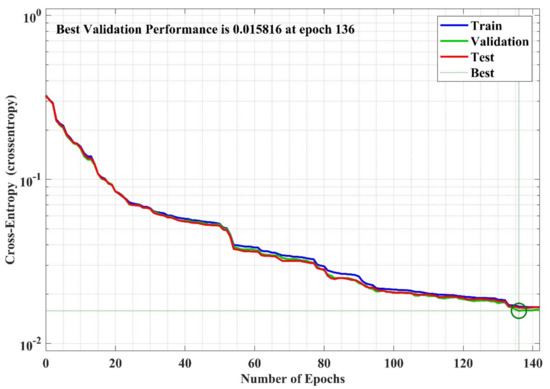
Figure 19.
NN performance analysis plot for the training phase of the model.

Figure 20.
NN error analysis plot for the training phase of the model.
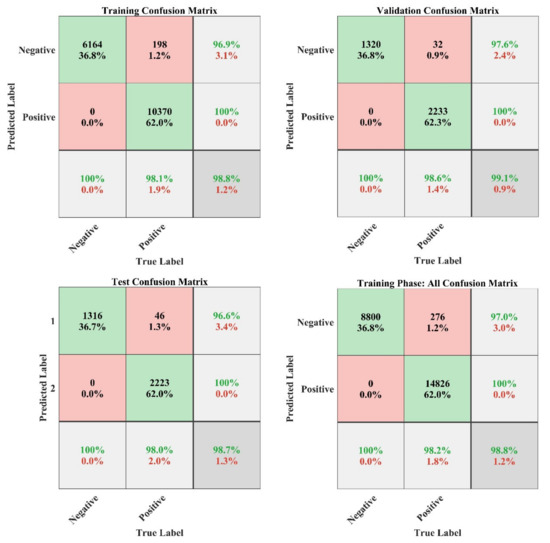
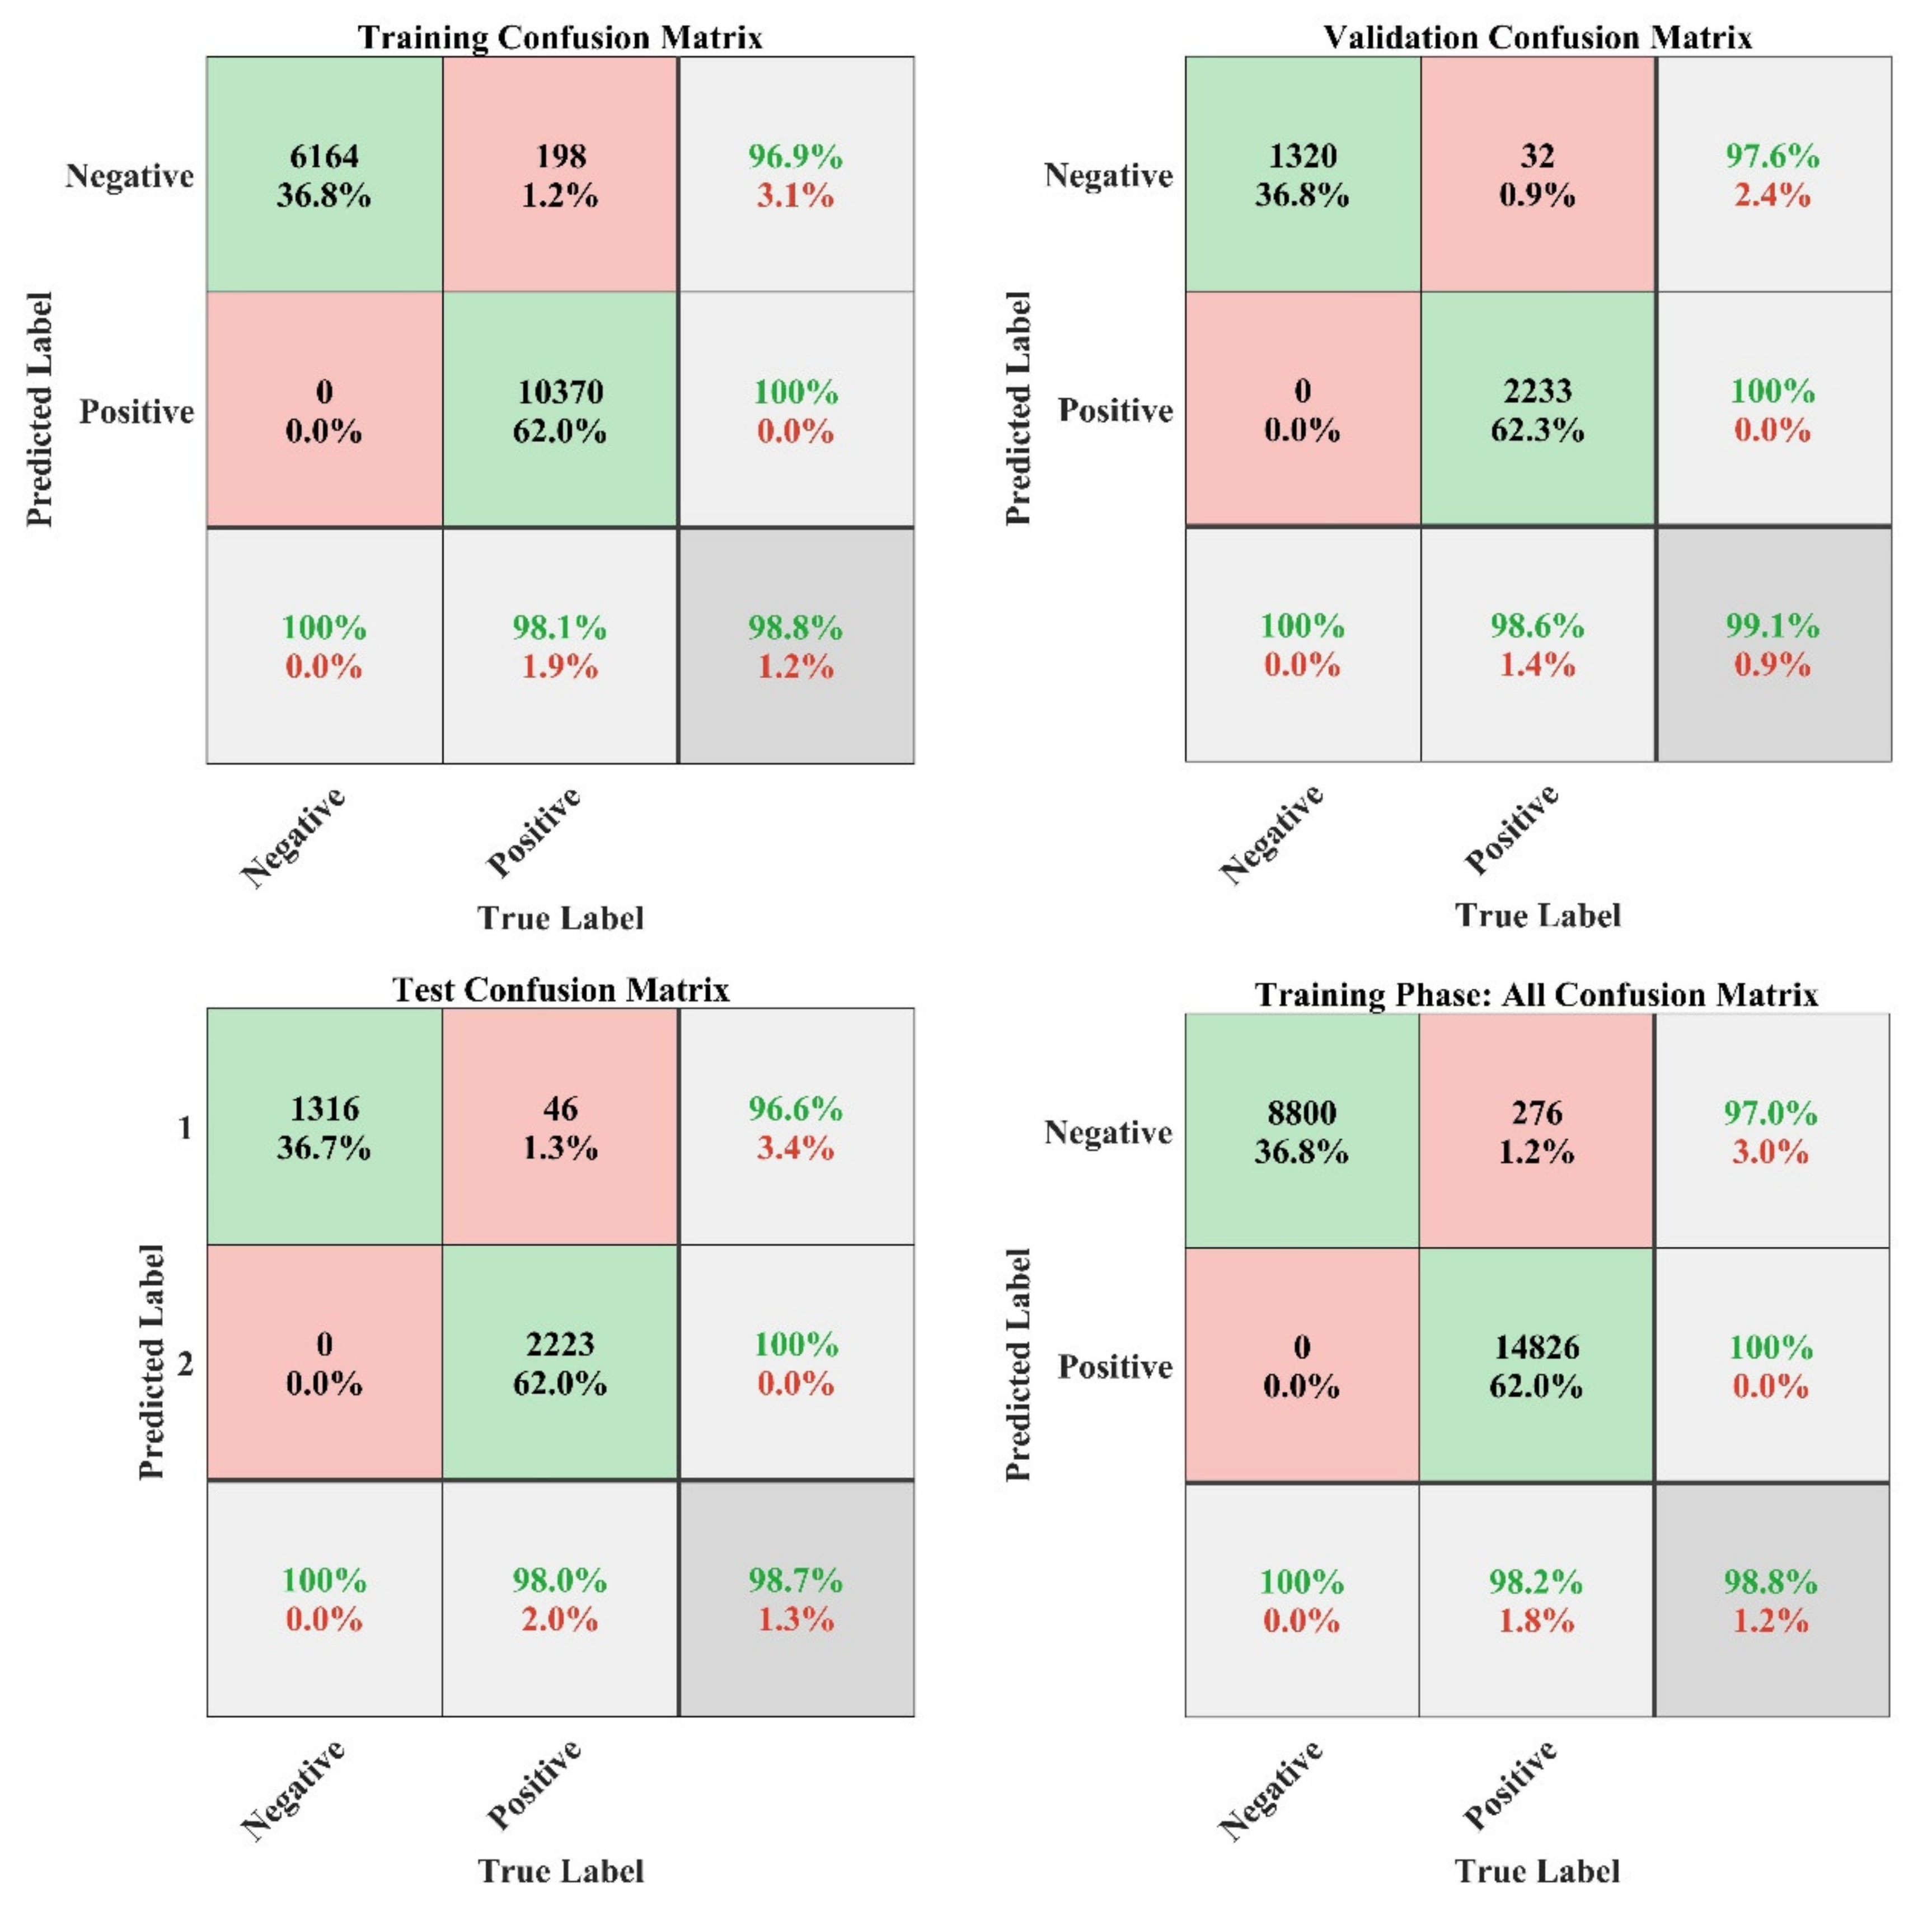
Figure 21.
NN confusion matrix analysis plot for the training phase of the model.
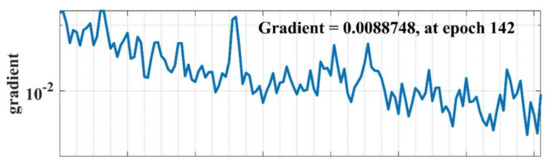
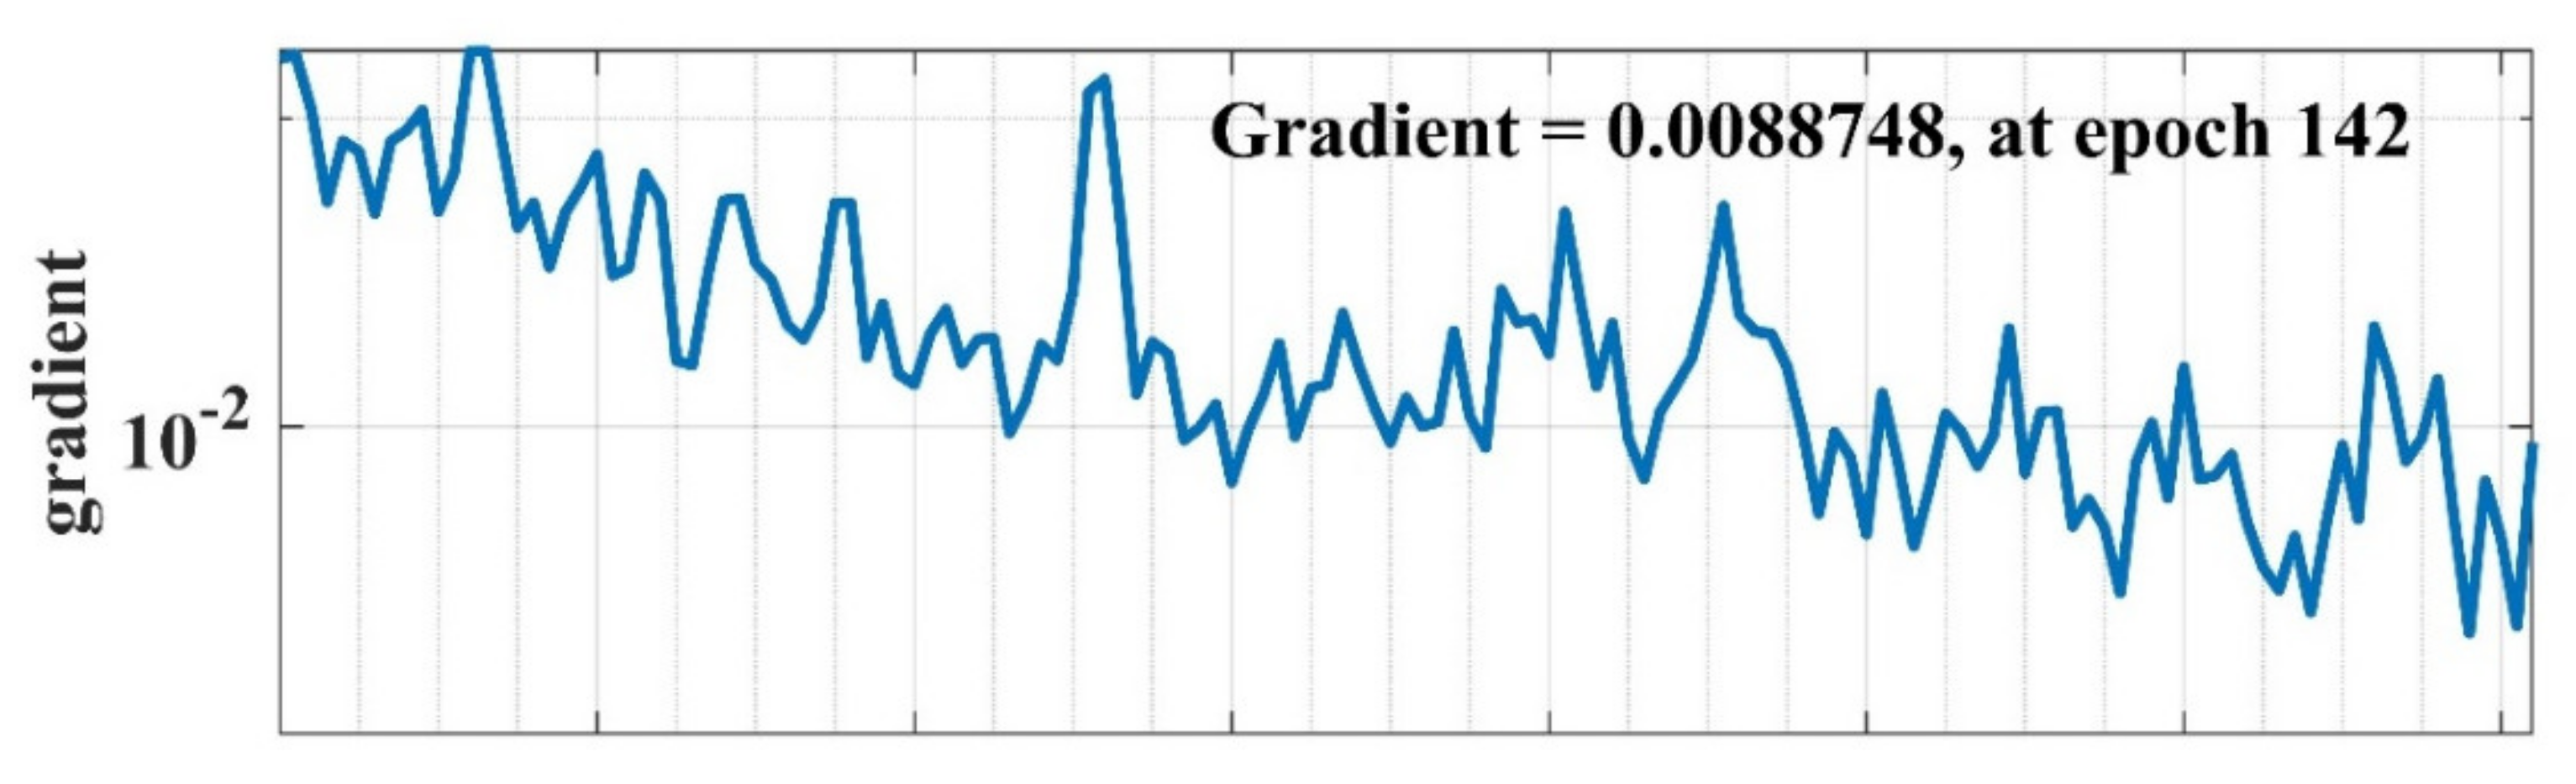
Figure 22.
NN gradient search method learning curve w.r.t. number of epochs.

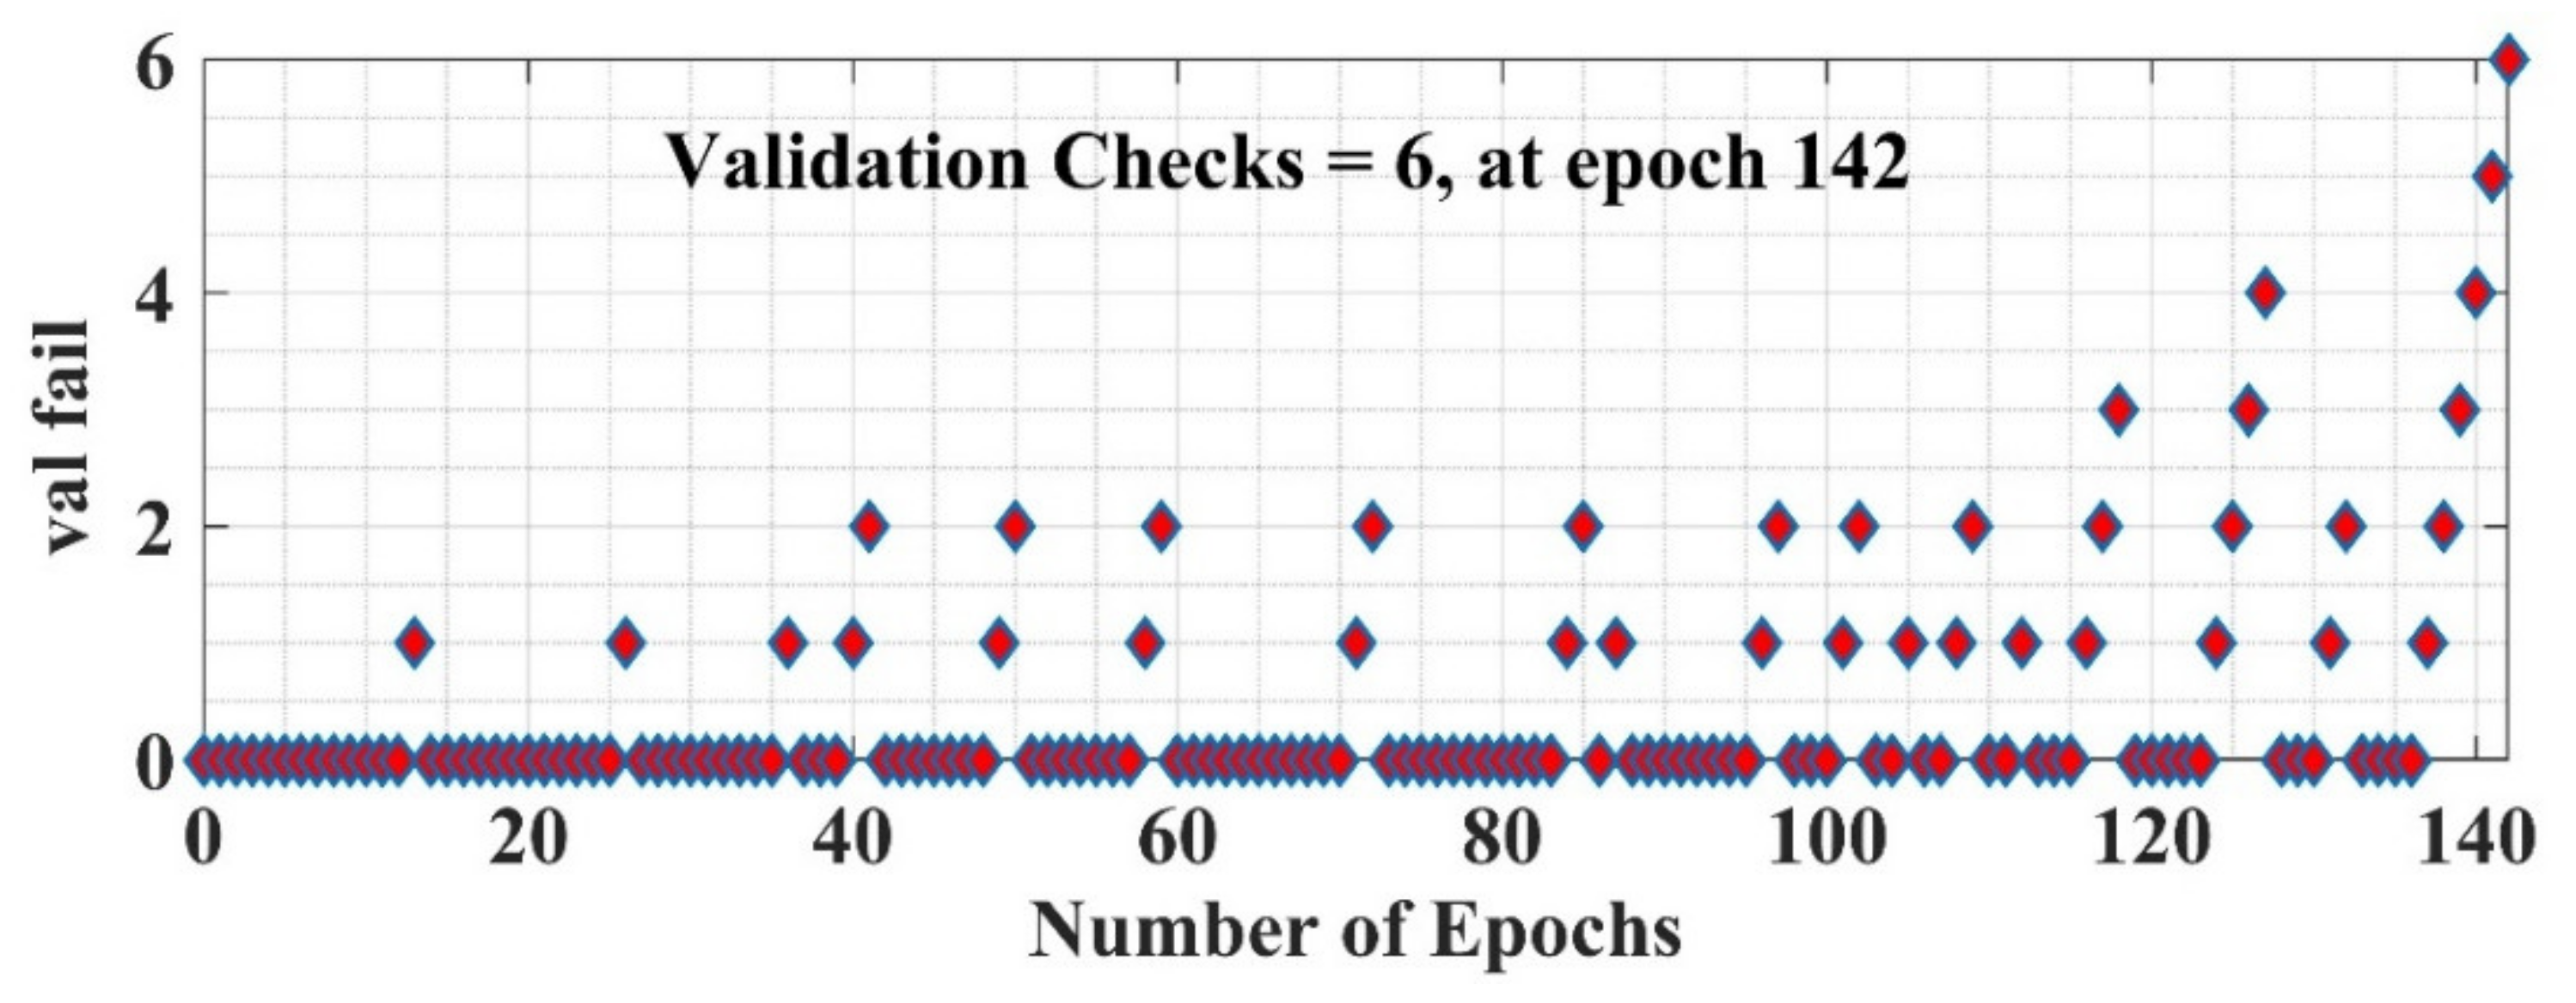
Figure 23.
NN’s validation curve w.r.t. number of epochs.
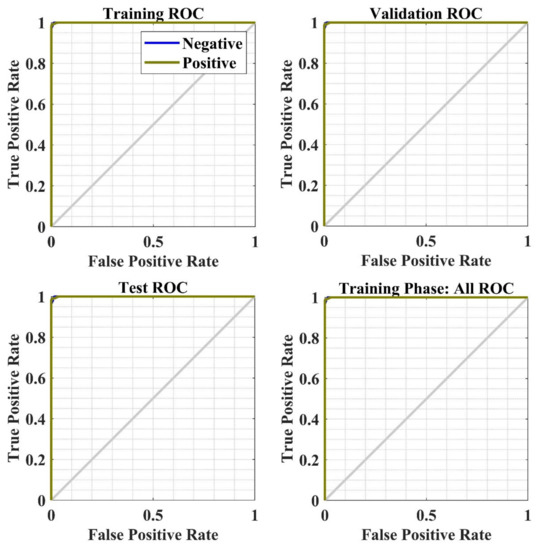
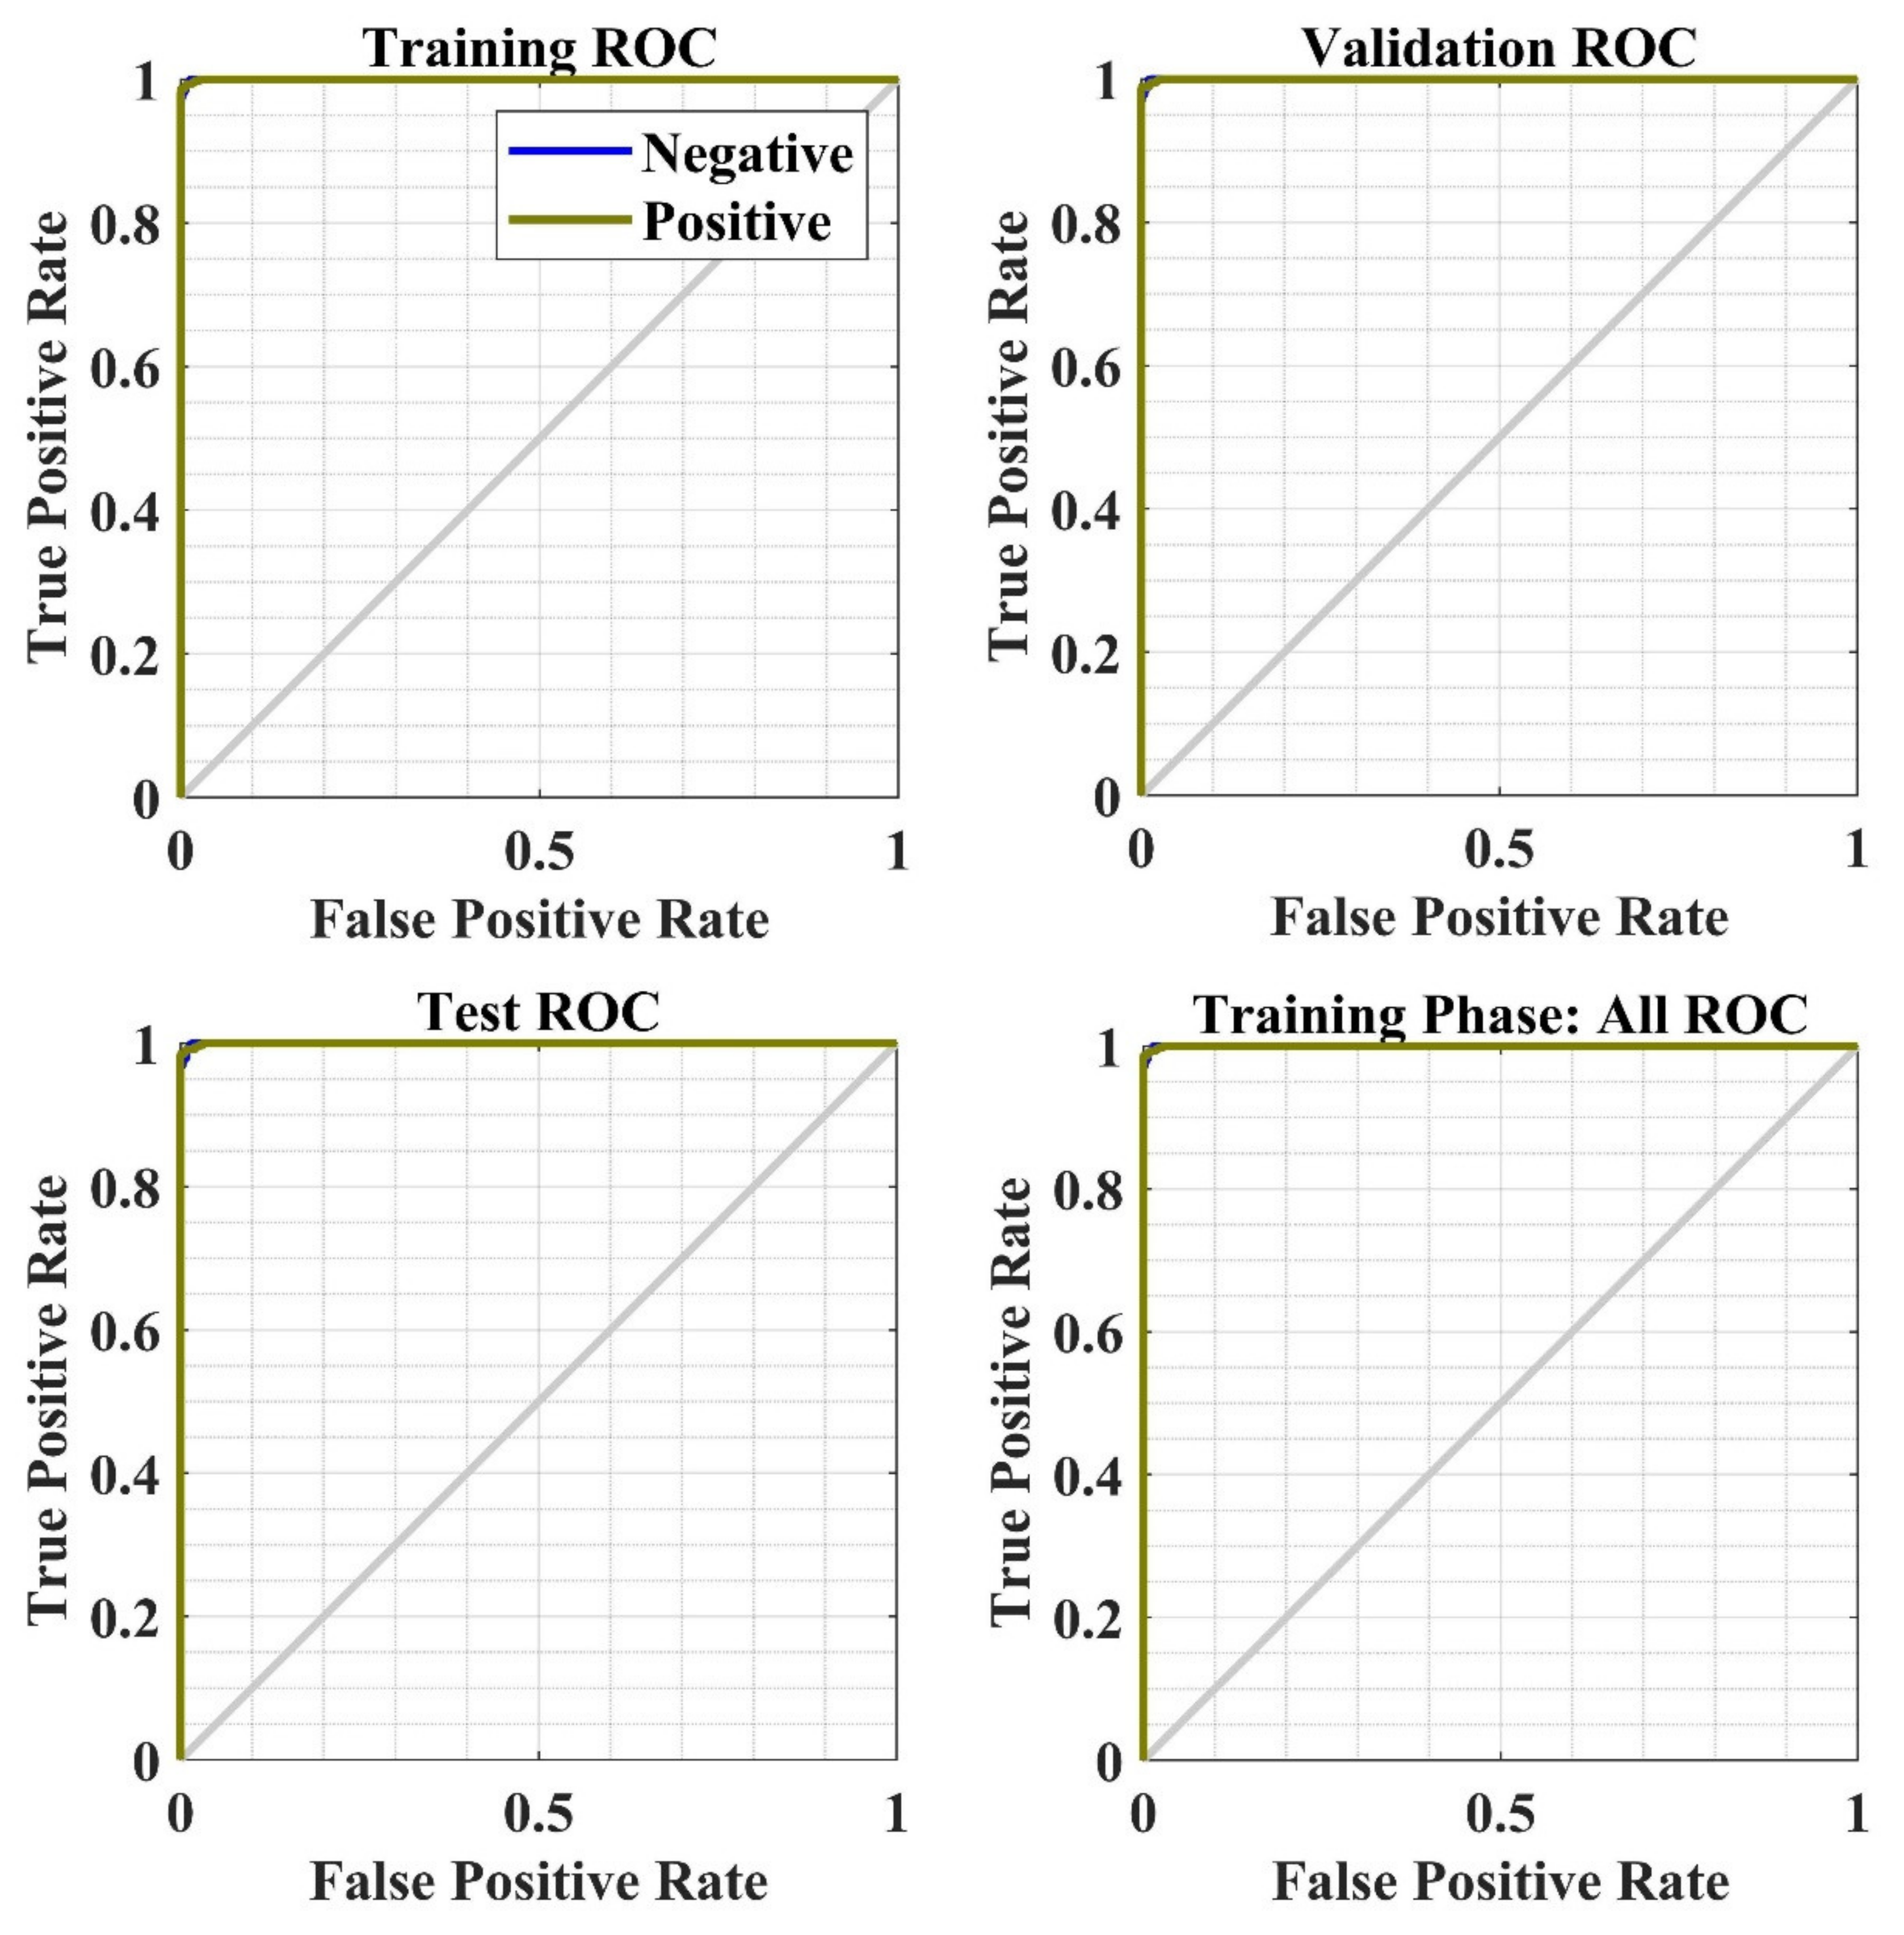
Figure 24.
NN’s ROC curve w.r.t. the false-positive rate and true-positive rate for the training phase.
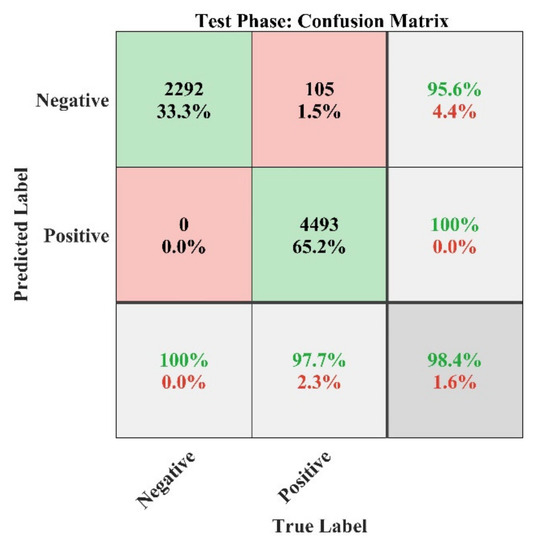
Figure 25.
NN confusion matrix analysis plot for the testing phase of the model.
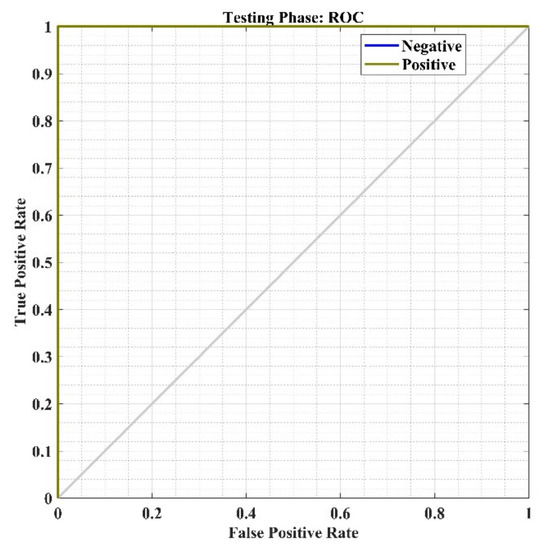
Figure 26.
NN’s ROC curve w.r.t. the false-positive rate and true-positive rate during the testing phase.
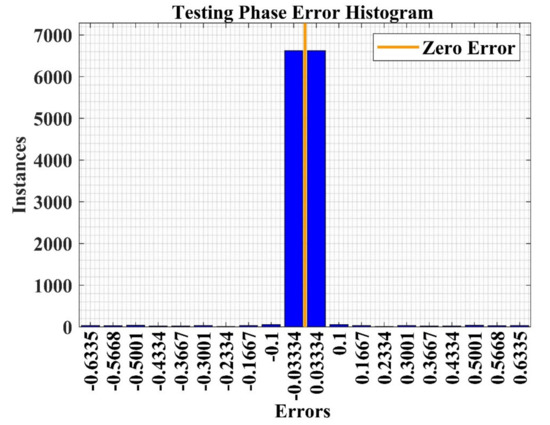
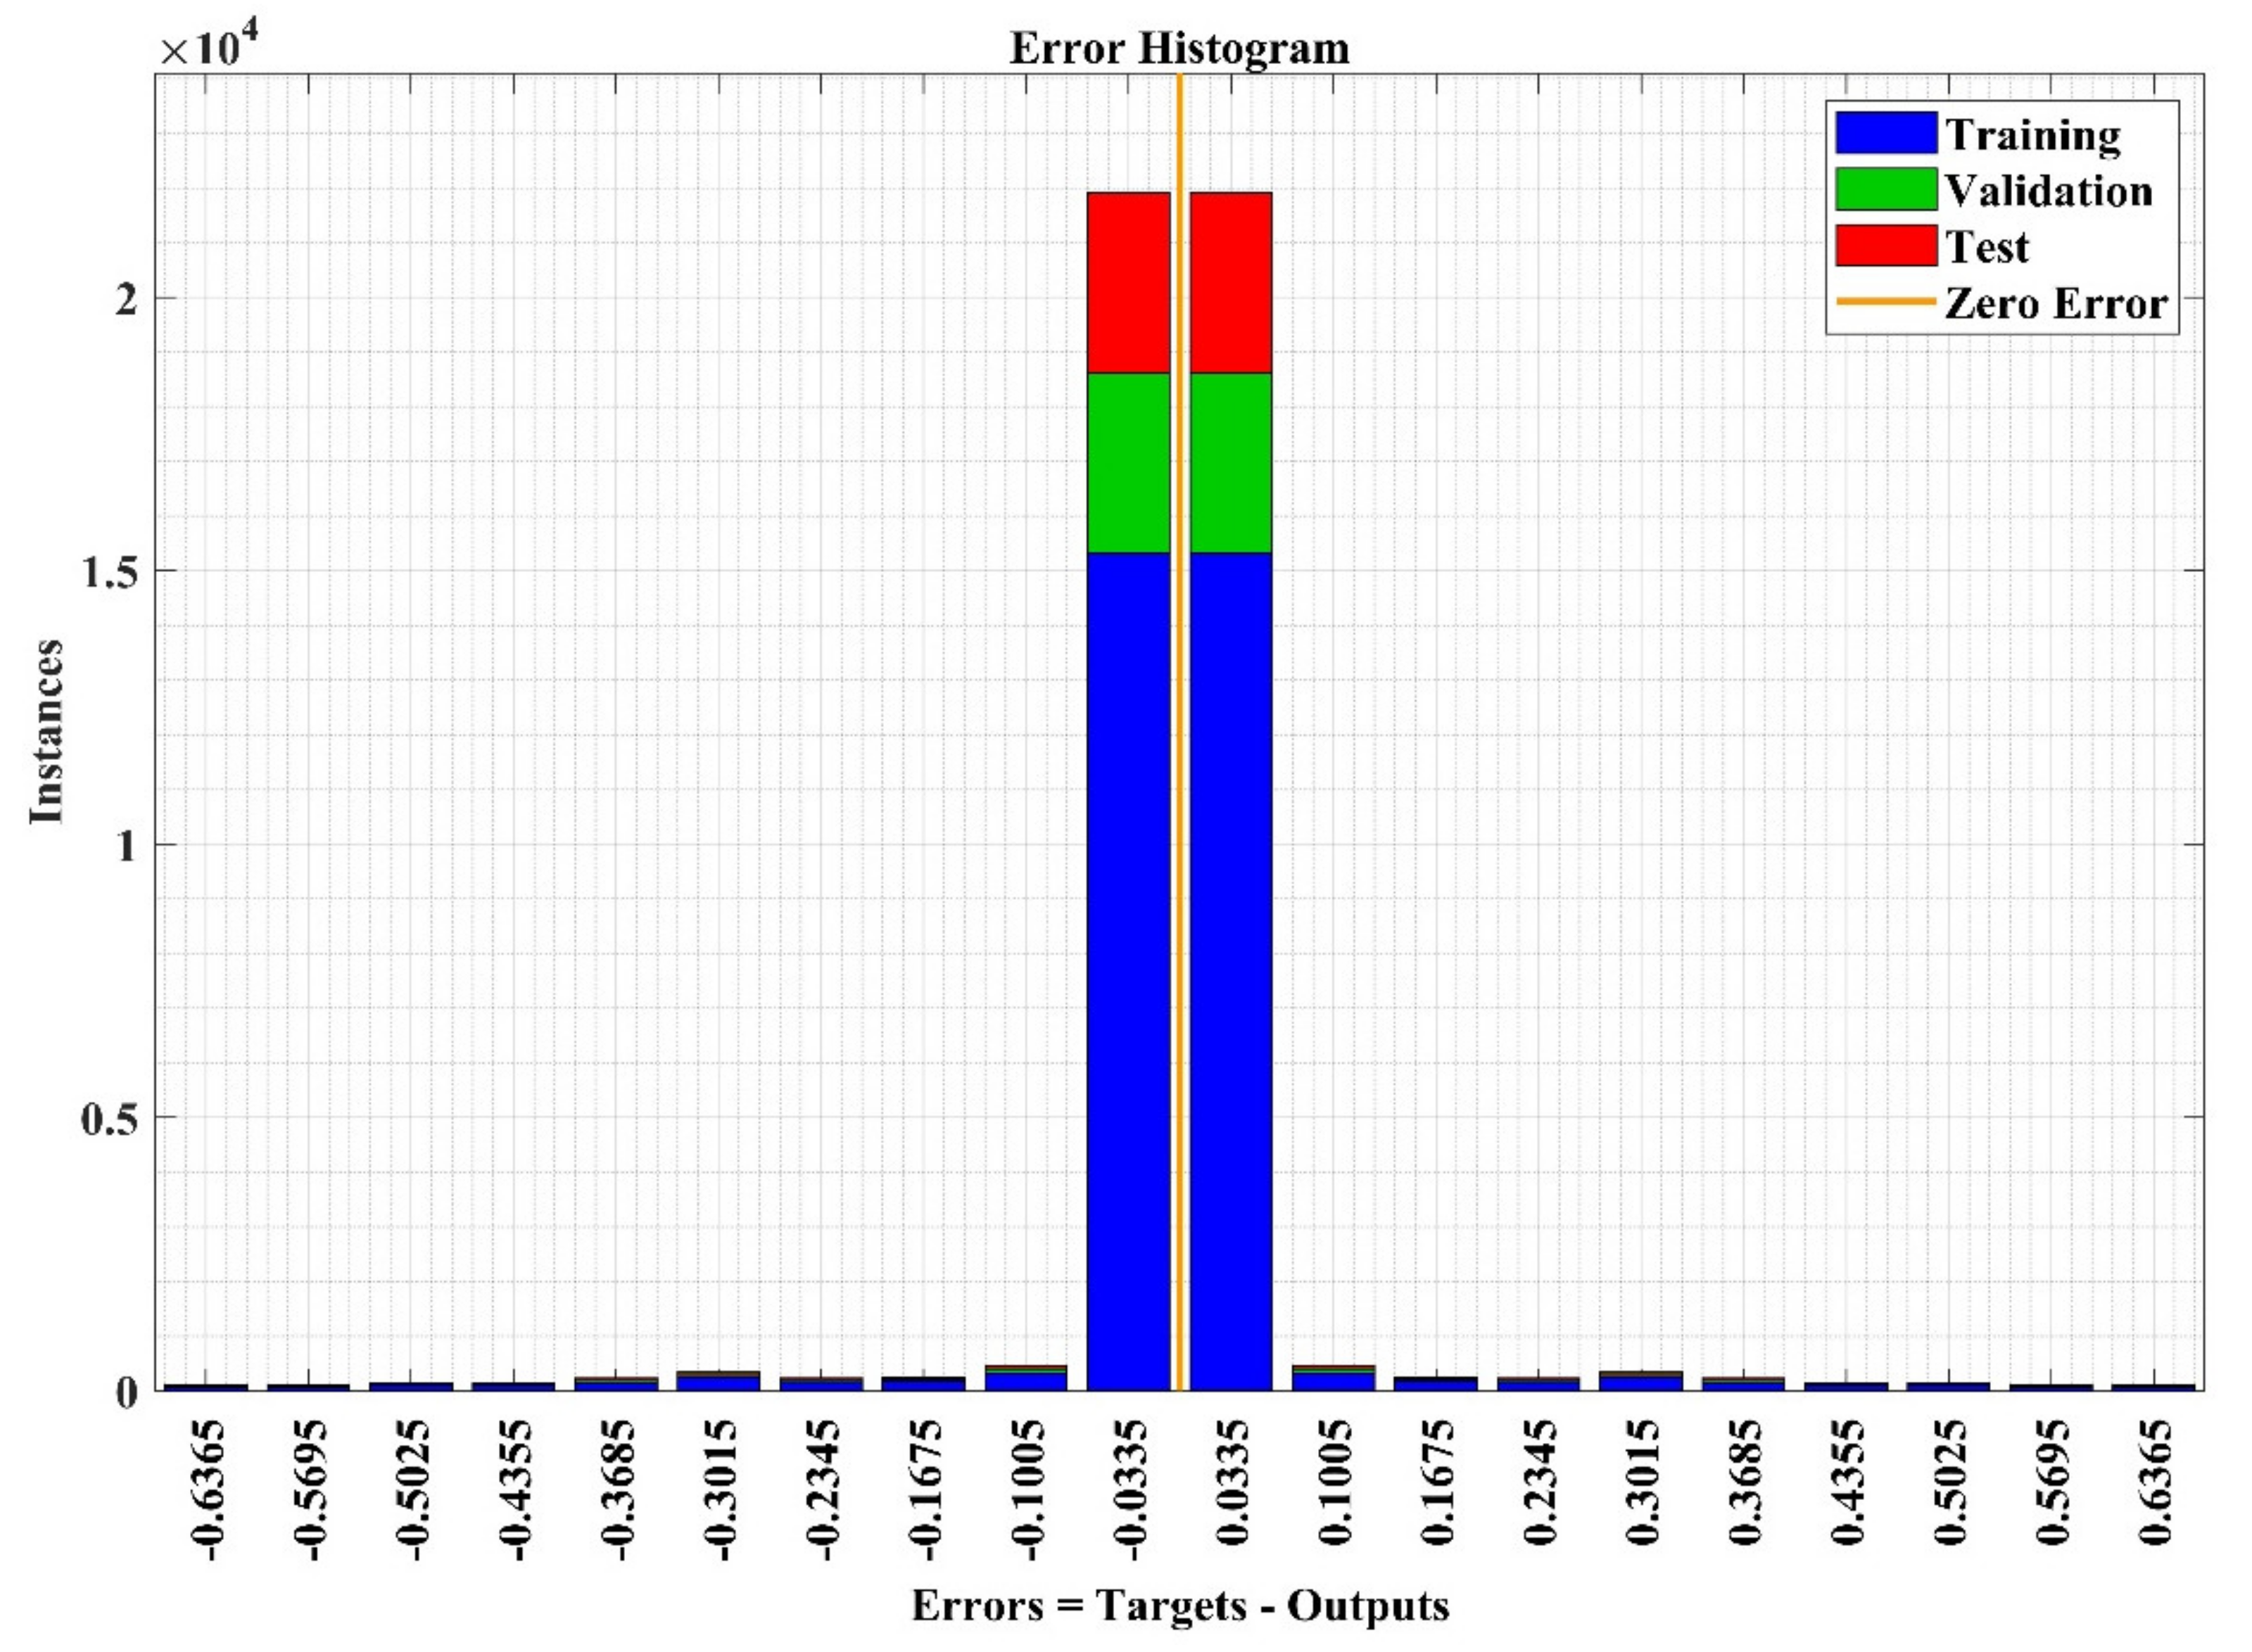
Figure 27.
NN error analysis plot for the testing phase of the model.
The performance analysis plot for the training phase of the NN model is presented in Figure 19, which shows the training error with respect to (w.r.t) the number of epochs. The epoch is the number of training of NN with all training datasets. In this case study, the total number of epochs is 142. Most of the time, the error value reduces w.r.t increase in epochs, but it may also be increased due to the overfitting of the model. In this case, the error is decreased, obtaining the best performance of 0.015816 at 136 epochs.
The error histogram plots the error value between true and predicted values after training the model, which indicates the level of difference. The error histogram analysis plot for the training phase of the NN model is represented in Figure 20 with 20 bins. The bins are the number of utilized bars in the histogram to represent the error value. In this case study, most of data samples (at the y-axis) are lies near to zero-error line (orange color) (at the x-axis), which shows high-performance validation of the model.
The summary of the predicted results from NN model is represented in Figure 21 in the form of a confusion matrix obtained during the training phase of the model. In this Figure, the number of incorrect classifications (IC) and correct classifications (CC) are summarized along with the false classifications of each class (evaluated by Equation (11)). In this case study, the overall classification accuracy of the model is 98.8% during the training phase. Moreover, the plot training state shows the training statistics of the model, which is shown in Figure 22 and Figure 23 for gradient search-based learning curve and validation check, respectively.
The receiver operating characteristic (ROC) is another way to measure the performance of the model to show the second level of validation, which plots both true-positive rate (TPR) and false-positive rate (FPR) for each class (as shown in Figure 24 for training phase). Figure 24 shows the high identification accuracy for the review data analysis. The AUC (Area under the ROC Curve) evaluates the performance of classification thresholds.
Finally, the performance plots for the testing phase are represented in Figure 25, Figure 26 and Figure 27 for the performance confusion matrix analysis, ROC curve and error histogram plot, respectively, which shows high identification accuracy of 98.4% with a ROC of 1. The error histogram shows that most of test data lie near to zero error line (shown in orange color), which means the model has high prediction accuracy in the testing phase. Hence, the developed model may be used to analyze the recommendation for other products in the market.
4. Conclusions
The market research and strategy for a product launch are recommended on the bases of customer interviews, call-center data, social media posts, targeted society, and their needs. In this study, a machine learning approach for targeting and recommending a product for project management in the market has been proposed using customer-created information (CCI) such as online reviews. The performance of the proposed approach is validated and demonstrated by using the real-market reviews dataset of the cell phone industry, which is obtained from the Amazon review dataset 2018. The demonstrated results show the high-performance accuracy of 98.8% and 98.4% during the training and testing phase of the proposed model, respectively. From the analysis, the following result outcomes have been pointed out for targeting and recommending a cellphone product in the market: (1) seven brands (Apple, ASUS, Google, Motorola, Samsung, Sony, and Xiaomi) have a maximum rating of 5; (2) four brands (Apple, Motorola, OnePlus, and Samsung) have a minimum rating of 1; (3) Google cellphone (Google Pixel XL, Quite Black 32GB) has a maximum number of reviews with 984; (4) the brand having a maximum number of reviews is Samsung with 41,660, (5) the Samsung brand has a maximum number of items in the market with 397, and (6) the Maximum value MMR tells about the good brand that can be recommended to the customer. The following brands have maximum MMR: Samsung, Sony, Xiaomi, ASUS, Motorola, and Google.
In the future, the scope of the proposed approach is to implement targeting and recommending other products for project management such as fashion and beauty products, appliances, arts, crafts and sewing, automotive, books, CDs and Vinyl, clothing shoes and jewelry, digital music, electronics, gift cards, grocery and gourmet food, home and kitchen, industrial and scientific, kindle store, magazine subscriptions, movies and TV, musical instruments, office products, patio, lawn and garden, pet supplies, prime pantry, software, sports and outdoors, tools and home improvement, toys and games, video games etc.
Author Contributions
Data curation, H.M.; Formal analysis, H.M. and N.F.; Investigation, H.M. and N.F.; Methodology, H.M.; Supervision, A.A. and N.A.A.; Validation, H.M.; Visualization, N.F.; Writing—original draft, H.M. and N.F.; Writing—review & editing, A.A. and N.A.A. All authors have read and agreed to the published version of the manuscript.
Funding
This research received no external funding.
Institutional Review Board Statement
Not applicable.
Informed Consent Statement
Not applicable.
Data Availability Statement
Not applicable.
Acknowledgments
The authors would like to acknowledge the support from Intelligent Prognostic Private Limited Delhi, India Researcher’s Supporting Project, Intelligent Prognostic Private Limited Delhi, India. The authors extend their appreciation to the Faculty of Business and Management, Universiti Sultan Zainal Abidin (UniSZA) Malaysia for providing necessary facilities to this research work.
Conflicts of Interest
The authors declare no conflict of interest.
References
- Poirson, E.; Da Cunha, C. A recommender approach based on customer emotions. Expert Syst. Appl. 2019, 122, 281–288. [Google Scholar] [CrossRef]
- Jack, H. Engineering Design, Planning, and Management; Elsevier: Amsterdam, The Netherlands, 2021. [Google Scholar]
- Varadarajan, R. Customer information resources advantage, marketing strategy and business performance: A market resources based view. Ind. Mark. Manag. 2020, 89, 89–97. [Google Scholar] [CrossRef]
- Herrmann, A.; Huber, F.; Braunstein, C. Market-driven product and service design: Bridging the gap between customer needs, quality management, and customer satisfaction. Int. J. Prod. Econ. 2000, 66, 77–96. [Google Scholar] [CrossRef]
- Park, C.W.; Jaworski, B.J.; MacInnis, D.J. Strategic brand concept-image management. J. Mark. 1986, 50, 135–145. [Google Scholar] [CrossRef]
- Krishnan, V.; Ulrich, K.T. Product development decisions: A review of the literature. Manag. Sci. 2001, 47, 1–21. [Google Scholar] [CrossRef] [Green Version]
- Sullivan, L.P. Quality function deployment. Qual. Progress 1986, 19, 39–50. [Google Scholar]
- Ulrich, K.T.; Eppinger, S.D. Product Design and Development; McGraw Hill: New York, NY, USA, 2019. [Google Scholar]
- Stone, R.B.; Kurtadikar, R.; Villanueva, N.; Arnold, C.B. A customer needs motivated conceptual design methodology for product portfolio planning. J. Eng. Des. 2008, 19, 489–514. [Google Scholar] [CrossRef]
- Orme, B.K. Getting started with conjoint analysis. In Strategies for Product Design and Pricing Research; 4E Research Publishers LLC.: Madison, WI, USA, 2020. [Google Scholar]
- Matzler, K.; Hinterhuber, H.H. How to make product development projects more successful by integrating Kano’s model of customer satisfaction into quality function deployment. Technovation 1998, 18, 25–38. [Google Scholar] [CrossRef]
- Kano, N.; Seraku, N.; Takahashi, F.; Tsuji, S. Attractive quality and must-be quality. Jpn. Soc. Qual. Control 1984, 14, 39–48. [Google Scholar]
- Mikulic, J.; Prebežac, D. A critical review of techniques for classifying quality attributes in the Kano model. Manag. Serv. Qual. Int. J. 2011, 21, 46–66. [Google Scholar] [CrossRef] [Green Version]
- Akao, Y. Quality Function Deployment (QFD). In Integrating Customer Requirements into Product Design; Productivity Press: New York, NY, USA, 2004. [Google Scholar]
- Chan, L.-K.; Wu, M.-L. Quality function deployment: A literature review. Eur. J. Oper. Res. 2002, 143, 463–497. [Google Scholar] [CrossRef]
- Zahay, D.; Griffin, A.; Fredericks, E. Sources, uses, and forms of data in the new product development process. Ind. Mark. Manag. 2004, 33, 657–666. [Google Scholar] [CrossRef]
- Green, P.E.; Srinivasan, V. Conjoint analysis in consumer research: Issues and outlook. J. Consum. Res. 1978, 5, 103–123. [Google Scholar] [CrossRef]
- Kim, D.S.; Bailey, R.A.; Hardt, N.; Allenby, G. Benefit-based conjoint analysis. Mark. Sci. 2017, 36, 54–69. [Google Scholar] [CrossRef]
- Alam, I.; Perry, C. A customer-oriented new service development process. J. Serv. Mark. 2002, 16, 515–534. [Google Scholar] [CrossRef] [Green Version]
- Goffin, K.; Varnes, C.J.; Van der Hoven, C.; Koners, U. Beyond the voice of the customer: Ethnographic market research. Res. Technol. Manag. 2015, 55, 45–53. [Google Scholar] [CrossRef]
- Kaulio, M.A. Customer, consumer and user involvement in product development: A framework and a review of selected methods. Total. Qual. Manag. 1998, 9, 141–149. [Google Scholar] [CrossRef]
- Schaffhausen, C.R.; Kowalewski, T. Assessing quality of unmet user needs: Effects of need statement characteristics. Des. Stud. 2016, 44, 1–27. [Google Scholar] [CrossRef]
- Schaffhausen, C.R.; Kowalewski, T.M. Large-scale needfinding: Methods of increasing user-generated needs from large populations. J. Mech. Des. 2015, 137, 071403. [Google Scholar] [CrossRef]
- Büschken, J.; Allenby, G. Sentence-based text analysis for customer reviews. Mark. Sci. 2016, 35, 953–975. [Google Scholar] [CrossRef] [Green Version]
- Fader, P.S.; Winer, R.S. Introduction to the special issue on the emergence and impact of user-generated content. Mark. Sci. 2012, 31, 369–371. [Google Scholar] [CrossRef]
- Archak, N.; Ghose, A.; Ipeirotis, P. Deriving the pricing power of product features by mining consumer reviews. Manag. Sci. 2011, 57, 1485–1509. [Google Scholar] [CrossRef] [Green Version]
- Schweidel, D.A.; Moe, W.W. Listening in on social media: A joint model of sentiment and venue format choice. J. Mark. Res. 2014, 51, 387–402. [Google Scholar] [CrossRef]
- Ying, Y.; Feinberg, F.; Wedel, M. Leveraging missing ratings to improve online recommendation systems. J. Mark. Res. 2006, 43, 355–365. [Google Scholar] [CrossRef] [Green Version]
- Lee, T.Y.; Bradlow, E.T. Automated marketing research using online customer reviews. J. Mark. Res. 2011, 48, 881–894. [Google Scholar] [CrossRef]
- Netzer, O.; Feldman, R.; Goldenberg, J.; Fresko, M. Mine your own business: Market-structure surveillance through text mining. Mark. Sci. 2012, 31, 521–543. [Google Scholar] [CrossRef] [Green Version]
- Tirunillai, S.; Tellis, G. Mining marketing meaning from online chatter: Strategic brand analysis of big data using latent dirichlet allocation. J. Mark. Res. 2014, 51, 463–479. [Google Scholar] [CrossRef] [Green Version]
- Griffin, A.; Hauser, J.R. The Voice of the customer. Mark. Sci. 1993, 12, 1–27. [Google Scholar] [CrossRef]
- Peng, W.; Sun, T.; Revankar, S.; Li, T. Mining the “Voice of the Customer” for business prioritization. ACM Trans. Intell. Syst. Technol. 2012, 3, 1–17. [Google Scholar] [CrossRef]
- Jin, J.; Ji, P.; Liu, Y.; Lim, S.J. Translating online customer opinions into engineering characteristics in QFD: A probabilistic language analysis approach. Eng. Appl. Artif. Intell. 2015, 41, 115–127. [Google Scholar] [CrossRef]
- Kuehl, N. Needmining: Towards analytical support for service design. Bus. Inf. Syst. 2016, 247, 187–200. [Google Scholar] [CrossRef]
- Nagamachi, M. Kansei engineering: A new ergonomic consumer-oriented technology for product development. Int. J. Ind. Ergon. 1995, 15, 3–11. [Google Scholar] [CrossRef]
- Sabin, D.; Weigel, R. Product configuration frameworks-a survey. IEEE Intell. Syst. 1998, 13, 42–49. [Google Scholar] [CrossRef]
- Zhou, F.; Jiao, R.J.; Linsey, J.S. Latent customer needs elicitation by use case analogical reasoning from sentiment analysis of online product reviews. J. Mech. Des. 2015, 137, 071401. [Google Scholar] [CrossRef]
- Timoshenko, A.; Hauser, J.R. Identifying customer needs from user-generated content. Mark. Sci. 2019, 38, 1–20. [Google Scholar] [CrossRef]
- Kuhl, N.; Scheurenbrand, J.; Satzger, G. Needmining: Identifying Micro Blog Data Containing Customer Needs. In Proceedings of the European Conference on Information Systems (ECIS), Istanbul, Turkey, 12–15 June 2016; Research Papers. 2016; Volume 185. [Google Scholar]
- Özdağoğlu, G.; Kapucugil-Ikiz, A.; Çelik, A.F. Topic modelling-based decision framework for analysing digital voice of the customer. Total. Qual. Manag. Bus. Excel. 2016, 29, 1–18. [Google Scholar] [CrossRef]
- Kuhl, N.; Muhlthakler, M.; Goutier, M. Automatically quantifying customer need tweets: Towards a supervised machine learning approach. In Proceedings of the 51st Hawaii International Conference on System Sciences, Waikoloa Village, HI, USA, 2–6 January 2018; pp. 2046–2055. [Google Scholar]
- McAuley, J.; Targett, C.; Shi, Q.; van der Hengel, A. Ups and downs: Modeling the Visual Evolution of Fashion Trends with One-Class Collaborative Filtering. In Proceedings of the 25th International Conference on World Wide Web, Montréal, QC, Canada, 11–15 April 2016; pp. 507–517. [Google Scholar]
- McAuley, J.; Targett, C.; Shi, Q.; van der Hengel, A. Image-Based Recommendations on Styles and Substitutes; SIGIR ’15. In Proceedings of the 38th International ACM SIGIR Conference on Research and Development in Information Retrieval, Santiago, Chile, 9–13 August 2015; pp. 43–52. [Google Scholar]
- Wan, M.; Ni, J.; Misra, R.; McAuley, J. Addressing Marketing Bias in Product Recommendations. In Proceedings of the 13th International Conference on Web Search and Data Mining, WSDM ‘20, Houston, TX, USA, 3–7 February 2020; pp. 618–626. [Google Scholar]
- Pasricha, R.; McAuley, J. Translation-Based Factorization Machines for Sequential Recommendation. In Proceedings of the 12th ACM Conference on Recommender Systems, Vancouver, BC, Canada, 2–7 October 2018; pp. 63–71. [Google Scholar]
- He, R.; Kang, W.C.; McAuley, J. Translation-Based Recommendation. In Proceedings of the Eleventh ACM Conference on Recommender Systems, Como, Italy, 27–31 August 2017; pp. 161–169. [Google Scholar]
- Kang, W.-C.; McAuley, J. Self-Attentive Sequential Recommendation. In Proceedings of the IEEE International Conference on Data Mining (ICDM), Singapore, 17–20 November 2018; pp. 197–206. [Google Scholar]
- Wan, M.; McAuley, J. Item recommendation on monotonic behavior chains. In Proceedings of the 12th ACM Conference on Recommender Systems, Vancouver, BC, Canada, 2 October 2018; pp. 86–94. [Google Scholar]
- Pathak, A.; Gupta, K.; McAuley, J. Generating and personalizing bundle recommendations on Steam. In Proceedings of the 40th International ACM SIGIR Conference on Research and Development in Information Retrieval, SIGIR ’17, Tokyo, Japan, 7–11 August 2017; pp. 1073–1076. [Google Scholar]
- Kang, W.C.; Kim, E.; Leskovec, J.; Rosenberg, C.; McAuley, J. Complete the look: Scene-Based Complementary Product Recommendation. In Proceedings of the 2019 IEEE/CVF Conference on Computer Vision and Pattern Recognition (CVPR), Long Beach, CA, USA, 16–20 June 2019; pp. 10524–10533. [Google Scholar]
- Misra, R.; Wan, M.; McAuley, J. Decomposing fit semantics for product size recommendation in metric spaces. In Proceedings of the 12th ACM Conference on Recommender Systems, Vancouver, BC, Canada, 2–7 October 2018; pp. 422–426. [Google Scholar]
- Park, Y.-J.; Chang, K.-N. Individual and group behavior-based customer profile model for personalized product recommendation. Expert Syst. Appl. 2009, 36, 1932–1939. [Google Scholar] [CrossRef]
- Chen, L.; Li, R.; Liu, Y.; Zhang, R.; Woodbridge, D.M.K. Machine Learning-Based Product Recommendation using Apache Spark. In Proceedings of the 2017 IEEE SmartWorld, Ubiquitous Intelligence & Computing, Advanced & Trusted Computed, Scalable Computing & Communications, Cloud & Big Data Computing, Internet of People and Smart City Innovation (SmartWorld/SCALCOM/UIC/ATC/CBDCom/IOP/SCI), San Francisco, CA, USA, 4–8 August 2017. [Google Scholar]
- Bobadilla, J.; Ortega, F.; Hernando, A.; Gutiérrez, A. Recommender systems survey. Knowl. Based Syst. 2013, 46, 109–132. [Google Scholar] [CrossRef]
- Mahdi, M.; Zabil, M.M.; Ahmad, A.; Ismail, R.; Yusoff, Y.; Cheng, L.; Azmi, M.; Natiq, H.; Naidu, H.H. Software project management using machine learning technique—A Review. Appl. Sci. 2021, 11, 5183. [Google Scholar] [CrossRef]
- Min, Q.; Lu, Y.; Liu, Z.; Su, C.; Wang, B. Machine Learning based Digital Twin Framework for Production Optimization in Petrochemical Industry. Int. J. Inf. Manag. 2019, 49, 502–519. [Google Scholar] [CrossRef]
- Lee, H.; Kim, S.; Park, H.-W.; Kang, P. Pre-launch new product demand forecasting using the Bass model: A statistical and machine learning-based approach. Technol. Forecast. Soc. Chang. 2014, 86, 49–64. [Google Scholar] [CrossRef]
- What is Big Data Analytics? IBM. Available online: https://www.ibm.com/sg-en/analytics/hadoop/big-data-analytics (accessed on 4 July 2021).
- Malik, H.; Padmanabhan, V.; Sharma, R. PSO-NN-based hybrid model for long-term wind speed prediction: A Study on 67 Cities of India. In Applications of Artificial Intelligence Techniques in Engineering. Advances in Intelligent Systems and Computing; Malik, H., Srivastava, S., Sood, Y., Ahmad, A., Eds.; Springer: Singapore, 2019; Volume 697. [Google Scholar]
- Fatema, N.; Malik, H. Data-Driven Occupancy Detection Hybrid Model Using Particle Swarm Optimization Based Artificial Neural Network. In Metaheuristic and Evolutionary Computation: Algorithms and Applications. Studies in Computational Intelligence; Malik, H., Iqbal, A., Joshi, P., Agrawal, S., Bakhsh, F.I., Eds.; Springer: Singapore, 2021; Volume 916. [Google Scholar]
- Ni, J.; Li, J.; McAuley, J. Justifying recommendations using distantly-labeled reviews and fined-grained aspects. In Proceedings of the 2019 Conference on Empirical Methods in Natural Language Processing (EMNLP), Hong Kong, China, 3–7 November 2019. [Google Scholar]


Publisher’s Note: MDPI stays neutral with regard to jurisdictional claims in published maps and institutional affiliations. |
© 2021 by the authors. Licensee MDPI, Basel, Switzerland. This article is an open access article distributed under the terms and conditions of the Creative Commons Attribution (CC BY) license (https://creativecommons.org/licenses/by/4.0/).