
Respondent Burden Effects on Item Non-Response and Careless Response Rates: An Analysis of Two Types of Surveys


Abstract
:1. Introduction
2. Data
Types of Questions
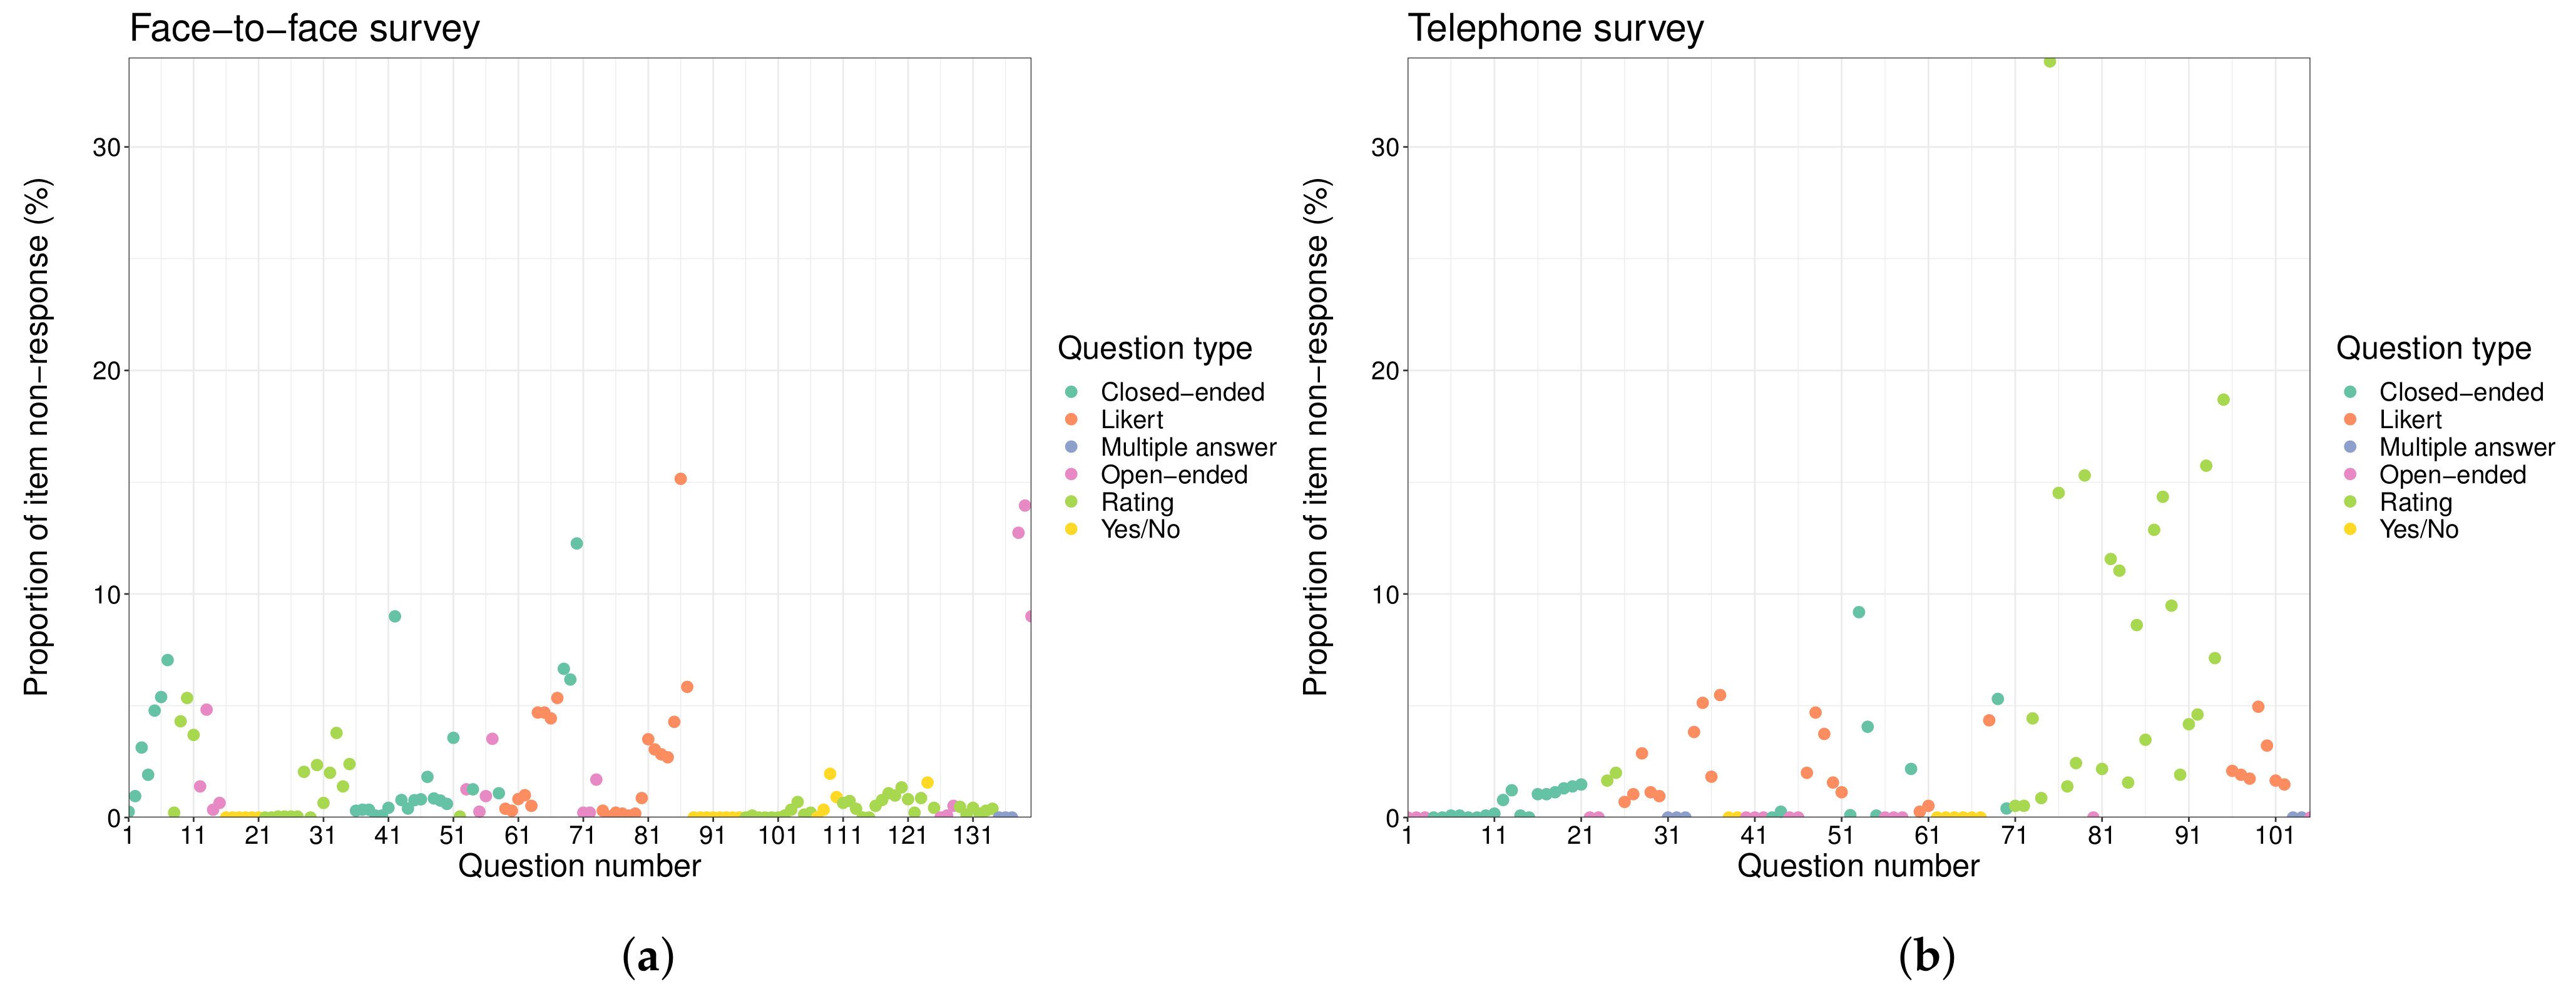
- Closed-ended: Questions that force the respondent to choose from a set of alternatives being offered by the interviewer [17]. In the current study, the term "closed-ended question" does not include the Likert scale, rating, and Yes/No questions since these types of questions are treated specifically, as described in the following lines. Therefore, closed-ended questions refer to questions that meet the above definition but do not belong to any of these three more specific types. For instance, the question “What is your current employment situation?” admitting the answers “Employed/Unemployed/Retired/Student/Other” would be considered as a closed-ended question.
- Likert: Questions in which respondents are asked to show their level of agreement (usually, from “strongly disagree” to “strongly agree”) with a given statement [18].
- Multiple answer: Questions that allow the respondent to choose several options from a prespecified set.
- Rating: Questions in which respondents have to indicate their level of agreement with a statement through a numerical score within a prespecified range. In contrast to Likert questions, each possible value of a rating scale is not associated with a specific level of agreement/disagreement from a range of answer options.
- Yes/No: Questions in which respondents simply have to say “yes” or “no” (although the answers “don’t know” or “don’t answer” are also allowed).
3. Methodology
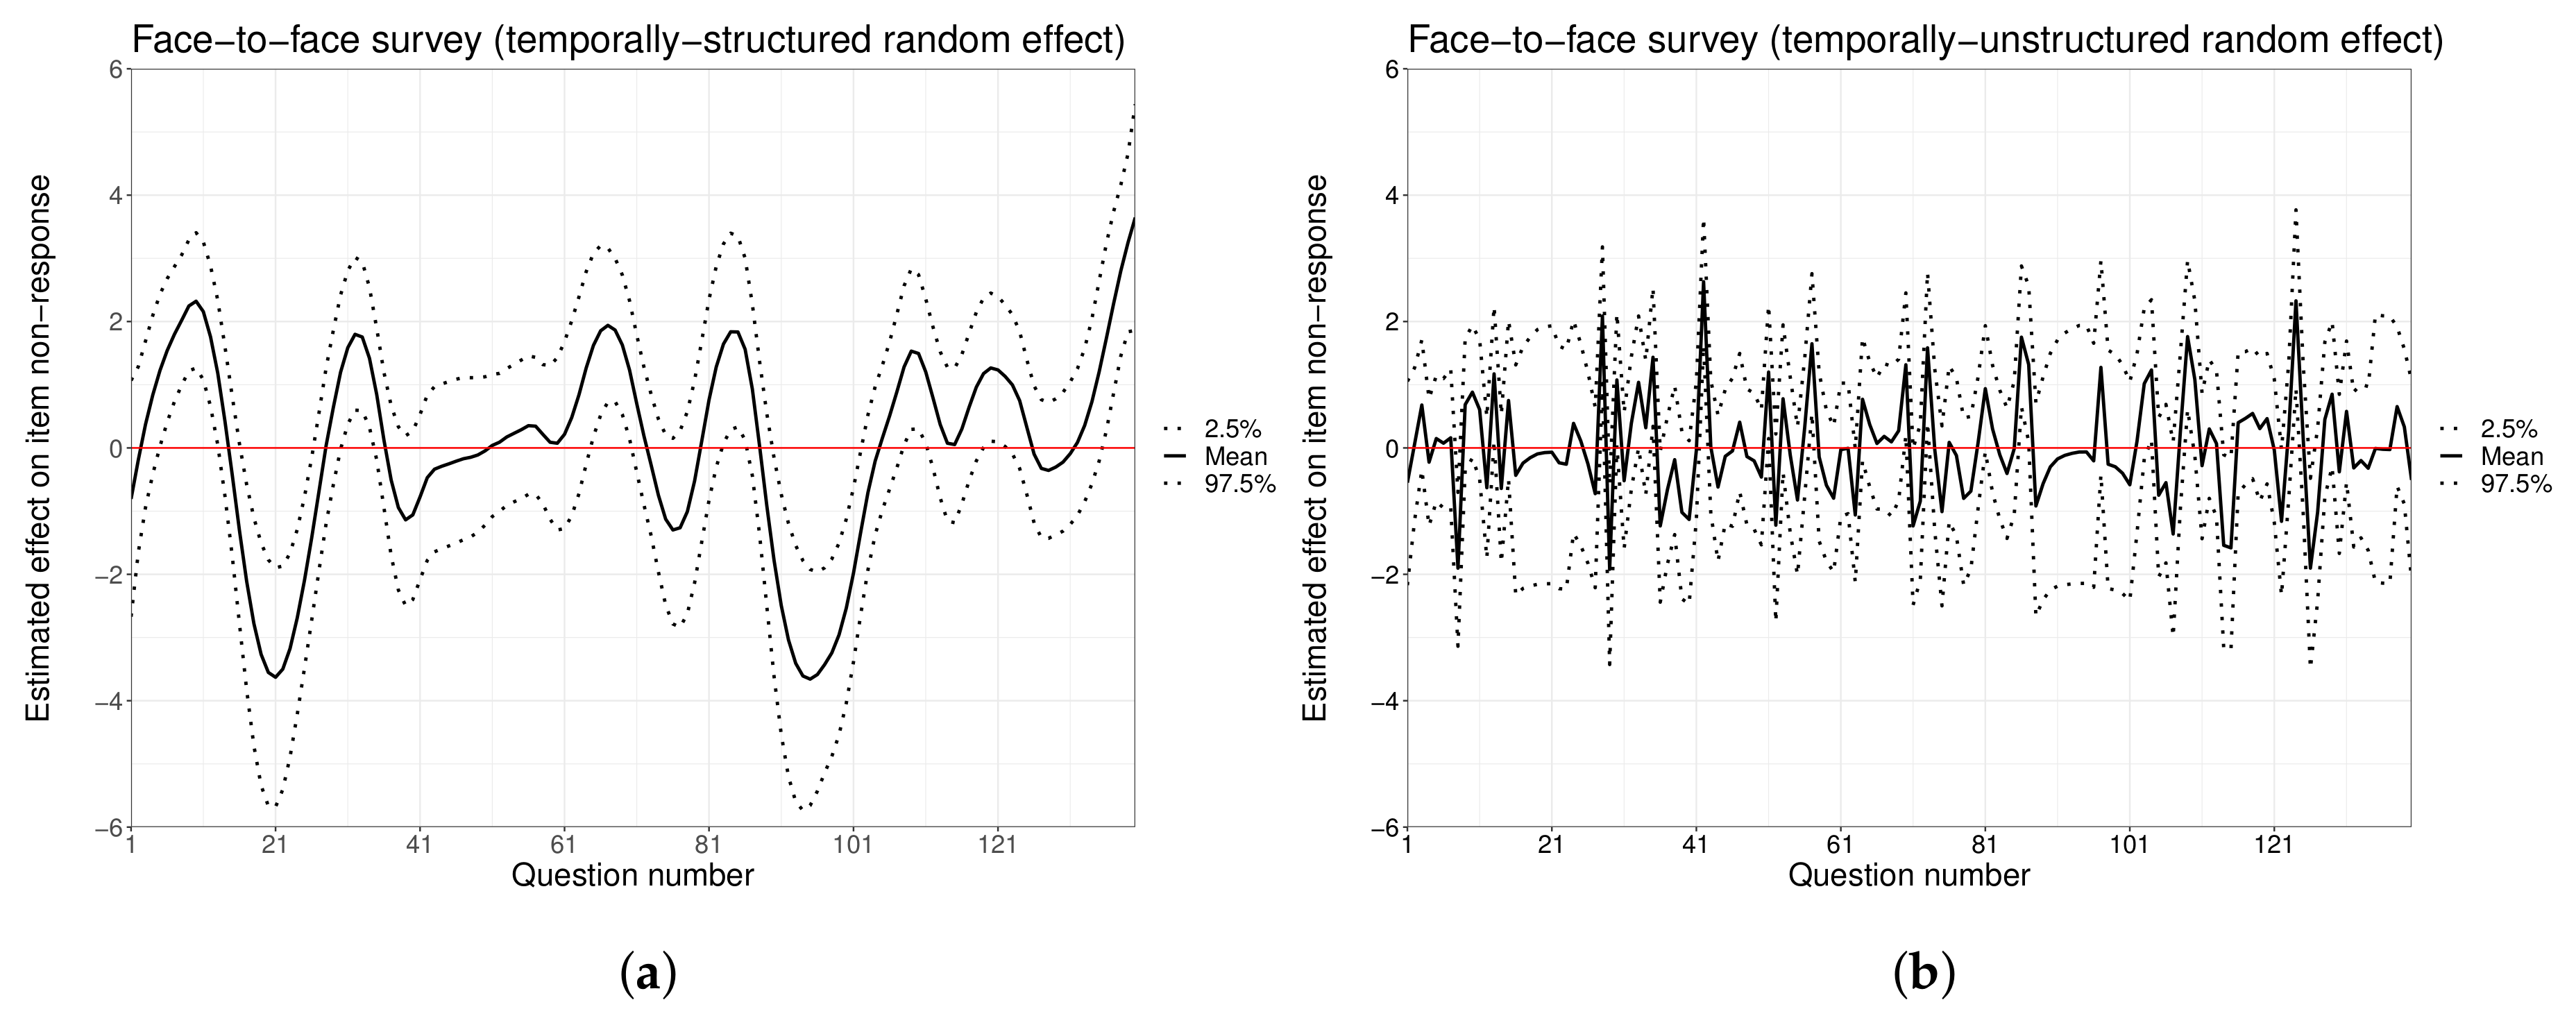
3.1. Modeling Item Non-Response Rates
3.2. Measuring Careless Response
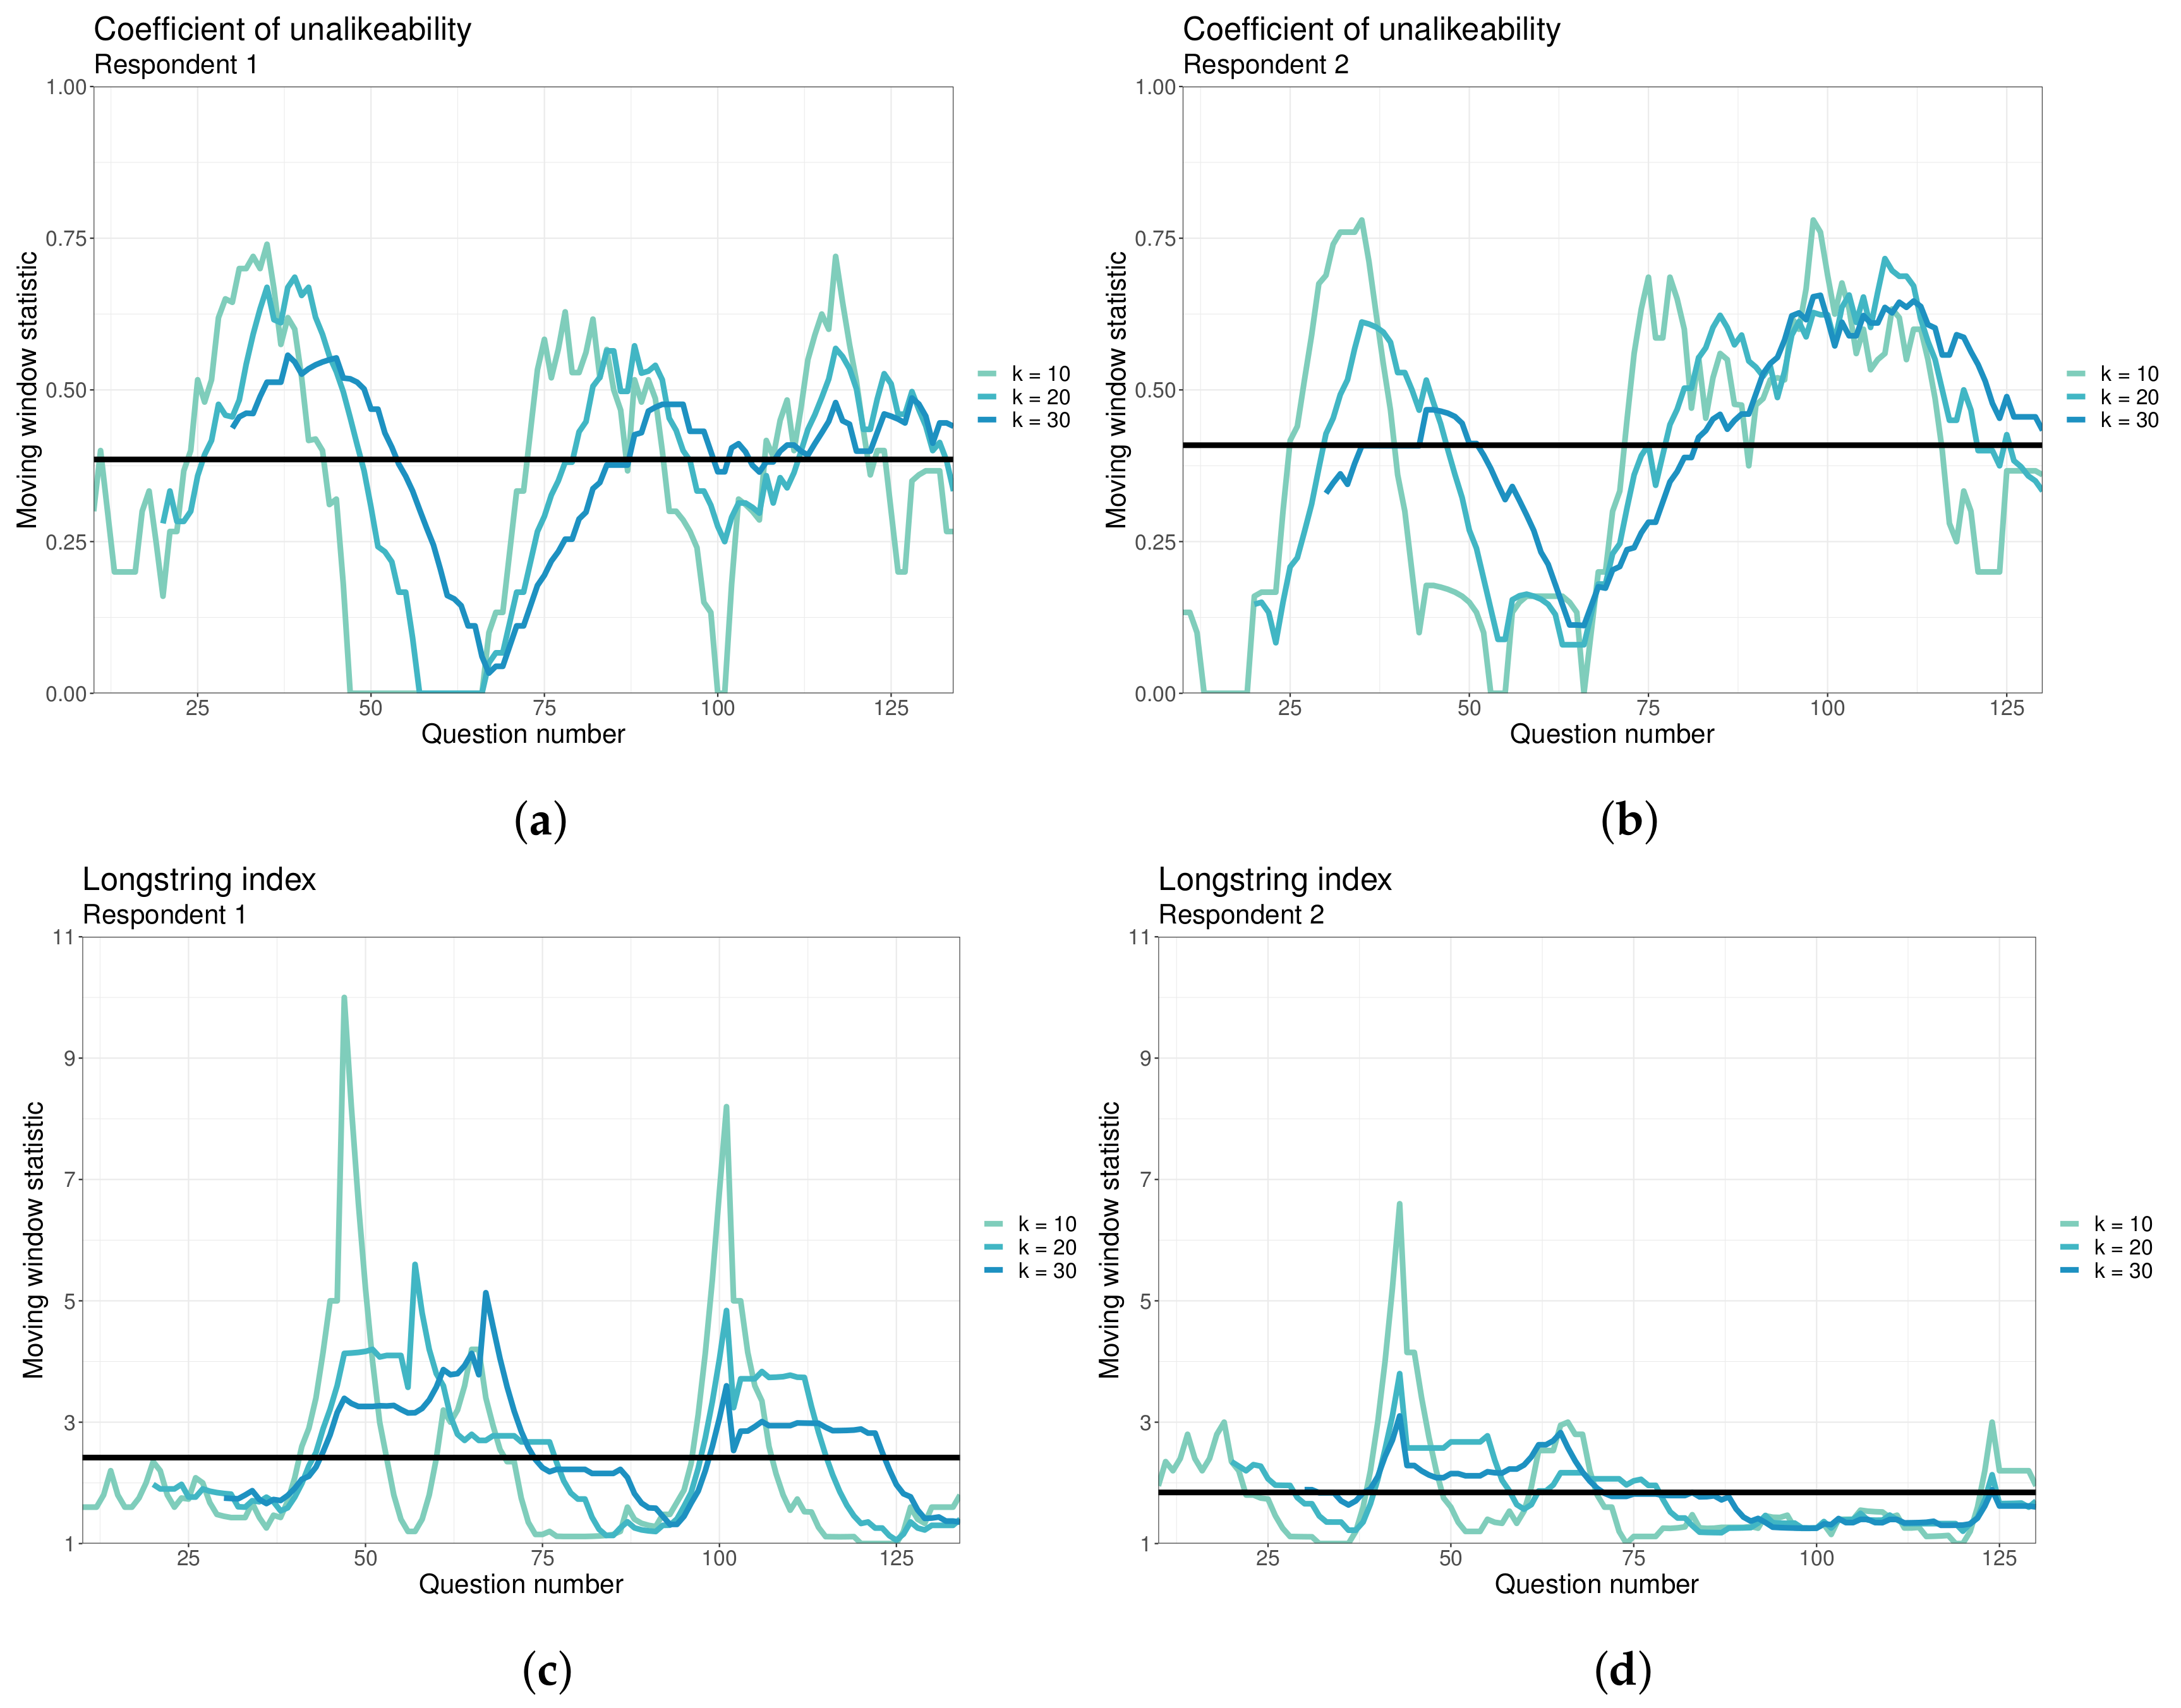
3.2.1. The Coefficient of Unalikeability
3.2.2. The Longstring Index
3.2.3. Moving-Window Metrics
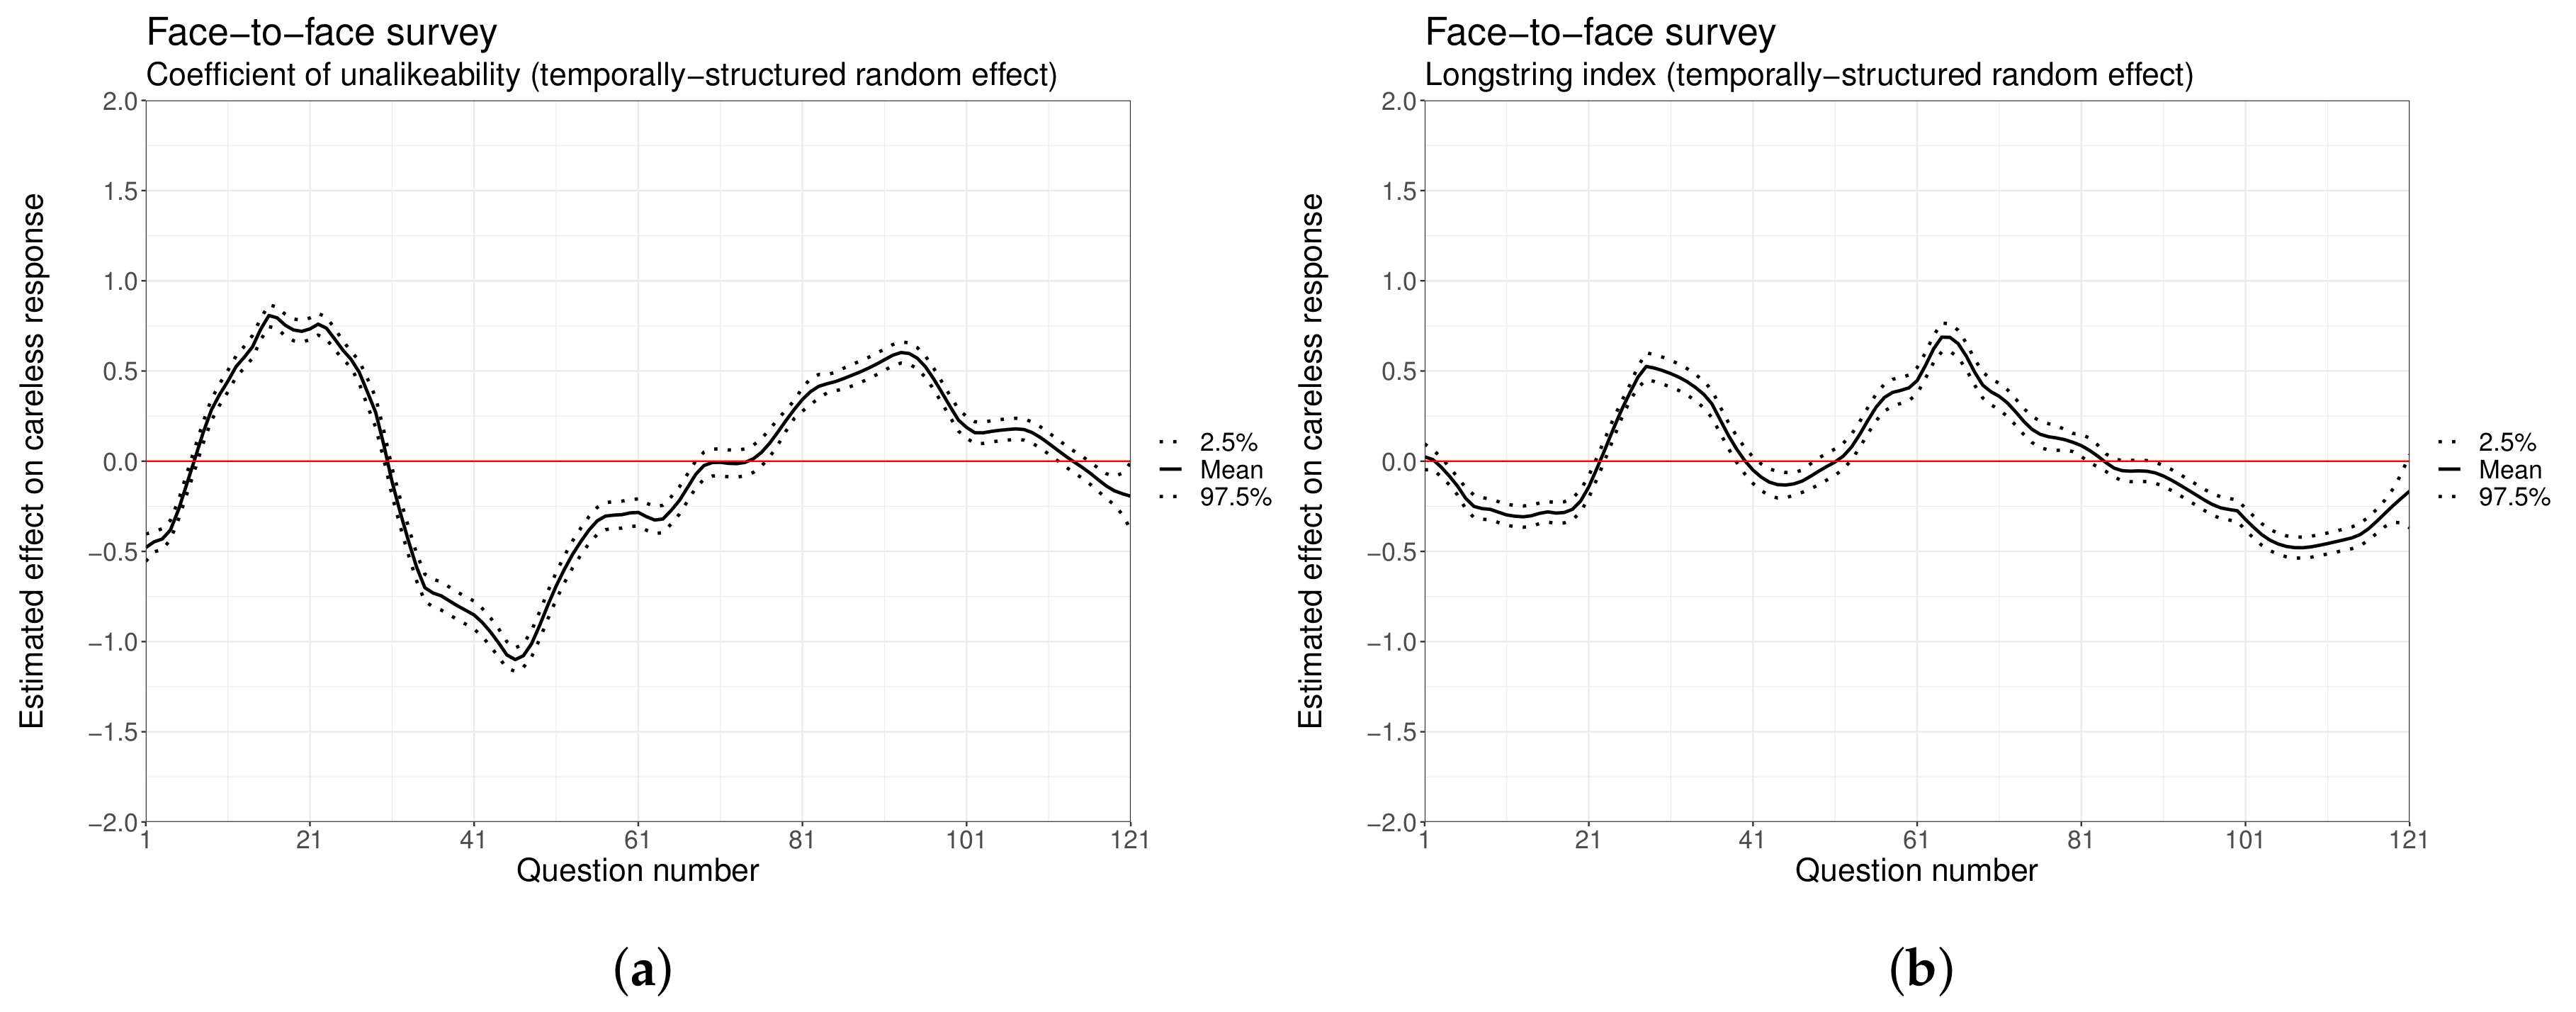
3.3. Modeling Careless Response
3.4. Software
4. Results
4.1. Item Non-Response
4.2. Careless Response
5. Discussion and Conclusions
Funding
Institutional Review Board Statement
Informed Consent Statement
Data Availability Statement
Conflicts of Interest
Appendix A. R Code
References
- Yan, T.; Fricker, S.; Tsai, S. Response Burden: What Is It and What Predicts It? In Advances in Questionnaire Design, Development, Evaluation and Testing; John Wiley & Sons: Hoboken, NJ, USA, 2020; pp. 193–212. [Google Scholar]
- Bradburn, N. Respondent burden. In Proceedings of the Survey Research Methods Section of the American Statistical Association; American Statistical Association: Alexandria, VA, USA, 1978; Volume 35, pp. 35–40. [Google Scholar]
- Haraldsen, G. Identifying and Reducing Response Burdens in Internet Business Surveys. J. Off. Stat. 2004, 20, 393–410. [Google Scholar]
- Sharp, L.M.; Frankel, J. Respondent burden: A test of some common assumptions. Public Opin. Q. 1983, 47, 36–53. [Google Scholar] [CrossRef]
- Galesic, M.; Bosnjak, M. Effects of questionnaire length on participation and indicators of response quality in a web survey. Public Opin. Q. 2009, 73, 349–360. [Google Scholar] [CrossRef]
- Rolstad, S.; Adler, J.; Rydén, A. Response burden and questionnaire length: Is shorter better? A review and meta-analysis. Value Health 2011, 14, 1101–1108. [Google Scholar] [CrossRef] [PubMed] [Green Version]
- Olson, K.; Smyth, J.D.; Ganshert, A. The effects of respondent and question characteristics on respondent answering behaviors in telephone interviews. J. Surv. Stat. Methodol. 2019, 7, 275–308. [Google Scholar] [CrossRef] [Green Version]
- Sun, H.; Conrad, F.G.; Kreuter, F. The Relationship between Interviewer-Respondent Rapport and Data Quality. J. Surv. Stat. Methodol. 2021, 9, 429–448. [Google Scholar] [CrossRef]
- Bogen, K. The effect of questionnaire length on response rates: A review of the literature. In Survey Research Methods Section of the American Statistical Association; U.S. Census Bureau: Suitland, MD, USA, 1996; pp. 1020–1025. [Google Scholar]
- Cook, C.; Heath, F.; Thompson, R.L. A meta-analysis of response rates in web-or internet-based surveys. Educ. Psychol. Meas. 2000, 60, 821–836. [Google Scholar] [CrossRef]
- Warriner, G.K. Accuracy of self-reports to the burdensome question: Survey response and nonresponse error trade-offs. Qual. Quant. 1991, 25, 253–269. [Google Scholar] [CrossRef]
- Brower, C.K. Too Long and too Boring: The Effects of Survey Length and Interest on Careless Responding. Master’s Thesis, Wright State University, Dayton, OH, USA, 2018. [Google Scholar]
- Gibson, A.M.; Bowling, N.A. The effects of questionnaire length and behavioral consequences on careless responding. Eur. J. Psychol. Assess. 2020, 36, 410–420. [Google Scholar] [CrossRef]
- Denscombe, M. Item non-response rates: A comparison of online and paper questionnaires. Int. J. Soc. Res. Methodol. 2009, 12, 281–291. [Google Scholar] [CrossRef]
- Scott, A.; Jeon, S.H.; Joyce, C.M.; Humphreys, J.S.; Kalb, G.; Witt, J.; Leahy, A. A randomised trial and economic evaluation of the effect of response mode on response rate, response bias, and item non-response in a survey of doctors. BMC Med. Res. Methodol. 2011, 11, 126. [Google Scholar] [CrossRef] [Green Version]
- Dupuis, M.; Strippoli, M.P.F.; Gholam-Rezaee, M.; Preisig, M.; Vandeleur, C.L. Mental disorders, attrition at follow-up, and questionnaire non-completion in epidemiologic research. Illustrations from the CoLaus| PsyCoLaus study. Int. J. Methods Psychiatr. Res. 2019, 28, e1805. [Google Scholar] [CrossRef] [PubMed]
- Foddy, W. Constructing Questions for Interviews and Questionnaires: Theory and Practice in Social Research; Cambridge University Press: Cambridge, UK, 1994. [Google Scholar]
- Joshi, A.; Kale, S.; Chandel, S.; Pal, D.K. Likert scale: Explored and explained. Curr. J. Appl. Sci. Technol. 2015, 7, 396–403. [Google Scholar] [CrossRef]
- Reja, U.; Manfreda, K.L.; Hlebec, V.; Vehovar, V. Open-ended vs. close-ended questions in web questionnaires. Dev. Appl. Stat. 2003, 19, 159–177. [Google Scholar]
- Galesic, M. Dropouts on the web: Effects of interest and burden experienced during an online survey. J. Off. Stat. 2006, 22, 313. [Google Scholar]
- Agresti, A. An Introduction to Categorical Data Analysis; John Wiley & Sons: Hoboken, NJ, USA, 2018. [Google Scholar]
- Nakagawa, S.; Schielzeth, H. A general and simple method for obtaining R2 from generalized linear mixed-effects models. Methods Ecol. Evol. 2013, 4, 133–142. [Google Scholar] [CrossRef]
- Nakagawa, S.; Johnson, P.C.; Schielzeth, H. The coefficient of determination R2 and intra-class correlation coefficient from generalized linear mixed-effects models revisited and expanded. J. R. Soc. Interface 2017, 14, 20170213. [Google Scholar] [CrossRef] [PubMed] [Green Version]
- Meade, A.W.; Craig, S.B. Identifying careless responses in survey data. Psychol. Methods 2012, 17, 437. [Google Scholar] [CrossRef] [PubMed] [Green Version]
- Niessen, A.S.M.; Meijer, R.R.; Tendeiro, J.N. Detecting careless respondents in web-based questionnaires: Which method to use? J. Res. Personal. 2016, 63, 1–11. [Google Scholar] [CrossRef] [Green Version]
- Mahalanobis, P.C. On the generalized distance in statistics. Proc. Natl. Inst. Sci. India 1936, 2, 49–55. [Google Scholar]
- Dupuis, M.; Meier, E.; Cuneo, F. Detecting computer-generated random responding in questionnaire-based data: A comparison of seven indices. Behav. Res. Methods 2019, 51, 2228–2237. [Google Scholar] [CrossRef] [PubMed]
- Perry, M.; Kader, G. Variation as unalikeability. Teach. Stat. 2005, 27, 58–60. [Google Scholar] [CrossRef]
- Yentes, R.D.; Wilhelm, F. Careless: Procedures for Computing Indices of Careless Responding, R Package Version 1.1.3; 2018. Available online: http://r.meteo.uni.wroc.pl/web/packages/careless/index.html (accessed on 18 August 2021).
- Oberg, A.L.; Mahoney, D.W. Linear Mixed Effects Models. In Topics in Biostatistics; Humana Press: Totowa, NJ, USA, 2007; pp. 213–234. [Google Scholar]
- Ferrari, S.; Cribari-Neto, F. Beta regression for modelling rates and proportions. J. Appl. Stat. 2004, 31, 799–815. [Google Scholar] [CrossRef]
- Smithson, M.; Verkuilen, J. A better lemon squeezer? Maximum-likelihood regression with beta-distributed dependent variables. Psychol. Methods 2006, 11, 54. [Google Scholar] [CrossRef] [PubMed] [Green Version]
- R Core Team. R Language Definition; R Foundation for Statistical Computing: Vienna, Austria, 2020. [Google Scholar]
- Wickham, H. ggplot2: Elegant Graphics for Data Analysis; Springer: New York, NY, USA, 2016. [Google Scholar]
- Rue, H.; Martino, S.; Chopin, N. Approximate Bayesian Inference for Latent Gaussian Models Using Integrated Nested Laplace Approximations (with discussion). J. R. Stat. Soc. B 2009, 71, 319–392. [Google Scholar] [CrossRef]
- Lindgren, F.; Rue, H. Bayesian Spatial Modelling with R-INLA. J. Stat. Softw. 2015, 63, 1–25. [Google Scholar] [CrossRef] [Green Version]
- Redd, R. Ragree: Rater Agreement, R Package Version 0.0.4; 2020. Available online: https://rdrr.io/github/raredd/ragree/ (accessed on 18 August 2021).
- Read, B. Respondent burden in a Mobile App: Evidence from a shopping receipt scanning study. Surv. Res. Methods 2019, 13, 45–71. [Google Scholar]
- Schweizer, K. Some Thoughts Concerning the Recent Shift from Measures with Many Items to Measures with Few Items. Eur. J. Psychol. Assess. 2011, 27, 71–72. [Google Scholar] [CrossRef]
- Rammstedt, B.; Beierlein, C. Can’t we make it any shorter? The limits of personality assessment and ways to overcome them. J. Individ. Differ. 2014, 35, 212–220. [Google Scholar] [CrossRef]
- Marjanovic, Z.; Holden, R.; Struthers, W.; Cribbie, R.; Greenglass, E. The inter-item standard deviation (ISD): An index that discriminates between conscientious and random responders. Personal. Individ. Differ. 2015, 84, 79–83. [Google Scholar] [CrossRef] [Green Version]


| Face-to-Face Survey | Telephone Survey | |||
|---|---|---|---|---|
| Question Groups | Questions | Question Groups | Questions | |
| Closed-ended | 9 | 28 | 12 | 27 |
| Likert | 4 | 23 | 7 | 24 |
| Multiple answer | 1 | 3 | 2 | 5 |
| Open-ended | 8 | 17 | 9 | 15 |
| Rating | 10 | 50 | 4 | 26 |
| Yes/No | 4 | 19 | 3 | 8 |
| Total | 36 | 140 | 37 | 105 |
| Face-to-Face Survey | Telephone Survey | |||
|---|---|---|---|---|
| Min. | 0.00 | 1.00 | 0.00 | 1.00 |
| 1st Qu. | 0.30 | 1.36 | 0.30 | 1.22 |
| Median | 0.43 | 1.61 | 0.42 | 1.40 |
| Mean | 0.42 | 1.89 | 0.42 | 1.63 |
| 3rd Qu. | 0.53 | 2.06 | 0.54 | 1.77 |
| Max. | 0.81 | 11.60 | 0.82 | 7.20 |
| Face-to-Face Survey | Telephone Survey | ||||||
|---|---|---|---|---|---|---|---|
| Mean | Low | Up | Mean | Low | Up | ||
| Intercept | −3.09 | −4.31 | −1.86 | −2.86 | −3.47 | −2.27 | |
| Age | <40 | ||||||
| 40–64 | 0.04 | −0.04 | 0.12 | −0.49 | −0.59 | −0.38 | |
| ≥65 | 0.12 | 0.03 | 0.21 | 0.17 | 0.05 | 0.28 | |
| Sex | Male | ||||||
| Female | 0.07 | 0.00 | 0.13 | 0.45 | 0.37 | 0.53 | |
| Academic level | No studies | ||||||
| Secondary | −0.15 | −0.30 | 0.00 | −0.51 | −0.65 | −0.36 | |
| High-school | −0.19 | −0.33 | −0.04 | −1.12 | −1.27 | −0.96 | |
| University | −0.48 | −0.64 | −0.32 | −1.33 | −1.49 | −1.16 | |
| Question typology | Likert | ||||||
| Closed-ended | 0.48 | −1.04 | 1.99 | −0.46 | −1.43 | 0.51 | |
| Multiple answer | −11.24 | −33.61 | 2.49 | −10.03 | −33.26 | 4.16 | |
| Open-ended | −0.37 | −1.89 | 1.13 | −10.21 | −33.14 | 3.87 | |
| Rating | −1.00 | −2.66 | 0.64 | 0.77 | −0.16 | 1.68 | |
| Yes/No | −2.25 | −4.06 | −0.51 | −9.60 | −33.24 | 4.86 | |
| 0.2848 | 0.7339 | ||||||
| 0.6847 | 0.8455 | ||||||
| Face-to-Face Survey | Telephone Survey | ||||||
|---|---|---|---|---|---|---|---|
| Mean | Low | Up | Mean | Low | Up | ||
| Intercept | −0.46 | −0.53 | −0.39 | −0.37 | −0.46 | −0.28 | |
| Age | <40 | ||||||
| 40–64 | 0.01 | 0.00 | 0.01 | −0.07 | −0.07 | −0.06 | |
| ≥65 | 0.05 | 0.04 | 0.06 | −0.03 | −0.04 | −0.01 | |
| Sex | Male | ||||||
| Female | 0.01 | 0.01 | 0.01 | −0.04 | −0.05 | −0.03 | |
| Academic level | No studies | ||||||
| Secondary | 0.03 | 0.02 | 0.04 | −0.14 | −0.16 | −0.12 | |
| High-school | 0.02 | 0.01 | 0.03 | 0.01 | −0.01 | 0.03 | |
| University | 0.08 | 0.07 | 0.10 | 0.03 | 0.01 | 0.05 | |
| Most frequent question typology | Likert | ||||||
| Closed-ended | −0.01 | −0.09 | 0.08 | −0.07 | −0.19 | 0.05 | |
| Open-ended | - | - | - | 0.17 | −0.00 | 0.36 | |
| Rating | 0.02 | −0.09 | 0.12 | −0.00 | −0.20 | 0.20 | |
| Tie | 0.01 | −0.08 | 0.09 | −0.02 | −0.12 | 0.09 | |
| Yes/No | −0.01 | −0.11 | 0.09 | −0.03 | −0.18 | 0.12 | |
| 0.0040 | 0.0206 | ||||||
| 0.1263 | 0.1490 | ||||||
| Face-to-Face Survey | Telephone Survey | ||||||
|---|---|---|---|---|---|---|---|
| Mean | Low | Up | Mean | Low | Up | ||
| Intercept | 1.97 | 1.90 | 2.04 | 1.61 | 1.57 | 1.66 | |
| Age | <40 | ||||||
| 40-64 | −0.02 | −0.03 | −0.02 | 0.05 | 0.04 | 0.06 | |
| ≥65 | −0.09 | −0.10 | −0.08 | 0.07 | 0.06 | 0.09 | |
| Sex | Male | ||||||
| Female | −0.01 | −0.02 | −0.01 | 0.05 | 0.04 | 0.06 | |
| Academic level | No studies | ||||||
| Secondary | −0.05 | −0.06 | −0.03 | 0.06 | 0.04 | 0.09 | |
| High-school | −0.03 | −0.05 | −0.01 | −0.09 | −0.11 | −0.06 | |
| University | −0.12 | −0.13 | −0.10 | −0.13 | −0.16 | −0.11 | |
| Most frequent question typology | Likert | ||||||
| Closed-ended | −0.03 | −0.11 | 0.05 | −0.06 | −0.11 | −0.01 | |
| Open-ended | − | − | − | −0.00 | −0.08 | 0.07 | |
| Rating | 0.04 | −0.07 | 0.15 | −0.04 | −0.12 | 0.05 | |
| Tie | 0.00 | −0.08 | 0.08 | −0.03 | −0.07 | 0.02 | |
| Yes/No | −0.03 | −0.12 | 0.07 | −0.02 | −0.09 | 0.04 | |
| 0.0031 | 0.0132 | ||||||
| 0.6538 | 0.7532 | ||||||
Publisher’s Note: MDPI stays neutral with regard to jurisdictional claims in published maps and institutional affiliations. |
© 2021 by the author. Licensee MDPI, Basel, Switzerland. This article is an open access article distributed under the terms and conditions of the Creative Commons Attribution (CC BY) license (https://creativecommons.org/licenses/by/4.0/).
Share and Cite
Briz-Redón, Á. Respondent Burden Effects on Item Non-Response and Careless Response Rates: An Analysis of Two Types of Surveys. Mathematics 2021, 9, 2035. https://doi.org/10.3390/math9172035
Briz-Redón Á. Respondent Burden Effects on Item Non-Response and Careless Response Rates: An Analysis of Two Types of Surveys. Mathematics. 2021; 9(17):2035. https://doi.org/10.3390/math9172035
Chicago/Turabian StyleBriz-Redón, Álvaro. 2021. "Respondent Burden Effects on Item Non-Response and Careless Response Rates: An Analysis of Two Types of Surveys" Mathematics 9, no. 17: 2035. https://doi.org/10.3390/math9172035
APA StyleBriz-Redón, Á. (2021). Respondent Burden Effects on Item Non-Response and Careless Response Rates: An Analysis of Two Types of Surveys. Mathematics, 9(17), 2035. https://doi.org/10.3390/math9172035