Article

Investigation of Cavitation Bubble Dynamics Considering Pressure Fluctuation Induced by Slap Forces

School of Mechanical Engineering and Automation, Northeastern University, Shenyang 110819, China
*
Author to whom correspondence should be addressed.
These authors contributed equally to this work.
Mathematics 2021, 9(17), 2064; https://doi.org/10.3390/math9172064
Submission received: 28 July 2021 / Revised: 19 August 2021 / Accepted: 23 August 2021 / Published: 26 August 2021

Abstract

:
Cavitation erosion is induced by the penetrating pressure from implosion of cavitation bubbles nearby solid boundary. The bubble evolution and the subsequent collapse pressure are especially important to evaluate the erosion degradation of solid boundary materials. The bubble dynamics equation taking into account the influence of distance between bubble and solid boundary is formulated to investigate the effect of boundary wall on bubble evolution process. The pressure fluctuation induced by slapping forces is adopted to evaluate the bubble dynamic characteristics. Negative pressure period which reflects the effect of vibration velocity and gap clearance also has large influence on bubble dynamics. The effects of standoff distance, initial radius and negative pressure period on bubble evolution and collapsing shock pressure are discussed. Maximum bubble radius increases with standoff distance and initial radius, while shock pressure increases with distance and decreases with bubble initial radius, and both of them increase with negative pressure period.

1. Introduction

Cavitation is a unique phenomenon in fluid dynamics, which describes the process of evaporation and formation of cavities of liquid when the local pressure drops below statistical vapor pressure. The cavity nuclei composed of vapor or air or mixture of both continue to grow into bubbles. As surrounding pressure increases, micro bubbles are compressed and finally collapse creating extreme physical environment with temperature of thousands degrees and shock pressure of tens of thousands MPa [1], which are regarded as the main reason of material surface damage during the collapse of bubble adjacent to boundary material. In ocean engineering, bubble collapse in the sea water may accelerate the corrosion process of propeller or rudder. At the end of 19th century, Parsons and Barnaby first proposed the concept of cavitation after observing erosion on propeller, which may reduce the driving efficiency [2]. In 1917, English acoustician Rayleigh established the model of single bubble dynamics, which became the theoretical foundation of cavitation [3]. However, Rayleigh’s formulation ignored the influence of liquid property and vapor content. Plesset modified the bubble equation by considering the compressibility of liquid [4]. Nolting and Nippiras further improved the equation by introducing effect of surface tension and viscosity, and finally concluded the classical Rayleigh-Plesset equation, which has been widely used to understand the process of bubble evolvement [5]. The initiation of a cavitation bubble can be achieved through a number of ways, such as hydrodynamic, acoustic, optic and particle methods [6,7,8,9]. From the 1960s, experts started to utilize high speed cameras to learn the process of cavitation bubble collapse. Lauterborn then created a bubble by laser and experimentally confirmed the existence of micro-jet during the implosion of a bubble [10] and the laser method has been extensively used since then. Due to the extremely fast time scale and small length scales of cavitating bubbles, it is often difficult to visualize the bubble dynamics using high speed photography. Jomes et al. studied the plasma effect, sonoluminescence, and sound wave propagation during laser induced cavitation [11]. Tomita et al. investigated the degree of damage on solid boundary during the collapse of cavitation bubble through schlieren method [12]. Barber et al. measured the radius of cavitation bubble through Mie scattering method [13]. Cavitation has many advantages in medical, melting, manufacturing, chemical engineering, cleaning [14,15,16,17]. Ultrasonic assistant manufacturing techniques with cavitation effect have been applied on difficult machining materials and widely used in the field of aerospace, high speed trains, semiconductors, etc.
In diesel engines, cavitation erosion is found on wet surface of cylinder liners. Engine piston moves vertically accompanied with transverse slapping movement, which is called second motion of piston. The slapping forces from second motion causes liner vibration, noise and water coolant pressure fluctuation. The pressure fluctuation brings acoustic cavitation near the wet surface, and cavitation erosion is finally observed on thrust and anti-thrust side of wet surface of engine liners. There are few researches concentrating on the pressure induced by liner vibration [18,19]. Based on some pioneer works, this paper intends to investigate the characteristics of cavitation bubble under pressure disturbance caused by slap forces through the modified Rayleigh–Plesset bubble dynamics equation. The effects of standoff distance, initial bubble radius and negative pressure period are discussed.

2. Theoretical Basis

Because gases are much more compressible than liquids, bubbles react very strongly to alternating acoustic pressure. Hence, bubble dynamics in a sound field is an essential aspect of acoustic cavitation. The most famous model to describe the evolution and collapse of spherical symmetrical bubble in the liquid is the Rayleigh Equation [3]:
R R ¨ + 3 2 R ˙ 2 = 1 ρ P P
where the overdots indicate derivatives with respect to time. R is bubble radius, ρ is liquid density, P is pressure at bubble surface, P is pressure of the surrounding liquid. Here it is assumed that a bubble with an initial radius of R 0 oscillates spherically and symmetrically in an infinite liquid, and the gas inside the bubble is homogenous.
When we concern the destructive effect of bubble collapse on interface, it is necessary to clarify the motion of bubble adjacent to boundaries. The problem of the bubble collapse is significant in connection with cavitation damage. Considering liquid compressibility, the model of behavior of a bubble near a liner surface is shown in Figure 1.
The bubble is assumed to retain spherical shape. The distance between bubble and wall is supposed to be L. Gravity, heat transfer and gas diffusion are neglected. The motion of bubble can be expressed by solving the following wave equation for velocity potential [20]:
1 r 2 r r 2 Φ r + 1 r 2 sin θ θ sin θ Φ θ = 1 c 2 2 Φ t 2
where r is the distance from center of bubble, c is the speed of sound in the liquid at infinity, Φ is the velocity potential and t the time. The velocity potential can be derived from Equation (2) as below,
Φ = 1 r 1 + r 2 L R 2 R ˙ + 1 c 2 R 2 R ˙ 2 + R 3 R ¨
Considering the boundary conditions at solid wall and bubble surface, the influence of surface tension at the bubble-water interface ( σ ) and water viscosity ( η ) , the equation of motion of the bubble with the effect of liquid compressibility and solid wall is expressed as
R R ¨ 1 + R 2 L 2 R ˙ c + 3 2 R ˙ 2 1 + 2 R 3 L 4 R ˙ 3 c = 1 ρ P g P + R c P ˙ g 4 η R ˙ R 2 σ R
where L is the distance between bubble center and solid wall, R is the bubble radius, P g is the pressure inside bubble with permanent gas, P and ρ are the pressure and density of liquid at infinity. P can be represented as the summation of driving pressure P d and constant ambient pressure P 0 . The pressure inside bubble contains liquid vapor pressure P v and contaminant gas pressure P g , and pressure outside bubble equals the summation of the pressure caused by surface tension P σ and the pressure on the liquid side of interface P l [6]. At equilibrium state R = R 0 , the pressure inside bubble equals the pressure outside, therefore the pressure of permanent gas inside bubble can be got as
P g 0 = P l 0 + 2 σ R 0 P v
where the unperturbed pressure of liquid P l 0 equals the ambient pressure P 0 , P v is the water pressure at a certain temperature. The gas pressure P g inside the bubble depends on the property of gas and process of compression. Here we assume the gas inside bubble is ploytropic and the compression process is adiabatic [6], so that
P g = P g 0 R 0 R 3 γ = P l 0 + 2 σ R 0 P v R 0 R 3 γ .
Equation (4) is a second-order ordinary differential equation (ODE). By introducing a new variable Y = R ˙ , we can get a set of two first order ODE equations, which can be solved by fourth-order Runge–Kutta method:
Y ˙ R ˙ = 3 Y 2 2 R 1 + 2 R 3 L 4 Y 3 c 1 + R 2 L 2 Y c + 1 ρ R 1 + R 2 L 2 Y c P g 1 3 γ Y c P + P v 4 η Y R 2 δ R Y .

3. Results and Discussion

The coolant pressure and liner vibration induced by piston impact force are experimentally investigated by Yonezawa, who measured dynamic pressure, as shown in Figure 2a, by using of a piston slapping experimental apparatus that simulated the water coolant–cylinder–piston system [18,19].
The high precision measurement of bubble radius can be achieved by simultaneously executing observations with stroboscopic light and measurement of bubble radius with light scattering assisted by a stable standing wave field generated in the acoustic cell to trap the bubble at the antinode of the standing wave field [21]. Based on the former research of the authors, the analytical bubble radius evolution can match with the experimental result very well [22]. However, with boundary vibration induced by slap forces, it is difficult to capture a single stable bubble and measure the bubble radius with high precision. Figure 2b shows the comparison of the measured bubble radius from Yonezawa with our calculation results. The experimental data in Figure 2b is not acquired by observing the evolution of one single bubble accurately, but macro statistics of bubble radius from image of large scale of bubbles. Therefore it does not match with the analytical result with very high precision. Generally the measured bubble radius coincides with the analytical bubble radius, which verifies the analytical model.
From Figure 2b we can see the evolution process of bubble under slap forces. Before 200 μ s when the minimum pressure of the circumstance pressure field is below the critical pressure of the nuclei, the bubble grows explosively until its maximum radius that significantly exceeds the initial radius. The bubble acquires large potential energy and then implodes very violently when the surrounding pressure increases abruptly at around 200 μ s. From the minimum radius, the cavitation bubble starts to grow again which is called “rebound”. Rebound is due to the permanent gas in the bubble and lasts 3–5 times [23]. The rebounds of the cavitation bubble can also be illustrated by our former study [22].

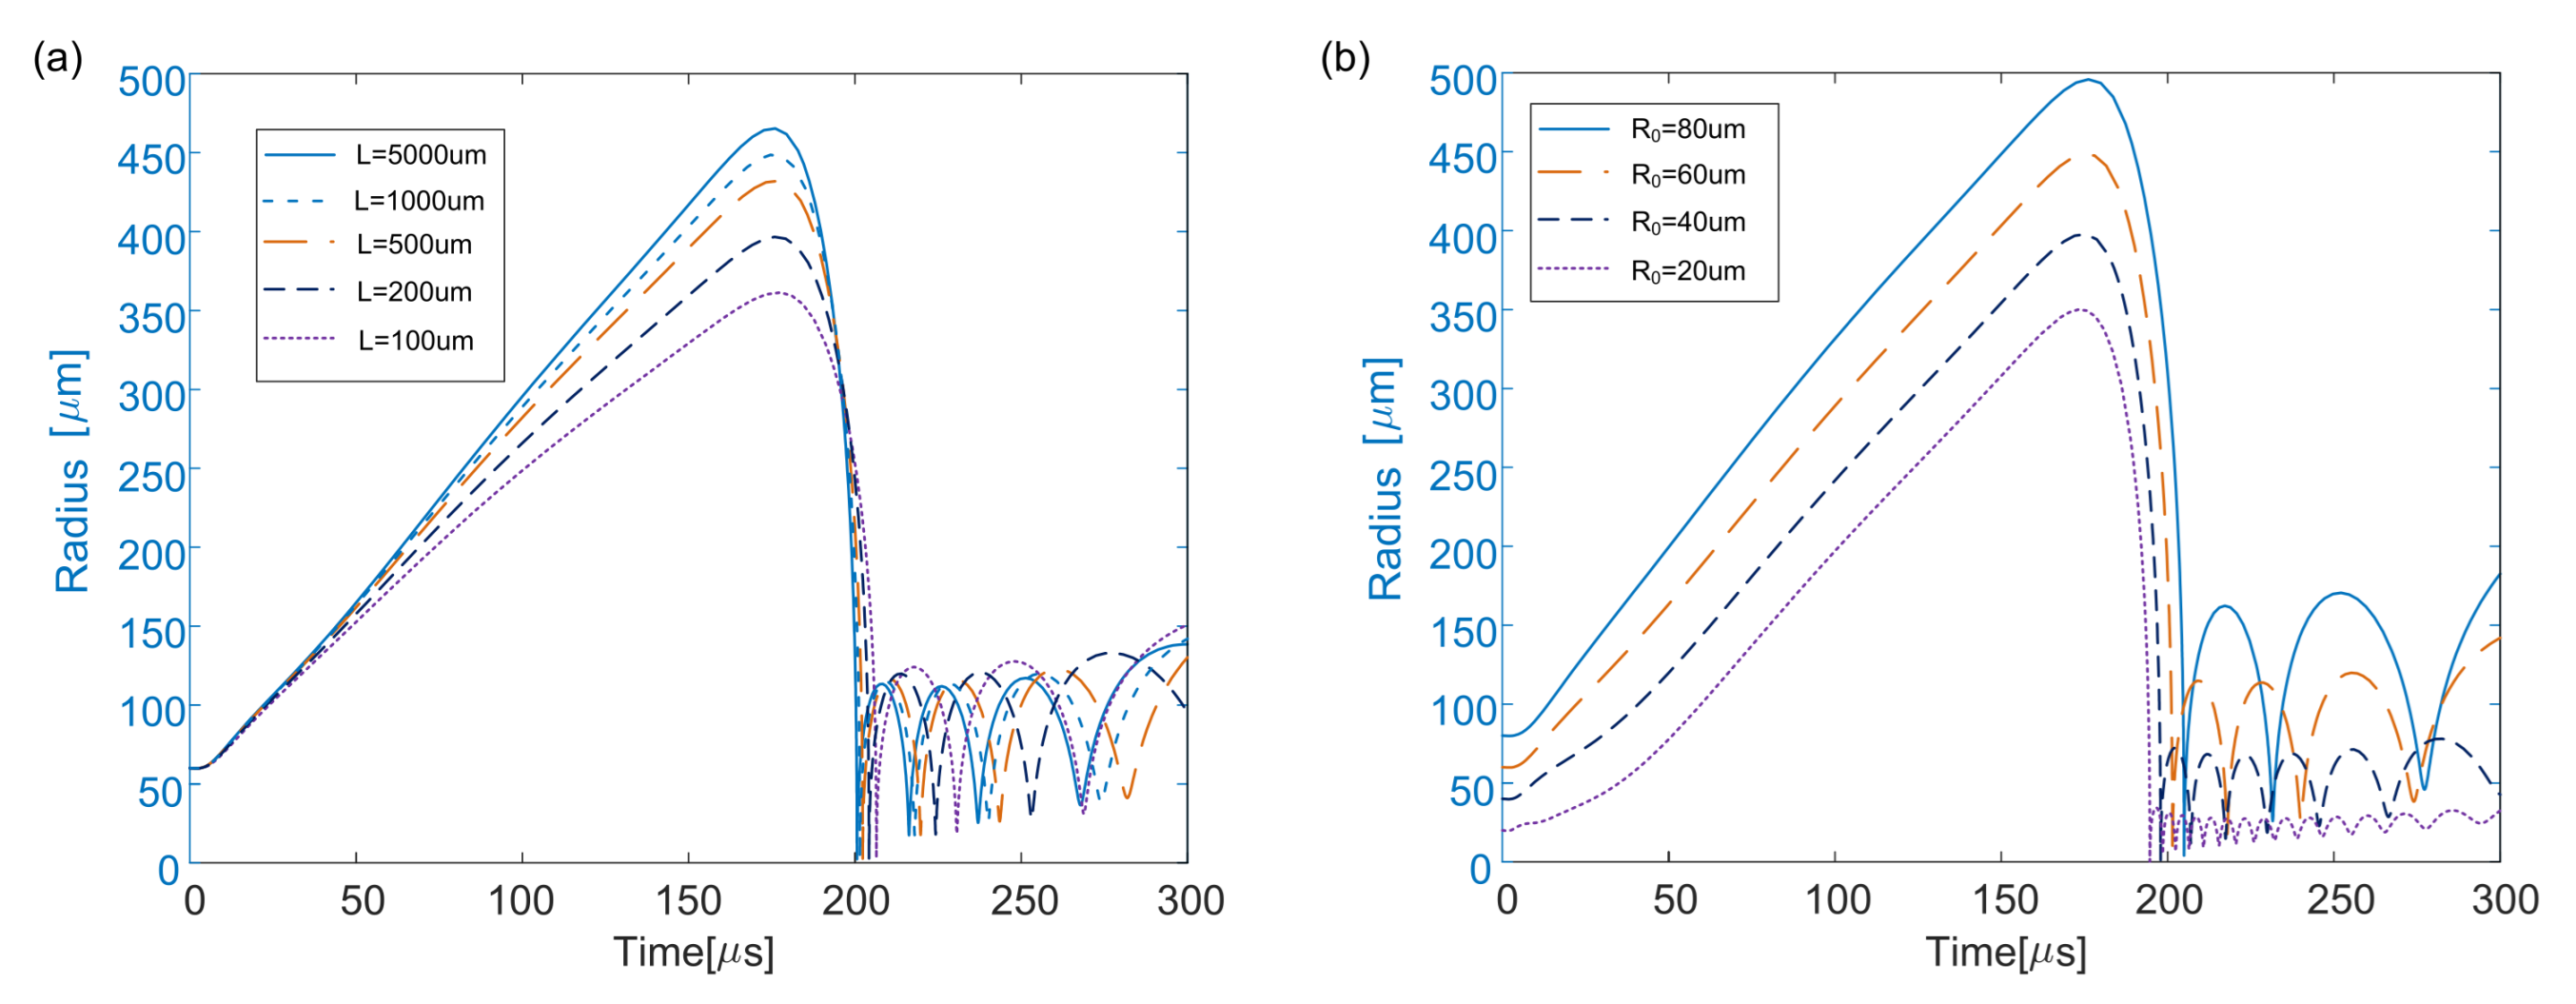
3.1. Influence of Bubble Position and Initial Radius on Bubble Evolution

Figure 3a shows the effect of relative position between bubble and boundary with an initial bubble radius of 30 μ m. When L decreases, which means the bubble locates closer to the plate, the speed of evolution of bubble radius slows down, the timing of bubble first shrunk comes later. The maximum bubble radius during evolution and collapsing duration (from maximum radius to first shrunk) decreases. There are more rebounds of bubble for larger L with nearly identical amplitudes. With the increase of L, the influence of L on radius is weakening, when L increases beyond L = 1000 μ m the influence on bubble radius evolution is almost stagnant. At constant distance L = 1000 μ m, the influence of different initial bubble radius is investigated as shown in Figure 3b. As can be seen, the bubble radius curves during expansion phase with different initial radius are almost parallel, which indicates that bubble expands at nearly the same speed. With the increase of initial bubble radius, the maximum bubble radius during evolution also increases. The maximum bubble radius corresponds to initial radius of 80 μ m, 60 μ m, 40 μ m, 20 μ m are 496 μ m, 449 μ m, 397.7 μ m and 350 μ m, which follows an arithmetic sequence with difference of 50 μ m. The life duration of bubble first shrunk is prolonged with larger initial radius. The amplitude and frequency of rebounding with different initial bubble radius varies substantially. The bubble of small initial radius rebounds more rapidly with smaller amplitude.

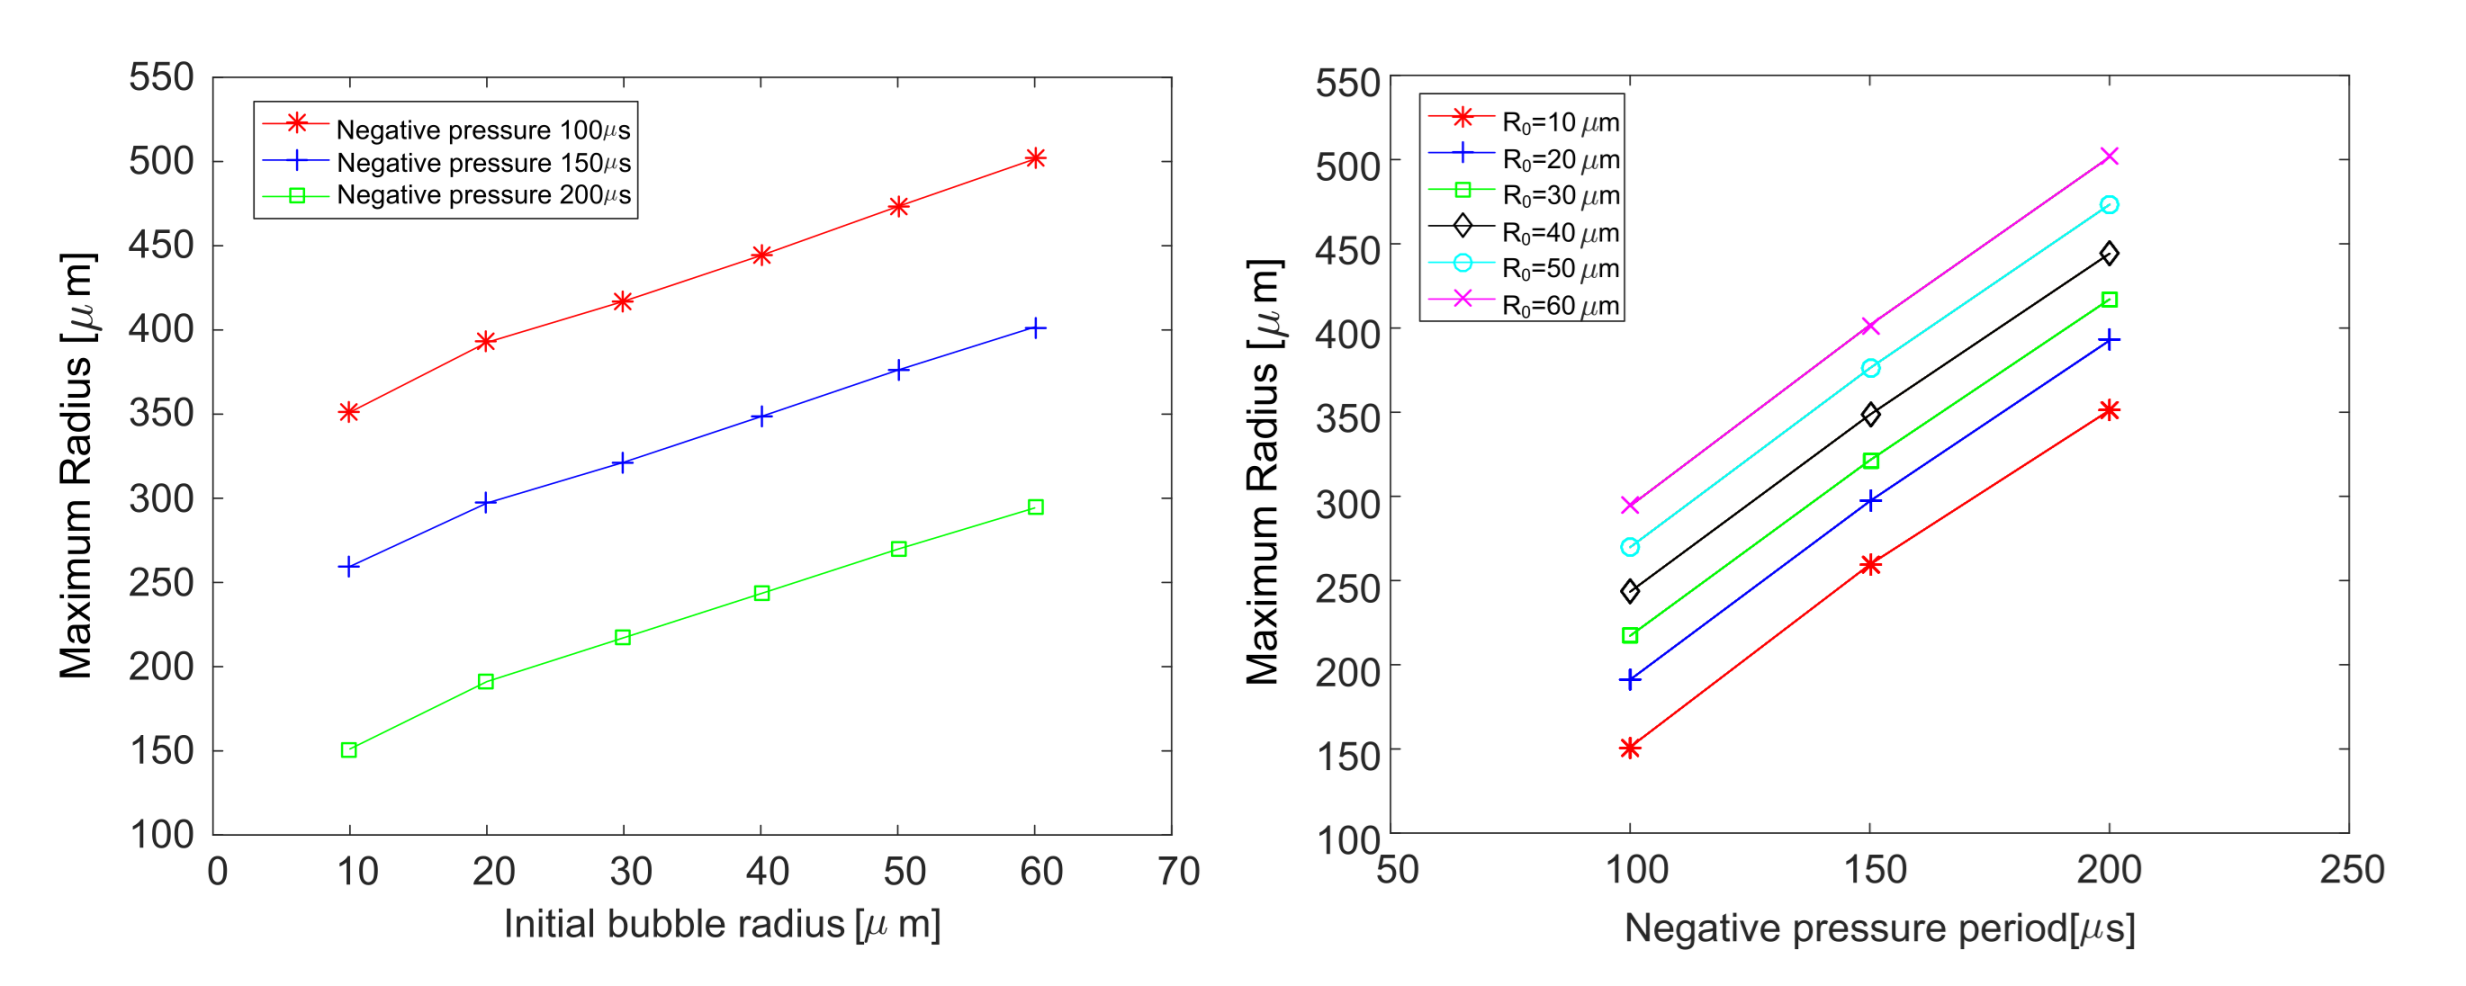
3.2. Influence of Negative Pressure Period

Acoustical cavitation is induced by pressure fluctuation which is brought by the vibration of solid boundaries. The pressure waveform determines the formation and evolution progress of cavitation bubble. The initiation and collapse timing of cavitation bubble are found to be related with location and boundary vibration velocities [18]. Negative pressure period is thought to be the reason. At different locations or with different vibration velocities, the negative pressure period is different which would eventually cause a diverse bubble evolution process. Therefore, the influence of the negative pressure period, as shown in Figure 4, on bubble formation and collapse is investigated.
The maximum bubble radius relates with the negative pressure period, and is indirectly affected by boundary vibration velocity and gap clearance. Figure 5 shows the maximum bubble radius changing with initial radius and standoff distance at different negative pressure period. The initial radius and standoff distance are set from 10 μ m to 60 μ m and 100 μ m to 5000 μ m, respectively. Generally the maximum radius increases with both initial bubble radius and standoff distance, therefore the maximum bubble radius appears when distance equals 5000 μ m and initial radius equals 60 μ m in this case. For 100 μ s negative pressure period, the peak of maximum radius is 301 μ m, while at 150 μ s, the peak maximum bubble radius is 414 μ m. The largest maximum radius is found to be 522 μ m at 200 μ s. The curve of maximum radius corresponding to 100 μ s is covered by 150 μ s, and curve of 200 μ s is on the top. The interval between them is about 100 μ m. Along the direction of distance, the maximum radius increases rapidly at beginning then slows down especially when distance is over 1000 μ m as shown in Figure 6. With larger negative pressure period, the slope of curve is more abrupt with distance under 500 μ m. With the increase of initial bubble radius, the variation rate of maximum radius keeps nearly the same level for different negative pressure period as shown in Figure 7. Generally, the maximum bubble radius increases with negative pressure period. With longer negative pressure period, evolution process of bubble extends, therefore the bubble radius has more time to grow. The maximum bubble radius increases with distance L, which coincides with Figure 3.

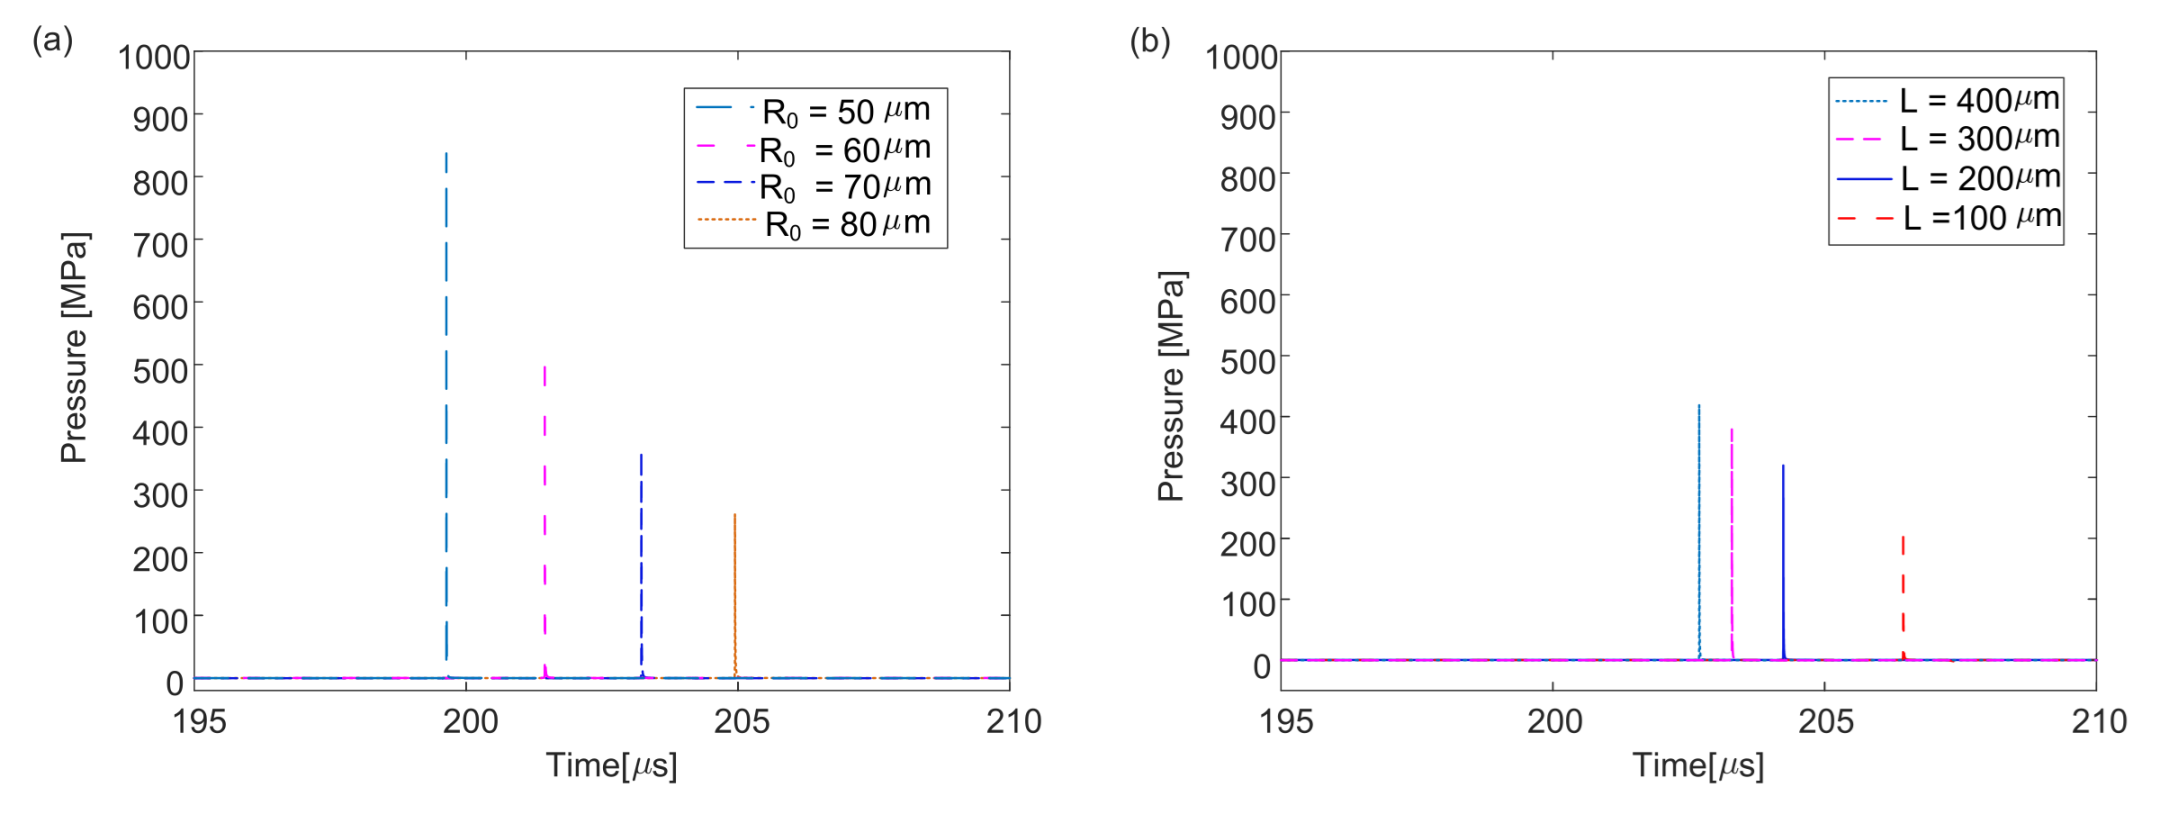
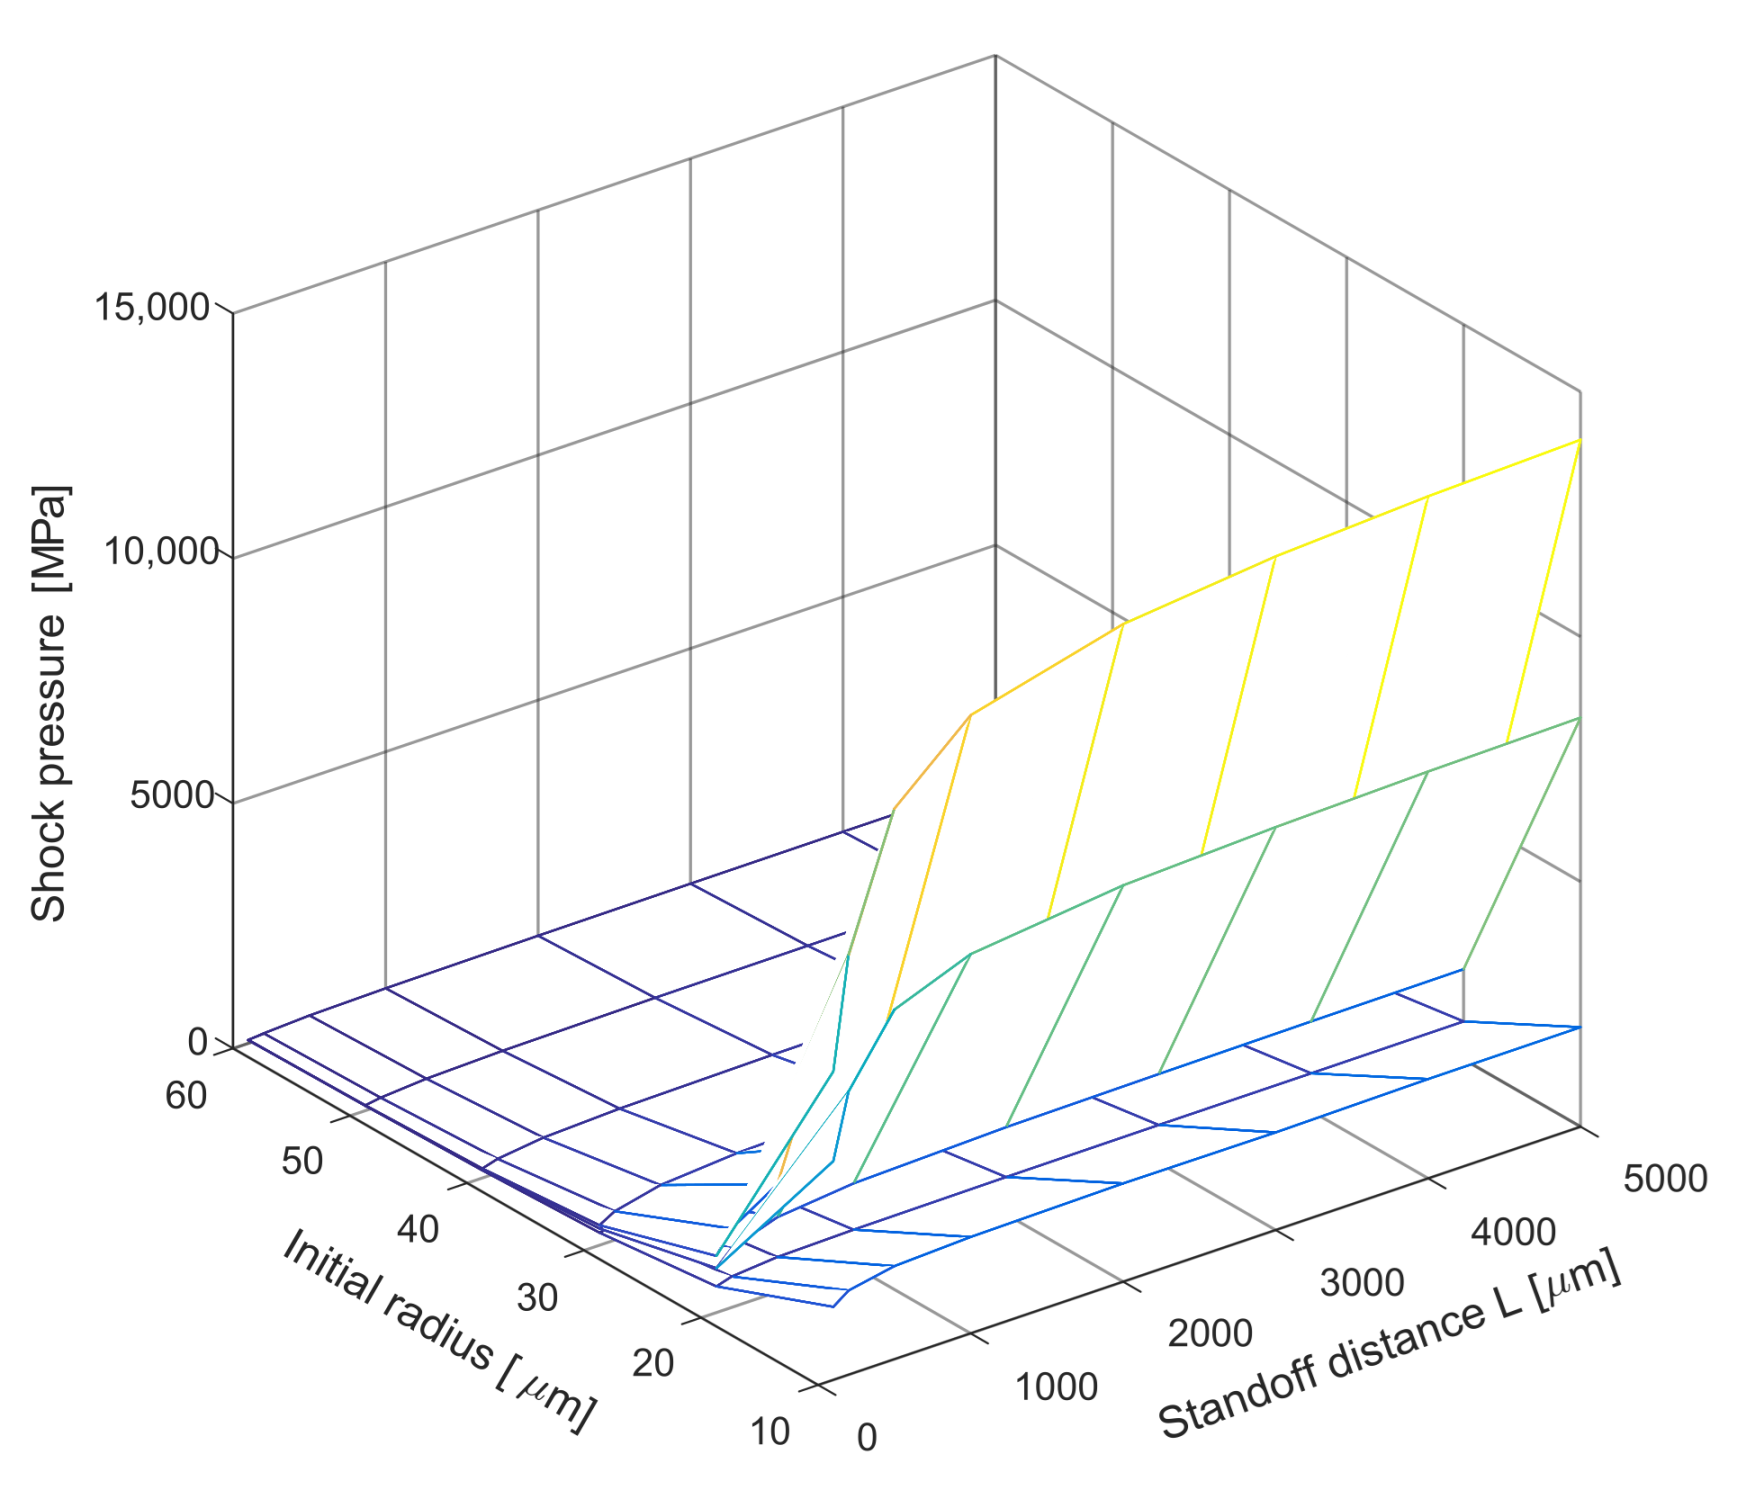
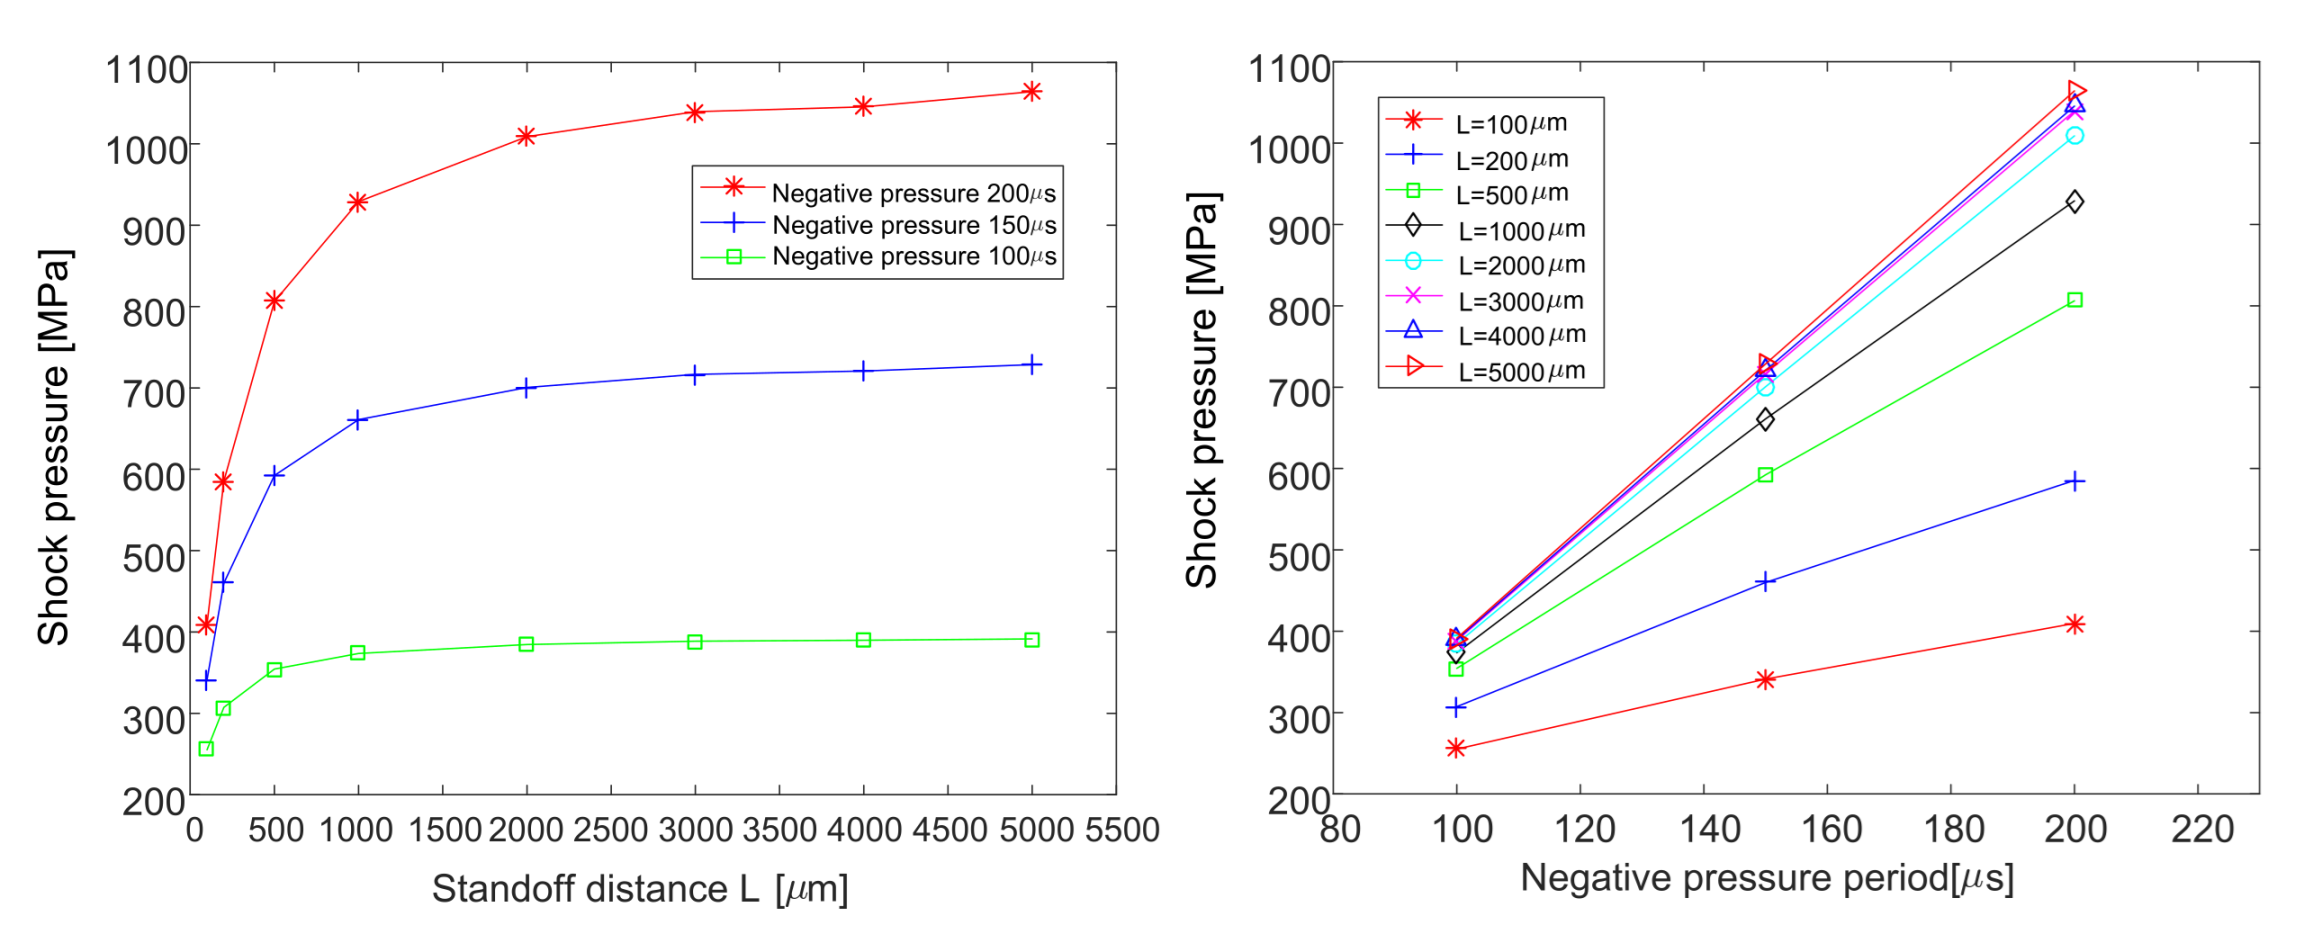
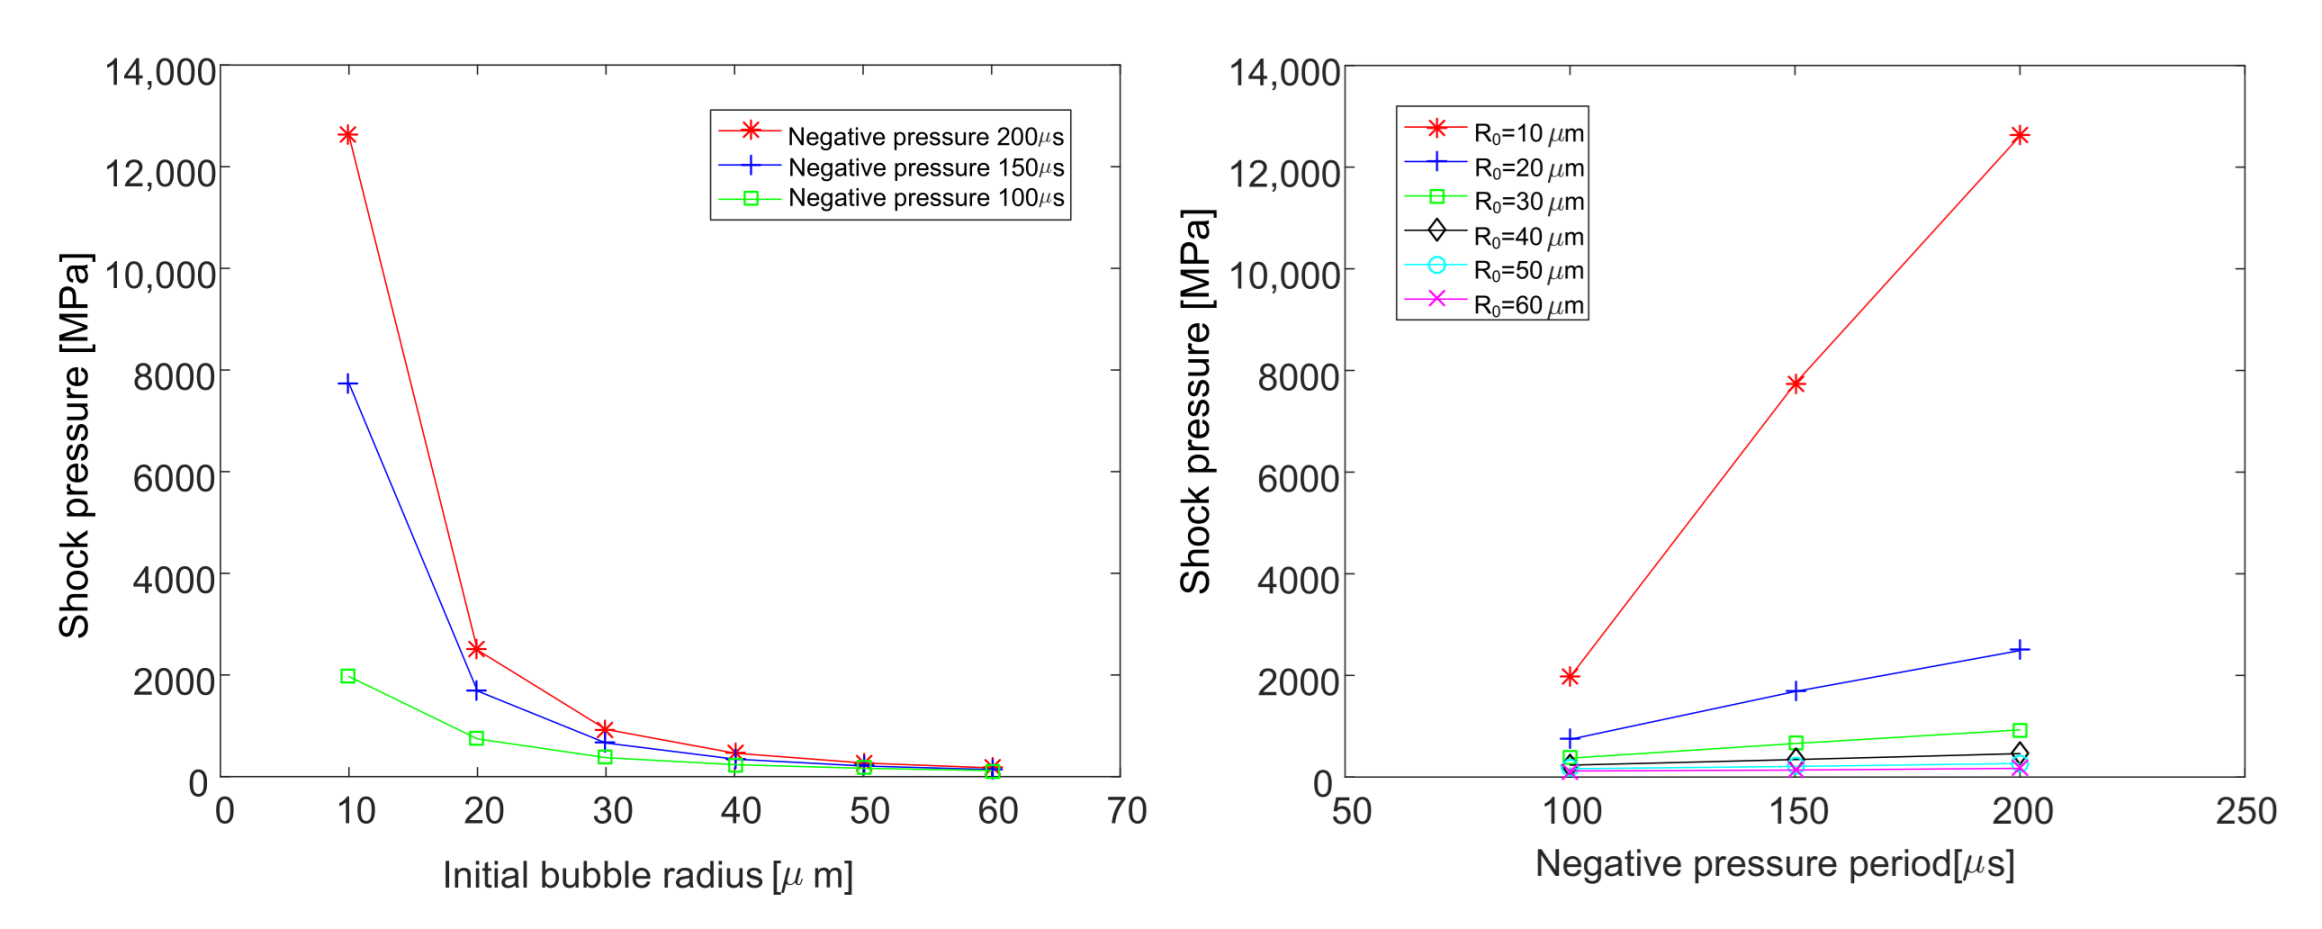
3.3. Shock Pressure during Bubble Collapse

The cavitation bubble initiates and grows under negative pressure. As pressure increases, the cavitation bubble is compressed to a small radius and releases big shock pressure up to tens of GPa [24], which penetrates the solid boundary. The effect of shock pressure depends on the ratio between standoff distance and maximum bubble radius. The shock pressure induced by the implosion of bubble is thought to be a major reason of cavitation erosion especially for bubbles with a radius of micro meters. Pioneering research work shows that shock pressure can be calculated by [6]:
P c o l l a p s e = P + P P v R 0 3 4 R 3 1 4 / 3 R 0 3 R 3 1 1 / 3
Through Equations (7) and (8), the effect of different factors on shock pressure of bubble can be evaluated. Figure 8 shows the influence of initial radius on shock pressure. As the initial radius rises, the shock pressure decreases and the timing of pressure pulse delays. With the rise of initial radius, the amplitude of shock pressure descends more slowly. As to standoff distance, the trend is contrary to initial radius as shown in Figure 8b. The shock pressure generally increases with standoff distance. As distances increases, the maximum pressure changes more slowly and tends to be flat. The existence of wall acts as an obstacle for spherical explosion for bubble. The timing of pressure pulse decreases with the rise of standoff distance. The changing rate of pressure pulse timing is slower with the increase of distance L.
The negative pressure period also has large impact on shock pressure. We evaluate the effect of negative pressure period on shock pressure along with initial bubble radius and standoff distance as shown in Figure 9. The shock pressure generally increases with negative pressure period, while the pattern is different from radius changing process. Therefore in this case, at (5000, 10) (which represents the point of 5000 μ m standoff distance and 10 μ m initial radius), the peak of shock pressure are 2031 MPa, 8349 MPa and 14,020 MPa, respectively, for negative pressure period of 100 μ s, 150 μ s and 200 μ s. The gap between curves of different negative pressure period increases with shock pressure. The increment of shock pressure from 150 μ s to 200 μ s at (100, 60) (lowest maximum shock pressure) and (5000, 10) (largest maximum shock pressure) are 1.5 MPa and 5670 MPa, respectively, which agrees with the trend of shock pressure. Under certain negative pressure period, the shock pressure increases with the decrease of initial radius and rise of standoff distance, which coincides with Figure 8. With the increase of distance, the growth rate of maximum radius decreases. The rate tends to be zero when distance is over 1000 μ m for the case of negative pressure period 100 μ s. With larger negative pressure period, the slope of the increasing curve of shock pressure is more abrupt with the increase of distance as shown in Figure 10. With the increase of the initial bubble radius, the descending rate of shock pressure also decreases and tends to be flat over 40 μ m of initial radius as shown in Figure 11. Shock pressure is more sensitive to a longer negative pressure period and smaller initial bubble radius, since the shock pressure and its changing rate is more significant at smaller initial bubble radii and longer negative pressure periods.

4. Conclusions

Under the action of slapping forces, the pressure fluctuation induced by the corresponding boundary vibration is characterized as a negative pressure period followed by an abrupt positive pressure, which is easy for cavitation bubble formation and collapse. The shock pressure released from explosion of bubble can reach tens of GPa, which is a main factor for material erosion damage. On the other hand, the existence of adjacent boundary also influences bubble evolution and shock pressure. The boundary vibration velocity or clearance of the gap between boundaries influences the period of negative pressure waveform and indirectly affects the bubble evolution and shock pressure. In this work, we deduced the mathematical model of bubble near solid boundary and examined the influence of initial bubble radius, standoff distance and negative pressure period on bubble evolution progress and shock pressure. It is shown that the maximum bubble radius increases with initial bubble radius, negative pressure period and standoff distance. The shock pressure increases with standoff distance and negative pressure period, while it decreases with the initial bubble radius.

Author Contributions

Conceptualization, X.W.; Data curation, S.Z.; Formal analysis, M.Y.; Software, Z.S.; Writing and original draft, X.W. All authors have read and agreed to the published version of the manuscript.

Funding

This research was funded by National Natural Science Foundation of China grant number 52005088 and Natural Science Foundation of Liaoning Province grant number 2020-MS-076 and Fundamental Research Funds for the Central Universities of China grant number N2003018.

Institutional Review Board Statement

Not applicable.

Informed Consent Statement

Not applicable.

Data Availability Statement

Not applicable.

Conflicts of Interest

The authors declare no conflict of interest.

References

  1. Williams, P.R.; Williams, P.M.; Brown, S.W.J. A technique for studying liquid jets formed by cavitation bubble collapse under shockwaves, near a free surface. J. Non Newton. Fluid Mech. 1997, 72, 101–110. [Google Scholar] [CrossRef]
  2. Lin, J.; Wang, Z.; Cheng, J.; Kang, M.; Fu, X.; Hong, S. Evaluation of cavitation erosion resistance of arc-sprayed Fe-based amorphous/nanocrystalline coatings in NaCl solution. Results Phys. 2019, 12, 597–602. [Google Scholar] [CrossRef]
  3. Rayleigh, L., VIII. On the pressure developed in a liquid during the collapse of a spherical cavity. Lond. Edinb. Dublin Philos. Mag. J. Sci. 1917, 34, 94–98. [Google Scholar] [CrossRef]
  4. Plesset, M.S. The dynamics of cavitation bubbles. J. Appl. Mech. 1949, 16, 277–282. [Google Scholar] [CrossRef]
  5. Noltingk, B.E.; Neppiras, E.A. Cavitation produced by ultrasonics. Proc. Phys. Soc. B 1950, 63, 674. [Google Scholar] [CrossRef]
  6. Franc, J.P.; Michel, J.M. Fundamentals of cavitation. In Fluid Mechanics and Its Applications; Springer: Amsterdam, The Netherlands, 2004; Volume 76, pp. 1–46. [Google Scholar]
  7. Lv, L.; Zhang, Y.; Zhang, Y.; Zhang, Y. Experimental investigations of the particle motions induced by a laser-generated cavitation bubble. Ultrason. Sonochem. 2019, 56, 63–76. [Google Scholar] [CrossRef] [PubMed]
  8. Ren, X.; He, H.; Tong, Y.; Ren, Y.; Yuan, S.; Liu, R.; Zuo, C.; Wu, K.; Sui, S.; Wang, D. Experimental investigation on dynamic characteristics and strengthening mechanism of laser-induced cavitation bubbles. Ultrason. Sonochem. 2016, 32, 218–223. [Google Scholar] [CrossRef] [PubMed]
  9. Cheng, F.; Ji, W.; Qian, C.; Xu, J. Cavitation bubbles dynamics and cavitation erosion in water jet. Results Phys. 2018, 10, 1585–1593. [Google Scholar] [CrossRef]
  10. Lauterborn, W.; Bolle, H. Experimental investigations of cavitation-bubble collapse in the neighbourhood of a solid boundary. J. Fluid Mech. 1975, 72, 391–399. [Google Scholar] [CrossRef]
  11. Joshi, S.; Franc, J.P.; Ghigliotti, G.; Fivel, M. Bubble collapse induced cavitation erosion: Plastic strain and energy dissipation investigations. J. Mech. Phys. Solids 2019, 134, 103749. [Google Scholar] [CrossRef]
  12. Blake, J.R.; Robinson, P.B.; Shima, A.; Tomita, Y. Interaction of two cavitation bubbles with a rigid boundary. J. Fluid Mech. 1993, 255, 707–721. [Google Scholar] [CrossRef]
  13. Stanley, C.; Barber, T.; Rosengarten, G. Re-entrant jet mechanism for periodic cavitation shedding in a cylindrical orifice. Int. J. Heat Fluid Flow 2014, 50, 169–176. [Google Scholar] [CrossRef]
  14. Thomas, J.; Ibrahim, M.; Robin, O.; Lawrence, A.; William, C.; Ronald, A. The acoustic emissions from single-bubble sonoluminescence. J. Acoust. Soc. Am. 1998, 103, 1377–1382. [Google Scholar]
  15. Kyuichi, Y.; Toru, T.; Manickam, S.; Yasuo, I. Theoretical study of single bubble sonochemistry. J. Chem. Phys. 2005, 122, 224706. [Google Scholar]
  16. Yamashita, T.; Ando, K. Low-intensity ultrasound induced cavitation and streaming in oxygen-supersaturated water: Role of cavitation bubbles as physical cleaning agents. Ultrason. Sonochem. 2019, 52, 268–279. [Google Scholar] [CrossRef]
  17. Tzanakis, I.; Eskin, D.G.; Georgoulas, A.; Fytanidis, D.K. Incubation pit analysis and calculation of the hydrodynamic impact pressure from the implosion of an acoustic cavitation bubble. Ultrason. Sonochem. 2014, 21, 866–878. [Google Scholar] [CrossRef]
  18. Yonezawa, T.; Senda, J.; Okubo, M.; Fujimoto, H.; Miki, H. Experimental analysis on the behavior of cavitation bubbles at cylinder liner erosion in diesel engines. J. Mar. Eng. Soc. Jpn. 1985, 20, 361–369. [Google Scholar] [CrossRef]
  19. Yonezawa, T.; Senda, J.; Saitou, M.; Yoshiki, K.; Fujimoto, H.; Miki, H. Analysis of cavitation on cylinder liner and cylinder block. J. Mar. Eng. Soc. Jpn. 1988, 23, 38–46. [Google Scholar] [CrossRef]
  20. Shima, A.; Tomita, Y. The behavior of a spherical bubble near a solid wall in a compressible liquid. Arch. Appl. Mech. 1981, 51, 243–255. [Google Scholar]
  21. Kozuka, T.; Hatanaka, S.; Yasui, K.; Tuziuti, T.; Mitome, H. Simultaneous Observation of Motion and Size of a Sonoluminescing Bubble (Short Note). Jpn. J. Appl. Phys. Part 1 Regul. Pap. Short Notes Rev. Pap. 2002, 41, 3248–3249. [Google Scholar] [CrossRef]
  22. Wang, X.; Zheng, Z.; Chen, Y.; Li, Y. Theoretical analysis of engine coolant cavitation with different additives based on ultrasonic induced bubble dynamics. Results Phys. 2019, 15, 102528. [Google Scholar] [CrossRef]
  23. Knapp, R.T.; Daily, J.W.; Hammitt, F.G. Cavitation; McGraw-Hill: New York, NY, USA, 1970. [Google Scholar]
  24. Lauterborn, W.; Vogel, A. Shock Wave Emission by Laser Generated Bubbles. In Bubble Dynamics & Shock Waves; Delale, C.F., Ed.; Springer: Berlin/Heidelberg, Germany, 2013; pp. 67–103. [Google Scholar]
Figure 1. Sketch of bubble model near solid boundary.
Mathematics 09 02064 g001
Figure 2. Slap pressure and the induced bubble radius evolution. (a) Pressure induced by slap forces. (b) Comparison of bubble radius between measurement and calculation.
Mathematics 09 02064 g002
Figure 3. Influence of distance and initial bubble radius on bubble evolution. (a) Influence of distance on bubble evolution. (b) Influence of initial bubble radius on bubble evolution.
Mathematics 09 02064 g003
Figure 4. Different negative pressure period of driving pressure.
Mathematics 09 02064 g004
Figure 5. Influence of negative pressure period, standoff distance and initial bubble radius on bubble evolution.
Mathematics 09 02064 g005
Figure 6. Relation between negative pressure and standoff distance on maximum bubble radius at constant initial radius 30 μ m.
Mathematics 09 02064 g006
Figure 7. Relation between negative pressure and initial bubble radius on maximum bubble radius at constant standoff distance 1000 μ m.
Mathematics 09 02064 g007
Figure 8. Influence of distance and initial bubble radius on shock pressure. (a) Influence of standoff distance on shock pressure. (b) Influence of initial bubble radius on shock pressure.
Mathematics 09 02064 g008
Figure 9. Influence of negative pressure period, standoff distance and initial bubble radius on maximum shock pressure.
Mathematics 09 02064 g009
Figure 10. Relation between negative pressure and initial bubble radius on maximum shock pressure at constant standoff distance 1000 μ m.
Mathematics 09 02064 g010
Figure 11. Relation between negative pressure and initial bubble radius R 0 on maximum shock pressure at constant standoff distance 1000 μ m.
Mathematics 09 02064 g011
Publisher’s Note: MDPI stays neutral with regard to jurisdictional claims in published maps and institutional affiliations.

