Article

Analysis of the Use of a Wind Turbine as an Energy Recovery Device in Transport Systems

by
Francisco Rubio
* and
Carlos Llopis-Albert
Instituto de Ingeniería Mecánica y Biomecánica, Universitat Politècnica de València, Camí de Vera s/n, 46022 Valencia, Spain
*
Author to whom correspondence should be addressed.
Mathematics 2021, 9(18), 2265; https://doi.org/10.3390/math9182265
Submission received: 19 July 2021 / Revised: 9 September 2021 / Accepted: 10 September 2021 / Published: 15 September 2021
(This article belongs to the Special Issue Mathematical Problems in Mechanical Engineering)

Abstract

:
A wind turbine can act as an energy recovery device (ERS) in a comparable way to brakes (regenerative braking). When the velocity of a vehicle changes, the amount of energy related to it also changes. When its velocity decreases, the energy tends to dissipate. Over time, this dissipated energy has been ignored. For example, during the braking process, the kinetic energy of the vehicle was converted into heat. In recent years, society’s greater awareness of climate change, pollution, and environmental issues has led to a great deal of interest in developing energy recovery systems. It allows the recovery of kinetic energy from braking (KERS), resulting in consumption reductions (efficiency gains) of up to 45%. The usefulness of installing a wind turbine as an energy recovery device is analysed, evaluating the savings that can be achieved with its two possible working modes: as an energy recovery device and as a system for utilizing aerodynamic force. The wind turbine has a horizontal axis and a diameter of 50 cm and is installed on the front of a vehicle. This vehicle will undergo three particular driving schemes, which will operate under different experimental conditions and operational parameters characterized by speeds, accelerations, stops, and driving time. The results clearly show the advantages of using the proposed technology.

1. Introduction

Internal combustion engine vehicles are affected by two major problems, which have become worse over time: the scarcity of fossil fuels and the consequences of the associated pollution for the environment and for human health.
Therefore, this type of vehicle does not ensure sustainable transport in the medium and long term.
The development of renewable energy systems has attracted the interest of both academics and governments. Not only would it provide a practically inexhaustible source of energy, but it would also help protect the environment and human health by reducing emissions of greenhouse gases (CO2) and nitrogen and sulphur compounds that are harmful to health.
This article will analyse the use of wind energy applied to motor vehicles and the impact that the use of microturbines installed in an RBK electric vehicle has on the generation of electrical energy and its use in the vehicle’s services, contributing to sustainable, environmentally friendly transport.
The use of wind energy applied to motor vehicles has important implications for environmentally friendly sustainable development. It is in line with the 2015 Paris Agreement [1], providing significant support for renewable energy, and with the European Union’s 2030 Climate and Energy Framework [2].
It would help reduce dependence on fossil fuels as a traditional energy source. The depletion of oil reserves due to the high global demand for oil should also be stressed. Some scientists claim that oil reserves could be depleted within the next 40–60 years [3].
It would help in the fight against climate change and global warming to reduce not only greenhouse gas emissions (CO2) but also other by-products of combustion that are harmful to health (predominantly unburned particulate matter, nitrous oxides, and sulphur compounds). It would also help maintain the environment and preserve natural ecosystems. According to the European Environment Agency (EEA, 2019), an average family car emits approximately four tonnes of carbon dioxide per year, while a van or four-wheel drive vehicle emits up to six tonnes of carbon dioxide per year.
The transport sector plays a major role in the amount of CO2 emitted into the atmosphere. According to the European Environment Agency, it is responsible for approximately 26% of these emissions [4]. To reduce the environmental impact of transport in Europe, including greenhouse gases, several sectoral targets have been set as part of the EU’s overall objective of reducing greenhouse gas emissions by 80–95% by 2050 (see [2,5]).
In developed countries, governments encourage car manufacturers and research institutes to develop new vehicles with alternative renewable energy sources [6].
Wind energy is one of the most popular renewable energy resources. According to the “Global Wind Energy Report 2016” published by the World Wind Energy Association (WWEA) and the International Energy Agency’s “Global Energy and CO2 Status Report: Renewables”, it could provide 20% of the world’s electricity by 2030 [7,8].
Wind energy needs to be redirected towards the transport sector in general and the automotive sector in particular.
Wind turbines were not incorporated into motor vehicles as driving power generators until the 21st century. So far, this century, three main schools or trends have developed in the use of wind power as a source of energy to move vehicles in general. At the same time, theoretical studies have been carried out on its viability.
Wind has long been used as an energy source. In [9], the authors briefly review its use throughout history, from its role in maritime navigation to windmills and the aviation industry in the 20th century. In this article, the authors focus on calculating the motive forces generated in wind-powered vehicles.
In 2009, Mark Drela, a professor at the MIT, obtained the first equations linking the speed of a boat to wind speed, demonstrating the feasibility of using wind energy to propel it [10]. Other authors have also reached the same conclusion regarding cars [11,12]. In these studies, they analysed—from a theoretical point of view—how to convert wind energy directly into mechanical energy and move the vehicle by means of gears and pulleys.
In [11], Gaunaa et al. investigate the use of a wind turbine in a car that moves relative to the medium, identifying problems related to the practical implementation of wind turbines in a car. One of the most interesting conclusions is that it is possible to build a wind-powered car that can drive directly against the wind. This is a theoretical study and lacks experimentation to quantify the energy used and/or recovered by the vehicle. These studies fall into the school that considers wind power as a primary energy source and its use alone to move a vehicle (car, boat, etc.) directly by means of gears and pulleys.
At the end of the first decade of the 2000s, numerous attempts were made to create exclusively wind-powered cars. In 2008, a group of German students from the University of Stuttgart built a wind-powered car called the Ventomobile [13]. It had a two-metre wind turbine with two blades on top. It had three wheels and a design that was more like a bicycle than a car. Many consider this construction to be the first car to run exclusively on wind power, the energy generated by the wind.
This model was followed by the Spirit of Amsterdam, which won the Racing Aeolus competition for wind-powered vehicles in 2010. Nine teams from different countries (the Netherlands, the UK, Denmark, etc.) took part. It used a wind turbine to harness wind energy by converting it directly into mechanical energy. This vehicle could move at 24 km/h in an 80 km/h wind. Additionally, in 2010, the Blackbird [14] worked along the same lines, reaching a speed of 44.6 km/h in 16 km/h winds, almost three times the wind speed. However, although they made significant advances, they did not surpass the Greenbird, another wind-powered vehicle that broke the land speed record in 2009, reaching a top speed of 202.9 km/h [15]. The disadvantage of these vehicles is that they need wind to work.
When designing a wind energy capturing device for a car, the size of the device is an important design criterion. The research by Yuji and Takashi [16] highlighted the importance of this parameter.
In [17], the authors study the use of an electric generator to produce electricity on a small scale and conclude that a car alternator can be used as a wind turbine generator.
Next came the Wind-explorer (2011), but with a different operating philosophy, giving way to the second school of “thought” on this subject. It is a lightweight electric vehicle powered by electricity-generating wind turbines. This experience led to the idea of using a portable wind turbine to drive a motor vehicle by converting wind energy into electrical energy.
The different versions of the Mercedes-Benz Formula Zero move along these lines. It introduces energy efficiency as an integral part of the competition. The Formula Zero Racer features technology designed to extract the maximum thrust from the electric hub motors, aero-efficient solar skin and high-tech rigid sail.
Another vehicle, the Ventile, was unveiled at the 2011 Michelin Challenge Design (an annual contest to devise the car of the future) [18]. It has a small petrol engine and an electric motor connected to a wind turbine that turns the vehicle’s wheels, which, in turn, become small air generators that help charge the batteries. During movement, the batteries are recharged.
The electric Lamborghini Countach [19] is based on obtaining part of its energy from solar panels and wind generators mounted on the car itself. Like many of the other models mentioned in this section, it has remained a design prototype.
In [20], the authors propose a vehicle mounted wind turbine (VMWT) as a system for generating electricity from the vehicle itself.
They conclude that up to 200 W of electricity can be acquired from a single vehicle (<80 km/h). This power can be easily stored for later use. Some drag force is also produced, so it is recommended to follow the Betz limit in more detail.
The corresponding technologies have given rise to a multitude of patents, as in [21,22,23], to mention some of the most promising ones.
In 2015 came the Eolo, an all-electric vehicle with a very special feature: two large front air inlets that operate a wind turbine. It has a range of 110 km, and 8% of this range is provided by the wind turbine. The latest prototype of this vehicle is expected to go into operation in 2019.
It is not the only one. In the wake of the creation of these wind-powered vehicles, 2017 saw the launch of the Tesla T1, a prototype created by students at the IED in Barcelona. It belongs to what could be called the third school, which promotes the creation of devices on vehicles that act like the wings of an aeroplane, so it is the pressure difference created in these devices that directly moves the vehicle. The Tesla T1 is an electric race car that adapts a wind power system to produce energy based on a Gorlov vertical axis wind turbine. It runs on a mixture of electric and wind power. The idea is that it has an electric battery that is used to start the car, and the air generated by the car’s own movement is then responsible for continuing to increase the car’s acceleration [24]. As yet, it remains a prototype.
At the 2018 Geneva Motor Show, a Chinese company (Techrules) presented the Ren Supercar, an innovative Turbine Recharge Electric Vehicle (TREV) system. The TREV system is a new hybrid propulsion technology comprising a turbine generator. It combines extensive experience in aviation and electric vehicle technologies with various technical innovations, offering high levels of efficiency and performance and an extremely low environmental impact. Its feasibility remains to be tested.
Technically, when a vehicle is in motion, it is subjected to the force of wind flow (a more stable wind is induced than natural wind) over the bodywork, creating an “aerodynamic” force. The possibility of using this force in petrol, diesel, electric or hybrid cars would reduce conventional energy consumption, with benefits for both the environment and the life of the vehicle itself. The wind energy generated during movement could be harnessed through the appropriate use of microturbines. These would help to generate electrical energy to meet the needs of the vehicle. However, it should be kept in mind that the introduction of a microturbine in a car can increase the aerodynamic force on the car, thus increasing the energy consumption to keep the vehicle moving; it could, therefore, be counter-productive.
A key issue is to determine the difference in the aerodynamic drag coefficient of the vehicle with and without a microturbine. If this difference is favourable when the microturbine is introduced, the energy input will be positive [25]. A vehicle-mounted wind turbine is presented in [20]. A horizontal axis turbine is used, and its efficiency is compared with that of a vertical axis turbine, concluding that it performs better.
Apart from the numerous vehicle prototypes mentioned above and the theoretical studies carried out, it is important to bear in mind the solutions provided by patents aimed at harnessing wind energy to move vehicles. Many devices, turbines, etc. have been designed, but most of these patents are theoretical proposals without an experimental basis to support them. As an example of these, it is worth mentioning that [26] uses air entering through the front grille of a vehicle while in motion to produce electrical energy. This is achieved by installing blades attached to the rotor shaft of an electric generator behind the grille, transversally to the car’s axle. When the vehicle is in motion, the air entering through the grille will hit the blades, generating a movement that will be transmitted to the rotor shaft, thus starting the generators that produce electrical energy, which is then used to recharge the electric vehicle’s batteries. Additionally, [27] describes an apparatus consisting of a turbine with three or more blades and a generator mounted on top of an electric motor vehicle to convert wind energy into electrical energy in order to power the vehicle’s batteries; [23] presents a device for converting wind energy into electrical energy to power a vehicle. The device includes a wind turbine situated outside the vehicle and a generator inside. When the vehicle is in motion, the wind hits the wind turbine and causes the generator to rotate, converting the rotational energy from the wind into electrical energy. The electrical energy powers the vehicle’s systems and batteries.
The list of related research extends. One of the latest works comes from Fathabadi [28] and Rubio [29]. Fathabadi analyses the use of a wind turbine to recover part of the kinetic energy of a motor vehicle. Rubio presents the basis of a theoretical study about how much energy can be retrieved using a wind turbine and the viability of electricity generation in electric vehicles by means of wind turbines.
In this paper, we will carry out an analysis of the feasibility and energy recovery capacity and an energy balance resulting from the use of microturbines in motor vehicles.
Section 2 provides the basis for this analysis. In Section 3, the different driving modes and the forces involved during these modes are studied. In Section 4, the results are studied, and the power consumed by the vehicle in each driving scenario is analysed. Finally, the relevant conclusions are drawn.
Based on the analysis carried out in this article, it is shown that it is possible to recover energy while a motor vehicle is running, using a wind microturbine as a renewable energy source for sustainable transport in vehicles, especially in electric vehicles.

2. Materials and Methods

It is very important to consider the operating cycle of a motor vehicle in terms of stops, starts, speeds reached, accelerations, and the times of each of these situations that a motor vehicle undergoes while driving. These cycles will determine, on one hand, the power consumed by the vehicle and, on the other, the power that can be recovered by the wind microturbine.
In order to carry out the appropriate calculations, three driving scenarios will be analysed, corresponding to the most common characteristics of the aforementioned driving cycles. Each of these scenarios is characterized below.

2.1. First Driving Scenario

The first driving scenario is equivalent to a WLTP (world harmonized light-duty vehicle test procedure) cycle, which is a standard for determining the levels of pollutants and fuel consumption of motor vehicles developed by the Economic Commission (Europe) with the aim of replacing the NEDC (New European Driving Cycle) as the European vehicle approval procedure. In this scenario, the vehicle is driven for 30 min with specific characteristics in terms of speed, acceleration, and route. A distance of 23.27 km must be covered, and accelerations from 0 to 50 km/h must be achieved in 5 to 10 s. The aim is to determine the power needed to move the vehicle under the required driving conditions.
To be more precise, the WLTP cycle consists of 4 phases, and it lasts for 30 min:
  • Low velocity (589 s–9.18 min); maximum velocity (Vmax) of 56.5 km/h
  • Medium velocity (433 s–7.22 min); Vmax of 76.6 km/h
  • High velocity (455 s–7.58 min); Vmax of 97.4 km/h
  • Extra-high velocity (323 s–5.38 min); Vmax of 131.3 km/h
The types of driving simulated cover (see Table 1) city (urban), minor road (suburban), main road, and highway.
On the highway, the maximum velocity is 131 km/h and the average velocity of the protocol is 46.5 km/h.

2.2. Second Driving Scenario

The second driving scenario is equivalent to an entirely urban (city) driving with a set of characteristics that cover a cycle time of 20.25 min, a driving time of 15.55 min, a stop duration of 4.7 min, a distance travelled of 8.84 km, and a maximum velocity of 50 km/h.
Throughout the journey, the vehicle faces uphill gradients, downhill gradients, accelerations (accel), decelerations (decel), constant velocity (v_const), and stops.
The duration and velocity characteristics for each interval are shown in Table 2.

2.3. Third Driving Scenario

This scenario is equivalent to an interurban (highway) driving with a set of characteristics that cover a cycle time of 1.7 h, a driving time of 1.7 h, a stop duration of 0 min, a distance travelled of 198.79 km, and a maximum velocity of 120 km/h.
Throughout the journey, the vehicle faces uphill gradients, downhill gradients, accelerations and decelerations.
The duration and velocity characteristics for each interval are shown in Table 3.

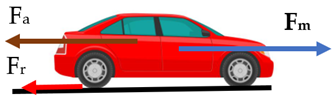
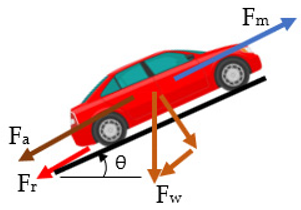
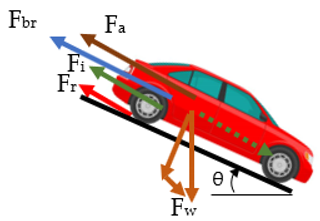
2.4. Driving Modes and Forces Acting on the Vehicle

Table 4 shows the vehicle driving modes and the braking force required to drive the vehicle under the set of conditions defined in their corresponding driving mode.
Where the forces that are considered in driving the car are:
  • F m = Motor   force
    F i = Inertial   force
    F r = Rolling   force
    F a = Aerodynamic   force
    F w = Weight   proyected   in   the   motion   direction
    F b r = Braking   force
    W = Weight   of   the   vehicle
    m = Mass   of   the   vehicle
    v = Velocity   of   the   vehicle
    g = Gravity
    a = Acceleration   of   the   vehicle
    f r = Coefficient   of   rolling   resistance
    θ = Angle   of   the   uphill   or   downhill   slope
    C = Aerodynamic   coefficient
    ρ = Air   density
The value of these forces is calculated using the following expressions:
F i = m · a
F r = f r · W · c o s θ = f r · m · g · c o s θ
F a = 1 2 · ρ · C · A · v 2
F w = W · s i n θ = m · g · s i n θ
The motor force and braking force are obtained as a function of the driving mode for each section of the vehicle.
F m = F i + F r + F a + F w
F b r = F i ± F w + F r + F a
The motor power and the power dissipated by the vehicle during braking is calculated using the following equation:
P m = F m · v or P b r = F b r · v  

3. Results: Analysis of Power Consumed and Power Recovered

This section may be divided by subheadings. It should provide a concise and precise description of the experimental results, their interpretation, as well as the experimental conclusions that can be drawn.
The results and power analysis were carried out on an Opel Ampera-e vehicle. The characteristics of the vehicle and the parameters employed in the calculation of the forces acting on it are shown in Table 5.
In Table 5, A represents the front area of the vehicle; C is the aerodynamic coefficient; m is the vehicle mass; θ stands for angle of the uphill or downhill slope; ρ is the air density; and g corresponds to the gravitational acceleration.
The coefficient of rolling resistance, which is used in Equation (2), is calculated as follows:
f r = 0.01 · ( 1 + V 160 )
where V is given in km/h and has been considered to calculate the rolling resistance force. This equation has been proposed by Rubio and Llopis-Albert (2019).
The air density value is ρ = 1.25 kg/m3 at atmospheric pressure and 15 °C, and θ corresponds to the uphill and downhill slopes. The slopes are shown in Table 2 and Table 3.
The acceleration in each case has been calculated by means of the equations of uniformly accelerated rectilinear motion, considering the initial and final velocity and the time taken.
The engine power and braking power needed to drive in consonance with the driving characteristics described for each scenario are calculated from the analysis of the values obtained in Scenario 1 and Table 2 and Table 3. In these scenarios, the driving modes shown in Table 4 have been considered.
The engine power has an influence on the energy consumed by the vehicle to keep the desired driving characteristics. Braking power corresponds to the power dissipated as heat to keep the vehicle’s velocity. It occurs when the brakes are involved in regulating the movement.
The dissipated power can be converted back into recovered energy by means of regenerative braking. In this study, its recovery using a wind turbine is proposed.
The values obtained for the engine power and dissipated power are shown in Table 6 and Table 7.
In order to achieve the energy recovery rates shown in Table 7 it must be kept in mind that a wind turbine is being used. The area of the turbine used to recover energy must be equivalent to the front surface of the vehicle and the aerodynamic coefficient.
Therefore, A t = A · C = 0.704   m 2 .
In order to achieve a more compact design, a turbine of radius R = 0.35 m will be used. This value of R allows us to install two energy recovery turbines attached to the front of an Opel Ampera-e vehicle.
The area provided by this turbine is A t = 0.3848   m 2 .

4. Discussion

To calculate the real energy recovery conditions, the following performances are considered:
η1: performance of the wind turbine. Betz limit. It is considered 0.5926.
η2: performance of the multiplier. It is considered 0.98.
η3: performance of the generator. It is considered 0.9.
η: overall performance of the wind turbine–multiplier–generator system. It is calculated as follows:
η = η 1 · η 2 · η 3 = 0.5227
The power that can be generated by this turbine is:
P = η · 1 2 · ρ · A t · v 3
The real recovered power data is calculated from the above considerations, as shown in Table 8.
The values in Table 9 are obtained with the data provided in Table 8.

5. Conclusions

Based on the analysis carried out in this article, it can be concluded that it is possible to recover energy while a motor vehicle is running, using a wind microturbine as a renewable energy source for sustainable transport in vehicles, especially in electric vehicles.
There are two driving situations that allow energy recovery. In the first, braking occurs due to driving requirements, and the system works in a similar way to a regenerative braking system (KERS). When the vehicle stops accelerating, the relative motion of the air activates the microturbine, reusing the kinetic energy of the decelerated vehicle in the form of electricity and preventing all the kinetic energy from being dissipated in the form of heat. In the vehicle’s second driving situation, use is made of the difference between the velocity of the vehicle and the medium due to relative motion. The air drives the microturbine, which allows the wind energy generated due to the difference in velocities to be converted into electricity.
The percentages of power recovered for the driving scenarios described in the article are summarised in Table 9. The highest energy recovery capacity occurs in scenario 3, which corresponds to interurban driving with 4.97%, considering only the regenerative braking system, followed by scenario 1 (mixed driving) with 3.71% and, finally, scenario 2 (urban driving) with 1.14%. Considering the aerodynamic forces too, these percentages increase to 33.5%, 23.74%, and 6.35%, respectively.

Author Contributions

Conceptualization, F.R.; methodology, F.R.; validation, F.R. and C.L.-A.; formal analysis, F.R. and C.L.-A.; investigation, F.R.; resources, F.R. and C.L.-A.; data curation, F.R. and C.L.-A.; writing—original draft preparation, F.R. and C.L.-A.; writing—review and editing, F.R. and C.L.-A.; visualization, C.L.-A.; supervision, F.R. All authors have read and agreed to the published version of the manuscript.

Funding

This research received no external funding.

Institutional Review Board Statement

Not applicable.

Informed Consent Statement

Not applicable.

Data Availability Statement

The data that support the findings of this study are available on request from the corresponding author, F.R.

Conflicts of Interest

The authors declare no conflict of interest.

References

  1. Paris Agreement. 2015. Available online: https://ec.europa.eu/clima/policies/international/negotiations/paris_en (accessed on 15 December 2020).
  2. 2030 Climate and Energy Framework. Available online: https://ec.europa.eu/clima/policies/strategies/2030_en (accessed on 15 December 2020).
  3. Las Reservas de Petróleo en el Mundo. 2019. Available online: https://www.rinconeducativo.org/es/recursos-educativos/las-reservas-de-petroleo-en-el-mundo (accessed on 3 February 2021).
  4. European Environment Agency. 2019. Available online: https://www.eea.europa.eu/es/themes/transport (accessed on 20 January 2021).
  5. European Commission, Energy, Climate Change, Environment, Climate Action, EU Action, Climate Strategies and Targets, Long-Term Strategy for 2050. Available online: https://ec.europa.eu/clima/policies/strategies/2050_es#tab-0-1 (accessed on 20 January 2021).
  6. Commission on Science and Technology for Development, Economic and Social Council, United Nations. 2018. Available online: https://unctad.org/meetings/es/SessionalDocuments/ecn162018d2_es.pdf (accessed on 1 February 2021).
  7. Renovables: La respuesta está en el viento, BBVA Research. 2017. Available online: https://www.bbvaresearch.com/publicaciones/renovables-la-respuesta-esta-en-el-viento/ (accessed on 3 February 2021).
  8. Global Energy and CO2 Status Report: Renewables. International Energy Agency. 2019. Available online: https://www.iea.org (accessed on 3 February 2021).
  9. Mirzaei, P.A.; Rad, M. Toward design and fabrication of wind-driven vehicles: Procedure to optimize the threshold of driving forces. Appl. Math. Model. 2013, 37, 50–61. [Google Scholar] [CrossRef] [Green Version]
  10. Drela, M. Dead-Downwind Faster than the Wind (DFTTW) Analysis. Available online: https://www.lockhaven.edu/~dsimanek/museum/ddwfttw.htm (accessed on 3 February 2021).
  11. Gaunaa, M.; Øye, S.; Mikkelsen, R.F. Theory and Design of Flow Driven Vehicles Using Rotors for Energy Conversion. In Proceedings of the 2009 European Wind Energy Conference and Exhibition, Marseille, France, 16–19 March 2009. [Google Scholar]
  12. Khan, S.A.; Sufiyan, S.A.; George, J.T.; Ahmed, N. Analysis of Down-Wind Propeller Vehicle. Int. J. Sci. Res. Publ. 2013, 3, 1–4. [Google Scholar]
  13. Wind-Powered ‘Ventomobile’ Places First in Race; University of Stuttgart: Stuttgart, Germany, 2008; Available online: https://www.sciencedaily.com/ (accessed on 3 February 2021).
  14. Barry, K. For Sale: Record-Breaking Downwind Cart. Low Miles, Newer Propeller. 2013. Available online: https://www.wired.com/2013/06/downwind-cart-for-sale/ (accessed on 12 February 2021).
  15. Wind-Powered Car Breaks Record. BBC News. 27 March 2009. Available online: http://news.bbc.co.uk/2/hi/7968860.stm (accessed on 12 February 2021).
  16. Yuji, O.; Takashi, K. A Shrouded Wind Turbine Generating High Output Power with Wind-lens Technology. Energies 2010, 3, 634–649. [Google Scholar] [CrossRef] [Green Version]
  17. Hashfi, T.B.; Islam, M.M.; Shareef, H.; Khan, S.S. A Low Cost Method to Convert Automotive Alternator for Wind Electricity Generation. In Proceedings of the 2018 6th International Renewable and Sustainable Energy Conference (IRSEC); IEEE: Piscataway, NJ, USA, 2018; pp. 1–4. [Google Scholar] [CrossRef]
  18. Ventile. Available online: https://www.diariomotor.com/tecmovia/2011/07/10/ventile-un-concepto-amigo-del-viento/ (accessed on 12 February 2021).
  19. Lamborghini. Available online: https://forococheselectricos.com/2013/12/lamborghini-countach-electrico-y-eolica.html (accessed on 12 February 2021).
  20. Awal, M.R.; Jusoh, M.; Sakib, M.N.; Hossain, F.S.; Beson, M.R.C.; Aljunid, S.A. Design and implementation of vehicle mounted wind turbine. ARPN J. Eng. Appl. Sci. 2015, 10, 8699–8860. [Google Scholar]
  21. Diaz, J. Electrical Generator System for Capturing Wind Energy on a Moving Vehicle. U.S. Patent No. 8,618,683, 31 December 2013. [Google Scholar]
  22. Ripley, P.W. Wind Turbine for Electric Car. U.S. Patent No. 8,513,828, 20 August 2013. [Google Scholar]
  23. Yu, X. Portable Wind Power Apparatus for Electric Vehicles. U.S. Patent No. 6,897,575, 24 May 2005. [Google Scholar]
  24. Tesla T1. Available online: https://www.behance.net/gallery/41317559/TESLA-T1 (accessed on 12 February 2021).
  25. Chaudhary, Y.; Bangi, V.; Guduru, R.; Aung, K.; Reddy, G. Preliminary Investigation on Generation of Electricity Using Micro Wind Turbines Placed on A Car. Int. J. Renew. Energy Dev. 2017, 6, 75–81. [Google Scholar] [CrossRef] [Green Version]
  26. Tirapu-Manero, J.R. Generador eólico para vehículos. Patent U 201000802.
  27. Damron, P.C.; Damron, J.L.; Philip, C.D.; Jane, L. Propeller Wind Charging System for Electrical Vehicle. U.S. Patent No. 5,920,127, 6 July 1999. [Google Scholar]
  28. Fathabadi, H. Possibility of Utilizing Wind Turbine to Recover a Portion of the Kinetic Energy Losses of a Car. IEEE Trans. Veh. Technol. 2019, 68, 8663–8670. [Google Scholar] [CrossRef]
  29. Rubio, F.; Llopis-Albert, C. Viability of using wind turbines for electricity generation in electric vehicles. Multidiscip. J. Educ. Soc. Technol. Sci. 2019, 6, 115–126. [Google Scholar] [CrossRef]
Table 1. Driving characteristics for scenario 1 (WLTP cycle).
PhaseLowMediumHighExtra-HighTotal
Duration (s)5894334553231800
Stop duration (s)15648317242
Distance (m)309547567162825423,267
Percentage of stops (%)26.511.16.82.2
Maximum velocity (V_max) (km/h)56.576.697.4131.3
Mean velocity without stops (V_max) (km/h)
Mean velocity with stops (V_mean) (km/h)
Minimum acceleration (A_min) (g)−1.47−1.49−1.49−1.21
Maximun acceleration (A_max) (g)1.471.571.581.03
Table 2. Driving characteristics for scenario 2.
SectionTime
t (s)
Accumulated Time
taccum(s)
Initial Velocity
vi (km/h)
Final Velocity
vf (km/h)
Power
P (kW)
accel10100140.95850289
30% uphill gradient515141411.3855839
v const102514140.44075916
30% uphill gradient1035141411.3855839
decel1045140−0.55384279
stop3075000
accel8830408.4046202
v const2510840401.96606653
decel8116400−7.02747857
stop29145000
accel111560509.70328836
v const2518150502.96712213
decel322135010−1.66810764
accel3224510504.1189294
v const3327850502.96712213
decel10288500−8.71001131
stop28316000
accel213370302.13233817
v const1034730301.22541088
decel28375300−0.76118035
stop30405000
accel144190201.40125475
v const3245120200.68857082
decel16467200−0.6655442
stop27494000
accel125060171.17886267
accel551117242.92595189
accel7518245012.3231589
v const4856650502.96712213
decel11577500−7.83318751
stop27604000
accel66100172.10800362
accel561517242.92595189
accel7622245012.3231589
v const4867050502.96712213
decel11681500−7.83318751
stop24705000
accel147190507.93082554
5% uphill gradient1973850509.76889127
v const4478250502.96712213
5% downhill gradient167985050−3.83910935
decel48025040−6.28836806
decel6808400−9.66762003
accel78150141.28257697
30% uphill gradient5820141411.3855839
v const1083014140.44075916
30% uphill gradient10840141411.3855839
decel10850140−0.55384279
stop30880000
accel118910509.70328836
v const2591650502.96712213
decel329485020−0.96510347
accel3298020504.09855394
v const33101350502.96712213
stop301043000
accel1110540509.70328836
v const25107950502.96712213
decel32111150300.03705418
accel32114330503.89507888
v const33117650502.96712213
decel411805025−16.3257903
decel81188250−2.62842607
stop271215000
Table 3. Driving characteristics for scenario 3.
SectionTime
t (s)
Accumulated Time
taccum (s)
Initial Velocity
vi (km/h)
Final Velocity
vf (km/h)
Power
P (kW)
accel191907011.7250007
accel17367012034.1755318
v const11014612012022.0187963
5% uphill gradient2116712012038.3412573
v const60076712012022.0187963
5% downhill gradient177841201205.68205581
decel137971206021.8040946
accel88056010039.2352298
v const7688110010013.858852
5% uphill gradient20901100206.47960103
decel790820101.18731357
accel1992710608.82263626
accel179446012035.6766789
v const400134412012022.0187963
5% uphill gradient21136512012038.3412573
v const600196512012022.0187963
decel719721209019.3342737
v const2002172909010.7070313
decel72179906018.0128431
v const50222960604.28516204
accel1922486011026.9599013
accel19226711012024.4972599
v const150241712012022.0187963
5% downhill gradient302447120100−3.210079
v const40248710010013.858852
5% uphill gradient21250810012040.8436589
v const3600610812012022.0187963
decel761151201006.82720575
decel206135100507.80658275
decel961445009.88813014
Table 4. Driving modes.
Case 1: Acceleration on Flat
Mathematics 09 02265 i001
F m = F i + F r + F a + F w
Case 2: Deceleration on flat
Mathematics 09 02265 i002
F b r = F i + F r + F a + F w
Case 3: Constant velocity on flat
Mathematics 09 02265 i003
F m = F i + F r + F a + F w
Case 4: Acceleration uphill
Mathematics 09 02265 i004
F m = F i + F r + F a + F w
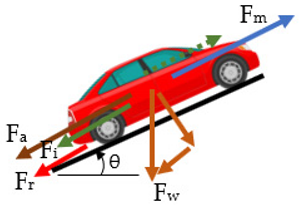
Case 5: Constant velocity uphill
Mathematics 09 02265 i005
F m = F i + F r + F a + F w
Case 6: Deceleration uphill
Mathematics 09 02265 i006
F b r = F i + F r + F a + F w
Case 7: Deceleration downhill
Mathematics 09 02265 i007
F b r = F i F w + F r + F a
Case 8: Constant velocity downhill
Mathematics 09 02265 i008
F b r = F i F w + F r + F a
Case 9: Acceleration downhill
Mathematics 09 02265 i009
F b r = F i F w + F r + F a
Table 5. Parameters.
A (m2)Cρ (kg/m3)m (kg)g (m/s2)θ (rad)
2.20.321.25 10009.81 0
Table 6. Motor power and dissipated power in kW.
Regenerative Braking SystemScenario 1Scenario 2Scenario 3
Time (s)180012156144
Distance travelled (m)27,008.48840.2198,787.5
TheoreticalTheoreticalTheoretical
Motor power (kW)607.76183.93479.12
Braking power (kW)133.159775.3294.55
REGENERATIVE BRAKING
SYSTEM + AERODYNAMIC FORCE
Scenario 1Scenario 2Scenario 3
TheoreticalTheoreticalTheoretical
Motor power (kW)607.76183.93479.12
Braking power + Aerodyn. Power (kW)385.6595.76375.34
Table 7. Theoretical percentage of power than can be retrieved.
Regenerative DeviceRegenerative System + Use of Aerodynamics Force
Theoretical %Theoretical %
Scenario 319.7378.34
Scenario 240.9552.06
Scenario 121.963.45
Table 8. Power recovered by 2 turbines with R = 0.35 m.
Purely Regenerative SystemScenario 1Scenario 2Scenario 3
Motor power (kW)607.76183.93479.12
Braking power (kW)133.159775.3294.55
Power recovered (kW) 22.542.0923.82
Regenerative system + use of aerodyn. forceScenario 1Scenario 2Scenario 3
TheoreticalTheoreticalTheoretical
Motor power (kW)607.76183.93479.12
Braking power + Aerodyn. power (kW)385.6595.76375.34
Power recovered (kW)144.2911.68160.46
Table 9. Percentage of power recovered by two turbines with R = 0.35 m.
Regenerative Braking SystemRegenerative Braking System + Aerodynamics
Theoretical %Real %Theoretical %Real %
Scenario 1 (mixed)21.93.7163.4523.74
Scenario 2 (urban)40.951.1452.066.35
Scenario 3 (interurban)19.734.9778.3433.5
Publisher’s Note: MDPI stays neutral with regard to jurisdictional claims in published maps and institutional affiliations.

