Abstract
Composite indicators are a very useful tool for conveying summary information on the overall performance of institutions and facilitating decision-making. Increasingly, there is a demand for indicators that allow performance to be assessed after the implementation of a strategy. This has several difficulties, and in this paper, we address three of them: how to evaluate at different points in time, how to estimate the weighting of the criteria and how to normalize the data. Our proposal is based on multicriteria techniques, using a recent method, uwTOPSIS, and is applied to data collected from 2975 students enrolled in the first year of science and engineering at the Industrial University of Santander (Colombia) from the first semester of 2016 to the first semester of 2019. In the paper, we show that our proposal makes it possible to measure and evaluate the academic performance of students at two points in time, and this allows the University to know whether its student support policy has been successful and to what degree it has been effective. Due to the large amount of data handled, data management has been done using R programming language, and model implementation has been done with Python.
1. Introduction
Academic institutions, both public and private, are interested in knowing the overall student performance, as it is essential to improve management results. Some institutions apply complementary programs to achieve better performance and an efficient use of physical and human resources. Considering that performance is a multidimensional concept and that the relative importance of each dimension is not always the same, techniques must be looked for that allow us to measure the overall performance. Determining how much each variable or dimension has contributed to performance improvement (partial performance) may also be interesting.
This work aims to construct a composite indicator that measures and evaluates total performance and partial change, focusing on the design and construction of an indicator that measures academic performance and allows the evaluation of student performance at two points in time. Thus, the institution will be able to know if the policies/actions to support students have been satisfactory and detect weaknesses that can be transformed into improvements, increasing the allocation of resources and, therefore, the management of the institution. Since decisions affect future periods, an important aspect to consider is the study of the evolution of one or more dimensions at two points in time. This paper proposes a composite indicator to study the evolution of students’ academic performance when they enter university and once they have completed their first academic year.
The construction of composite indicators to synthesize information from different dimensions is very useful and allows institutional managers to make decisions. However, the construction of indicators has its pros and cons, and it is sometimes problematic to define an indicator that adequately reflects or conveys all the dimensions considered. However, if all the necessary steps to construct an indicator are fulfilled (definition of a theoretical framework, adequate selection of variables, standardization of variables if they are of different nature and are measured in different units, weighting and aggregation of criteria in an appropriate manner), indicators can be useful tools that allow summarizing information in a relatively simple way [,]. This is the case of the proposed performance, adequacy and academic excellence indicators, as they allow educational institutions to make decisions based on the results of these indicators.
The determination of academic performance, by its very nature, is a multidimensional concept that includes several variables or simple indicators. Multicriteria analysis techniques (MCMD) are suitable for solving problems when various criteria from a set of alternatives are obtained. These techniques are widely known and used to solve highly complex problems. In particular, it is recognized by resolving the conflict of interests posed by problems with several criteria [], where each of these may have very different characteristics with respect to the others.
As a consequence, multicriteria decision-making methods (MCDM) have become an essential tool for agents involved in the selection of alternatives []. One of the methods used for its robustness is the TOPSIS method proposed by []. This method has been used in the area of education for sustainable development practices [] and in previous works, in which students of the Industrial University of Santander (UIS) were characterized and in which indicators of adequacy and excellence were proposed [,,,,], and it is commonly applied in decision making in different areas of knowledge [].
However, this method requires knowledge of the weights of each criterion, which are not always easy to assign, and the assignment of each of its values based on the experience of the agents can be highly controversial [,]. It is clear that the values of each weight determine the relative importance of each criterion, but there is not always a consensus when it comes to establishing them [,]. Numerous researchers investigated the effect caused by the subjective assignment of these values [,,,,] and the difficulty of determining a set of weights according to the type of problem [,,,]. However, some studies objectively analyze the selection of weights to avoid this type of problem []. Now, if the institutions have difficulties and cannot determine what these weights are, the uwTOPSIS method proposed by Liern and Pérez-Gladish [] can be applied, which evaluates the different criteria of each alternative considering the weights as variables [,,].
In addition, another problem to be addressed is data collection. For this reason, some approaches study the uncertainty of these problems with fuzzy techniques [,,,], while others consider the imprecision subject to data collection by defining indicators and evaluators of the results [,]. It should be noted that the assessment of intangible magnitudes, such as personal perspectives, is analyzed by many authors [,]. However, weights, normalization, metrics and ranking functions can also be decisive and significantly affect the final result.
This article presents a methodology, which can be applied to the construction of indicators in any area. However, it will be used to evaluate the academic condition of students at the Industrial University of Santander (Colombia). The Student Academic Excellence Support System (its acronym in Spanish is SEA) was created at this university to coordinate and manage programs and strategies and aims to improve the academic performance of students to reduce university dropout and failure. The institution needs to recognize those students with adverse situations that may directly affect their outcomes. The data that will be used in this work are those collected by the SEA of students entering the university in the academic, cognitive, economic, health and social dimensions before entering the university. At the end of the semester, the same data will be considered for all dimensions, except for the academic dimension, where each student’s final grades in calculus and lineal algebra will be taken into account. It is assumed that the rest of the dimensions do not vary since it is unlikely that in one semester, the economic, social, health and cognitive circumstances vary significantly. To conduct this work, data are considered from 2975 students enrolled in the first year of science and engineering from the first semester of 2016 to the first semester of 2019.
The rest of the paper is structured as follows. In the second section, how to construct the academic performance indicator will be described. Before defining it, a brief description of the steps necessary to guarantee the development of a good indicator will be given. At the end of the section, the properties of the academic performance indicator will be studied. In Section 3, a real case applied to the Industrial University of Santander (Colombia) will be presented. In Section 4, the discussion will be carried out. The paper will be completed with the main conclusions of the work.
2. Construction of the Academic Performance Indicator
In this section, a composite indicator will be constructed that allows us to relate the evaluation of the alternatives and assess performance over two time periods when only one of the criteria varies []. The steps to be followed to construct a composite indicator are as follows:
- Step 1.
- Development of the conceptual framework or theoretical model, which will allow us to identify the phenomenon to be measured, the groups involved and identify the variables.
- Step 2.
- Selection of the decision criteria. It is essential to identify the variables or simple indicators. Determining how to obtain the data, studying whether there are missing data and how to resolve it and analyzing the data structure is fundamental to constructing a quality.
- Step 3.
- Comparison of alternatives. When a composite indicator is constructed, in most cases, the units in which the variables are measured and the nature of these are very diverse []. To compare and aggregate variables and simple indicators, it is necessary to express them on a similar scale, i.e., normalize [,,]. However, the normalization method must be carefully assessed because the results may vary depending on the method used. In this work, the method proposed by Liern et al. [] will be used to normalize it, which will be described in more detail in Section 2.2.
- Step 4.
- Assignment of weights and aggregation. One of the problems widely discussed in the literature is the weighting of variables according to their relative importance [,,,]. Sometimes, the assignment is done based on expert judgment, but at other times, as we will develop in this paper, we will not assign the weights a priori but apply the uwTOPSIS method, in which it is not necessary to have the weights showing a priori the relative importance of the criteria [].
- Step 5.
- Fifth and final step: Comparison of the alternatives and sensitivity analysis of the composite indicator. In this case, the total and partial performance of each student will be evaluated using the indicator proposed in this work. When an indicator is proposed, it is necessary to test its usefulness and study whether it meets the properties of the indicators [,], and finally, the robustness of the indicator must be determined.
In the next section, we provide a detailed description of how the academic performance indicator is obtained.
2.1. Academic Performance Indicator
Given the values of the m dimensions considered at time t, a multicriteria method is applied, and the relative proximity interval is determined for each alternative, obtaining the performance range = per each . If at time of all dimensions considered in the previous period, only one has varied the variables that compose it, the score of the modified dimension is considered and the values obtained are normalized for each alternative using min-max normalization [].
Once the score at time has been obtained for each alternative, it is compared with the score at time t. Thus, the results for each alternative are obtained at two points of time, which allows a priori–posteriori contrast to be carried out.
Suppose an individual has an initial score and a final score x previously normalized. When comparing x with , a scalar would be expected to exist, so since its initial interval indicates its reference framework. However, it can be that x is outside this range, which would indicate that the individual has obtained a score lower or higher than the performance range. Therefore, the next indicator is defined.
Definition 1
(Academic performance indicator). Given a set , the academic performance indicator is defined as such that
In the case , the academic performance indicator is given by the characteristic function of the interval .
Proposition 1.
Given , for each exists ; thus .
Proof.
The proof is trivial by taking where it exists and . □
From Proposition 1, it is concluded that the indicator is surjective in , where .
2.2. Determination of Performance Range Values
To determine the performance range = , the multicriteria analysis technique uwTOPSIS will be used because unlike the TOPSIS algorithm, in which it determines the ranking of the alternatives, minimizing the distance to the positive ideal and, at the same time, maximizing the distance to the negative ideal, for weights assigned a priori, uwTOPSIS considers the weights as variables. The score obtained for each alternative is converted into a function that depends on the weights, where the minimum and maximum values are obtained by solving an optimization problem for each case. Therefore, the score for each alternative is given as an interval that describes the minimum and maximum possible score that could be obtained by varying the set of weights if they were calculated by applying the TOPSIS method. The steps of the uwTOPSIS method are described below:
- Step 1.
- Decision matrix is determined so that and , where n and m are the number of alternatives and criteria, respectively.
- Step 2.
- Decision matrix is normalized , where each for each and .
- Step 3.
- Positive ideal and negative ideal are determined as and , wherewhere is the set of criteria to be maximized and is the set of criteria to be minimized.
- Step 4.
- Given and d a distance defined in , we consider the separating functions for each of as
- Step 5.
- The relative proximity function to the ideal solutions is defined as for each
- Step 6.
- For each , the values and are calculated when solving mathematical programming problems over considering the set of weights as the problem variableswhere lj is the lower bound and uj the upper bound within wj, .
Then, the interval = is obtained, which represents the worst and best possible scores for each alternative . However, each of these are subject to the normalization type (ϕ), separation function (D), proximity function (R) and the set of lower and upper bounds of the weights (). Thus, each can be written as thanks to the implicit function theorem, where is the vector with the dimensions of the i-th student a priori.
In this article, in Step 2, the normalizations to be used are those proposed by [], where the normalizations η and ξ are given by the following expressions:
In both normalizations, the (A,a,b,B) array represents the trapezoidal fuzzy shape, and the (k1,k2) coefficients are the left and right exponents that determine whether each spread is convex or concave. For a better understanding of their functionality, Figure 1 depicts how η and ξ transform the data.
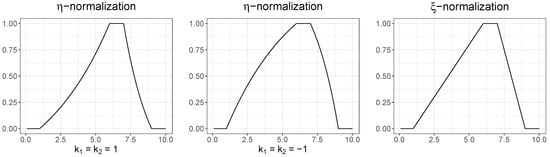
Figure 1.
Particular case of the normalizations η and μ in which the values (A,a,b,B) = (1,6,7,9) have been set. The first graph is the normalization η with the values k1 = k2 = 1, and the second is the normalization η with k1 = k2 = −1. Finally, the third is the normalization ξ.
In Step 3, the positive and negative ideals have been considered to be and , thus having a data-independent comparative model.
The distance used in Step 4 is the Euclidean distance, and the weights of Step 6 have been considered based on expert judgment.
Remark 1.
For the particular case where the previously described uwTOPSIS method presents a set of weights Λ of the form , , one has an application of the classical TOPSIS method in the same way as the authors in []. This is because Step 6 of the unweighted method would return us the same for each .
2.3. Properties of Academic Performance Indicator
When constructing an indicator, it is necessary to make sure that it verifies properties that guarantee its usefulness [,,]. In the following, the properties that verify PA will be checked.
- Existence and determination. For every tern , the function PA is well-defined, and the value of exists due to Proposition 1.
- Uniqueness. By the indicator’s construction, each element of its domain returns a unique value.
- Monotonicity. Given for the cases where and , the indicator is monotonically a constant. For the case that , the gradient of the indicator can be defined asTherefore, the function is monotonically increasing with respect to x and monotonically decreasing with respect to RL and RU.Figure 2 shows a particular case of the behavior of the excellence indicator. Three graphs are represented where one of the variables varies and the rest remain fixed.
- Continuity. The indicator is continuous except for the case where . This is because, for each , where is satisfied
- Decomposability. Given such that and , it is easy to see . For the case that , the proof is trivial. Now if in each and is satisfied , we have the same decomposition since the function has no discontinuities in as is well demonstrated by the property 4.
- Normality. By definition, the indicator PA takes values between 0 and 1, where, in addition, the same scale is guaranteed for each of the variables in .
- Scale invariance. Given an element and a scalar such that , so .
- Translation invariance. Given an element and a scalar such that , so .
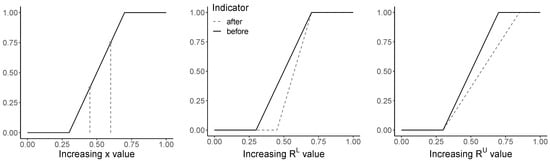
Figure 2.
Special case of the behavior of the academic performance indicator PA by increasing the value of each of its variable by 0.15.
Having verified that the academic performance indicator obeys the stated properties and in order to contrast the a priori and a posteriori results, the academic performance indicator for the set of ternaries will be applied to each alternative, where and are the variables of the i-th alternative at time t and , respectively.
3. Application of the Academic Performance Indicator to UIS Students
In this section, the academic performance indicator will be applied to data from the Industrial University of Santander, Bucaramanga campus, Colombia. For this purpose, we have obtained information from science and engineering students enrolled from the first semester of the academic year 2016 to the first semester of 2019.
First, a global study of the results obtained by applying the academic performance indicator have been carried out, thus determining the performance of students in their first semester at university. Subsequently, the results obtained are shown when grouped by gender and economic status. Finally, to analyze student performance using the academic performance indicator, a threshold of is set. It is considered that if a student has a PA score equal to or higher than 0.6, he/she presents an adequate academic level and meets the minimum required by the university.
3.1. Dataset
For this work, from the data provided by the SEA, 2975 students enrolled in the first year of science and engineering are selected, and the data of the academic, cognitive, economic, health and social dimensions of students who have just joined the university have been obtained []. The variables that compose each dimension are:
- (a)
- Academic dimension. This dimension is composed of three items: a diagnostic test of UIS Math (DTM); EFAI-4 numerical ability (NUA); and 11-Math Knowledge Test (PSO).
- (b)
- Cognitive dimension. Five items are assessed: verbal reasoning (VR), numerical reasoning (NR), abstract reasoning (ABR), memory (MEM) and spatial attitude (SA).
- (c)
- Economic dimension. The variables that analyze this dimension are: Income from economic dependence, ED = wage/SMMLV (where SMMLV = current legal minimum monthly wages), the number of siblings (NS), the position between siblings (PS) and the payment of rent during the course (PRC).
- (d)
- Health dimension. The eight variables that compose this dimension are: Anxiety (ANX), Depression (DEP), Emotional Adjustment (EMA), Alcohol Dependence (ALD), Psychoactive Substance Abuse (PSA), Chronic Illnesses (CI), Disability (DI) and “Question 23” (P23), which refers to the tendency toward suicide.
- (e)
- Social dimension. This is determined by family dysfunction (FAD) through the “Family APGAR” [].
A more detailed description of the dimensions considered in the study and the weights applied in each case can be found in [,,]. As the dimensions are measured on different scales (Table 1), the transformation proposed by the authors [] has been used, which allows us to work with data grouped by intervals and combine different types of variables.

Table 1.
Dimensions, ranges, ideals and normalizations.
At the end of the semester, to study the variation in academic performance, the grades of each student in the subjects of calculus and algebra are considered and not the university entrance grades, which were considered in the academic dimension before the beginning of the semester. Since the grades are measured differently from the other dimensions, they will be normalized using the min-max normalization and the mean will be calculated.
Performance on admission to college will be determined by the interval , which represents the worst and best possible score for each student upon entering university and is the result of aggregating the five dimensions. The uwTOPSIS method will be applied to obtain the interval. At the end of the semester, the value of the academic dimension will be calculated, which will be given by the X1 value, and normalized with the minimum-maximum normalization. With the data obtained before and after the end of the first semester, the students will be classified depending on whether or not the academic dimension score is contained within the interval. The student can be considered to have had an expected performance if the final score is contained in the interval , excellent if he/she has obtained a final score higher than and, on the contrary, an insufficient score if he/she has had a final score lower than . From now on, the academic performance of students are distinguished as shown in the Table 2.
Table 2.
Type of academic performance from PA.
In this work, the dimensions as criteria have been considered to be maximized. This will cause students with worse conditions to obtain a small value in and, on the contrary, those with stable conditions will have a value close to 1 in . We have considered the positive and negative ideals to be and , respectively. Finally, to prevent the method from eliminating certain criteria when optimizing, we have considered the minimum and maximum weights to be, respectively, 0.1 and 0.5.
Due to the large amount of data handled, data management has been done using the R programming language [], and model implementation has been done with Python []. In particular, a repository on GitHub (https://github.com/Aaron-AALG/uwTOPSIS, accessed on 19 September 2021) to be able to apply the uwTOPSIS method has been created, as indicated in Section 2.2 []. For implementation purposes, Appendix A contains a script sample of the method with both η and ξ normalizations.
Remark 2.
The mathematical optimization associated to the problem has been computed with the optimize module of the SciPy (https://www.scipy.org, accessed on 19 September 2021) library. We would like to highlight that this is not a unique option, although for our particular case, it was enough. In cases when we face more complex problems, it would be convenient to develop a metaheuristic algorithm that fits with the behavior of the objective function.
3.2. Classification of Students at UIS Colombia According to Gender and Economic Status
Taking the interval values obtained with the uwTOPSIS method into account, the performance of students in each semester of the academic years 2016 to 2019 was studied. The results obtained by applying the proposed academic performance indicator (Equation (1)) on the dataset offered by the SEA show us that, on average, the academic performance is 0.6498 or higher in all the periods analyzed, except in those corresponding to the two semesters in 2018 that take values of 0.2177 and 0.2795 (Table 3).
Table 3.
Average of the a priori, posteriori and academic performance indicator results by semester.
Thus, for example, while in the semester of 2016_1, on average, they had an academic performance of 0.8602, or in 2017_1, the value of the indicator is 0.7814; in 2017_2, the value is reduced to 0.6498 due to the number of students who had low scores. In addition, in the two periods of 2018, there was atypical behavior due to the fact that the students’ scores when considering all dimensions were not good and also the width of the interquartile range in these periods was larger (Figure 3). One possible explanation is the national university strike in Colombia in 2018. That strike forced the institution to delay classes. Some students had to cancel the academic semester and a majority failed many subjects, among them calculus and linear algebra.
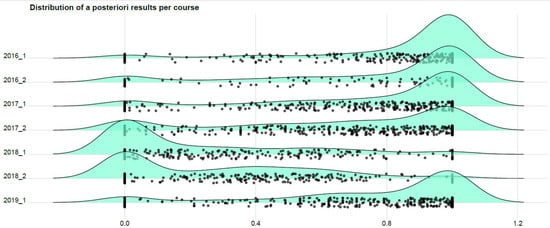
Figure 3.
Distribution of students by academic semester.
If the academic performance according to gender for all periods is analyzed, information on 2040 male and 935 female science and engineering students is considered. The average academic performance for males is 0.6211 and for females 0.6632; therefore, it is seen that the values are similar when disaggregated by gender (Table 4).
Table 4.
Academic performance indicator values by gender.
When breaking down the mean values by gender, for each semester, it can be seen that the highest scores occur in semester 2016_1, where the mean for men is 0.8571 and is 0.8667 for women. The largest differences occur in semester 2017_2, where the mean for men is 0.6149, while for women in this same period, it is 0.7195. In this case, it can be seen that the variance in the men’s group for this period is the highest with 0.1454. More detail can be seen in Table 5. In Figure 4, it can be seen that there are no significant differences in the academic performance score by gender for the different periods studied. Therefore, it can be said that academic performance is not affected by gender for these semesters.
Table 5.
Academic performance indicator values by semester and gender.
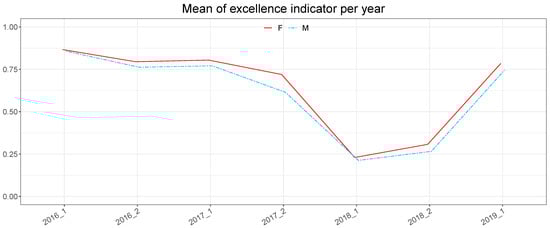
Figure 4.
Value of the academic performance indicator by gender.
Next, it is intended to study how the economic condition of students who access the UIS affects academic performance. The institution classifies students according to whether their economic risk is low, medium or high. However, for the periods analyzed, students are either low risk () or high risk (). Thus, a total of 458 students are at low economic risk, while a total of 2517 are at high economic risk, which is 84.6% (Table 6).
Table 6.
Students by risk group and gender.
If we group by economic status and gender, it can be seen that 85.15% of men and 83.42% of women belong to the high economic risk group (Table 6). Therefore, most of the students accessing UIS have a hard economic situation. It is worth mentioning that UIS is one of the most important official universities in the region, and due to its public institution, it serves students from the lowest socioeconomic strata, which is reflected in the data.
If Table 7 is observed, where the average performance values per semester are shown, it can be seen that in all periods, except 2016_1, the scores are higher for students with low economic risk. In the 2016_2 and 2017_1 periods, the scores between the two groups do not differ by more than 0.06 points. From this period onwards, the differences are significant, reaching the maximum difference in 2018_1 as reflected in Figure 5.
Table 7.
Academic performance indicator values by semester per economic condition.
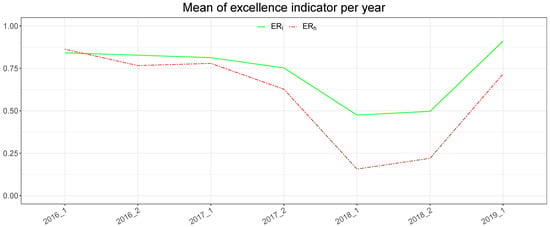
Figure 5.
Value of the academic performance indicator by economic risk.
The intention is to compare the results of academic performance with PA taking into account whether they have received actions or not. If Table 8 is observed, it can be seen that in all semesters, except in 2019_1, the mean value of the PA indicator is higher for students who have not received complementary actions, i.e., those who had a high score in the academic dimension when they accessed the university. The differences that exist between the two groups of students in semester 2016_2 should be highlighted, where the average academic performance for those who did not participate in any action was 0.9080 and those who participated in some action was 0.6924. In 2018_2, the mean academic performance for those who did not participate in any action was 0.6229 and those who participated in any action was 0.2654. This may be due to the fact that in some semesters, the political situation in the country led to class stoppages during part of the semester and the suspension of complementary actions. In this way, students with greater needs ceased to have some support actions.
Table 8.
Academic performance indicator by semester and participation.
The percentages of students appearing in each group (Excellence, Fail or Expect) show disparate results depending on the semester analyzed, but in all of them, students who do not participate in actions present a higher percentage of Excellence (Table 9). For example, in 2016_2, the percentage of Excellence among students who did not participate in any action was 64.62%, while that of those who participated in at least one was 39.81%. Surprising again, of the few students who have an Excellence score in the results obtained for the 2018_1 and 2018_2 semesters, 8.33% and 38.46% did not participate in complementary actions and 3% and 1.26% did participate. Above all, the percentage of students in the Fail situation, 41.67% and 23.08% in the group of those who do not participate and 49.50% and 40.69% of those who have participated in some complementary action, is surprising in these periods.
Table 9.
Percentage of students according to whether or not they have participated in the support program.
Next, the data of the students who have obtained a value of will be analyzed. According to the UIS criteria, we consider that from this value, they present an adequate academic performance. In all periods, the percentage was higher than 61%, except in 2018_1, where the percentage of those who did not receive complementary actions was 16.67% and of those who received was 13%, and in 2018_2, where the percentage of students who received complementary actions was 13.56%. If the results are compared for each semester, it is seen that in all periods, the percentages are higher for students who do not receive complementary actions, except in 2019_1, where students who do not participate account for 66.67% and those who participate account for 77.25%. In any case, what can be observed is that the complementary actions allow a high percentage of students to be above the proposed threshold. Obviously, our intention goes beyond comparing groups. The most important thing is to prevent students in vulnerable situations from being unable to continue university studies. With these actions, a high percentage of students achieve the expected results and reduce the dropout rate, which is a success for the institution.
If the groups by gender are analyzed (Table 10), it can be seen that the results are not very different between men and women. Both in the groups that have not participated in complementary actions and in those that have participated in at least one, women obtain better results. The percentage of women with an Excellence score among those who do not participate in any action is 56.98%, while that of men is 47.07%. The same is true for those who participate in any complementary actions. The percentage of women is 26.14%, while that of men is 24.20%. If we focus on the percentage of students by gender in the case of , we see that the pattern is repeated. In the case of females who do not participate in any action, the percentage is 86.43% compared to 76.55% for males. The same is true for students participating in complementary actions (55.54% of females have a value of PA higher than 0.6, while the percentage of males is 51.88%).
Table 10.
Gender of the students that did not participate in the support program (NP) and the students that did participate, at least once, in the support program (P).
Regarding the study of the economic conditions of the students, a higher percentage of excellent students is observed in the groups that have not participated in the SEA support program (Table 11). Thus, 55.29% of students who have not participated in complementary actions and who have a low economic risk are excellent versus 32.98% of those who have participated in some action. Among those with high economic risk, , and of those who have not participated in complementary actions, 49.38% are excellent versus 23.06% who have participated in at least one action. In any case, of those students who have participated in complementary actions, 61.93% of those with a low economic risk, , and 51.14% of those with a high economic risk, , have obtained an academic performance indicator score of PA above 0.6. Given that more than half of the students who participated in the complementary actions organized by the SEA have had a score higher than the threshold set as success of the strategy, it is justified to recommend that the UIS continues with the actions carried out and implement some more so that the success rate is close to that of the students who do not have support needs.
Table 11.
Economic risk of the students that have not participated in the support program (NP) and the students that have participated, at least once, in the support program (P).
4. Discussion
We do not want to finish this work without including a discussion about the construction and use of indicators and the application of a MCDM method, the uwTOPSIS, where it is not necessary to assign the weights a priori.
An indicator of academic performance has been constructed that lets us see the evolution of students in two moments of time, comparing the final value with the initial score obtained using the uwTOPSIS multicriteria method. As alternatives, a lower bound and an upper bound are considered, which allows constructing an interval that represents the worst and the best possible score. In addition, comparing the information obtained by applying the uwTOPSIS at a time t with the data obtained at time for the same dimension but considering different variables, we can construct an indicator of academic performance that determines whether the performance of a student has worsened, maintained or improved.
The main use of the uwTOPSIS method is that it considers the weights as variables and allows the evaluation of the alternatives without prior assignment of the weights. It shows an appreciable improvement since in previous works using data from the Universidad Industrial de Santander, the allocation of weights was made based on expert judgment. This sometimes implied difficulties in reaching a consensus, and consequently, studies were not fully implemented in the strategy. Undoubtedly, uwTOPSIS allows progressing and improving the procedures we have applied since it has several advantages:
- An interval associated with the worst and best possible results of each student is obtained, which allows knowing their aspirations.
- Results dependent on the data handled have been avoided (rank reversal []), using and as ideal and anti-ideal, respectively.
- A standardization has been applied that allows taking into account the criteria of the institution, which makes the future applicability of the results easier.
As happens in all studies that are used in real problems with a large amount of data and involving several decision-makers, our proposal does not resolve some issues:
- In this study, stability/regularity in the data has not been taken into account. As it was said in the different sections, there are periods with clear differences with respect to the others, and this could require an in-depth study of the homogeneity between periods. However, once the results are known, it is clear that these differences should be taken into account in a subsequent study.
- The intervals assigned to the weights, although they make the results more flexible and objective, determine (in some way) the groupings. This could be avoided by allowing weights that could span the entire interval . However, this would not make complete sense in a multicriteria environment. According to [], a weight greater than 50% in any of the criteria in a decision context with more than two criteria is not sustainable with the multicriteria character.
The choice of the TOPSIS method is based on the conclusions of Vicente et al. [] since it was proved that this technique appropriately fit with the SEA-UIS dataset. Moreover, the approach of unweigthed MCDA techniques is a field that we must research in depth.
We also consider the use of machine learning algorithms for future works, in which we could implement supervised learning techniques to estimate future academic performance or unsupervised learning techniques for cluster analysis. Nonetheless, in this paper, we have not applied such techniques because we have followed the UIS guidelines in terms of the data preparation and both evaluation and classification of their students.
Finally, there are a few difficulties involved in applying some methods in practice due to the associated computational cost of solving uwTOPSIS; when calculating uwTOPSIS for 2975 alternatives and 5 criteria, a decision matrix with 14,875 entries is made. When calculating the optimal solutions of the relative proximity function (R), a total of 5950 mathematical optimization problems are performed to obtain each . With all this, our code has been compiled [] on a computer with AMD Ryzen 7 3700U with Radeon Vega Mobile Gfx processor and 16 GB of RAM, obtaining a computational cost of 4651.98 s (1 h, 17′ and 31.98′′) to run the code in full, which is 1.27 iterations per second. However, when adding the Python Joblib module (https://github.com/joblib/joblib, accessed on 19 September 2021) to execute parallel computation, the computational cost was 1629.83 s (27′ and 9.83′′) when using 8 CPUs simultaneously, which is 3.65 iterations per second.
5. Conclusions
By constructing composite indicators that incorporate all the variables and meet a series of indicator properties, it is possible to synthesize the information and draw simple and rapid conclusions that help institutional decision-makers. However, the proper construction of indicators requires overcoming or resolving several obstacles. Once the standardization problems have been solved by applying the proposal made by Liern et al. (2020), one of the pending issues is the assignment of weights. The objective of this work is to propose a composite indicator in which the weights are considered variable. Taking these aspects into account, the proposed indicator, called the academic performance indicator, allows academic institutions to obtain the value of the indicator for each student and to know whether or not there has been an improvement in the results.
The use of the proposed indicator allows the institution to know whether the complementary actions implemented have been successful or not since at the beginning of the semester, based on the available data of the five dimensions analyzed, it is determined which students can participate in the actions promoted by the institution. At the same time, global data on the students are provided, and groups can be established according to the result of the academic performance calculated from the indicator.
The proposed method was applied to the data obtained from the students of the Industrial University of Santander (Colombia) to draw conclusions that can be applied to decision making. The UIS committed, investing economic and human resources, to offering complementary actions and wants to determine whether this decision is adequate or needs to be modified. One way to determine this is by calculating the academic performance indicator, so if it improves or is maintained, the investment is adequate; if not, the university will have to reinforce the proposed activities, determine other alternatives or even change the policy carried out so far.
By applying the method to the UIS data, it is verified that there are no significant differences in academic performance when calculating the indicator according to gender; however, these differences are greater if the economic condition of the students is taken into account. However, by applying complementary actions, the institution guarantees an improvement in the results of students who presented deficiencies at the beginning of the semester, improving academic results and reducing the dropout rate.
This work is expected to continue deepening the construction of indicators that allow the UIS to have a global vision of the results of the policies implemented in 2014, the year in which the SEA was founded and actions to help students with academic and economic problems began to be implemented. It is also intended that the use of indicators will allow comparisons with other universities and facilitate other universities or local governments into the design of student curricula and the implementation of educational policies.
Author Contributions
Conceptualization, O.B.-B., M.L.-G., A.L.-G. and S.E.P.-R.; methodology, O.B.-B., M.L.-G., A.L.-G. and S.E.P.-R.; software, O.B.-B., M.L.-G., A.L.-G. and S.E.P.-R.; R programming, M.L.-G., A.L.-G.; Python programming, A.L.-G.; validation, O.B.-B., M.L.-G., A.L.-G. and S.E.P.-R.; formal analysis, O.B.-B., M.L.-G., A.L.-G. and S.E.P.-R.; investigation, O.B.-B., M.L.-G., A.L.-G. and S.E.P.-R.; resources, O.B.-B., M.L.-G., A.L.-G. and S.E.P.-R.; data curation, O.B.-B., M.L.-G., A.L.-G. and S.E.P.-R.; writing—original draft preparation, O.B.-B., M.L.-G., A.L.-G. and S.E.P.-R.; writing—review and editing, O.B.-B., M.L.-G., A.L.-G. and S.E.P.-R.; visualization, O.B.-B., M.L.-G., A.L.-G. and S.E.P.-R.; supervision, O.B.-B., M.L.-G., A.L.-G. and S.E.P.-R.; project administration, O.B.-B., M.L.-G., A.L.-G. and S.E.P.-R.; funding acquisition, O.B.-B., M.L.-G., A.L.-G. and S.E.P.-R. All authors have read and agreed to the published version of the manuscript.
Funding
This work has been partially supported by the Spanish Ministerio de Ciencia, Innovación y Universidades, project number RTI2018-096065-B-I00 and Cátedra UNESCO for Development Education, Global Citizenship and Awareness for the academic year 2020–2021 (Universitat de València).
Acknowledgments
To the Academic Excellence Support System, Universidad Industrial de Santander (SEA-UIS), for the transfer of the information and data.
Conflicts of Interest
The authors declare no conflict of interest.
Appendix A
In this appendix, we present a Python script sample similar to the one we have used for this paper. It is fully recommended to visit the GitHub [] in order to get detailed information about the installation and dependencies. Moreover, there exist other default input arguments that might be modified.
import pandas as pd
import numpy as np
from uwTOPSIS.uwTOPSIS import *
# Definition of the eta normalization
def eta(x, A, a, b, B, k1, k2):
def f(x, v1, v2, k):
return (1-np.exp(k*(x-v2)/(v1-v2)))/(1-np.exp(k))
if A <= x and x < a:
z = f(x, a, A, k1)
elif a < x and x < b:
z = 1
elif b < x and x <= B:
z = f(-x, -b, -B, k2)
else:
z = 0
return z
# Definition of the xi normalization
def xi(x, A, a, b, B):
def f(x, v1, v2):
return (x-v2)/(v1-v2)
if A <= x and x < a:
z = f(x, a, A)
elif a < x and x < b:
z = 1
elif b < x and x <= B:
z = f(-x, -b, -B)
else:
z = 0
return z
# Data preparation
path_to_data = ’path/to/data.xlsx’
data = pd.read_excel(path_to_data)
directions = np.repeat("max", 5)
L = np.repeat(0.1, 5)
U = np.repeat(0.5, 5)
norm = "none"
p = 2
# Data normalization
data[’Academic’] = data[’Academic’].apply(lambda x: eta(x,1,6,7,7,1,0))
data[’Cognitive’] = data[’Cognitive’].apply(lambda x: eta(x,1,6,7,7,-1,0))
data[’Economic’] = data[’Economic’].apply(lambda x: xi(x,0,0.8,1,1))
data[’Health’] = data[’Health’].apply(lambda x: xi(x,0,0.65,0.65,0.65))
data[’Social’] = data[’Social’].apply(lambda x: xi(x,0.1,0.7,1,1))
# Application of unweighted TOPSIS method
x = uwTOPSIS(data, directions, L, U, norm, p, forceideal=True)
References
- Zhou, P.; Ang, B.W.; Zhou, D.Q. Weighting and Aggregation in Composite Indicator Construction: A Multiplicative Optimization Approach. Soc. Indic. Res. 2010, 96, 169–181. [Google Scholar] [CrossRef]
- Zhou, P.; Ang, B.W.; Zhou, D.Q. Comparing MCDA aggregation methods in constructing composite indicators using the Shannon-Spearman measure. Soc. Indic. Res. 2009, 94, 83–96. [Google Scholar] [CrossRef]
- Roy, B. Multicriteria Methodology for Decision Aiding; Nonconvex Optimization and Its Applications; Springer: Berlin/Heidelberg, Germany, 1996. [Google Scholar]
- Zopounidis, C.; Doumpos, M. Multiple Criteria Decision Making: Applications in Management and Engineering, 1st ed.; Springer International Publishing: Berlin/Heidelberg, Germany, 2017. [Google Scholar]
- Hwang, C.; Yoon, K. Multiple Attribute Decision Making: Methods and Applications: A State-of-the-Art Survey; Lecture Notes in Economics and Mathematical Systems; Springer: Berlin/Heidelberg, Germany, 1981. [Google Scholar]
- Rampasso, I.S.; Siqueira, R.G.; Anholon, R.; Silva, D.; Quelhas, O.L.; Filho, W.L.; Brandli, L.L. Some of the challenges in implementing Education for Sustainable Development: Perspectives from Brazilian engineering students. Int. J. Sustain. Dev. World Ecol. 2019, 26, 367–376. [Google Scholar] [CrossRef]
- Parada, S.E.; Blasco-Blasco, O.; Liern, V. Adequacy Indicators Based on Pre-established Goals: An Implementation in a Colombian University. Soc. Indic. Res. 2019, 143, 1–24. [Google Scholar] [CrossRef]
- Parada, S.E.; Fiallo, J.E.; Blasco-Blasco, O. Construcción de indicadores sintéticos basados en Juicio experto: Aplicación a una medida integral de la excelencia académica. Rect@ 2016, 16, 51–67. [Google Scholar]
- Liern, V.; Parada-Rico, S.E.; Blasco-Blasco, O. Construction of quality indicators based on pre-established goals: Application to a Colombian Public University. Mathematics 2020, 8, 1075. [Google Scholar] [CrossRef]
- Parada, S.E.; Blasco-Blasco, O.; Liern, V. Construcción de indicadores basada en medidas de similitud con ideales. Una aplicación al cálculo de índices de adecuación y de excelencia. Rect@ 2017, 18, 119–135. [Google Scholar] [CrossRef]
- Blasco-Blasco, O.; Parada Rico, S.; Liern-García, M.; López-García, A. Characterization of University Students Through Indicators of Adequacy and Excellence. Analysis from Gender and Socioeconimic Status Perspective. In Proceedings of the ICERI2020, IATED, 13th Annual International Conference of Education, Research and Innovation, Seville, Spain, 9–11 November 2020; pp. 8030–8037. [Google Scholar] [CrossRef]
- Behzadian, M.; Otaghsara, S.K.; Yazdani, M.; Ignatius, J. A state-of the-art survey of TOPSIS applications. Expert Syst. Appl. 2012, 39, 13051–13069. [Google Scholar] [CrossRef]
- Wątróbski, J.; Jankowski, J.; Ziemba, P.; Karczmarczyk, A.; Zioło, M. Generalised framework for multi-criteria method selection. Omega 2019, 86, 107–124. [Google Scholar] [CrossRef]
- Jacquet-Lagreze, E.; Siskos, J. Assessing a set of additive utility functions for multicriteria decision-making, the UTA method. Eur. J. Oper. Res. 1982, 10, 151–164. [Google Scholar] [CrossRef]
- Ebrahimnejad, S.; Mousavi, S.; Tavakkoli-Moghaddam, R.; Hashemi, H.; Vahdani, B. A novel two-phase group decision making approach for construction project selection in a fuzzy environment. Appl. Math. Model. 2012, 36, 4197–4217. [Google Scholar] [CrossRef]
- Gil-Aluja, J. Elements for a Theory of Decision in Uncertainty; Springer: Boston, MA, USA, 1999. [Google Scholar] [CrossRef]
- Barron, F.H.; Barrett, B.E. Decision quality using ranked attribute weights. Manag. Sci. 1996, 42, 1515–1523. [Google Scholar] [CrossRef]
- Hobbs, B.F. A Comparison of Weighting Methods in Power Plant Siting. Decis. Sci. 1980, 11, 725–737. [Google Scholar] [CrossRef]
- Alemi-Ardakani, M.; Milani, A.S.; Yannacopoulos, S.; Shokouhi, G. On the effect of subjective, objective and combinative weighting in multiple criteria decision making: A case study on impact optimization of composites. Expert Syst. Appl. 2016, 46, 426–438. [Google Scholar] [CrossRef]
- Németh, B.; Molnár, A.; Bozóki, S.; Wijaya, K.; Inotai, A.; Campbell, J.D.; Kaló, Z. Comparison of weighting methods used in multicriteria decision analysis frameworks in healthcare with focus on low- and middle-income countries. J. Comp. Eff. Res. 2019, 8, 195–204. [Google Scholar] [CrossRef] [PubMed] [Green Version]
- Domazetović, F.; Šiljeg, A.; Lončar, N.; Marić, I. GIS automated multicriteria analysis (GAMA) method for susceptibility modelling. MethodsX 2019, 6, 2553–2561. [Google Scholar] [CrossRef]
- Triantaphyllou, E. Multi-Criteria Decision Making Methods. In Multi-Criteria Decision Making Methods: A Comparative Study; Springer: Boston, MA, USA, 2000; pp. 5–21. [Google Scholar] [CrossRef]
- Deng, H.; Yeh, C.H.; Willis, R.J. Inter-company comparison using modified TOPSIS with objective weights. Comput. Oper. Res. 2000, 27, 963–973. [Google Scholar] [CrossRef]
- Fischer, G.W. Range Sensitivity of Attribute Weights in Multiattribute Value Models. Organ. Behav. Hum. Decis. Process. 1995, 62, 252–266. [Google Scholar] [CrossRef]
- Mareschal, B. Weight stability intervals in multicriteria decision aid. Eur. J. Oper. Res. 1988, 33, 54–64. [Google Scholar] [CrossRef]
- Ouenniche, J.; Pérez-Gladish, B.; Bouslah, K. An out-of-sample framework for TOPSIS-based classifiers with application in bankruptcy prediction. Technol. Forecast. Soc. Chang. 2018, 131, 111–116. [Google Scholar] [CrossRef] [Green Version]
- Liern, V.; Pérez-Gladish, B. Multiple criteria ranking method based on functional proximity index: Un-Weighted TOPSIS. Ann. Oper. Res. 2020. [Google Scholar] [CrossRef]
- Benítez, R.; Liern, V. Unweighted TOPSIS: A new multi-criteria tool for sustainability analysis. Int. J. Sustain. Dev. World Ecol. 2021, 28, 36–48. [Google Scholar] [CrossRef]
- Vicens-Colom, J.; Holles, J.; Liern, V. Measuring Sustainability with Unweighted TOPSIS: An Application to Sustainable Tourism in Spain. Sustainability 2021, 13, 5283. [Google Scholar] [CrossRef]
- Wu, H.Y.; Tzeng, G.H.; Chen, Y.H. A fuzzy MCDM approach for evaluating banking performance based on Balanced Scorecard. Expert Syst. Appl. 2009, 36, 10135–10147. [Google Scholar] [CrossRef]
- Jahanshahloo, G.R.; Lotfi, F.H.; Izadikhah, M. Extension of the TOPSIS method for decision-making problems with fuzzy data. Appl. Math. Comput. 2006, 181, 1544–1551. [Google Scholar] [CrossRef]
- Bellman, R.E.; Zadeh, L.A. Decision-Making in a Fuzzy Environment. Manag. Sci. 1970, 17, B141–B164. [Google Scholar] [CrossRef]
- Lai, Y.J.; Hwang, C.L. Fuzzy Mathematical Programming; Springer: Berlin/Heidelberg, Germany, 1992. [Google Scholar] [CrossRef]
- Moffatt, I. On measuring sustainable development indicators. Int. J. Sustain. Dev. World Ecol. 1994, 1, 97–109. [Google Scholar] [CrossRef]
- Fazlagić, J.; Skikiewicz, R. Measuring sustainable development—The creative economy perspective. Int. J. Sustain. Dev. World Ecol. 2019, 26, 635–645. [Google Scholar] [CrossRef]
- León, T.; Liern, V.; Pérez-Gladish, B. A multicriteria assessment model for countries’ degree of preparedness for successful impact investing. Manag. Decis. 2019, 58, 2455–2471. [Google Scholar] [CrossRef]
- Wang, Y.J. A fuzzy multi-criteria decision-making model by associating technique for order preference by similarity to ideal solution with relative preference relation. New Sensing and Processing Technologies for Hand-based Biometrics Authentication. Inf. Sci. 2014, 268, 169–184. [Google Scholar] [CrossRef]
- Freudenberg, M. Composite Indicators of Country Performance: A Critical Assessment; OECD Publishing: Paris, France, 2003. [Google Scholar] [CrossRef]
- Acuña-Soto, C.; Liern, V.; Gladish, B. Multiple criteria performance evaluation of YouTube mathematical educational videos by IS-TOPSIS. Oper. Res. 2020, 20, 1–23. [Google Scholar] [CrossRef]
- Cables, E.; Lamata, M.; Verdegay, J. RIM-reference ideal method in multicriteria decision making. Inf. Sci. 2016, 337–338, 1–10. [Google Scholar] [CrossRef]
- Saisana, M.; Saltelli, A.; Tarantola, S. Uncertainty and Sensitivity Analysis Techniques as Tools for the Quality Assessment of Composite Indicators. J. R. Stat. Soc. Ser. (Stat. Soc.) 2005, 2, 307–323. [Google Scholar] [CrossRef]
- Munda, G.; Nardo, M. Constructing Consistent Composite Indicators: The Issue of Weights. 2005. Available online: https://core.ac.uk/download/pdf/38619689.pdf (accessed on 20 September 2021).
- Munda, G.; Nardo, M.; Saisana, M.; Srebotnjak, T. Measuring uncertainties in composite indicators of sustainability. Int. J. Environ. Technol. Manag. 2009, 11, 7–26. [Google Scholar] [CrossRef] [Green Version]
- OECD. Handbook on Constructing Composite Indicators: Methodology and User Guide; OECD Publishing: Paris, France, 2008. [Google Scholar]
- Murias, P.; de Miguel, J.C.; Rodríguez, D. A Composite Indicator for University Quality Assesment: The Case of Spanish Higher Education System. Soc. Indic. Res. 2008, 89, 129–146. [Google Scholar] [CrossRef]
- Ivanova, I.; Arcelus, F.J.; Srinivasan, G. An assessment of the measurement properties of the human development index. Soc. Indic. Res. 1999, 46, 157–179. [Google Scholar] [CrossRef]
- Zheng, B. An axiomatic characterization of the Watts poverty index. Econ. Lett. 1993, 42, 81–86. [Google Scholar] [CrossRef]
- Smilkstein, G. The family APGAR: A proposal for a family function test and its use by physicians. J. Fam. Pract. 1978, 66, 1231–1239. [Google Scholar]
- R Core Team. R: A Language and Environment for Statistical Computing; R Foundation for Statistical Computing: Vienna, Austria, 2021. [Google Scholar]
- van Rossum, G.; Drake, F. Python Language Reference, Version 3.8; Python Software Foundation, Centrum voor Wiskunde and Informatica: Amsterdam, The Netherlands, 2021. [Google Scholar]
- López-García, A. uwTOPSIS. 2021. Available online: https://github.com/Aaron-AALG/uwTOPSIS (accessed on 20 September 2021).
- Ishizaka, A.; Labib, A. Review of the main developments in the analytic hierarchy process. Expert Syst. Appl. 2011, 38, 14336–14345. [Google Scholar] [CrossRef] [Green Version]
Publisher’s Note: MDPI stays neutral with regard to jurisdictional claims in published maps and institutional affiliations. |
© 2021 by the authors. Licensee MDPI, Basel, Switzerland. This article is an open access article distributed under the terms and conditions of the Creative Commons Attribution (CC BY) license (https://creativecommons.org/licenses/by/4.0/).