Abstract
The method of the analysis of different texts styles is developed in the paper. Integer numerical sequences are used as models. The elements of the sequence are the number of letters in the words of the text. The algorithm for calculating the exact value of the fractal dimension is developed. It provides the determination of the exact value of the Hurst index. The value of the power dependence constant is calculated. The obtained indicators in the aspect of fractality completely describe the objects of research.
1. Introduction
One of the urgent linguistics tasks in developing text analysis systems is to consider this text in terms of mathematical objects. In this sense, the studied text should be represented by an appropriate mathematical model. As such a text model, the authors chose an integer equidistant sequence.
The essence of the model is that numbers replace the sequence of words in the text. Each number corresponds to the number of the letters in the words of this text. Punctuation can initially be removed, and the sequence can be taken as regular. This sequence is similar to an equidistant time series with integer values. In the text, such a sequence is not related to time as it is given in a time series but is subordinate to a sequence of words. However, it is a mathematical object, and the same methods can be applied to it as to time series.
Recently, or rather the last two decades, the fractal approach and its methodology fractal analysis have become very common in terms of time series.
Fractal analysis is used in wide applications in economic and financial problems related to time series processing. The efficiency of analysis, modeling, identification, and forecasting of the system’s dynamics, as well as processes of phenomena development and objects behavior, has increased. It is widely used in various fields of research and production activities as a means of preliminary presentation of the object under study.
Today, fractal analysis is present in almost any field that involves processing various data, as it provides the use of several critical characteristics for their classification, interpretation, and prediction. Such features include the fractal dimension of the time series, the Hurst time series trend index, the R/S constant of the relationship between the indicators of variation-the scope of the cumulative series, and the root mean square value of the same series.
However, the inspiration for the publication of this study was the results of fractal analysis of more than 70 excerpts from various texts of about 200 words translated into seven languages. The original texts were translated into three languages with Cyrillic font and four with Latin. In total, the dataset consists of 560 samples. All texts were presented for model study in the form of an integer equidistant sequence. The results showed a significant difference in the obtained fractal parameters. In addition, methods of statistical analysis were also used for this model of texts, namely:
- Descriptive statistics;
- Correlation analysis between the original text and its translations;
- Approximation of histograms by the number of letters in words.
Each text, as well as its translations, showed significant differences in the calculated indicators. Moreover, the biggest part of text mining models is built on morphological or sentimental analysis; however, the presentation of the text as a time series is interesting too. It allows one to use other models for the text modeling and prediction, particularly for the text word or phrase prediction.
This study is not about the fractal analysis of the text itself. Still, it concerns applying fractal analysis to such a model for different texts to identify differences between them in fractal parameters.
The working hypothesis here is as follows: we can use fractal analysis for the given text model. Therefore, this study aims to develop a fractal analysis method for an integer sequence that corresponds to linguistic data in a given representation, namely, the number of letters in words, without all additional characters.
The main contributions of this paper are the following:
- The text is presented as regular sequence of random events without semantic representation. It allows us to use the classical methods of time series analysis.
- The method for calculating the exact value of the fractal dimension is developed.
- The fractal analysis model is presented. It can be used for Hurst index calculation.
The material of the paper is presented in three sections: the choice and justification of the model, the essence and features of the application of fractal analysis to such models, and the presentation of the results of fractal analysis of different text styles.
2. State of the Arts
Text modeling, in particular the mathematical apparatus, is not something new. The model in the form of a regular integer sequence can be assigned to the class of the events’ flow only as a random number of letters in words. Here, the number of letters determines the randomness, but not the probability of a particular word. In this case, the question immediately arises—what is the relationship between the sequence of words in the sentences of the text and the number of letters in the words of these sentences? Unfortunately, in the linguistic literature, the authors found neither the answer about the existence of such a model of the text nor whether there is any connection between the number of letters in words and their content. However, the statistical analysis of more than 70 passages of different texts of about 200 words and their translations into seven languages, totaling 490 copies, showed a significant difference in the results obtained when applying fractal analysis. Methods of statistical analysis were used for this text mode, namely, descriptive statistics, correlation analysis between the original text and its translations, approximation of histograms by the number of letters in words, and methods of nonlinear dynamics, such as the following:
- Fractal analysis (fractal dimension, Hurst index and constant);
- R/S power dependence;
- Phase analysis (quasi-cycle parameters); and
- Construction of recurrent diagrams.
Each text, as well as its translations, showed significant differences in the calculated indicators. Analysis of publications confirmed the widespread use of fractal analysis and the model’s legitimacy with an integer regular numerical sequence.
In [1], the R/S analysis technique is given with the representation of the Hurst index, which considers the role of the constant. Different methods of fractal dimension determining are given in [2], namely, using the Hurst index and using the correlation integral, which is known as the Grassberger–Procaccia method or algorithm. The evaluation of the Hurst exponent in [3] was performed by three methods: R/S, DFA, and wavelet analysis, as well as the results of comparison of these methods. In [4], several remarks on fractal dimension and Hurst index are given.
In [5], the methods of estimating the fractal dimension, the Hurst index, and very importantly, the analytical methods of calculating the constant of the power dependence of the R/S ratio are given. Two methods of determination—R/S analysis and the segment-variation method—are presented in [6]. This segment-variation technique is quite close to the technique used by the authors of this study. In [7], the relationship between the Hurst index and R/S analysis regarding the classification of a time series of the foreign exchange market is presented. It is shown that the Hurst index is a metric that can provide information about the correlation and stability in the time series. The book [8] gives a clear, accessible, and simple presentation of the mathematical properties of fractal objects and time series, particularly the fractal dimension and the Hurst index. In [9], the features of the cellular method of determining the fractal dimension are revealed; in particular, it is indicated that part of the incompletely filled cells is included in the calculation.
In addition, the difficulty of counting cells increases when their size is reduced. In [10], the influence of external additive noise on the cellular algorithm for calculating fractal indicators of time series of finite volumes is analyzed. It was found that the effect of noise is surprisingly large—a relatively small external noise implies an increase in the value of the error by three to four orders of magnitude more. Slight noise is usually part of any real data studied. As mentioned in this article, one should be careful when drawing conclusions based on numerically calculated fractal parameters for experimental data. The main types of models used in linguistic research and their use to solve various linguistic problems are considered in [11]. Here are the main approaches to understanding the concept of the model in linguistics. In [12], the approaches relevant for mathematical modeling of linguistic objects are considered, the expediency of the application of mathematical methods is substantiated, and the basic principles of creation of mathematical models are discussed. To eliminate the shortcomings of existing models of text documents, Reference [13] proposed a unified form of a meaningful model of the text, which is based on the synthesis of logical–linguistic models of his sentences and described the algorithm for constructing such a model. In [14], the theoretical issues of modeling use in linguistics are investigated, with an emphasis on linguistic models and their features. Additionally, in the linguistic aspect, the characteristic features of the models and the main stages of their creation are described. In addition, the main areas where the method of modeling has qualitatively changed the paradigm of linguistic research are indicated. Elements of the theory and application of integer flows are covered in [15]. It is indicated that such flows are elementary equidistant streams of events with random values of amplitudes.
The fractal properties of thematic information flow from the Internet are discussed in [16], and, as a database for a computational experiment, the network news monitoring system InfoStream was chosen. The method of calculating Hurst indicators for the cluster defined by the subject of the query is presented and a qualitative interpretation of the results is given. In [17], it is shown that the analysis of information flows has become one of the main methods of searching for patterns of functioning of the world system of scientific communication.
The basics of integration of information flows are covered in References [18,19], which also presents mathematical models, elements of information retrieval theory, and the concept of in-depth text analysis (text mining) to information flows.
One of the important areas of quantitative research of language and speech is the work [20], which examines the study of information and statistical properties of the text. Calculations of sentence and word length in the works of R. Ivanychuk are given. The obtained results are compared with similar indicators in Ukrainian prose.
An example of a formal business style in a report on pedagogical practice is given in [21]. A conversational style of speech is given in [22]. In [23], an example of artistic style is provided; in [24], an example of the scientific style is given. An example of journalistic style is given in [25]. The confessional style of the text is given as an example in [26]. An example of epistolary style is given in [27]. An example of the style is Lina Kostenko’s poem “And everything in the world must be experienced”, is presented on the site [28]. The English text for this study is taken from the website [29].
The processing of a huge number of short texts on social networks, as shown in [30], is mainly carried out by the above five methods. The most used are the hidden selection of Dirichlet and factorization of non-negative matrices. Methodical and practical presentation of the theory of fractals is given in [31], precisely in terms of data processing. Thematic modeling as a way to build a model of a collection of text documents, as given in [32], determines which topics each of the documents belongs to. The analysis of phono-statistical structures of texts is devoted to the work [33]. The model of determining the degree of interaction of artistic texts (drama background) and conversational styles is built. In [34], the statistical analysis attempts to determine the degree of interaction of the underpinnings of artistic style (poetry, fiction, drama).
Unfortunately, the publications presented in this study on the model of the visual structure of the text are used the constant for the ratio of variation. That is why the scope of the cumulative series of numerical sequence to its standard deviation could not be detected.
3. Materials and Methods
3.1. Text Representing by a Regular Sequence of Random Events
The analysis of any time series should answer the source’s features and properties that generate this series. In other words, the completeness of the obtained indicators indicates the possibilities of such a source but does not suggest its physical nature.
One type of experimental data is the flow of events or random variables with their distribution law. This flow of discrete random variables in the literature and researchers is called a time series. The peculiarity of a time series is that the values of its elements (levels) correspond to fixed, i.e., specific moments. For example, the number of products from the given volume of resources, the number of defective parts in the sequence of released batches of parts, etc.
Moments of fixing levels can be both regular–equidistant time series, i.e., fixation occurs at regular intervals, and irregular–random time series, when levels are fixed at random moments in time.
If we are not talking about fixing levels in time, such a series is called a numerical sequence. One variation of this sequence is a sequence with integer values of level values.
Visually, the nature of the representation of such discrete sequences may be different. For example, in the form of a diagram or a regular sequence of pulses of the same duration, but different (mostly random) amplitude, as in Figure 1a. If the values of the elements are given in points and segments of lines connect two adjacent points, then we have a normal graphical representation of a random process, as in Figure 1b.
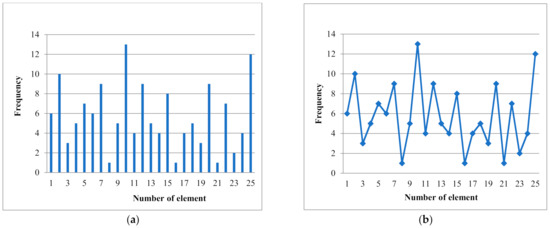
Figure 1.
Types of representation of numerical sequences: chart (a) and chart random process (b).
Since the elements of the sequence take positive integer values, on the graph, these values will correspond to the divisions of the ordinate scale. The ordinate scale corresponds to the value of the number of letters in the words, and the abscissa scale corresponds to the order of these words.
We have a sequence of random events given by a specific generator. These events can be one-dimensional, i.e., characterize one property, or be multidimensional. It can be characterized by a vector of relevant features (e.g., frequency of use in the dictionary, number of synonyms, degree of relevance, etc.) describing their properties, features, and relationships with the text.
The analysis of such a sequence is carried out similarly to a sample or time series analysis. The essence of discreteness here refers to the independent variable represented by integers on the abscissa. These numbers are an ordered set of indices of the elements of this sequence.
In most cases, this set of elements can be considered as elements variants of the usual sample. However, if the events occur one after another regularly or accidentally, we are dealing with a discrete process.
Obviously, such a sequence can be represented as follows [2]:
- A regular sequence of elements, when the intervals between them are precisely defined and do not change their size, i.e., ;
- If there are permissible deviations from regularity, then ;
- Intervals are random variables: .
In this view, the sequence is analogous to a discrete process because the distance between the elements is actually the duration of the element.
The discreteness of the elements є sequence will have a functional representation if the values of the elements are numerical values. In this case, integer positive values are considered, i.e., the sequence of levels looks like this [2]
and sets, where Z is the set of values of the elements and I is the set of their indices.
3.2. Fractal Analysis of Regular Sequence
The vast majority of processes that describe the development of phenomena, system dynamics, the behavior of individual objects, or populations are fractal objects because they have a fractal feature such as self-similarity. In other words, in the sequence of data, some fragments are similar in one sense or another. Today, there are many professional and popular publications on fractal analysis in various fields of scientific interest. Fractal analysis in recent decades has been widely used in modern research in various fields of human cognitive activity.
Fractal analysis is based on the following two indicators:
- The fractal dimension; and
- The related indicator, which is often called the Hurst index, the trend indicator, or the Hurst exponent.
It is these two indicators that determine the methodology of fractal analysis.
3.2.1. Cellular Method for Determining the Fractal Dimension
A fractal dimension is a quantity that indicates how completely an object fills the space in which it is located. The fractal dimension is preferably determined by the cellular method. The cellular method is based on the Hausdorff dimension, which was proposed 100 years ago and developed by Bezikovich. The essence of this indicator is that in the Cartesian coordinate system on the graphic image of this sequence grids are superimposed with different cell sizes.
Next, the number of cells should be counted for each grid where at least one point is presented. After calculating the cells, a line is constructed for each grid on a different graph. Still, in a double logarithmic coordinate system, dots are plotted, the abscissas of which are the logarithms of the cell sizes of the grids used, and the ordinates are the logarithms of the number of cells occupied by the cell sequence. These 4–6 points are used to construct a regression line in this system and its approximation by a linear trend. The constructed regression line has a negative angular factor. The absolute value of this angular coefficient is the value of the fractal dimension for a given sequence of elements.
3.2.2. Determination of the Hurst Index
There are many different methods for determining the Hurst index. The authors used the connection of the fractal dimension with the power function of G. Hearst—the Hurst index in the form of a simple relation, shown by B. Mandelbrot [2]:
Graphs of the equidistant sequence, with grids superimposed on them, are shown in Figure 2. The markers on this graph indicate the position of the sequence elements; light lines indicate the scale of the ordinate axis; dark lines visualize the grid cells and their dimensions. These two values formed the basis of a number of indicators of fractal analysis.
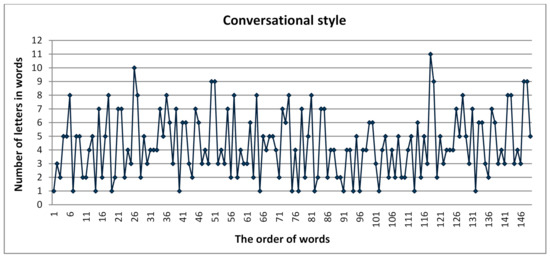
Figure 2.
Graphic model of conversational style text.
3.2.3. Determination of the Degree Dependence Constant
Here, the exponent H appears in the power dependence between two indicators of variation for the same numerical series. The fact is that the variation of the values of the levels of a numerical sequence or time series can be represented by two indicators: standard deviation and the range of a number of cumulative sums for the same series . The relationship between these values corresponds to the following power dependence [2]:
This dependence is characterized by two indicators: a constant C and an indicator H. Function (3), as a rule, always accompanies fractal analysis, especially to determine the indicator H. This function depends on two parameters C and H, and for known values of other quantities, it is impossible to determine the value H when the constant C is unknown. In practice, values are often taken , which is incorrect and unjustified. There is, unfortunately, a significant number of publications where the constant together with the independent variable is raised to the H power, such as , but such an action is a gross error.
3.3. Fractal Analysis Model
So, formally, fractal analysis or a elements’ sequence, can be represented as follows:
The main indicators of its result are the fractal dimension D, the Hurst index, and the constant C.
4. Results
4.1. Text Preparation
In this study, equidistant sequences of integer elements were used as text models. The texts represented by these models take into account only the sequence of words and the number of letters in these words. The construction of such models is that the texts selected for research are converted into numerical sequences in this way.
Punctuation and any other characters, including apostrophes and hyphens, were removed. The separator between the words is a space. Since the selected passages of texts consisted of different volumes of words, it was decided to limit their volumes to the same size, namely to 150 words. The fact is that for fractal analysis, the volume of sequence elements is an independent variable, and its value affects the calculated indicators. In this case, we are talking about the procedure of fractal analysis. Therefore, when conducting such an analysis for several different texts, they all must be in the same conditions. This increases the legitimacy of the use of fractal analysis, especially in the problems of text identification.
The cleaned text is represented as a vector of words sequence. Figure 2 shows a model of conversational text style as a sequence of words and the number of letters in words.
To implement an experimental study, the main measuring tool of which is a grid, it is necessary to determine the size of the grid cells, depending on the maximum number of letters in the words of the studied text. The result is a table of two columns: the left for the words and the right for the number of letters in them.
4.2. Set the Size of the Grid Cells
The minimum size of the cells’ grid means that for an equidistant numerical sequence, the value of each of its elements has its one and only cell. Based on the fact that the grid cells have the shape of a square, their size is strictly determined by the divisions of the ordinate scale. In this case, superimposing a minimum grid on the graph of a given sequence will mean that the value of any element displayed by the corresponding coordinates will be localized within one cell, and the number of occupied cells will be equal to the number of elements in this sequence.
4.3. Determining the Number of Cells
To determine the number of cells of a particular grid, it is necessary to set their minimum size and its change frequency. The fact is that if the sequence is regular, each grid must correspond to the discreteness of the sequence, i.e., the size of the grid cells is a multiple of the cell size for one element. Figure 2 shows (black lines) multiples of the minimum cell (shown in gray), containing one element of the sequence with a minimum value of one letter, for example, the word № 8. To determine the number of cells of the grid of this size, cover the graph of the sequence groups of two, three, four, five, and six elements.
This figure clearly shows how localized the sequence elements’ markers are depending on the grid cells’ size. The positions of the marker’ centers coincide with the divisions of the scale of the letters’ numbers for integer values of the elements. This provides an accurate cell count for a sequence of integer values.
Therefore, the authors propose to count the number of cells for equidistant sequence as follows.
- (1)
- The number of grid cells is determined for each group, covering the vertical cells with the minimum and maximum values of the elements in each group.
This implies the following calculation: for groups of two elements, the size of the grid cells is , which are divisions of the scale on the ordinate axis for the values of the elements, for a group of three elements it is according to the division of this scale, and similarly for other groups.
- (2)
- Fractal dimension is calculated. The essence of the proposed method is as follows.
The number of mesh sizes or group sizes is preferably 4 to 5 and is quite sufficient for further calculation of the fractal dimension (Figure 3).
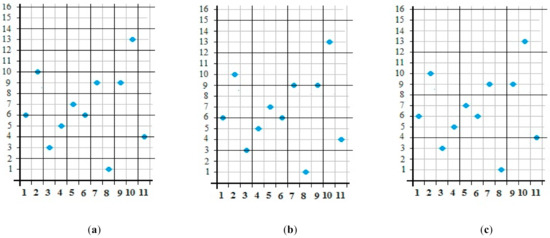
Figure 3.
A set of grids superimposed on a graphic image of the sequence. Here, the graph markers indicate the number of letters in the word sequence: 2—(a), 3—(b), 4—(c).
- (3)
- For each group and for each grid, one has to calculate the value between the maximum and minimum values of the elements included in this group and divide this value by the size of the grid cell. Obviously, the group size and the cell size must match, and or the number of cells of a specific grid size can be determined as follows:
As a result of summing the values in parentheses, the number of cells will be obtained as . The value is generally a fractional number, but it is the exact value of the number of cells of a given size that cover a given sequence.
4.4. Determination of the Fractal Dimension D of the Sequence
The fractal dimension is calculated by the Hausdorf-Bezikovich cell method. This method has two significant disadvantages. The first is that, when used directly, it gives inflated values of the number of cells and makes a corresponding error in the calculations. The second disadvantage of this method is that counting the number of cells, especially for long rows, requires the development of special programs, which requires researchers to program or at least find appropriate programs and learn to use them.
In this study, the authors proposed and implemented a method for calculating the fractal dimension. The method is a modification of the classical method, using the exact value of the number of cells. The first formula of the system (4) follows the calculation algorithm D, the essence of which is as follows. The fractal dimension is a parameter of the interconnection function, which characterizes the relationship dependence.
That is, the ratio of the logarithm of the number of grid cells (with the number m) is covering the logarithm of the cell size in this grid. The value of this parameter is defined as the absolute value of the angular coefficient of the approximating point of the line graph in the double logarithmic coordinate system, which corresponds to abscissa and ordinate .
As shown in Table 1, to determine the fractal dimension, it is necessary to provide a relationship between the number of grid cells covering the sequence graph and the cell size of the grid.

Table 1.
The relationship between the number of cells in the grid covering the sequence graph and the cell size of the grid.
Let the grid with cell sizes be alternately superimposed on the sequence chart to count the number of cells: , , , , and .
The method for fractal dimension determination is developed. It consists of the following steps:
- (a)
- Column O, starting with cell O2 contains number of letters for a particular text, as shown in Table 1;
- (b)
- In the first row of columns P, Q, R, S, and T in cells P1, Q1, R1, S1, and T1 is indicated the nominal size of the group divided by the sequence. It corresponds to the cell size of a particular grid. In cells P2, Q2, R2, S2, and T2, formulas give the value of the size of the fractal cell;
- (c)
- Further calculations are performed according to Formula (5);
- (d)
- Autocomplete forms columns with values of differences in the specified intervals;
- (e)
- The formulas form step (c), to calculate the number of cells in a group of words that correspond to the cell sizes for specific grids. However, as a result of such a “sliding” calculation, due to autocomplete, the division of the sequence into groups is destroyed. Therefore, to obtain the exact value of the number of cells of the grid that covers the graph, in accordance with Formula (5), it is necessary to determine the value of their sum. Thus, for a grid with the size of cells , it is necessary to calculate the sum in cells P2, P4, P6,…; for a grid , it is necessary to calculate the sum of cells Q2, Q5, Q8,…; for a grid , it is necessary to calculate the sum of cells R2, R6, R10,…; for a grid it is necessary to calculate the sum of cells S2, S7, S12,…; for the grid , it is necessary to calculate the sum of cells T2, T8, T14,…. To find the number of cells for a particular grid, only certain values for each column P, Q, R, S, and T should be calculated. In other words, the sum of every second cell, starting with the first, for column P should be calculated. We should calculate the sum of every third cell for column Q, every fourth cell for R, every fifth cell for S, and every sixth cell for T. It should be done starting the calculation each time from the first cell;
- (f)
- To find the value of the fractal dimension, the table of correspondence between the size of the grid cells and the number of cells of this grid is calculated (Table 2).
Table 2. The correspondence between the size of the grid cells and the number of cells.
We construct a graph on a double logarithmic scale according to the given values of logarithms, as shown in Figure 4.
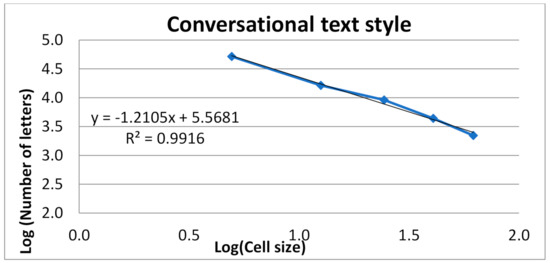
Figure 4.
Approximation of fractal values.
The value of the fractal dimension D is determined by the absolute value of the angular coefficient for the equation of the trend line of the graph, i.e., the fractal dimension of this sequence of discrete quantities in the case of the text is equal to D = 1.3105.
4.5. Determining the Hurst Exponent
The Hurst index characterizes the type of process that dominates the dynamics of the time or number series. The Hurst index shows the share of chaos present in the series. As you know, there are three types of behavior: fluctuations in the values of the elements of the series; random changes in the values of levels, close to Brownian motion; and the existence of a trend.
The Hurst index is defined in the segment [0,1], and its content is within the following limits:
- If 0 ≤ H < 0.5, the levels are oscillating;
- If H = 0.5, the series is an example of random Brownian motion;
- If 0.5 < H ≤ 1, the series is fractal with the presence of a trend.
Today, the values of the Hurst index are determined by various methods, mainly using Equation (3), neglecting the constant C. This indicator is easy to determine from the second equation included in system (4), i.e., from the equality specified by B. Mandelbrot, using Formula (2). In other words, in contrast to the approach described in the vast majority of relevant publications, the value of the exponent H is determined by the value of the fractal dimension D. Therefore, using Formula (2), the value of the Hurst index is equal H = 2 - D.
4.6. Determination of the R/S Ratio Constant
The R/S ratio is the ratio of two indicators of variation related to the arithmetic mean. The relative change of one of these quantities causes a relative proportional change of the other value, regardless of their initial size. By its nature, this relation is a power function and is formally described by the third equation of system (4). From this equation for a known value of H, the expression for the value of the constant has the following form:
Here, Rn is the scope of the cumulative series, Sn is the standard deviation, C is the constant, n is the amount of data, and H is the Hurst exponent. The constant C is, in fact, a coefficient of proportionality and characterizes the nature of the generator of any data, whether a numerical sequence or a time series.
As a result of the corresponding calculations on models of texts of different styles, the values of fractal indicators are given in Table 3 and Table 4.
Table 3.
Parameters of the different styles.
Table 4.
Fractal characteristics of English text.
The change in fractal indicators in relation to a particular style of selected texts is shown in Figure 5a. The graph of fractal indicators values is shown in Figure 5b for the English text. Since the cumulative series scale value significantly exceeds the value of other indicators, the yogi is removed from the graphs.
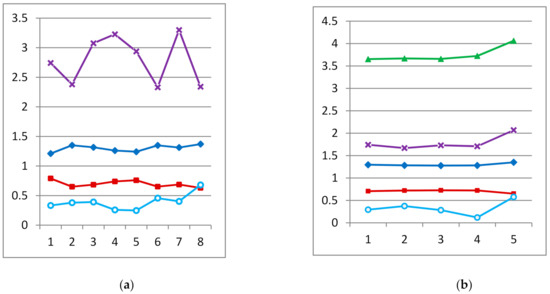
Figure 5.
Visualization of the data of Table 3 and Table 4 except for the indicator R. On the left the graph is the indicators for styles (a), and on the right for the English text (b). The bottom-up order is as follows: constant, Hurst index, fractal dimension, standard deviation, and arithmetic mean.
Since the main goal was to establish differences between linguistic objects and styles, and given that the combinations of indicators and styles are very different, it was decided to conduct a cluster analysis. Here, the objects of analysis are styles, and their features are the resulting fractal and statistical indicators. Cluster analysis was performed according to the method described in [35,36,37]. The results of this analysis are given in Table 5 for the distances between objects and groups, and are displayed by the corresponding dendrogram in Figure 6.
Table 5.
The results of cluster analysis.
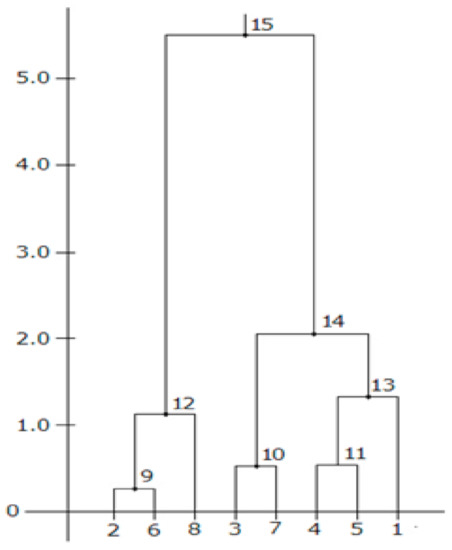
Figure 6.
The dendrogram of cluster analysis.
Thus, due to the calculations based on the authors’ model, a set of fractal indicators was obtained. The obtained data correspond to the working hypothesis and the purpose of the study, as they indicate the existing differences in the texts and fragments.
5. Discussion
The obtained model results, in general, confirm a hypothesis about differences of fractal indicators, both for the texts that are different on styles and for parts of one text. However, the following two remarks must be made
- First, each text style has the same form of paragraphs, indents, punctuation, etc. These elements disappear in the model. As a result, the texts lose their specific style features. However, the results of the study indicate that such differences still occur;
- Secondly, the material used is enough to make any statistical conclusions for only short texts.
Thus, the obtained results are only the first attempt to test the hypothesis about the scientific and practical value of such a text model in computational linguistics and artificial intelligence in text analysis. Nevertheless, it is possible, in general, to note the following moments:
- In terms of fractal indicators, the poem style has the most significant value of the fractal dimension, and the conversational style has the smallest value. In our opinion, this can be explained by the fact that colloquial language mainly uses short words, and the poem style uses rhyming pairs of words, which can be quite long.
- The fractal dimension values for the artistic, confessional, scientific, and epistolary style are very close. This can be explained as follows: the first two styles focus on the perception of the content by the average reader, and the second two are already focused on a specific reader, i.e., specialist. Business and journalistic style are quite close.
- The Hurst index is rigidly related to the fractal dimension. It requires an analysis of the meaning of the text for its interpretation. The fact is that this indicator characterizes the trends in the fluctuations of the levels of the numerical sequence. Therefore, there remains the problem of how to connect it with the text size.
- The constant on the set of two-parameter functions is a parameter of position or scale. From physical point of view, this constant characterizes the material, environment, and conditions. In terms of mathematical problems, it comes from solving differential equations and integrals. From Table 3 we can form the following classification: for business and journalistic texts, it has the lowest value (0.26 and 0.25); for colloquial texts, the value is slightly higher (0.33); for artistic, scientific, and epistolary texts, the value is even higher (0.38, 0.39, and 0.402, respectively); for confessional texts and poems, its value is the largest (0.46 and 0.68, respectively). The correspondence of fractal indicators to these styles remains problematic.
- The journalistic style has the smallest value of the power function constant, and the poetic style has the most significant value of this constant. The value of this constant differs almost three times, and this is only for eight short texts.
- According to statistical indicators, the most significant value of the average word length is slightly less for scientific text style. Business style (6.42 and 6.36), as well as artistic, confessional, and poetic styles have close average lengths (4.22, 4.34, and 4.37, respectively); journalistic and epistolary styles are also quite close to this indicator (5.43 and 5.44, respectively), and there is a separate conversational style (4.76). The value of the indicator of the first two styles of indicators can be explained by the presence of long terms in the texts: technical, economic, political, and others. Journalistic and epistolary styles have relatively high but almost the same average word lengths.
- The standard deviation values for artistic, confessional, and epistolary styles are the smallest (2.38, 2.33, and 2.34, respectively), and the largest values of this indicator are for business and epistolary styles (3.23 and 3.30, respectively). Conversational, scientific, and business styles have a value of this indicator between these two groups (2.74, 2.94, and 3.07, respectively).
- The scope of the cumulative series is quite difficult to interpret because the cumulative series is very nonlinear. According to this indicator, the most significant values are conversational and epistolary styles (47.4 and 41.4, respectively), and the least significant values are artistic and confessional styles (23.4 and 27.7, respectively). The other scientific, business, journalistic, and poetic styles are located between these two groups.
- In the analysis of the English text, as shown in in Figure 6, the behavior of fractal and statistical indicators gives grounds to draw the following conclusions. First, all indicators confirm the high homogeneity of the first four parts of the text. Here, as in the previous discussion, the behavior of the scope of the cumulative series was not considered, although for the first three parts it differs a little from the fourth and fifth parts.
- The results of the cluster analysis confirm the difference between the styles even if the editing method was used to construct the proposed values.
6. Conclusions
The study, according to the proposed method, gave grounds for its practical usage. However, such an investigation requires the presence of a highly qualified linguist in the field of stylometry.
It is possible to treat fractal analysis of numerical sequences differently. It allows one to consider a statistical method or one of the nonlinear dynamics methods and consider it as a separate methodology. In addition, when reviewing publications, the authors understand the essence of these methods; in fact, only two main ones include the fractal dimension D and the Hurst index H. All other methods follow from the Hurst index.
This method is a logical implementation of the known procedures of fractal analysis with the addition of quasi-cycles identification and determining the R/S ratio constant. Its advantage is that proposed method provides a rigorous mathematical representation of the fractal dimension values, the Hurst index, and the constant concerning variation indicators. First of all, the essence of this presentation is a warning to researchers against misinterpretation of the relationship , because many researchers ignore the existence of a constant for this relationship. Indeed, this relation is a function with two unknown parameters and cannot be directly determined.
Author Contributions
Conceptualization, R.K. and N.S.; methodology, R.K.; software, N.S.; validation, N.S., Y.K. and J.K.; formal analysis, N.S.; investigation, R.K.; resources, J.K.; data curation, Y.K.; writing—original draft preparation, N.S.; writing—review and editing, J.K.; visualization, Y.K.; supervision, N.S.; project administration, J.K.; funding acquisition, J.K. All authors have read and agreed to the published version of the manuscript.
Funding
This research was supported by the Faculty of Management, Comenius University in Bratislava, Slovakia.
Institutional Review Board Statement
Not applicable.
Informed Consent Statement
Not applicable.
Data Availability Statement
Conversational Style of Speech: Text-Example. Available online: https://ycilka.net/tvir.php?id=291 (accessed on 30.06.2021).
Dudyk P. Stylistics of the Ukrainian Language. Artistic Style of Speech and Speech. Available online: http://litmisto.org.ua/?p=5462 (accessed on 1.07.2021).
Design as a Modern Branch of Human Activity. The Text of the Transfer. Available online: https://skripnikmarina.ucoz.ua/publ/rozvitok_movlennja/mova/stislij_perekaz_tekstu_naukovogo_stilju/13-1-0-69 (accessed on 30.06.2021).
Sports Today (A Debatable Note in a Newspaper in a Journalistic Style). Available online: https://www.ukrlib.com.ua/sochm/printout.php?id=944 (accessed on 30.06.2021).
John 1: 1-17. Available online: http://news.ugcc.ua/bible-quote/%D0%94%D1%96%201:1-8,%20%D0%99%D0%BE%201:1-17 (accessed on 01.07.2021).
Stylistics. An Example of Epistolary Style. Available online: https://sites.google.com/site/stilistikamiller/home/epistolarnij-stil (accessed on 01.07.2021).
Kostenko L. And Everything in the World Must Be Experienced. Available online: https://luol-carmelo.livejournal.com/116992.html (accessed on 01.07.2021).
The Bogey-Beast. Available online: https://americanliterature.com/childrens-stories/the-bogey-beast (accessed on 01.07.2021).
Conflicts of Interest
The authors declare no conflict of interest.
References
- Abuzayed, B.; Al-Fayoumi, N.; Charfeddine, L. Long range dependence in an emerging stock market’s sectors: Volatility modelling and VaR forecasting. Appl. Econ. 2018, 50, 2569–2599. [Google Scholar] [CrossRef]
- Shono, H.; Peng, C.K.; Goldberger, A.L.; Shono, M.; Sugimori, H. A new method to determine a fractal dimension of non-stationary biological time-serial data. Comput. Biol. Med. 2000, 30, 237–245. [Google Scholar] [CrossRef]
- Miniczuk, J.; Wojdyłło, P. Estimation of Hurst exponent revisited. Comput. Stat. Data Anal. 2007, 51, 4510–4525. [Google Scholar] [CrossRef]
- Liu, B.; Yao, L.; Fu, X.; He, B.; Bai, L. Application of the fractal method to the characterization of organic heterogeneities in shales and exploration evaluation of shale oil. J. Mar. Sci. Eng. 2019, 7, 88. [Google Scholar] [CrossRef]
- Fernández-Martínez, M.; Guirao, J.L.G.; Sánchez-Granero, M.Á.; Segovia, J.E.T. Fractal Dimension for Fractal Structures: With Applications to Finance; Springer: Berlin/Heidelberg, Germany, 2019; Volume 19, pp. 20–31. [Google Scholar]
- Orzeszko, W. Fractal dimension of time series as a measure of investment risk. Acta Univ. Nicolai Copernic. Ekon. 2010, 41, 57–70. [Google Scholar] [CrossRef]
- Raimundo, M.S.; Okamoto, J., Jr. Application of Hurst Exponent (H) and the R/S Analysis in the Classification of FOREX Securities. Int. J. Model. Optim. 2018, 8, 116–124. [Google Scholar] [CrossRef]
- Lasota, A.; Mackey, M.C. Chaos, Fractals, and Noise: Stochastic Aspects of Dynamics; Springer Science & Business Media: Berlin, Germany, 2013; Volume 97. [Google Scholar]
- Liu, Y.; Wang, Y.; Chen, X.; Zhang, C.; Tan, Y. Two-stage method for fractal dimension calculation of the mechanical equipment rough surface profile based on fractal theory. Chaos Solitons Fractals 2017, 104, 495–502. [Google Scholar] [CrossRef]
- Chen, X.; Li, J.; Han, H.; Ying, Y. Improving the signal subtle feature extraction performance based on dual improved fractal box dimension eigenvectors. R. Soc. Open Sci. 2018, 5, 180087. [Google Scholar] [CrossRef] [PubMed]
- Wu, X.; Liao, H. A consensus-based probabilistic linguistic gained and lost dominance score method. Eur. J. Oper. Res. 2019, 272, 1017–1027. [Google Scholar] [CrossRef]
- Deng, X.; Wang, J.; Wei, G.; Lu, M. Models for multiple attribute decision making with some 2-tuple linguistic pythagorean fuzzy hamy mean operators. Mathematics 2018, 6, 236. [Google Scholar] [CrossRef]
- Iakovleva, E.A.; Katermina, T.S.; Platonov, V.V.; Vinogradov, A.N. Logical-Linguistic Modeling for Predicting and Assessing the Pandemic Consequences in the Arctic. In Knowledge in the Information Society; Springer: Cham, Switzerland, 2020; pp. 403–416. [Google Scholar]
- Khairova, N.; Lewoniewski, W.; Węcel, K. Estimating the quality of articles in Russian Wikipedia using the logical-linguistic model of fact extraction. In International Conference on Business Information Systems; Springer: Cham, Switzerland, 2017; pp. 28–40. [Google Scholar]
- Kobyzev, I.; Prince, S.; Brubaker, M. Normalizing flows: An introduction and review of current methods. In IEEE Transactions on Pattern Analysis and Machine Intelligence; IEEE: Piscataway, NJ, USA, 2020; pp. 56–78. [Google Scholar]
- Lande, D.; Subach, I.; Puchkov, A. A System for Analysis of Big Data from Social Media. Inf. Secur. 2020, 47, 44–61. [Google Scholar] [CrossRef]
- Ullah, S.; Ahmad, H.N.; Jan, S.U.; Jan, T.; Shah, S.; Butt, N.I.; Jan, M.Y. A statistical analysis of Pakistan Journal of Surgery: A bibliometric lens from 2007–2016. Pak. J. Surg. 2017, 33, 123–127. [Google Scholar]
- Puthal, D. Lattice-modeled information flow control of big sensing data streams for smart health application. IEEE Internet Things J. 2018, 6, 1312–1320. [Google Scholar] [CrossRef]
- Gutman, E.V.; Nurmieva, R.R. Stylistic aspect of translation of social and political vocabulary (On the material of English and Tatar languages). Humanit. Soc. Sci. Rev. 2019, 7, 65–70. [Google Scholar] [CrossRef][Green Version]
- Kulchytskyi, I. Statistical Analysis of the Short Stories by Roman Ivanychuk. In COLINS, CEUR; 2019; Volume 2362, pp. 312–321. [Google Scholar]
- Odinokaya, M.; Krepkaia, T.; Sheredekina, O.; Bernavskaya, M. The culture of professional self-realization as a fundamental factor of students’ internet communication in the modern educational environment of higher education. Educ. Sci. 2019, 9, 187. [Google Scholar] [CrossRef]
- Conversational Style of Speech: Text-Example. Available online: https://ycilka.net/tvir.php?id=291 (accessed on 30 June 2021).
- Dudyk, P. Stylistics of the Ukrainian Language. Artistic Style of Speech and Speech. Available online: http://litmisto.org.ua/?p=5462 (accessed on 1 July 2021).
- Design as a Modern Branch of Human Activity. The Text of the Transfer. Available online: https://skripnikmarina.ucoz.ua/publ/rozvitok_movlennja/mova/stislij_perekaz_tekstu_naukovogo_stilju/13-1-0-69 (accessed on 30 June 2021).
- Sports Today (A Debatable Note in a Newspaper in a Journalistic Style). Available online: https://www.ukrlib.com.ua/sochm/printout.php?id=944 (accessed on 30 June 2021).
- John 1: 1-17. Available online: http://news.ugcc.ua/bible-quote/%D0%94%D1%96%201:1-8,%20%D0%99%D0%BE%201:1-17 (accessed on 1 July 2021).
- Stylistics. An Example of Epistolary Style. Available online: https://sites.google.com/site/stilistikamiller/home/epistolarnij-stil (accessed on 1 July 2021).
- Kostenko, L. And Everything in the World Must Be Experienced. Available online: https://luol-carmelo.livejournal.com/116992.html (accessed on 1 July 2021).
- The Bogey-Beast. Available online: https://americanliterature.com/childrens-stories/the-bogey-beast (accessed on 1 July 2021).
- Albalawi, R.; Yeap, T.H.; Benyoucef, M. Using topic modeling methods for short-text data: A comparative analysis. Front. Artif. Intell. 2020, 3, 42. [Google Scholar] [CrossRef] [PubMed]
- Andronache, I.; Marin, M.; Fischer, R.; Ahammer, H.; Radulovic, M.; Ciobotaru, A.M.; Peptenatu, D. Dynamics of forest fragmentation and connectivity using particle and fractal analysis. Sci. Rep. 2019, 9, 12228. [Google Scholar] [CrossRef] [PubMed]
- Vysotska, V.; Lytvyn, V.; Kovalchuk, V.; Kubinska, S.; Dilai, M.; Chyrun, L.; Brodyak, O. Method of similar textual content selection based on thematic information retrieval. In Proceedings of the 2019 IEEE 14th International Conference on Computer Sciences and Information Technologies (CSIT), Lviv, Ukraine, 17–20 September 2019; Volume 3, pp. 1–6. [Google Scholar]
- Palmquist, M.E.; Carley, K.M.; Dale, T.A. Applications of computer-aided text analysis: Analyzing literary and nonliterary texts. In Text Analysis for the Social Sciences; Routledge: England, UK, 2020; pp. 171–190. [Google Scholar]
- Roberts, C.W. (Ed.) Text Analysis for the Social Sciences: Methods for Drawing Statistical Inferences from Texts and Transcripts; Routledge: England, UK, 2020. [Google Scholar]
- Humphreys, A.; Wang, R.J.H. Automated text analysis for consumer research. J. Consum. Res. 2018, 44, 1274–1306. [Google Scholar] [CrossRef]
- Bohdalová, M.; Bohdal, R.; Valach, V. Short term prediction of gas prices using time series analysis. In Proceedings of the ITISE 2016, Granada, Spain, 27–29 June 2016. [Google Scholar]
- Bohdalová, M.; Bohdal, R. Forecasting of financial time series using fuzzy ARMA approach. In Proceedings of the FSTA 2016, Liptovský Ján, Slovakia, 24–29 January 2016. [Google Scholar]


Publisher’s Note: MDPI stays neutral with regard to jurisdictional claims in published maps and institutional affiliations. |
© 2021 by the authors. Licensee MDPI, Basel, Switzerland. This article is an open access article distributed under the terms and conditions of the Creative Commons Attribution (CC BY) license (https://creativecommons.org/licenses/by/4.0/).