Article

Dynamic Green Growth Assessment of China’s Industrial System with an Improved SBM Model and Global Malmquist Index

1
School of Public Administration, Hunan University of Finance and Economics, Changsha 410205, China
2
School of Public Administration, Xiangtan University, Xiangtan 411105, China
3
School of Management, Hunan University of Technology and Business, Changsha 410205, China
4
School of Business, Central South University, Changsha 410083, China
*
Author to whom correspondence should be addressed.
Mathematics 2021, 9(20), 2594; https://doi.org/10.3390/math9202594
Submission received: 7 September 2021 / Revised: 2 October 2021 / Accepted: 13 October 2021 / Published: 15 October 2021

Abstract

:
This study proposes a method for resource management and optimisation in the industrial sector of China. Differing from previous research on the green assessment of industrial systems focusing on “black box” evaluation, our approach contributes to the two-stage structure of an industrial system that consists of an industrial production process and a pollution treatment process. The corresponding network slack-based model (SBM) is proposed to analyse the performance of China’s provincial industry sector. Based on our network SBM, the global Malmquist index is built to analyse the total factor productivity changes of system and individual processes to evaluate the consistency of sustainable development where dynamic green growth assessment is realized. The results show that the whole system and its pollution treatment process performance are poor and disorganised, while the industrial production process maintains a stable ranking for the 30 regions in China. We find that the main cause of this phenomenon is the variable technical efficiency change in the 30 regions, which reflects the immaturity of the management of the pollution treatment process. System performance is also highly related to regionalism.

1. Introduction

In China’s national economy, the industrial economy plays a remarkably important role, and industrial energy consumption and pollution emissions account for a large proportion of the corresponding national indices. For instance, in 2014, China’s industrial production value amounted to CNY 22.8 trillion, constituting 35.9% of the total gross domestic product (GDP). The industrial energy consumption was 2.96 billion tons of standard coal, equal to 69.4% of the total energy consumption in China. The industrial wastewater emission was 205.3 trillion tons, which was 28.7% of the total wastewater emissions of China [1]. The achievement of economic development with energy conservation and emissions reductions was underlined in the 13th Five-Year Plan of the Chinese government. Therefore, it is important to comprehensively assess green growth of the industrial system that subsumes the production process and pollution treatment process, and to lay out the direction of resource (especially industrial pollution) management and optimisation.
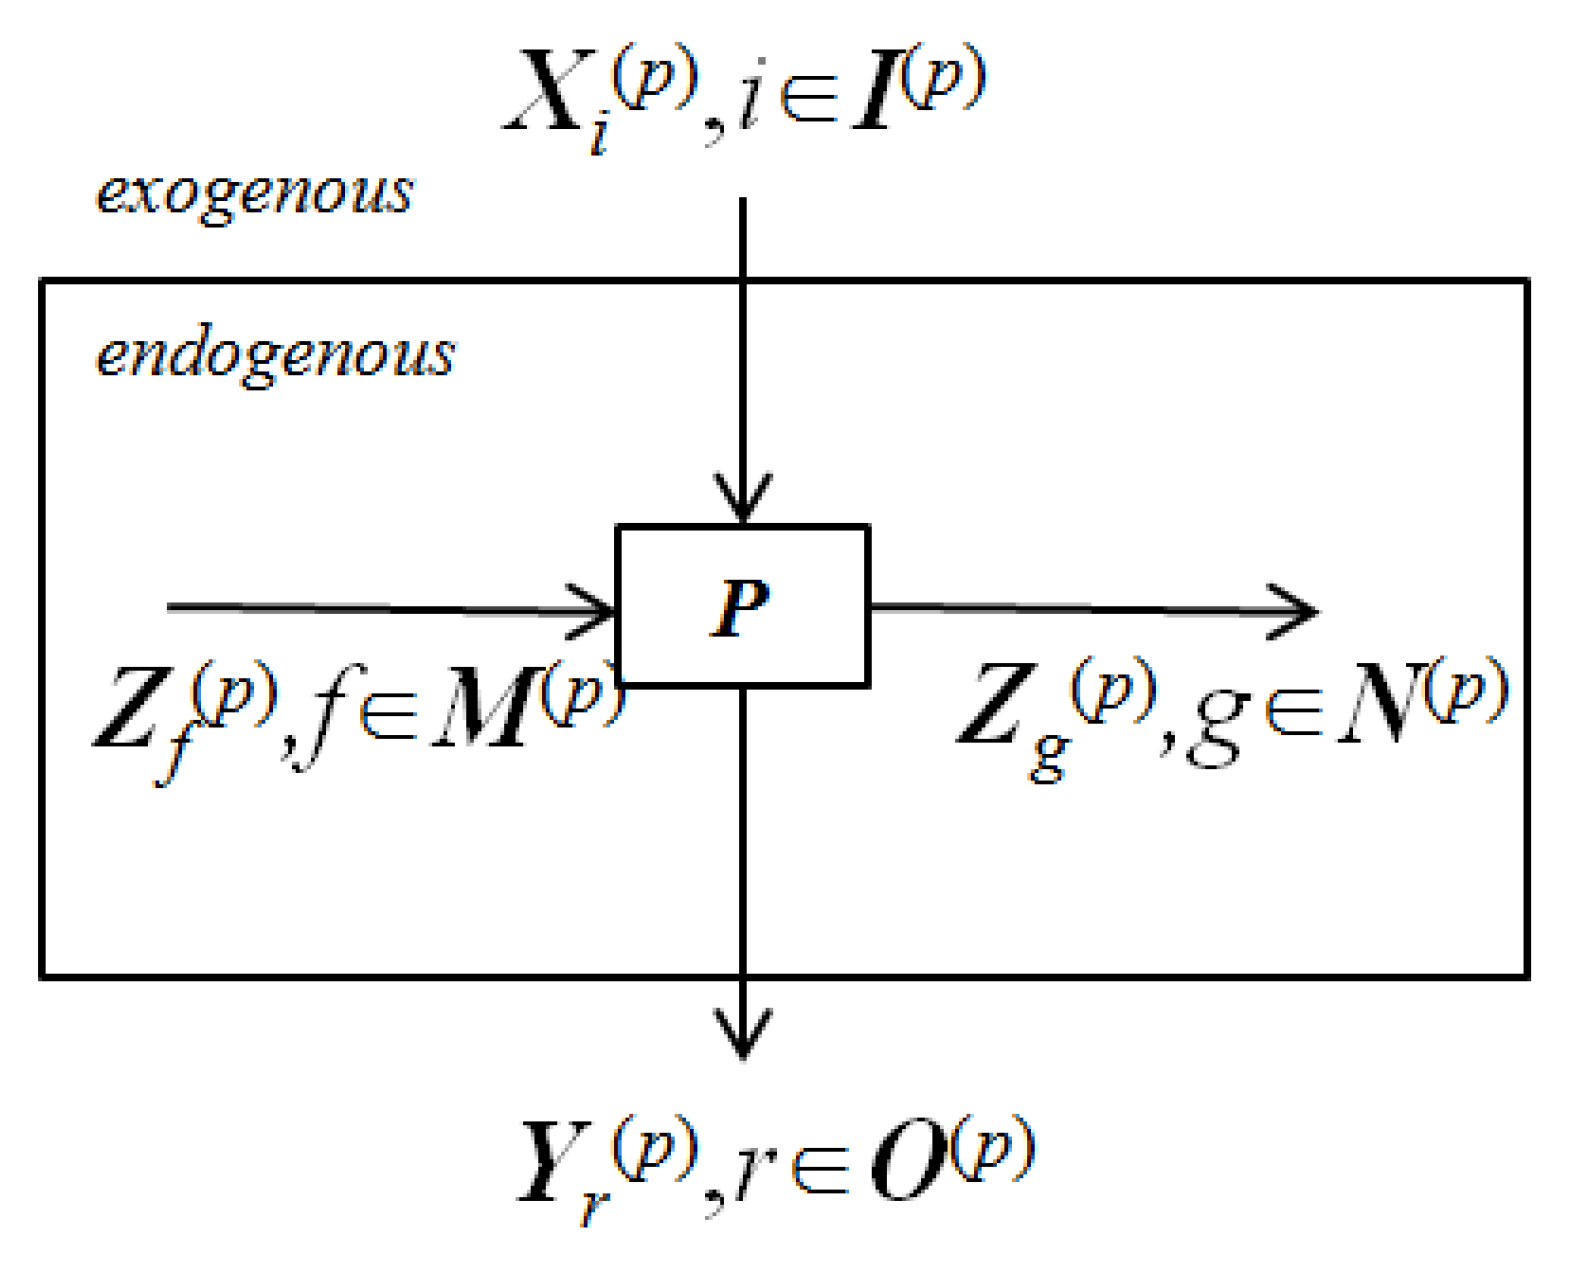
Considering industrial production and pollution treatment in China, this paper regards the system as a general two-stage model (see Figure 1) [2,3,4]. The first process (referred to as industrial production) denotes the industrial production process, while the second process (referred to as pollution treatment) represents the pollution treatment process. The outputs of stage 1 consist of endogenous (intermediate product) and exogenous outputs, where the endogenous outputs are designated in stage 2. The inputs of stage 2 derive from the endogenous and exogenous inputs, wherein the endogenous inputs are the endogenous outputs from stage 1. To render the entire system more perspicuous, the performance of each process ought to be described while the comprehensive performance of the entire system is obtained.
Performance assessment based on input and output is a hot issue in academic research, in that it can display the past outcomes of a decision-making unit (DMU) and the planning for its future improvement. As proposed in the seminal work of Charnes et al. [5], data envelopment analysis (DEA) has been widely used as an effective instrument to measure the efficiency of a set of DMUs. Traditional DEA models evaluate the relative efficiency of DMUs by regarding multiple inputs against multiple outputs [6,7]. One of the shortcomings of these models is that the internal structure of the DMUs is neglected [8]. More specifically, the internal production process of each DMU is treated as a black box, and the internal processes of inputs and outputs are left out of consideration. However, many real production systems have a network structure in which the production process is a sub-process similar to the structure in Figure 1. To address this problem, Färe and Grosskopf [9] introduced a network DEA model for exploring the internal structure of a simple system, where the efficiency of both processes as well as overall efficiency are measured. Subsequently, many scholars have extended the network DEA model [10,11,12] and applied it to various fields [13,14,15,16].
Several studies related to the multistage—and especially the two-stage—structure aim to measure the system and process performance. In light of these studies, the envelopment-based network DEA model can generate the system efficiency and frontier projection, and the multiplier-based network model is able to generate the sub-process efficiency [17]. Tone and Tsutsui [8] provided new insights into this issue by introducing a general slack-based model (SBM) that considers the network structure. However, this approach overlooks the possibility of intermediate products’ nonzero slacks [18]. Kao [19] developed an extended approach that can overcome the ignored slacks in intermediates, and can also decompose the system efficiency into a weighted average of the process efficiencies. Based on the network SBM approach of Kao [19], this paper further considers the characteristics of inputs under the specified structure in Figure 1 that are not treated properly. It is proper that most studies have treated the intermediate product as the undesirable output from the production process, but for the pollution treatment process, the intermediate products should be treated as undesirable inputs (i.e., more immediate products are beneficial to the pollution treatment process) against the desirable input. How to model immediate products in the industrial system is quite important. Therefore, for this paper, we developed an improved network SBM model, and specified this model into the scenario of a two-process structure to measure the performance of the system that comprises China’s industrial production process and pollution treatment process. The global Malmquist index (MI) was adopted to analyse the regional total factor productivity change. By employing our improved network SBM model, we can obtain the system MI and process MI and their corresponding compositions, and then put forward a thorough discussion.
The remainder of this paper is organised as follows: Section 2 presents the literature review. Section 3 introduces the basic and improved methods used in the study. Section 4 presents the datasets, and discusses the results calculated from these data based on the methods in Section 3. Finally, Section 5 concludes this study.

2. Literature Review

The traditional DEA models are typically employed to evaluate the efficiency performance of a DMU that transforms inputs into outputs without considering an internal structure. In such DEA approaches, the internal process of the DMU is treated as a black box, where the inputs are placed into a box and only the outputs that come out of it are considered. Nevertheless, many production systems have a network structure. The production process of the DMU consists of sub-processes. The intermediate products are outputs of one sub-process, and eventually become the inputs of another sub-process.
Färe and Grosskopf [9] unveiled the “black box” for the first time. Subsequently, numerous studies have focused on DMUs with internal network structures, and the models have extended widely. As with the network DEA model proposed by Lewis and Sexton [10], the two-process DEA model of Sexton and Lewis [14] is extended with a multiple-process structure. This study suggests a DEA approach to deal with each node individually for a network system. For the specification of an output-oriented model, a general DEA model is calculated for the first process to obtain the optimal solution of outputs for the first process; for the next process, a portion of the outputs are produced from the upstream process. Hence, when all processes are measured in turn, the outputs obtained at the last process are the optimal outputs. This optimal output is further divided by the observed output to obtain the whole system efficiency. Hwang and Kao [11] and Kao and Hwang [12] also process and decompose the overall efficiency into multiple-process efficiencies; furthermore, another attractive topic is introduced to analyse the differences in performance between divisions in the same process. Specifically, each process is formed into a parallel network structure, and the overall system is formed as a multiple-process and multiple-division structure, as described by Prieto and Zofio [20].
These approaches in the studies assess the efficiency through the radial measure, e.g., the CCR model [5] or the BCC model [21] as the basic DEA methods. These radial models assume that the inputs or outputs keep the same proportional changes at the same time. However, this assumption is not applicable to some situations. Färe and Lovell [22] developed a non-radial measure. This stream of DEA models was improved by Pastor et al. [23], Tone [24], and Hernández-Sancho et al. [25]. This measure uses the slacks to represent the deficit in output and excess in input, and further calculate the efficiencies based on the slacks. The SBM model was changed for network system evaluation by Tone and Tsutsui [8]. Kao [26] formulated an approach that provides information on the divisional efficiency status by examining constraint inequalities and calculating divisional efficiency scores. However, these two cases cannot achieve the Pareto-optimal solutions of the stage efficiency due to the existence of multiple optimal solutions [18]. Consequently, Kao [19] considered the slack variables associated with the intermediate products when measuring system efficiency, in order to obtain the correct results, and thus proposed a two-process method.
Since Färe et al. [27] constructed the Malmquist index (MI) to calculate the total factor productivity change between the two periods (the word “period” is synonymous with the word “cycle” hereafter), the MI has been widely adopted in many studies. Because decomposition of the MI can be easily measured by the DEA models, several studies have chosen the MI for further analysis of DEA models [28,29]. Drawing on the existing literature concerning network DEA combined with the MI, the assumption that the structure is important to the MI studies is not difficult to understand. Löthgren and Tambour [30] and Jahantighi et al. [31] investigated a two-process network structure similar to the structure in Figure 1. Pouryusef et al. [32], Kao and Hwang [33], and Degl’Innocenti et al. [34] probed the traditional two-process structure, in which the outputs of the first process are equal to the inputs of the second process. Lotfi et al. [35] and Fukuyama and Weber [36] considered the carry-over activities and delved into the dynamic network structure. As for the analysis of the MI, Kao and Hwang [33] and Kao [37] measured the system MI, and also obtained the process MI. However, none of these studies paid attention to the decomposition of the process MI.
Studies of green growth assessment are also numerous in the literature to date. Wu et al. [38] proposed a DEA model with non-homogeneous inputs and outputs to evaluate the energy and efficiency measurement of China’s industrial sector. However, their research only focused on static assessment of China’s industrial sector, instead of dynamic assessment (i.e., growth assessment) as in our article. An et al. [39] modified a previous distance friction minimisation model and introduced it to the environmental efficiency concept, where undesirable output is formulated, applying the modified model to the environmental efficiency assessment of China’s industrial system. Nevertheless, it should be noted that their research ignored the internal structure of the industrial system where industrial production and pollution treatment are considered. Chen et al. [40] also investigated the energy-environment efficiency of China’s industrial system via a super-SBM model; unfortunately, productivity analysis was not conducted, and dynamic changes of the obtained efficiency indices were not analysed.
Therefore, this study assesses the dynamic green growth of China’s industrial system with an improved SBM model and global Malmquist index, filling the gaps in the previous research. First, this study optimizes the SBM model which includes the slack variables to ensure the acquisition of system and process efficiency. Second, the extant studies regarding the structure in Figure 1 ignore the characteristics of input variables; thus, we divide the input into two groups, and incorporate the undesirable input into the model. Moreover, we obtain all decomposition of the system and process MI in order to conduct a thorough and comprehensive analysis in terms of dynamic assessment.

3. Modelling

3.1. Basic Network SBM

Considering a general network system as shown in Figure 2, each process p (p = 1, …, q) of DMU j (j = 1,…,n) uses exogenous inputs X i ( p ) , i I ( p ) supplied from outside of the system, and the endogenous inputs Z f ( p ) , f M ( p ) are produced by other processes to produce the exogenous outputs Y r ( p ) , r O ( p ) as the final outputs of the system, while the endogenous outputs Z g ( p ) , g N ( p ) are to be used by other processes. The sets I ( p ) , M ( p ) , O ( p ) , and N ( p ) contain the exogenous and endogenous inputs, and the exogenous and endogenous outputs are used and produced by process p. The production possibility set is defined as:
P = { ( x , y , z ) | j = 1 n λ j ( p ) X i j ( p ) x i ( p ) , i I ( p ) ; j = 1 n λ j ( p ) Z f j ( p ) z f ( p ) , f M ( p ) ; j = 1 n λ j ( p ) Z g j ( p ) z g ( p ) , g N ( p ) ; j = 1 n λ j ( p ) Y r j ( p ) y r ( p ) , r O ( p ) ; λ j ( p ) 0 , j = 1 , , n , p = 1 , , q }
where the number of indices in I ( p ) , M ( p ) , O ( p ) , and N ( p ) are denoted as i ^ ( p ) , o ^ ( p ) , m ^ ( p ) , and n ^ ( p ) , respectively, and s i ( p ) , t f ( p ) , t g ( p ) + , and s r ( p ) + are defined as the slack variables in the four kinds of constraints. Tone and Tsutsui [8] formulate the process efficiency ( E k ( p ) ) and system efficiency ( E k T T ) of DMU k as:
E k ( p ) = 1 ( i I ( p ) s i ( p ) X i k ( p ) + f M ( p ) t f ( p ) Z f k ( p ) ) / ( i ^ ( p ) + m ^ ( p ) ) 1 + ( r O ( p ) s r ( p ) + Y r k ( p ) + g N ( p ) t g ( p ) + Z g k ( p ) ) / ( o ^ ( p ) + n ^ ( p ) ) , p = 1 , , q
E k T T = p = 1 q w ( p ) [ 1 ( i I ( p ) s i ( p ) X i k ( p ) + f M ( p ) t f ( p ) Z f k ( p ) ) / ( i ^ ( p ) + m ^ ( p ) ) ] p = 1 q w ( p ) [ 1 + ( r O ( p ) s r ( p ) + Y r k ( p ) + g N ( p ) t g ( p ) + Z g k ( p ) ) / ( o ^ ( p ) + n ^ ( p ) ) ]
For the process p, the weight w ( p ) is pre-specified to assume its importance to the system. Notably, the weight of each process must be positive and have a sum of 1. The weight w ( p ) can be derived afterwards, and even the same processes can have different importance and weight for the DMUs.
If the weights of each process do not need to be specified beforehand, then the weight w ( p ) can be omitted; thus, Kao [19] formulates the system efficiency as:
E k S = min p = 1 q [ 1 ( i I ( p ) s i ( p ) X i k ( p ) + f M ( p ) t f ( p ) Z f k ( p ) ) / ( i ^ ( p ) + m ^ ( p ) ) ] p = 1 q [ 1 + ( r O ( p ) s r ( p ) + Y r k ( p ) + g N ( p ) t g ( p ) + Z g k ( p ) ) / ( o ^ ( p ) + n ^ ( p ) ) ] s . t . j = 1 n λ j ( p ) X i j ( p ) + s i ( p ) = X i k ( p ) , i I ( p ) , p = 1 , , q j = 1 n λ j ( p ) Z f j ( p ) + t f ( p ) = Z f k ( p ) , f M ( p ) , p = 1 , , q j = 1 n λ j ( p ) Z g j ( p ) t g ( p ) + = Z g k ( p ) , g N ( p ) , p = 1 , , q j = 1 n λ j ( p ) Y r j ( p ) s r ( p ) + = Y r k ( p ) , r O ( p ) , p = 1 , , q λ j ( p ) 0 , j = 1 , , n , p = 1 , , q
The system efficiency E k S and process p efficiency E k ( p ) are defined as:
E k S = p = 1 q [ 1 ( i I ( p ) s i ( p ) X i k ( p ) + f M ( p ) t f ( p ) Z f k ( p ) ) / ( i ^ ( p ) + m ^ ( p ) ) ] p = 1 q [ 1 + ( r O ( p ) s r ( p ) + Y r k ( p ) + g N ( p ) t g ( p ) + Z g k ( p ) ) / ( o ^ ( p ) + n ^ ( p ) ) ]
E k ( p ) = 1 ( i I ( p ) s i ( p ) X i k ( p ) + f M ( p ) t f ( p ) Z f k ( p ) ) / ( i ^ ( p ) + m ^ ( p ) ) 1 + ( r O ( p ) s r ( p ) + Y r k ( p ) + g N ( p ) t g ( p ) + Z g k ( p ) ) / ( o ^ ( p ) + n ^ ( p ) ) , p = 1 , , q
Model (3) from Tone and Tsutsui [8] and Model (4) from Kao [19] are convenient for calculating the system and process efficiencies before or after determining the weight of each process. However, these two models do not take the characteristics of the input and output into consideration. Kao [19] notes that, under different assumptions, the model needs to be modified appropriately. An improved model is then introduced to consider the desirable output, undesirable output, desirable input, and undesirable input.

3.2. Improved Network SBM

Several papers have studied the environmental or energy efficiency that considers desirable and undesirable outputs such as economic income and waste pollution, but few studies take the desirable and undesirable inputs into account [4,25]. Desirable and undesirable inputs can be defined as follows: if the increase in an input will not reduce the desirable outputs, then it is desirable; otherwise, it is classified as undesirable [41]. We also focus on the network system consisting of an industrial production process and pollution treatment process, as shown in Figure 1. In addition, the intermediate products between the production process and management process are defined as several pollutants due to the fact that pollution is inevitable in an industrial system. Thus, considering the characteristics of intermediate products, it is convenient to understand the intermediates as the undesirable outputs of the industrial production process, and as the undesirable inputs of the pollution treatment process. Considering the “weak disposability” of the undesirable outputs and the treatment of the undesirable inputs [41], we formulate the improved two-process model as:
E k S = min [ 1 i = 1 m 1 s i ( 1 ) X i k ( 1 ) / m 1 ] + [ 1 i = 1 m 2 s i ( 2 ) X i k ( 2 ) / m 2 ] [ 1 + r = 1 s 1 s r ( 1 ) + Y r k ( 1 ) / s 1 ] + [ 1 + r = 1 s 2 s r ( 2 ) + Y r k ( 2 ) / ( s 2 + t ) + g = 1 t t g Z g k / ( s 2 + t ) ] s . t . j = 1 n λ j ( 1 ) X i j ( 1 ) + s i ( 1 ) = X i k ( 1 ) , i 1 , , m 1 j = 1 n λ j ( 1 ) Z g j = Z g k , g = 1 , , t j = 1 n λ j ( 1 ) Y r j ( 1 ) s r ( 1 ) + = Y r k ( 1 ) , r = 1 , , s 1 j = 1 n λ j ( 2 ) X i j ( 2 ) + s i ( 2 ) = X i k ( 2 ) , i 1 , , m 2 j = 1 n λ j ( 2 ) Z g j t g + = Z g k , g = 1 , , t j = 1 n λ j ( 2 ) Y r j ( 2 ) s r ( 2 ) + = Y r k ( 2 ) , r = 1 , , s 2 λ j ( 1 ) , λ j ( 2 ) 0 , j = 1 , , n
With the other variables being the same as in Model (4), we denote m 1 , m 2 , s 1 , s 2 , and t as the forms of X 1 , X 2 , Y 1 , Y 2 , and Z , respectively. Model (7) is a nonlinear program; therefore, we transform it into a linear program using Charnes–Cooper transformation [42]:
E k S = min { [ b i = 1 m 1 S i ( 1 ) X i k ( 1 ) / m 1 ] + [ b i = 1 m 2 S i ( 2 ) X i k ( 2 ) / m 2 ] } s . t . [ b + r = 1 s 1 S r ( 1 ) + Y r k ( 1 ) / s 1 ] + [ b + r = 1 s 2 S r ( 2 ) + Y r k ( 2 ) / ( s 2 + t ) + g = 1 t T g Z g k / ( s 2 + t ) ] = 1 j = 1 n Λ j ( 1 ) X i j ( 1 ) + S i ( 1 ) = b X i k ( 1 ) , i 1 , , m 1 j = 1 n Λ j ( 1 ) Z g j = b Z g k , g = 1 , , t j = 1 n Λ j ( 1 ) Y r j ( 1 ) S r ( 1 ) + = b Y r k ( 1 ) , r = 1 , , s 1 j = 1 n Λ j ( 2 ) X i j ( 2 ) + S i ( 2 ) = b X i k ( 2 ) , i 1 , , m 2 j = 1 n Λ j ( 2 ) Z g j T g + = b Z g k , g = 1 , , t j = 1 n Λ j ( 2 ) Y r j ( 2 ) S r ( 2 ) + = b Y r k ( 2 ) , r = 1 , , s 2 λ j ( 1 ) , λ j ( 2 ) 0 , j = 1 , , n
Models (7) and (8) are based on the hypothesis of constant returns to scale (CRS). If we add the constraint j = 1 n λ j = 1 to Model (7), CRS is changed to variable returns to scale (VS).

3.3. Global MI

The Malmquist productivity index (MI) was used to capture the variations in the performance of a decision-making unit (DMU) between two cycles by Färe et al. [27]. The global Malmquist index (GM) proposed by Pastor and Lovell [43] can effectively handle the linear infeasible problem compared with the traditional MI, where the data of all cycles are regarded as the productivity possible set (PPS). Thus, GM has been widely applied recently [44,45].
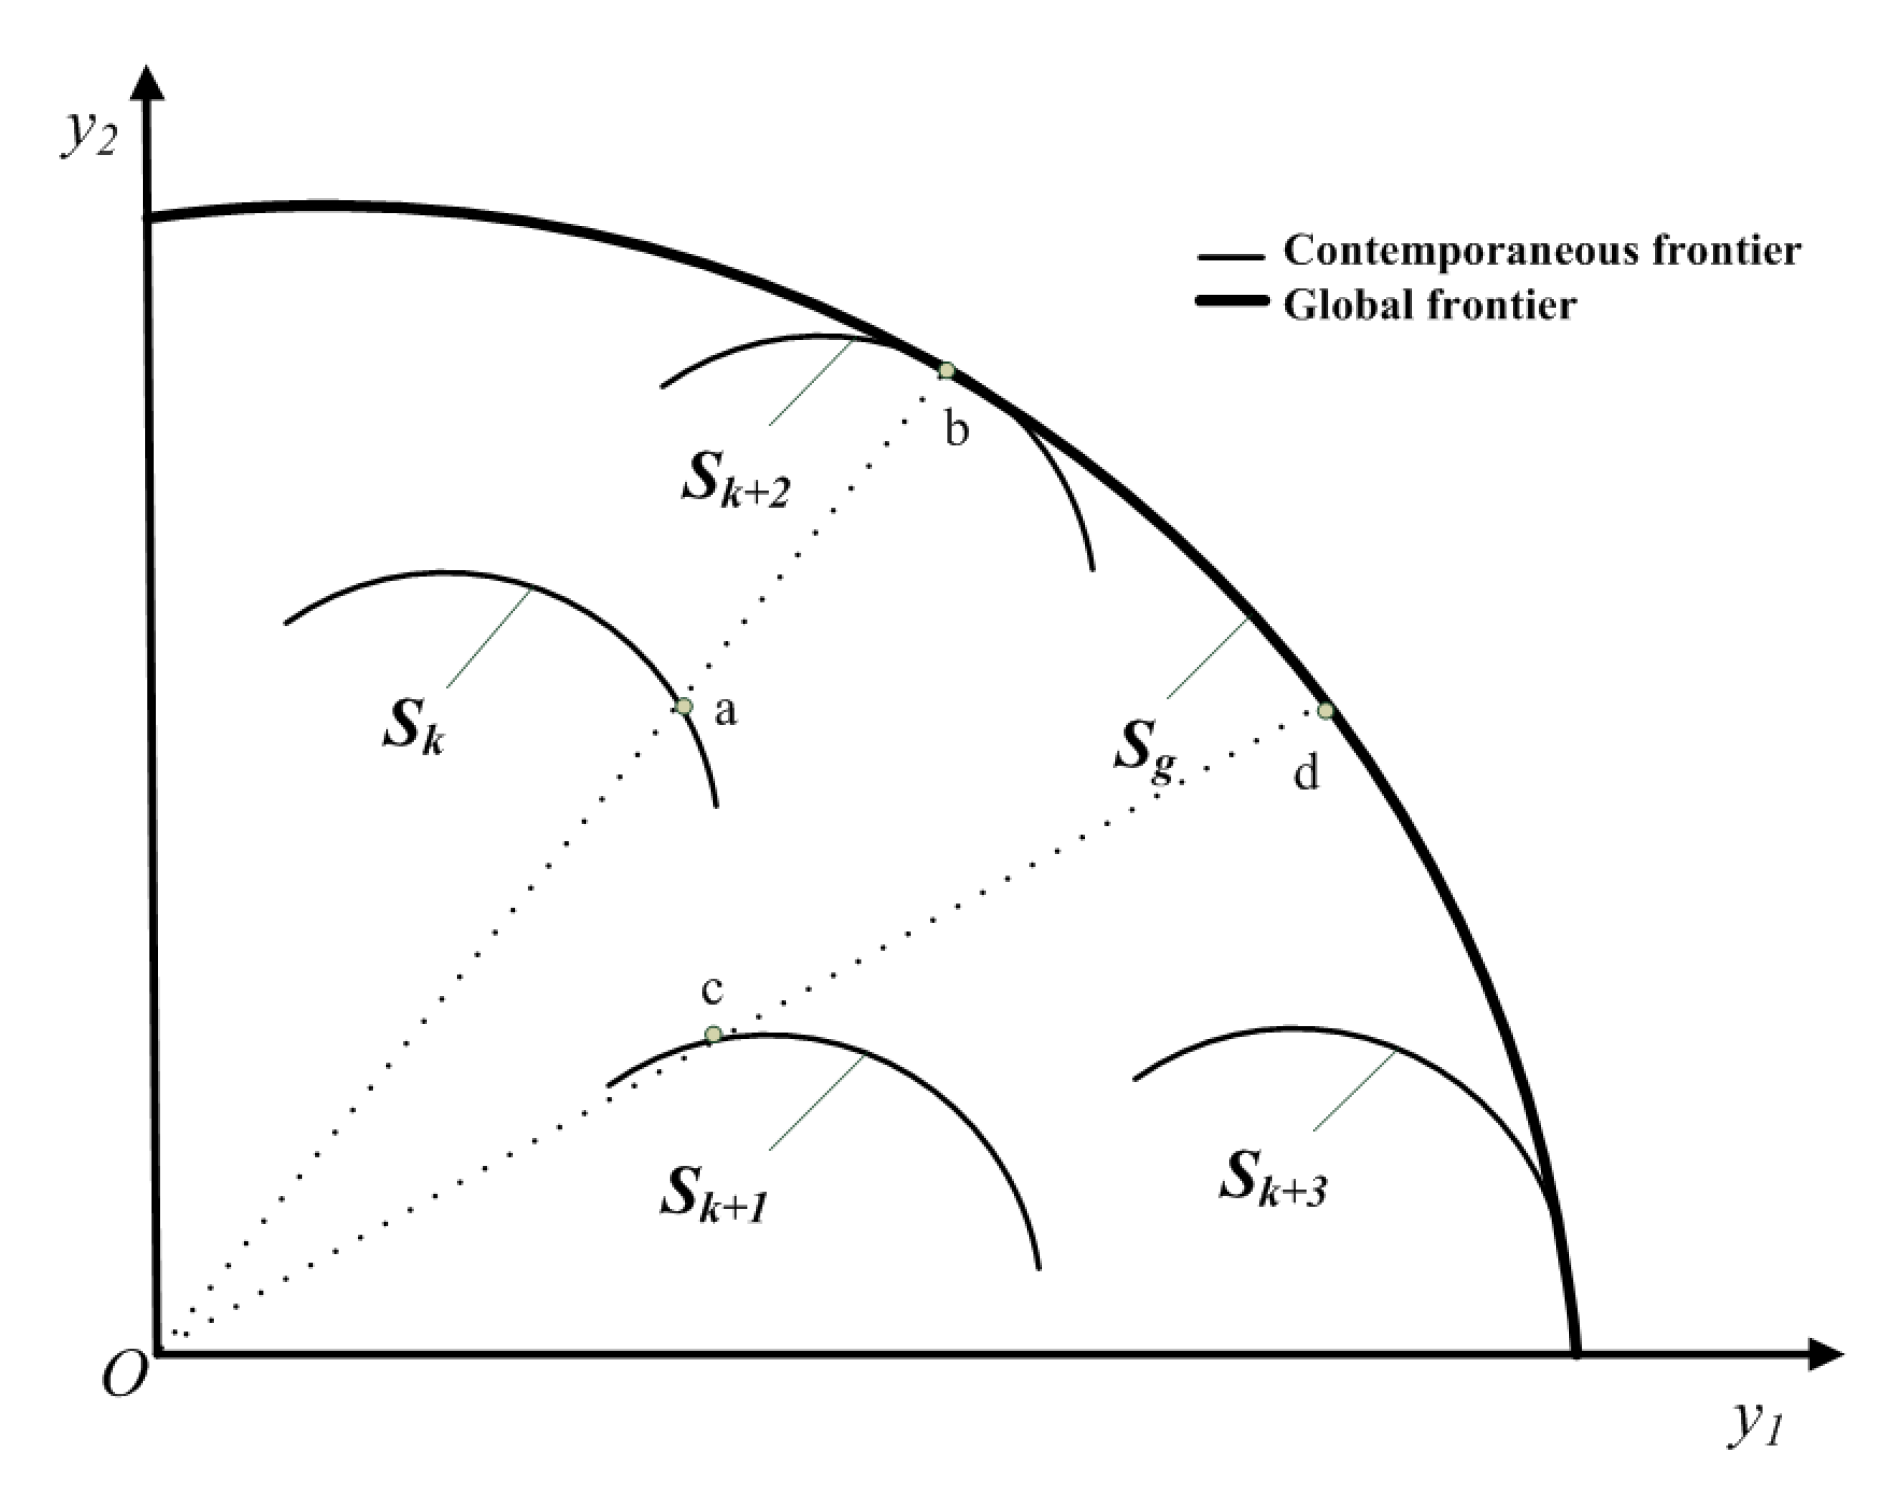
Following the purpose of the GM, denote the number of the period as p and the PPS of the kth period as S k = { ( X k , Y k ) : X   can   produce   Y } . The global PPS is defined as S g = S 1 S 2 S p . Several studies have considered the GM index based on the directional distance function (DDF), but the selection of the direction vector is decided by subjectivity. Hence, we also consider the GM index based on the improved SBM model (2). Accordingly, E g ( x k , y k ) can be regarded as the efficiency generated in Model (2) with the DMU in the kth cycle relative to the global PPS.
Figure 3 shows the contemporaneous frontiers with interior solid lines and the global frontier with a thick solid line, where the subscript on S denotes the time cycle, and four cycles are used for example. Figure 3 clearly shows that the global frontier envelops all contemporaneous frontiers. For instance, assuming that points a and c are the DMUs in the kth and k + 1th periods, then E g ( x k , y k ) and E g ( x k + 1 , y k + 1 ) are equal to o a o b and o c o d , respectively. Therefore, the GM index is the ratio of two efficiencies, given as o c × o b o d × o a . The formulation of the GM index can be shown as:
G M ( x k + 1 , y k + 1 , x k , y k ) = E g ( x k + 1 , y k + 1 ) E g ( x k , y k )
The GM index can be split into efficiency change (EC) and technical change (TC) through Equation (10) (Pastor and Lovell [43]):
G M ( x k + 1 , y k + 1 , x k , y k ) = E g ( x k + 1 , y k + 1 ) E g ( x k , y k ) = E k + 1 ( x k + 1 , y k + 1 ) E k ( x k , y k ) × ( E g ( x k + 1 , y k + 1 ) E k + 1 ( x k + 1 , y k + 1 ) × E k ( x k , y k ) E g ( x k , y k ) ) = E C × T C g
Notably, if GM > 1, a DMU is moving ahead in productivity between two cycles. EC denotes the technical efficiency change index that indicates the catching-up effect of the efficiencies of two cycles with regard to the contemporaneous frontier. If EC > 1, the effect of catching-up is close to the contemporaneous frontier between the two cycles. TC denotes the technical change index that gives the practice gap between the contemporaneous frontier and the global frontier between cycles k and k + 1. TC > 1 indicates technical progress, and vice versa. In Equation (9), the GM index is free from the problem of the infeasibility, and achieves circularity.

4. Application

4.1. Data and Variables

Based on our research purpose and the availability of raw data, we use the provincial data of China during the period 2005–2010 to assess the green growth of China’s industrial system under the 11th Five-Year Plan and analyse regional characteristics for future Chinese government management. For this study, the basic data were taken from the China Statistical Yearbook, China Industrial Economic Statistical Yearbook, and China Environmental Statistical Yearbook. The process and interpretation of variables are presented as follows.
The selection of input and output variables was based on existing literature and industrial production practice [2,3,4,46,47,48,49,50,51]. The inputs of the industrial production process are labour (calculated by the average number of employees per year), capital (net value of fixed assets), and energy consumption per industrial added value (the amount of energy required to produce RMB 10,000 of industrial added value); the desired output is industrial GDP (current value of products, external processing products revenue, and the value difference between the beginning and the end of processing of semi-finished products), and the undesirable output is industrial wastewater emission (the total volume of wastewater discharged by the plants directly). Regarding the pollution treatment process, the inputs include two parts: exogenous input (pollution treatment investment, which is computed by the investment of environmental infrastructure construction and other fixed assets investment), and undesirable output from the industrial production process. The outputs are the comprehensive values of three-waste reutilisation (the current price of the products that are produced using the wastewater, waste gas, and solid waste as materials), the industrial wastewater emission on standard (the volume of wastewater that meets the standard after treatment), industrial sulphur dioxide removal (the volume of sulphur dioxide removal after treatment), and solid waste reutilisation (the volume of solid waste reutilisation throughout the treatment process). The variables and the corresponding descriptive statistics of the raw data are shown in Table A1 of the Appendix A.

4.2. Analytical Results of Efficiency

Based on Model (7) and the selection of variables in Section 4.1, the efficiencies based on the period of 2005–2010 were obtained as shown in Table A2 of the Appendix A. “Process 1” presents the efficiency of the industrial production process, “process 2” presents the efficiency of the pollution treatment process, and the “system” presents the efficiency of the whole system. Notably, the higher the value of efficiency, the more efficient the region. A region can be defined as totally efficient when its efficiency value is 1, and if the value is less than 1, then this region is inefficient and remains to be improved.
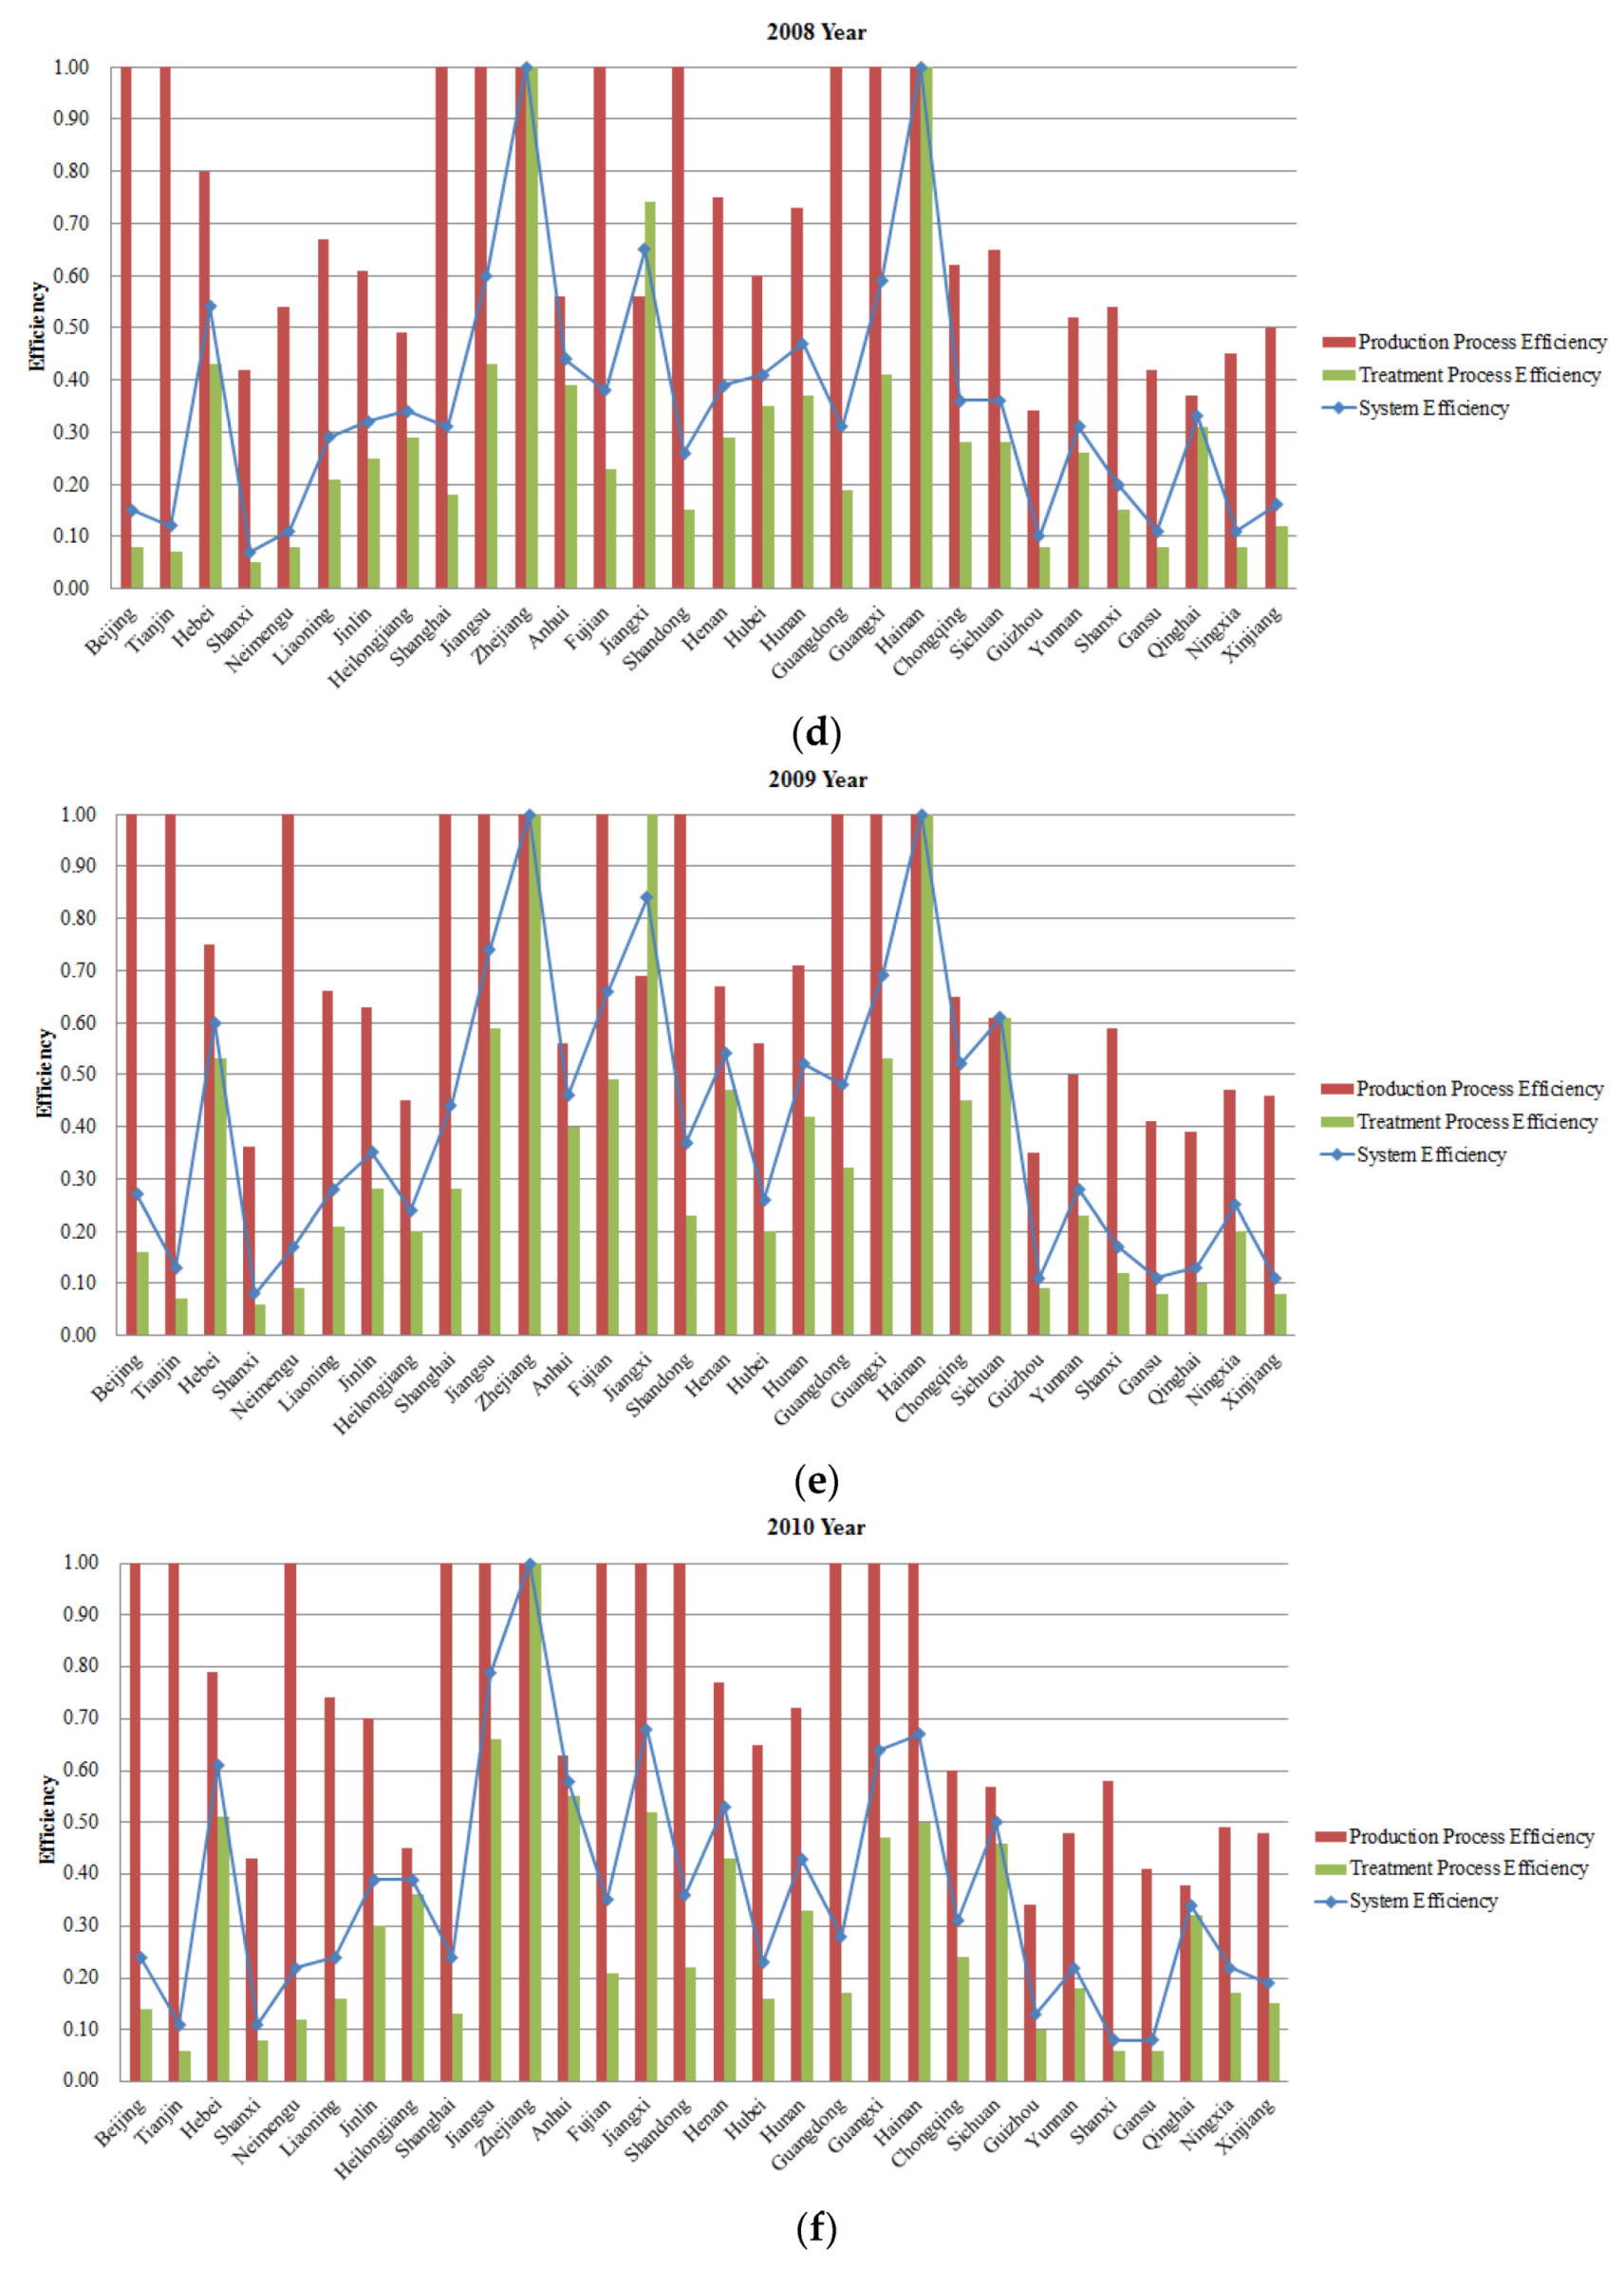
From Table A2 in the Appendix A, we can observe that eight regions maintained the efficiency level of process 1 throughout the whole study period—namely, Beijing, Tianjin, Shanghai, Jiangsu, Fujian, Shandong, Guangdong, and Guangxi. Most of these areas are developed regions and, thus, understanding their efficiency performance in the industrial production process is convenient. However, none of the regions maintained a continuous efficiency in process 2 during the period 2005–2010, where most regions presented a rather low efficiency compared to process 1. Two regions achieve efficiency of process 2 each year; however, these two areas are not consistent. For instance, the efficient regions of process 2 in 2006 were Zhejiang and Chongqing, in 2007 were Zhejiang and Guangxi, and in 2008 were Zhejiang and Hainan. Only Zhejiang has shown efficiency of process 2 in most years. Furthermore, the system efficiency performs the same as process 2, where most regions maintained low efficiency during the study period, and none of the regions had efficient performance in 2005 and 2006.
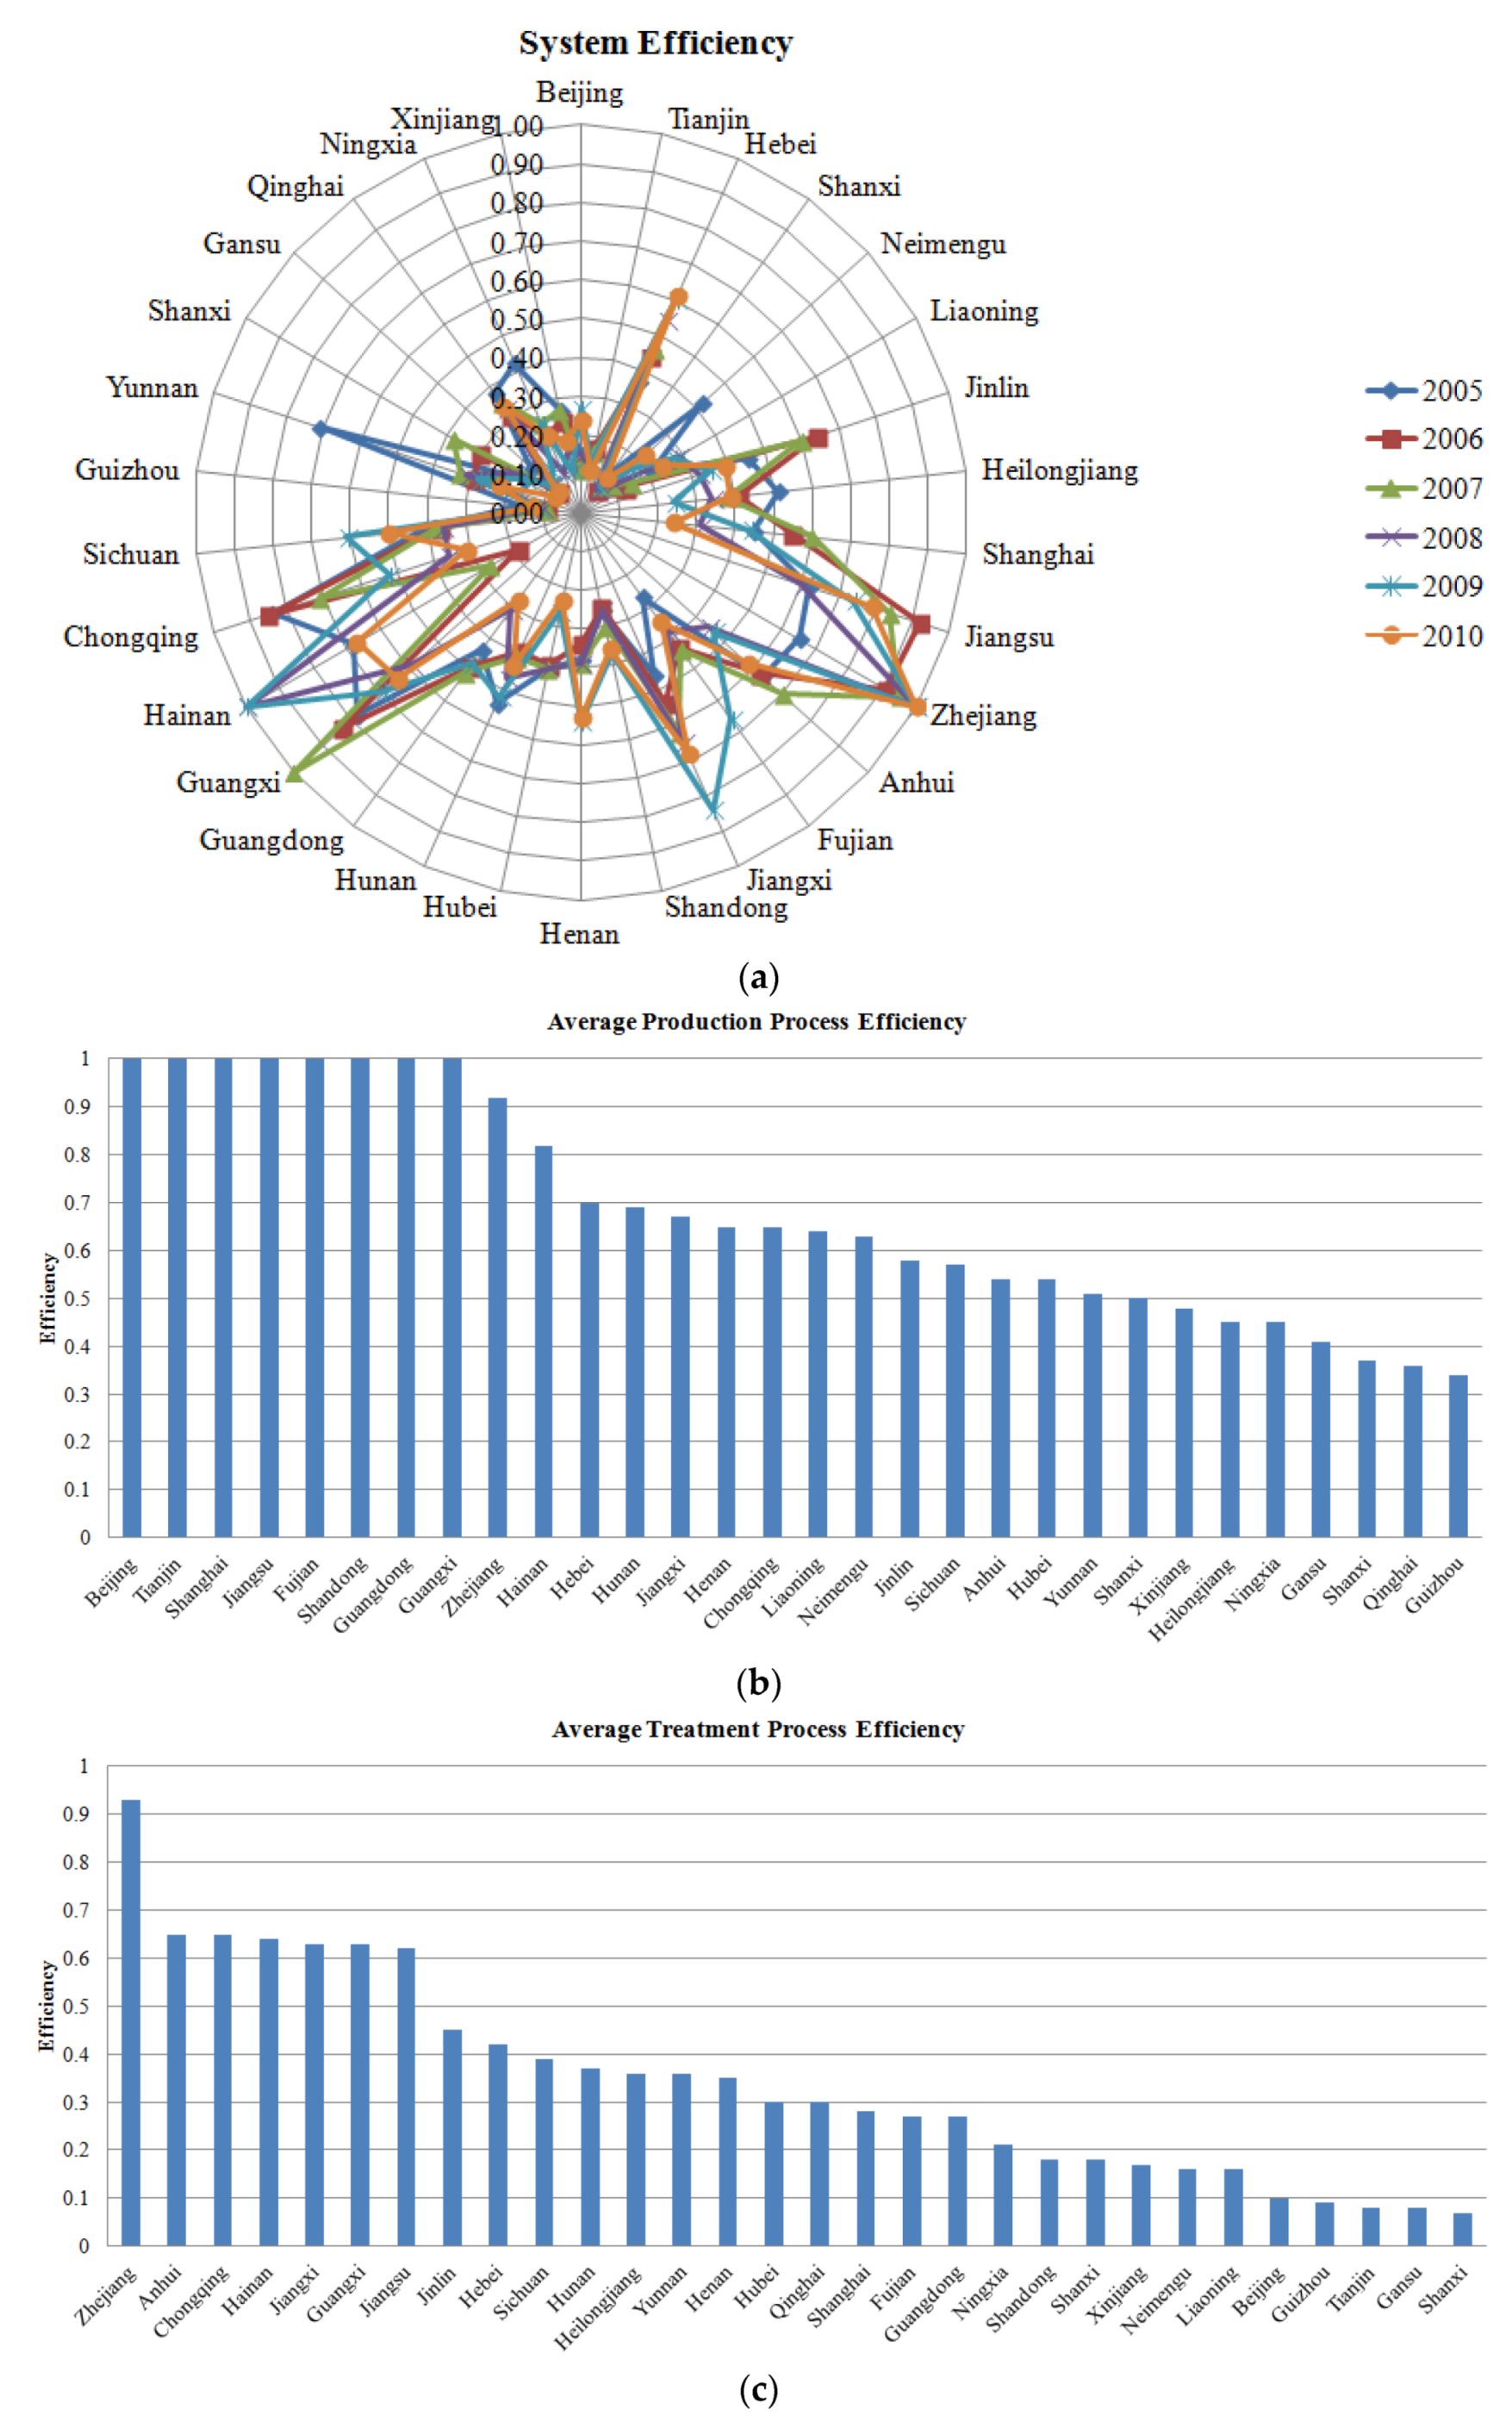
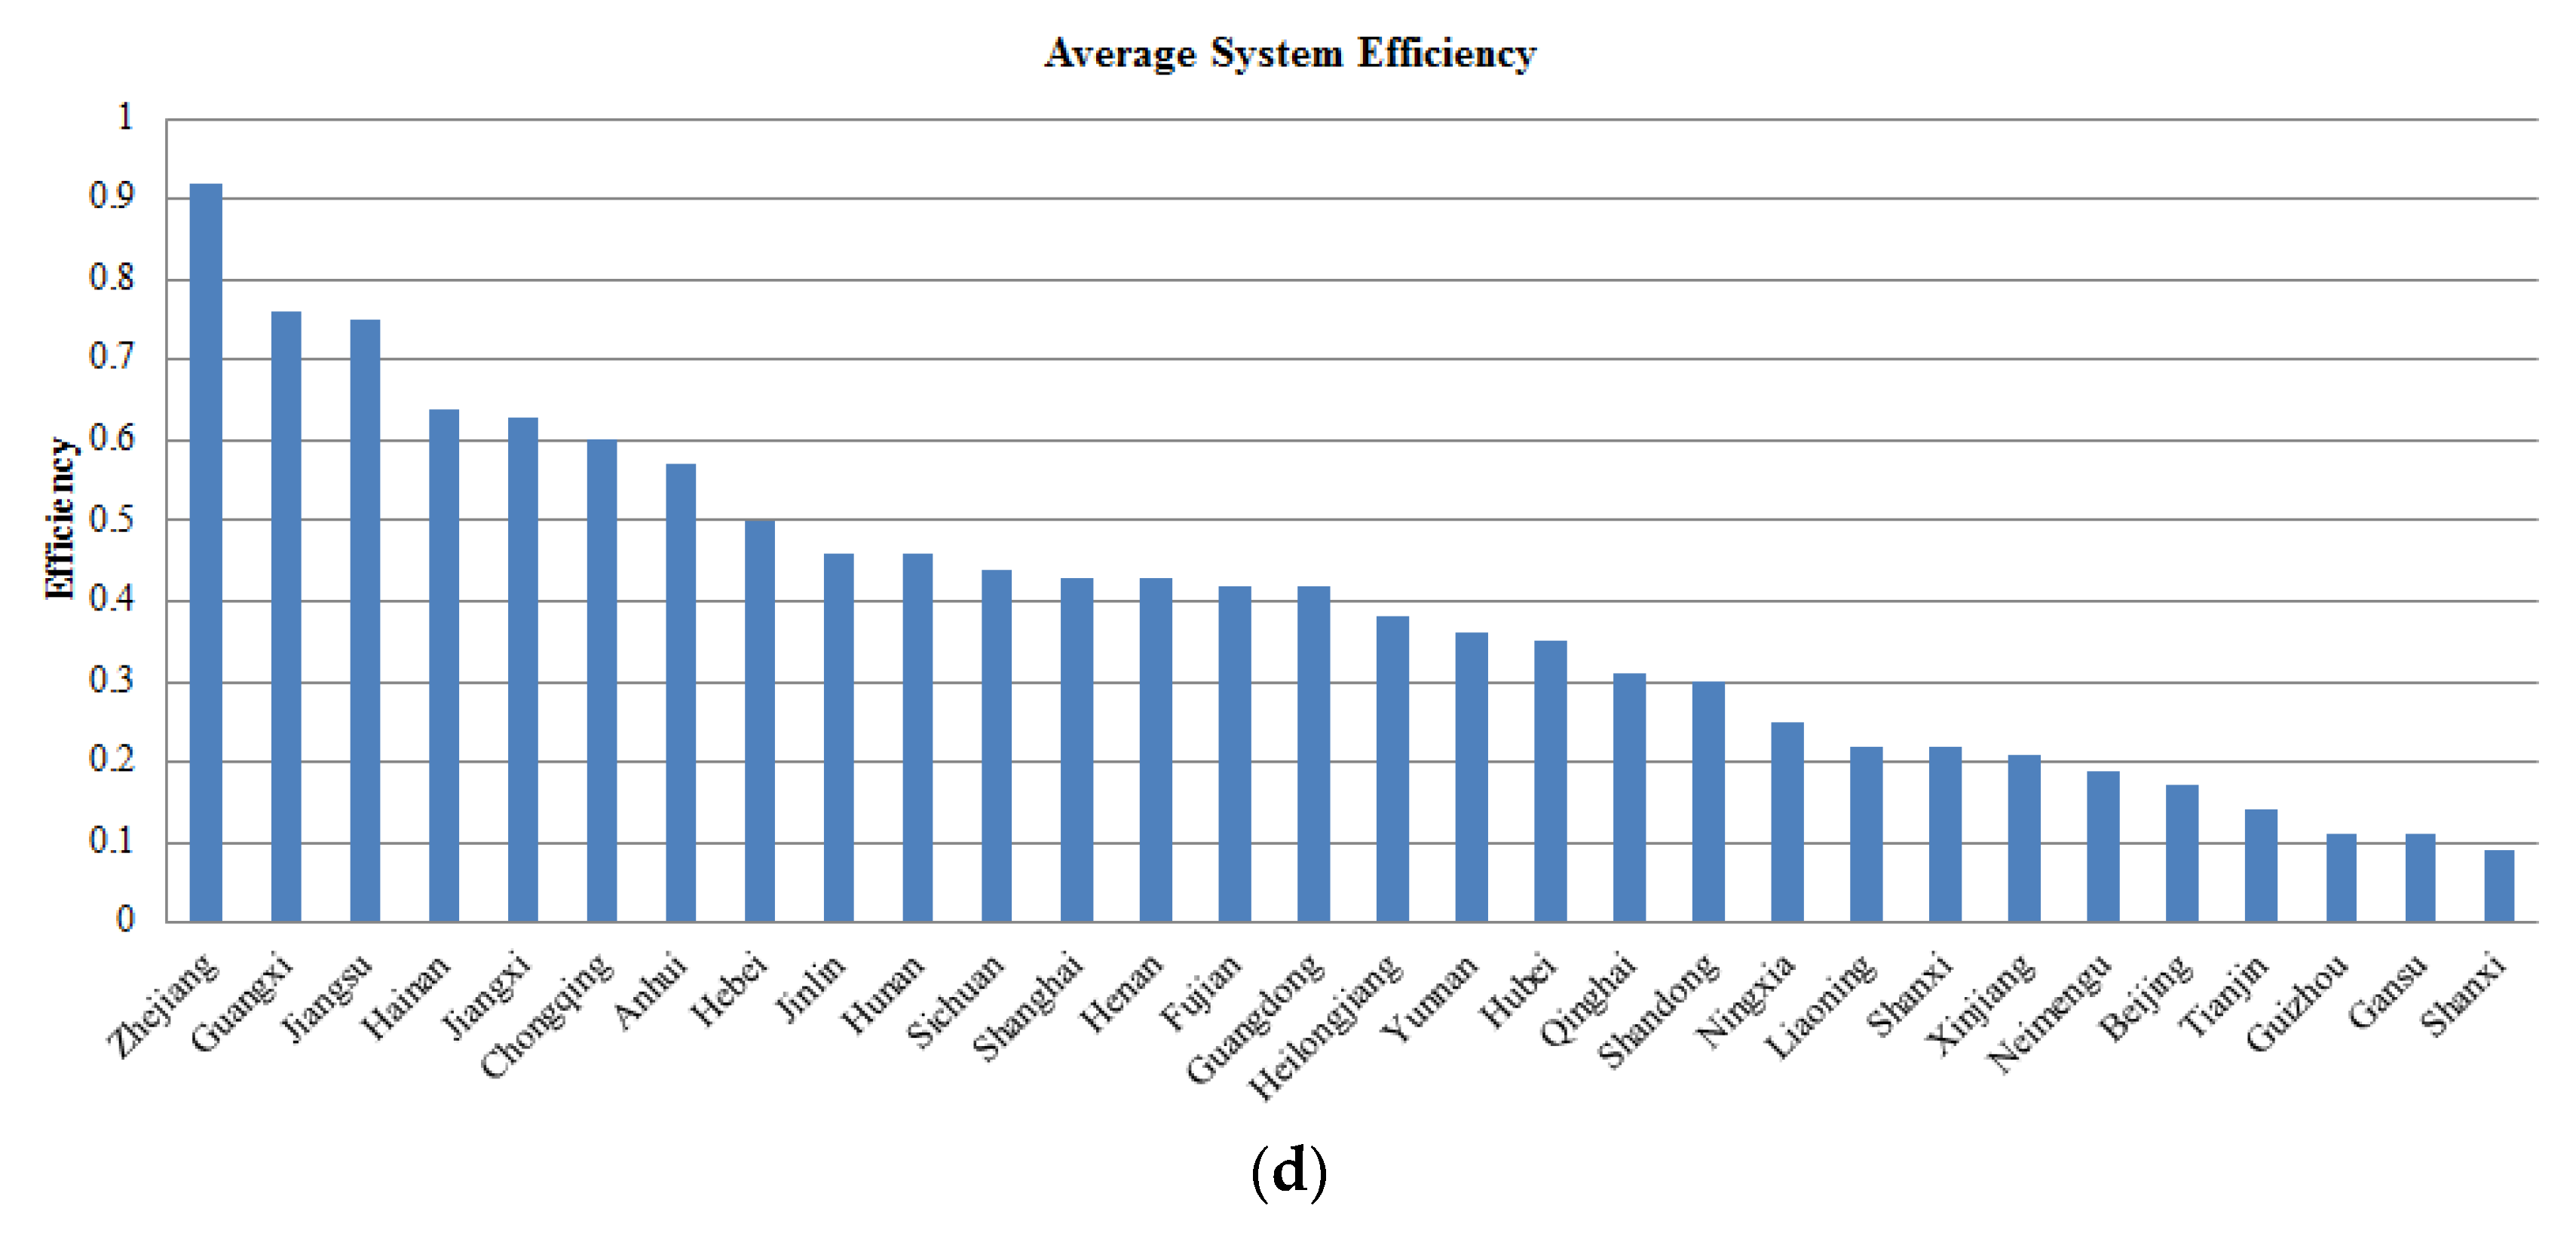
To clearly explain these phenomena, data are presented in Figure 4a–d.
The system efficiencies of 30 regions during the period 2005–2010 are presented in Figure 4a. Some regions maintain a high level of efficiency in the long term—namely, Jiangsu, Zhejiang, Guangxi and Hainan. However, some developed regions perform poorly—even far below the average efficiency—such as Beijing, Tianjin, Shanghai, Fujian, and Shandong. This result is different from our cognition of developed regions. For process 1, we found that developed regions maintain their efficiency value. Figure 4b–d describe the ranking of system and process efficiency, from which the relationship between system and process efficiency can be examined.
To comprehensively reflect the efficiency value rankings throughout the whole study period, we computed the average efficiency in five years as the basis of our rankings. Figure 4b shows the ranking of the average efficiency of the production process, where the following developed regions performed efficiently: Beijing, Tianjin, Shanghai, Jiangsu, Fujian, Shandong, Guangdong, and Guangxi, with the less developed regions at the bottom of the ranking. Figure 4c shows the ranking of average efficiency of the pollution treatment process; it is evident that the efficiency of seven regions is significantly higher than in other regions—namely, Zhejiang, Anhui, Chongqing, Hainan, Jiangxi, Guangxi, and Jiangsu. These seven regions are mostly less developed regions, while the developed regions such as Beijing, Shanghai, and Tianjin rank 26th, 17th, and 28th, respectively. Thus, this phenomenon can be drawn on to conclude that no inevitable relationship exists between the two processes; for instance, a certain process with high efficiency cannot determine the high or low efficiency of another process. The average efficiency of the whole system is shown in Figure 4d, where seven regions are observed to rank at the top in terms of average system efficiency: Zhejiang, Guangxi, Jiangsu, Hainan, Jiangxi, Chongqing, and Anhui. Notably, the regions ranked in the top seven in terms of average system efficiency are the same regions as in process 2, but not in process 1. The top seven regions in process 2 and system also have high rankings in process 1. Considering the effects of the two processes on the system efficiency, process 1 and process 2 have a positive influence on system efficiency.
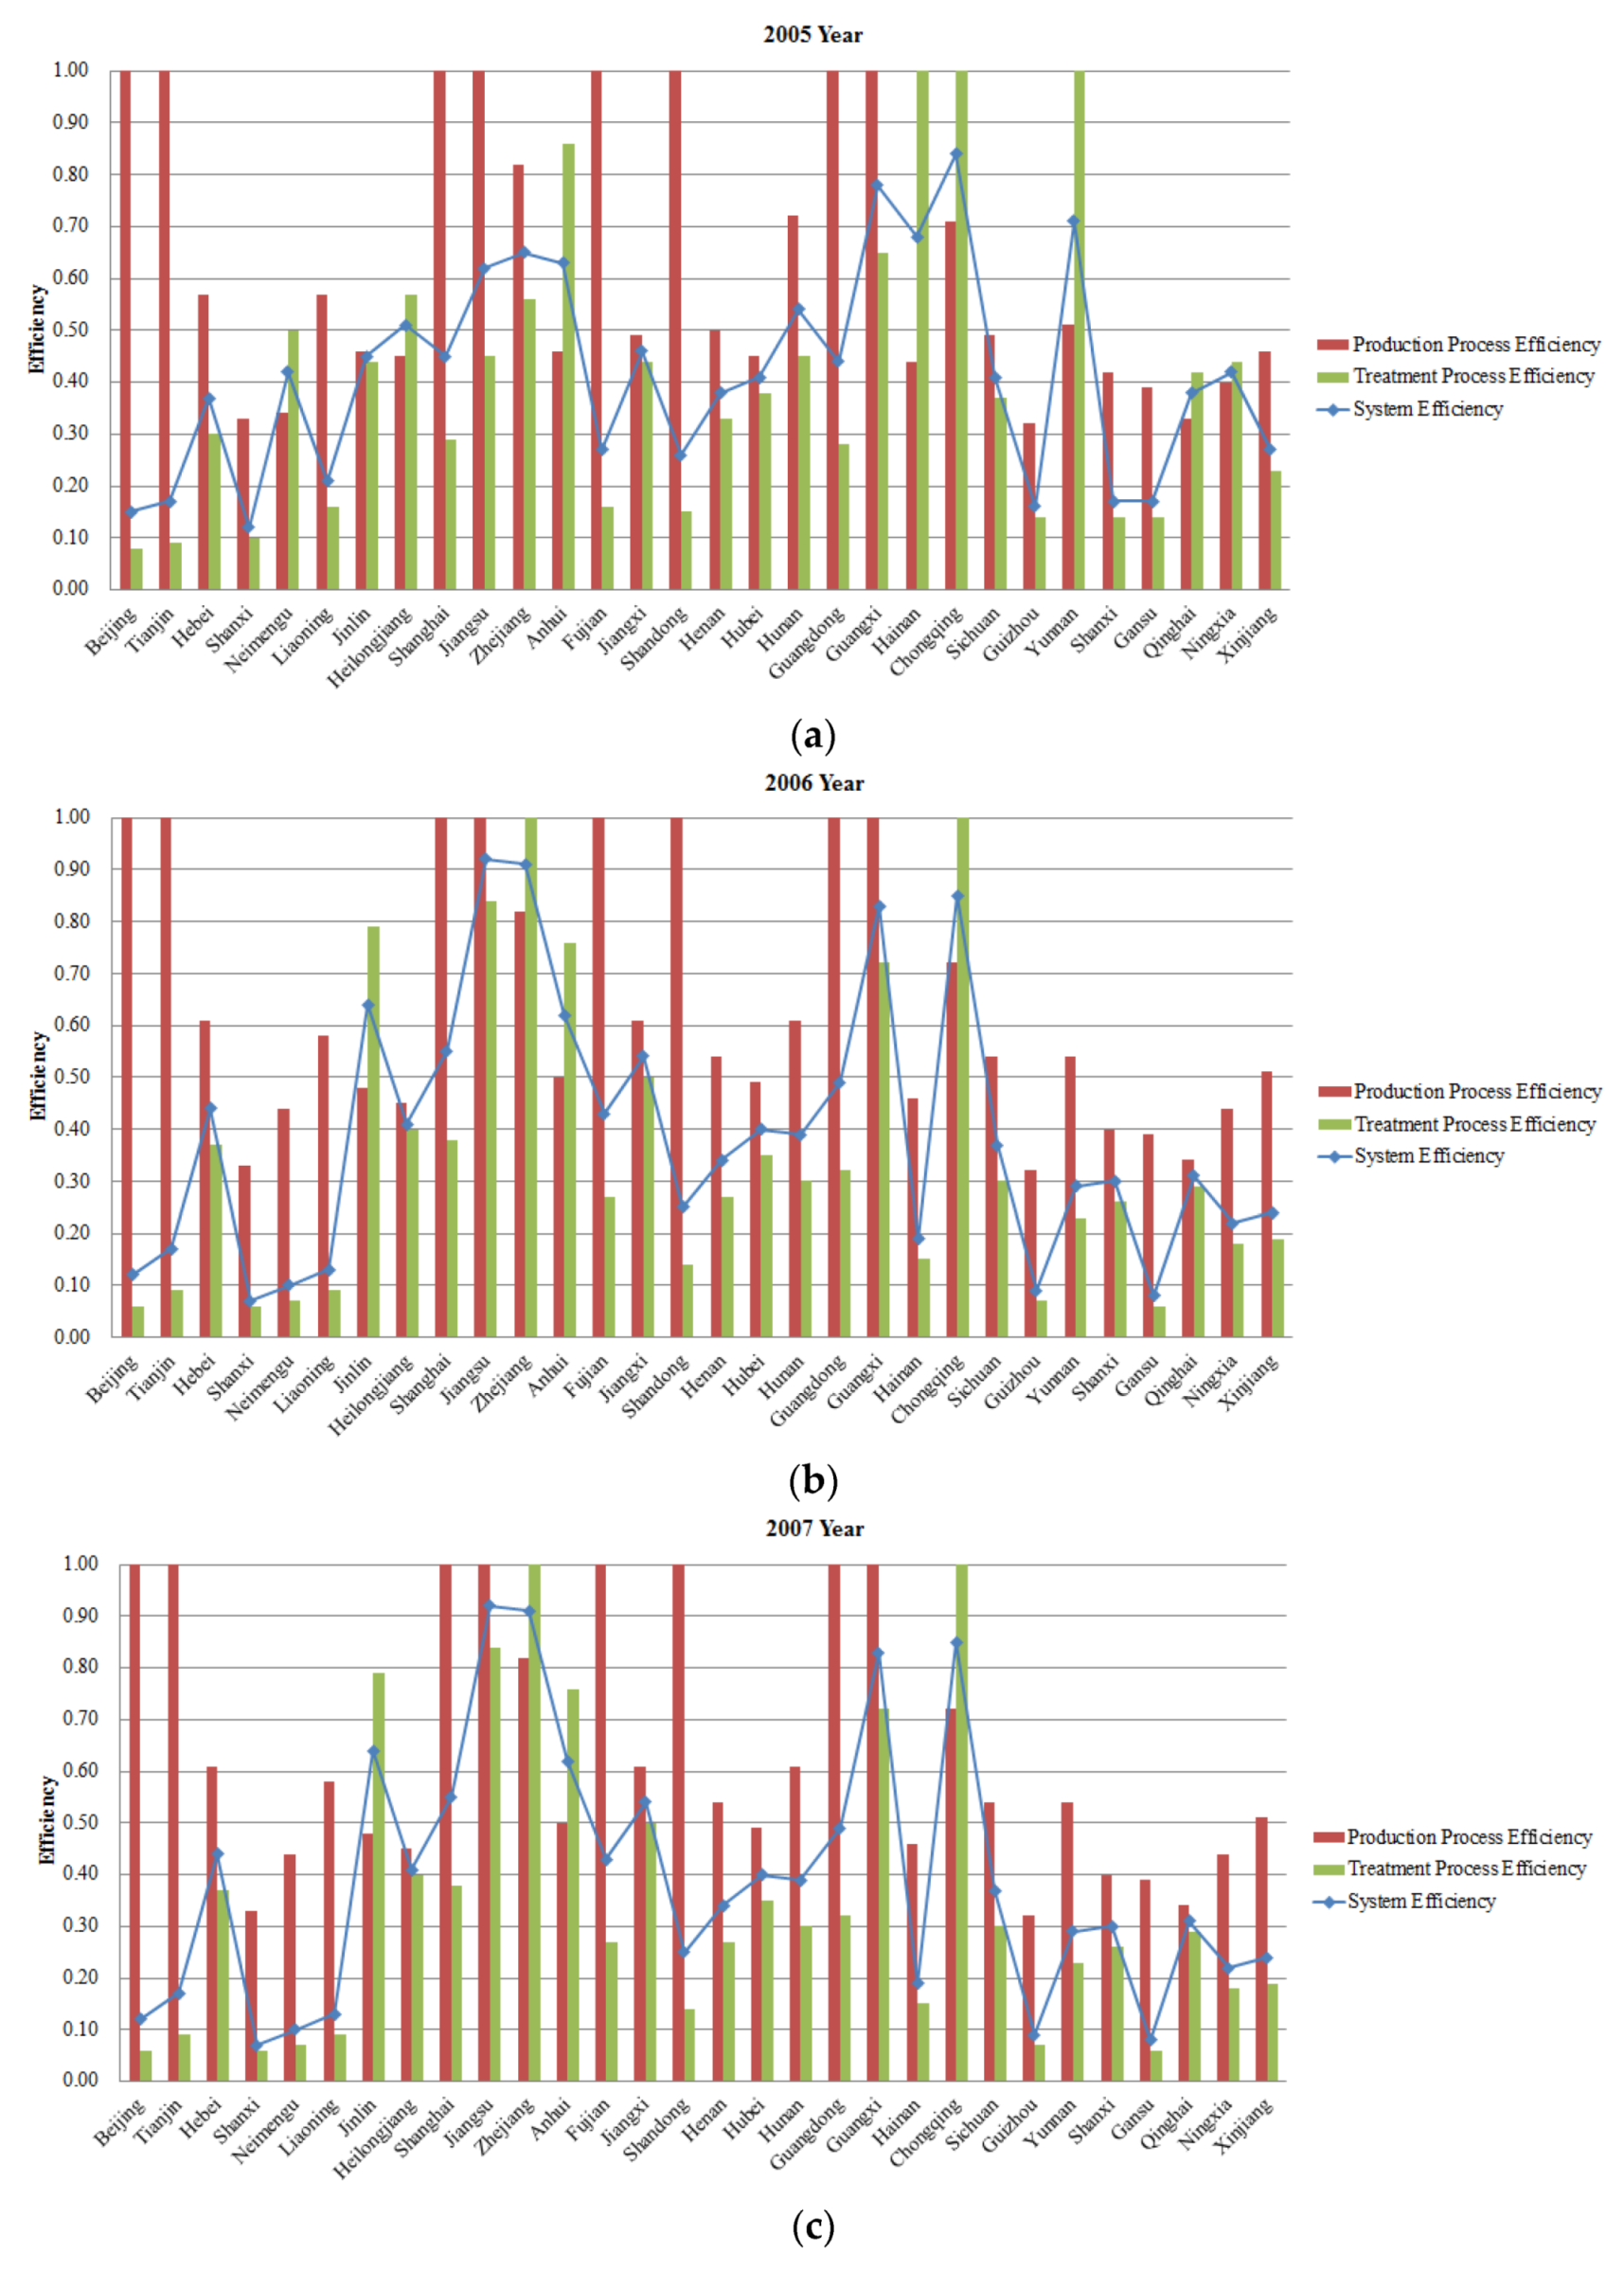
Figure 5a–f graphically illustrate the results of the efficiency of processes and system each year from 2005 to 2010, respectively. We can see that almost all regions had higher efficiency in process 1 than process 2 for each year. In addition, the system efficiency was always found between the efficiencies of process 1 and process 2; therefore, the regions with high efficiencies in both process 1 and process 2 can certainly obtain high system efficiency. Efficiency is measured between 0 and 1; thus, a region cannot perform with an efficiency of 0; therefore, it is attractive to study the 1 as the only extreme case. In Figure 5, an efficiency of 1 frequently appears in process 1, but not in process 2 or system efficiency. Observing the rare cases with a system efficiency of 1, one phenomenon is clear: a system efficiency of 1 always consists of efficiencies of 1 in both process 1 and process 2. From this observation, Theorem 1 is proposed:
Theorem 1.
If, and only if, the industrial production process and pollution treatment process performs efficiently, then the system is efficient. Otherwise, the system is inefficient.
Most developed regions are mature in their economic production, thus corresponding to the ranking of the industrial production process. However, the pollution treatment industry has recently received much attention. For sustainable development, environmental protection measures such as pollution treatment should be considered when assessing production efficiency. Therefore, evaluating the efficiency of such a network system by our approach is meaningful and suitable.

4.3. Analytical Results of MI

Based on the GM index and decomposition in Section 3.3, the results of the system MI and process MIs are shown in Table A3a–c of the Appendix A, respectively. Given that the GM index measures the changes in productivity between two periods, the productivity declined when GM was less than 1, remained unchanged when GM was equal to 1, and improved when GM was greater than 1. The Effch and Tech represent the efficiency change and technical change, respectively, from the decomposition of the GM index. Therefore, when the system and process GM indices are obtained, the decomposition is feasible and convenient to analyse the cause of the productivity change. Hence, the performance of Effch and Tech are also declined, unchanged, or improved when compared to 1.
Table A3a of the Appendix A shows that no apparent change in trends exists for a certain region. For instance, some developed regions such as Beijing and Shanghai improved their performance in some years and saw it decline in others. However, in terms of the entire 30 regions in a given year, nearly 20 regions showed improved productivity. From the GM index, Effch, and Tech of industrial production process presented in Table A3b of the Appendix A, we can find that the developed regions maintain the efficiency of 1, as the result in the Effch is fixed at 1, and the most Tech shows the most improved techniques. For the developed regions, the GM index of process 1 is stable at around 1, and less developed regions can exhibit some dramatic values. These phenomena show that the industrial development of developed regions tends to be stable, while the less-developed regions make faster progress from a low foundation. Table A3c of the Appendix A presents the GM index and corresponding decomposition of the pollution treatment process. Similar to the system GM, most regions show no stability, and only increasing or decreasing trends. The unstable trend of productivity shows the immature development and unclear relationship between the pollution treatment process and the whole system, even when the industrial production process shows clear trends. Figure 6 shows the influence between processes and system GM index.
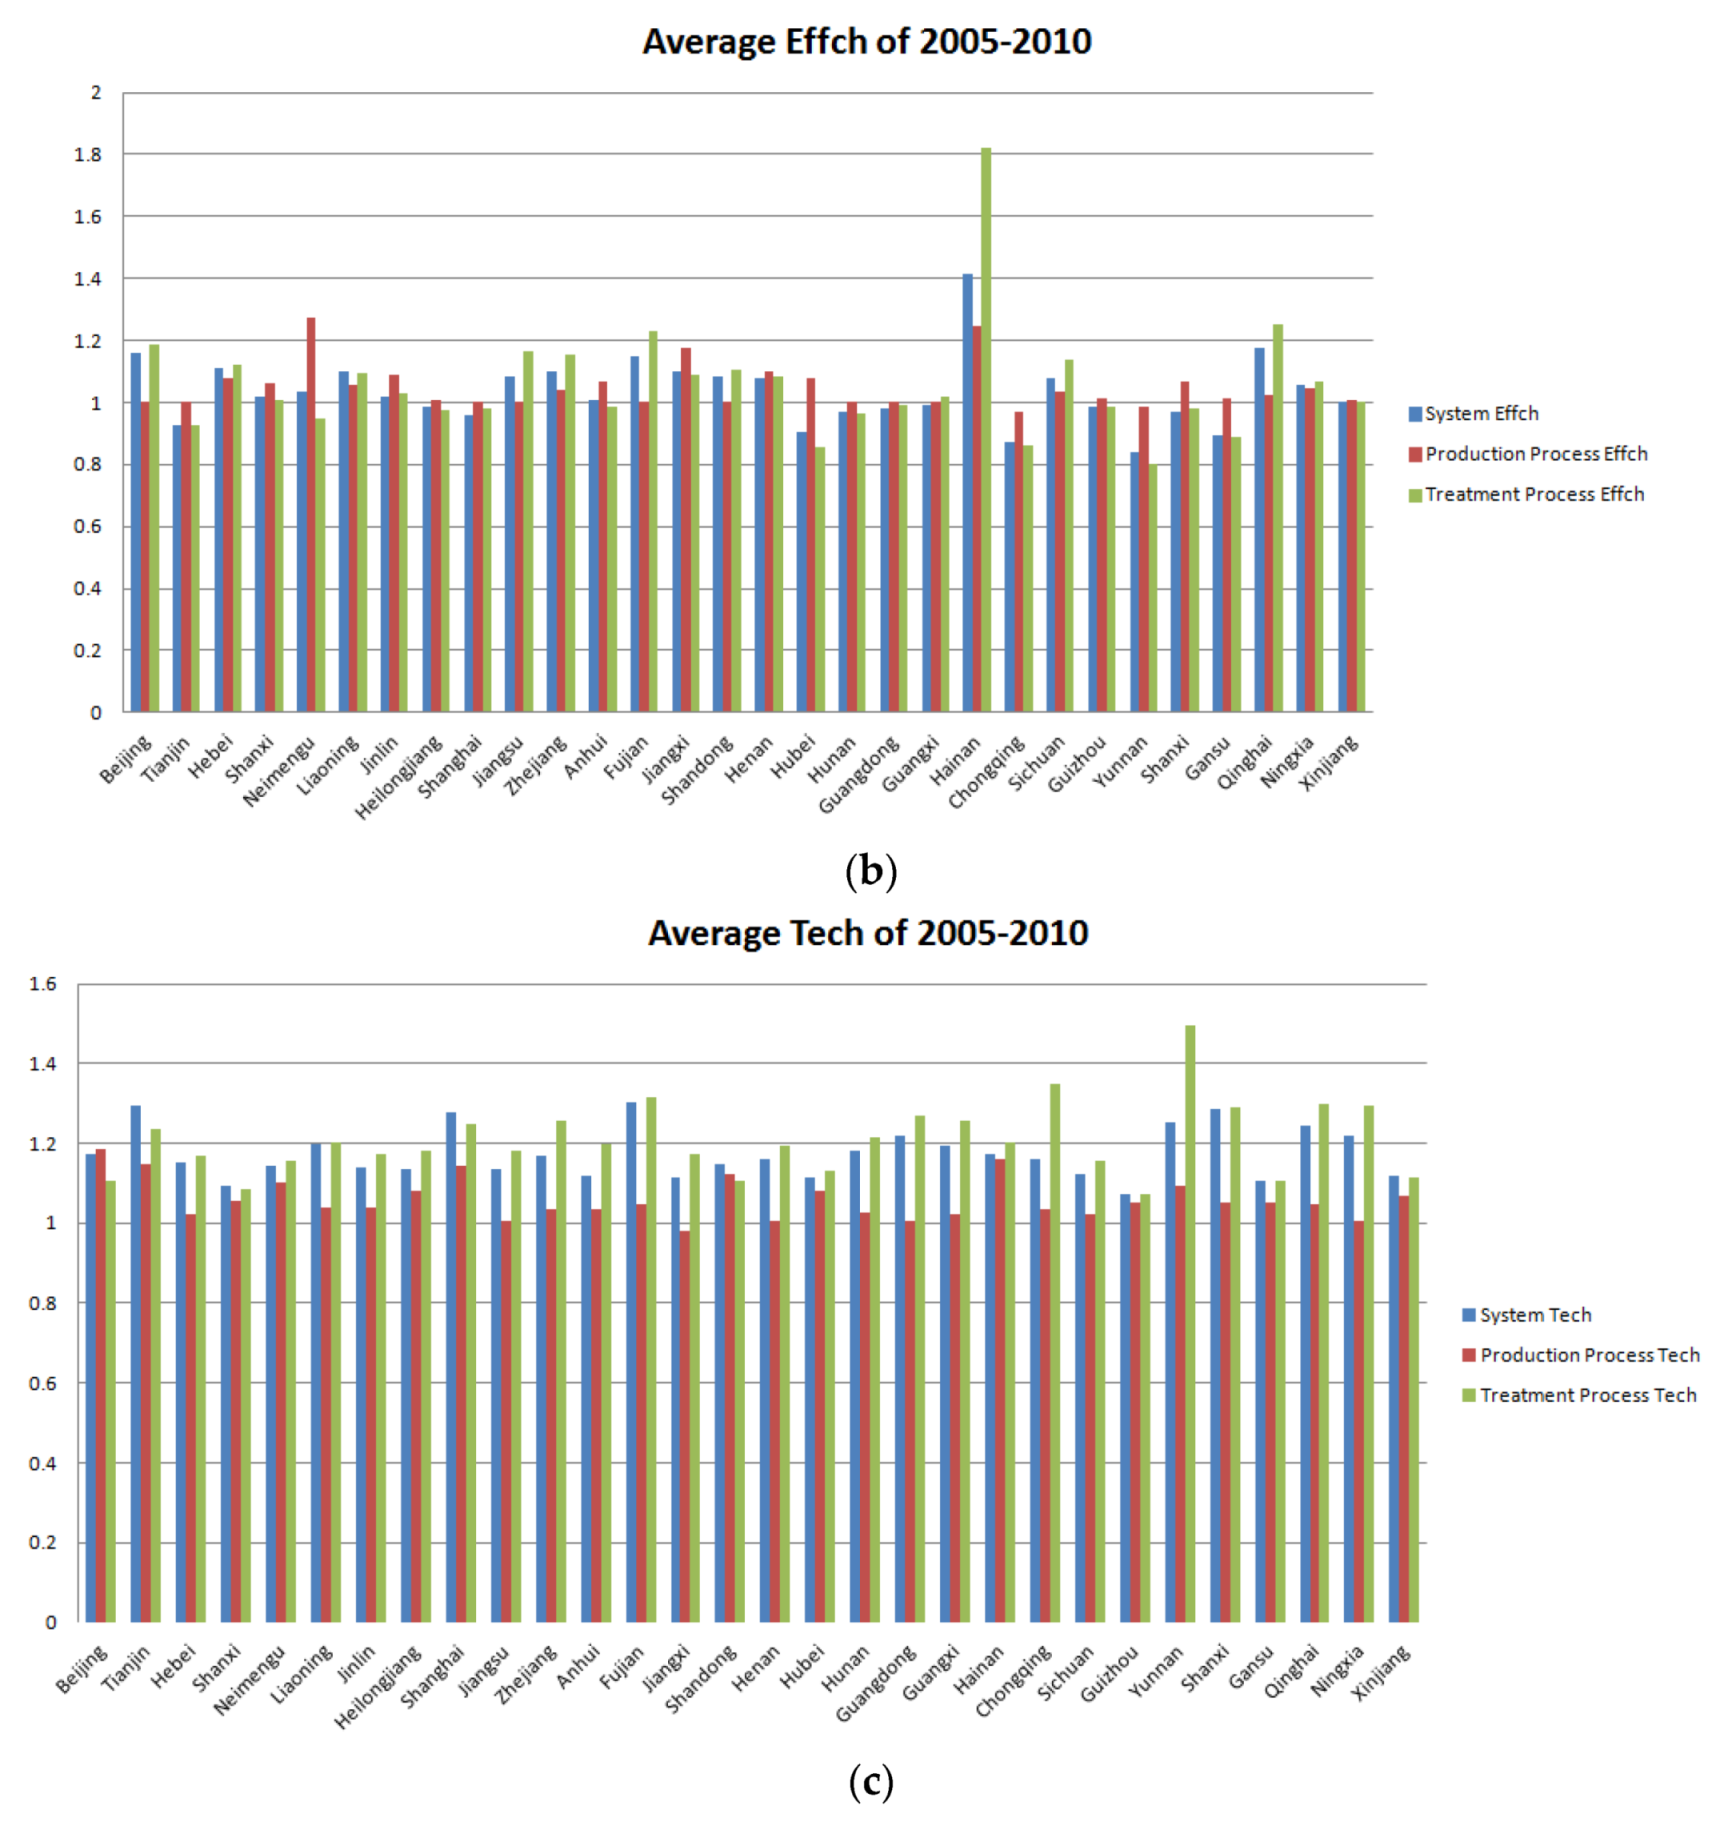
The average system GM (SGM) index, production process GM (PGM) index, and treatment process GM (TGM) index of 2005–2010 for 30 regions are shown in Figure 6a, where the average GM index of most regions is greater than 1, which means that most regions made progress in their production and treatment systems during 2005–2010. Furthermore, the SGM index is obtained mostly between PGM and TGM; therefore, the SGM is clearly determined jointly by two processes, although some regions do not present this characteristic as strictly, including Beijing and Shanghai, where the SGM is greater than the PGM and TGM. However, considering the data in Figure 6a showing the averages of 2005–2010, the comprehensive exhibition of data could cover some characteristics. Based on Figure 6a, for each year in Beijing, the SGM was always obtained between the PGM and TGM; however, the PGM and TGM do not present any stable trend of being greater than one another, thus causing the average SGM to be greater than the average of the PGM and TGM. We can observe that most regions show greater TGM than PGM, which means that the TGM is the main contributing factor for the progress of the SGM.
We further consider the decomposition of the GM index and study the relationship between the system and process parts from Figure 6b,c.
Observing Figure 6b,c, clearly, the system Effch and system Tech are also affected by the processes Effch and Tech, respectively, and can be obtained between the corresponding values of the two processes. Meanwhile, the Effch and Tech of process 1 are quite near to 1.0, which shows that the efficiency of each region in the industrial production process is certainly stable, while the technology maintains the low speed of progress. Then, we can find that the Tech of process 2 is greater than its counterpart in process 1, which shows that process 2 has made more technological progress and, thus, dominates the system Tech. However, comparing the Effch of process 1 and process 2, no similar characteristics can be found as the Tech in which the Effch of process 2 are not generally greater than or less than those of process 1. These phenomena can be explained as, considering the network system as consisting of an industrial production process and a pollution treatment process, economic production tends to be mature and stable; however, environmental protection has risen and attracted more attention as a result of the several five-year plans promoted by the Chinese government; therefore, the environmental protection industry is part of the emerging field. More technology progress in process 2 than process 1 each year is reasonable, but because mature management is absent, the Effch of process 2 is presented without a stable trend.
To study the performance of overall system efficiency and system GM index comprehensively, and consider the geographic characteristics at the same time, we illustrated the average system efficiency and average system GM index in the period 2005–2010 as the horizontal and vertical coordinates in Figure 7a. We coloured the regions in different distribution on the map for clear observation in Figure 7a.
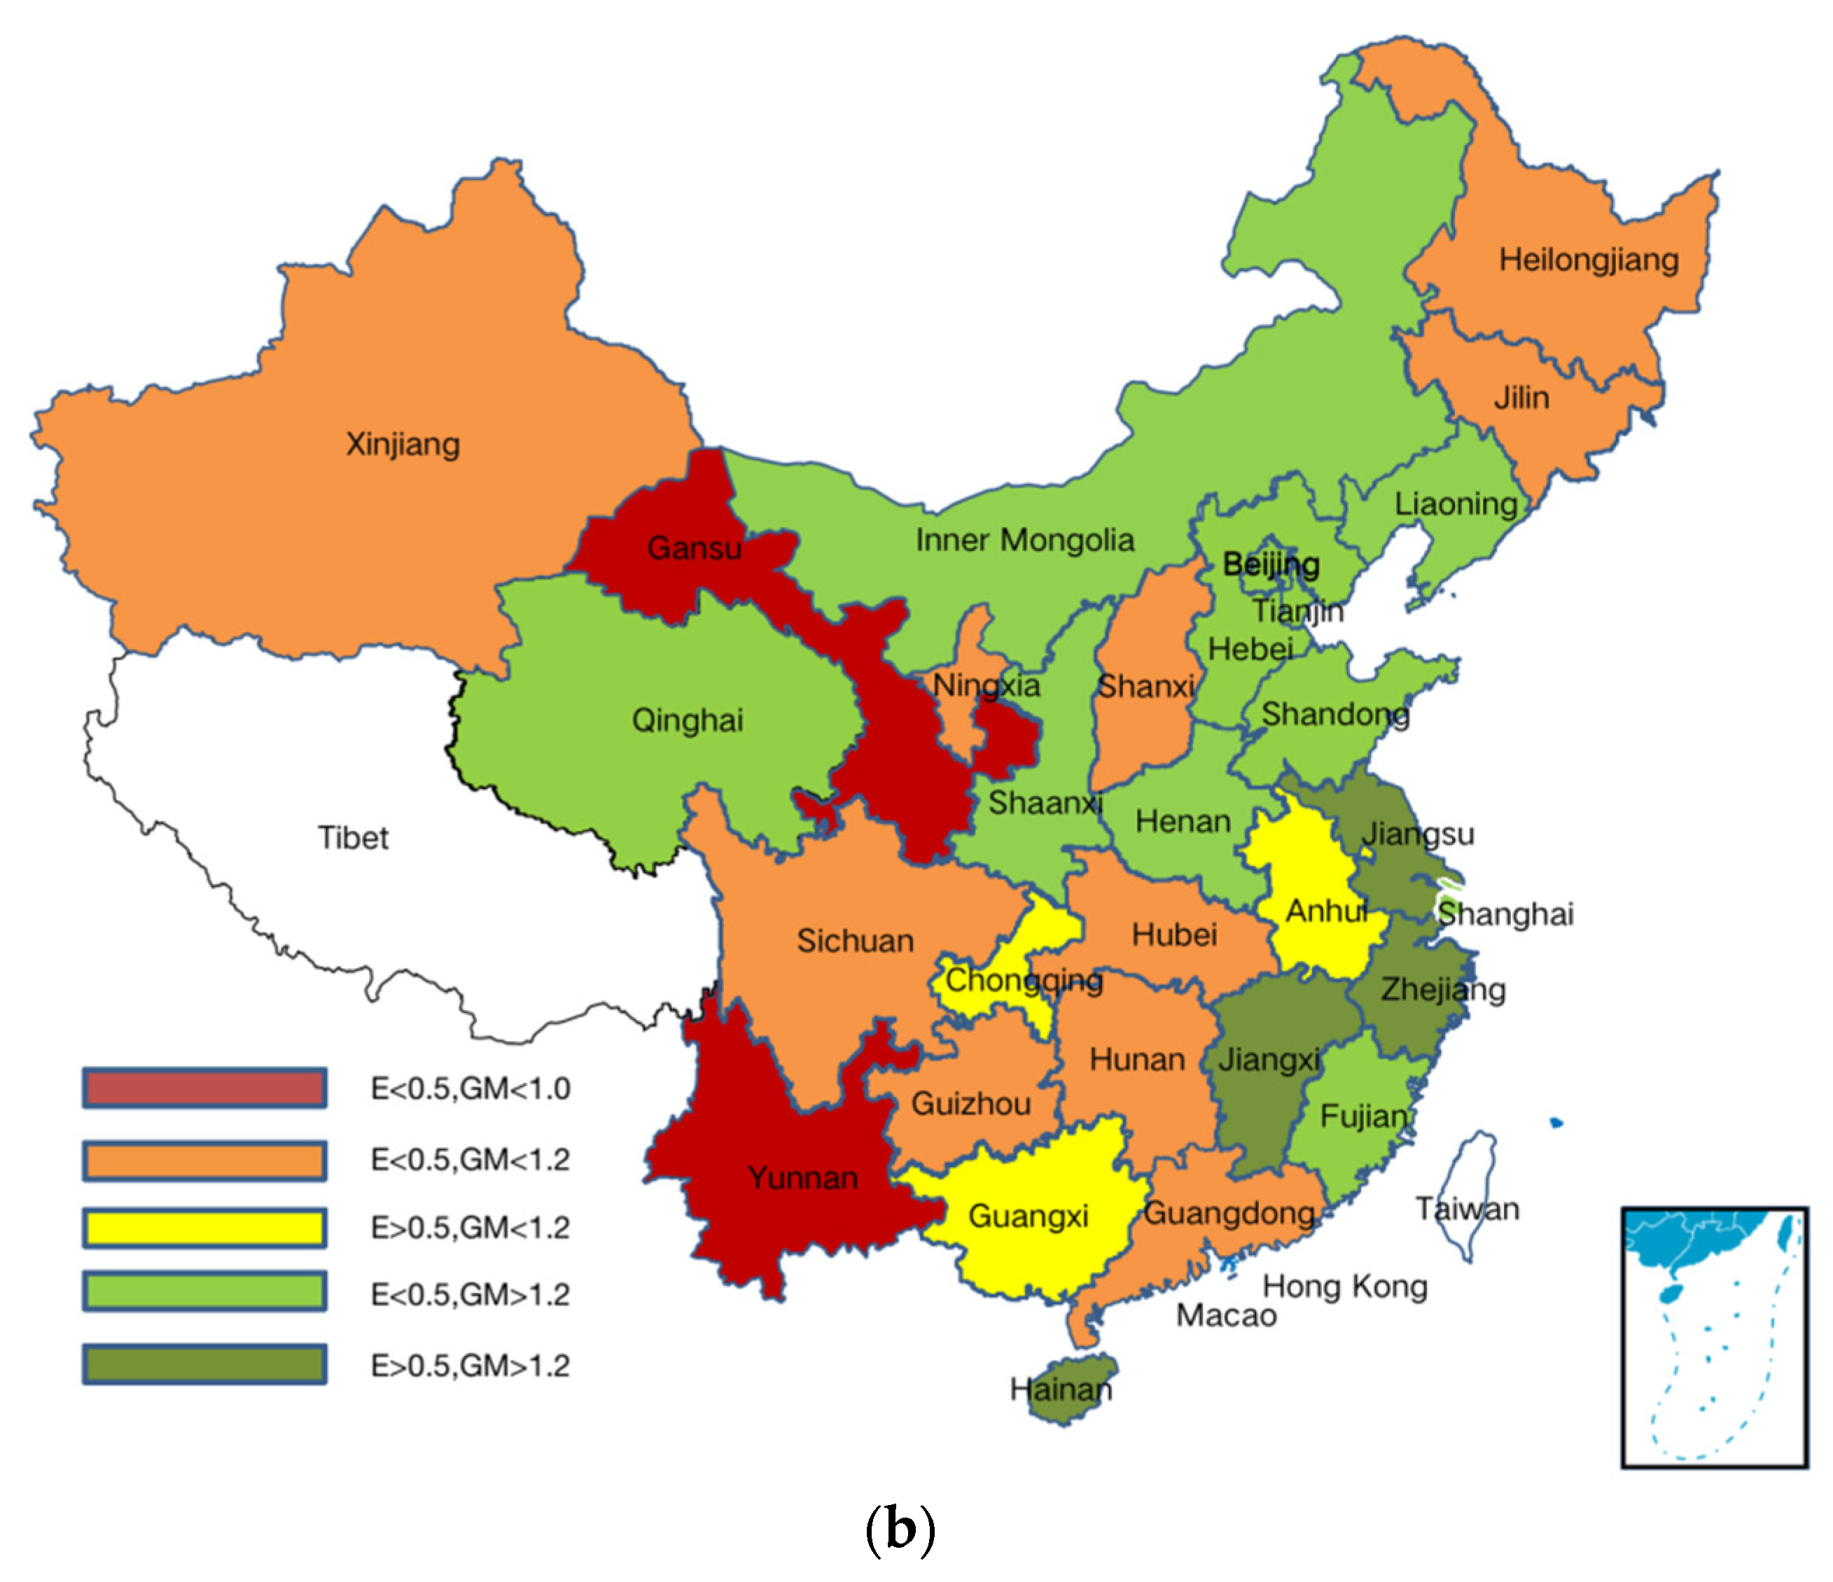
In Figure 7a, for the average system efficiency, most efficiency values are low, and nearly half of them have a value of 0.5; therefore, choosing 0.5 as the standard for efficiency is appropriate. In addition, most regions show a progressive GM index; thus, we classify them based on high or low speed of progress in comparison with one another, with a compromise value of 1.2. However, some regions show a GM index of less than 1, which means that essential differences exist between GM > 1 and GM < 1, so we add the GM < 1 as a single standard. Finally, the specific classification and results are shown in Figure 7b. The map is based on the standard map issued by the Ministry of Natural Resources in 2020. For any map details, please refer to the latest map of China issued by the Ministry of Natural Resources.
Zhejiang, Jiangsu, Jiangxi, and Hainan performed well in both system efficiency and system GM index; Fujian, Shandong, Beijing, Tianjin, and some other regions ranked in the second level, which shows good progress in productivity change while the system efficiency is low. As discussed in Section 4.2, system efficiency is affected by the industrial production process and the pollution treatment process; however, the efficiency of process 1 tends to be stable, especially for developed regions such as Beijing. Therefore, the low system efficiency is mainly caused by process 2. Other regions can also be analysed by finding the main influences on their system efficiency and system GM index. For instance, when a certain region is ranked at a low position because of a poor GM index, then we can observe the GM index of its processes and continue to compare the decomposition of the responding process to clearly define the cause from the exact process and Effch or Tech. From this map, the regions that performed well are mainly located on the east coast and in the northern area near the capital of China. The regions that performed badly are mainly from the mid-west, northwest, and northeast of China. Two regions showed a low system efficiency and a GM < 1.0, which means that their productivity declined during our study period.

5. Conclusions and Policy Implications

In the past several decades, the Chinese economy has experienced a rapid growth. With the fast progress in the economy, severe energy and environmental problems have occurred, such as energy shortage, global warming, and river pollution. Therefore, the evaluation of economic development, including environmental factors, provides insights. It is necessary to put forward a method to evaluate industrial systems. In line with the related literature, this paper studies the two-stage Chinese industrial system—that is, a system consisting of an industrial production process and a pollution treatment process.
We have made following the contributions to the scholarship: This paper proposes an improved network slack-based measure (SBM) and specifies it into the two-stage structure to be applied to the performance evaluation of China’s industrial production system. The link between the two stages is considered in our model. The pollution output of the production stage is regarded as the input of the treatment stage, so as to more accurately reflect the efficiency of each stage and the overall efficiency. Furthermore, a global Malmquist index is introduced for total factor productivity analysis based on our SBM model and two-stage structure. The complete decomposition for each stage is obtained to clearly show the accurate cause of the performance change. With the data of a fixed time period as the benchmark, the global Malmquist index makes it possible to compare the MI results of different time periods straightforwardly. Furthermore, based on our two-stage construction combined with pollution indicator, our model is able to provide thorough decomposition of efficiency and total factor productivity change, as well as precise conduction.
The main empirical results of this study have shown that, first, in most areas where the industrial system is inefficient, the production efficiency is higher than the treatment efficiency, which indicates that the main reason for the inefficiency of industrial systems in most areas lies in the inefficiency of the process of pollution control. At the same time, it also reveals that the local government attaches more importance to economic development than to environmental protection and pollution control, thus failing to achieve the coordinated development of environment and economy.
Second, for the production stage, most of the areas have higher production efficiency, and the areas with full efficiency and high efficiency are developed areas. However, the efficiency level of the less developed areas is far less than that of the developed areas. This shows that the developed areas are better in terms of production efficiency. Moreover, the production stage efficiency of most provinces in the east is also far higher than that of other regions, and shows a rising trend year by year. However, for the central, western, and northeast regions, the performance of average production efficiency is far from satisfactory. Although the average production efficiency performance of the central, western, and northeast regions has a certain gap with that of the eastern region, their development trends are similar to that of the eastern region, showing an upward trend year by year, indicating that China’s industrial development is still relatively rapid, and the momentum of economic development is relatively optimistic.
Third, the efficiency results of the treatment stage show that the efficiency of most areas is low in the treatment stage. Compared with the efficiency results in the production stage, the average efficiency of treatment is far lower than the average production efficiency. Most of the regional industrial inefficiencies are also reflected in the inefficiency of the pollution treatment stage. Furthermore, in the treatment stage, the provinces with good performance are no longer completely economically developed provinces, but also include many underdeveloped areas. This shows that the industrial system evaluation in the treatment stage has practical significance.
Fourth, using our network Malmquist index based on the improved network slack-based measure (SBM) model, the results show that the productivity level of China’s industrial areas is rising, and the industrial system productivity level is growing steadily. The technical levels of industrial systems in most regions have been improving. However, the decomposition of EC shows that the management level in the production stage is relatively ordinary, and the management level in the industrial production stage in the western region needs to be improved. The results also verify that the network Malmquist index can decompose and analyse the performance, efficiency change, and technical level of each sub-stage, and further provide guidance for the improvement.
Combined the conclusions, the targeted policy recommendations include the following: First, targeted plans should be made for corresponding regions to achieve balanced development of economy and environment. The main reason that the industrial systems in most areas are inefficient is the inefficiency in the process of pollution control. This also shows that the local governments pay much more attention to economic development than to environmental protection and pollution control, failing to achieve the coordinated development of environment and economy. For example, Heilongjiang, Jilin, and Liaoning—the three industry-intensive provinces in Northeast China—show a good economic development trend, but their environmental pollution levels are relatively serious, which leads to their overall ineffectiveness in terms of industrial efficiency. Therefore, in order to improve the efficiency of the overall industrial system in the local region, the local government should increase the investment in pollution control to protect the ecological environment while maintaining economic development.
Moreover, for some remote areas—such as Yunnan, Guizhou, and other places—their industrial development is relatively backward. The corresponding industrial system efficiency falls behind more developed areas. Therefore, it is not advisable for underdeveloped areas to devote much more resources to pollution treatment as in the industrial developed areas. In the long run, economic development is still the top priority of these less developed areas.
Second, the regional performance is distinct. The treatment for every stage should be different. The overall efficiency of each regional industrial system is: eastern > central > western > northeast. In terms of production stage, with its unique location, economic foundation, and policy support, the conversion of resource input into economic output in the process of industrial production is better in the eastern region than in other regions. In the treatment stage, the provinces with good performance contain both developed and underdeveloped areas.
This shows that in the stage of environmental treatment, economic factors are not dominant. The performance of this stage can break through the constraints of the economic development stage to a certain extent—that is, under the development mode of emphasizing “resource-friendly and environmental protection”, if the areas cannot achieve rapid development in the economic production stage in the short term, increasing the investment in the environmental treatment stage is an effective way to achieve better performance
Third, most of the areas’ industrial productivity is developing steadily. The level of management and technology ought to be optimized. Based on the results of productivity changes in the eastern, central, western, and northeast regions, this paper finds that, from the regional perspective, the level of industrial productivity in all regions of China is on the rise, indicating that China’s industry is growing steadily. Generally, the level of industrial technology in all regions is in a stable rising state, while the change in management efficiency shows no obvious increase, and its fluctuation is obvious. This shows that the conversion technologies of production resources, environmental treatment, and economic output in most areas are improving. However, the specific factor conversion and factor management level have not been improved steadily. This also shows that the cultivation and introduction of industrial production and pollution control technologies are taking effect, but the management and supervision of resources in the process of production and treatment still need to be strengthened.
Accordingly, we summarize the limitations and future research directions of our study as follows: First, this study is based on a two-stage network structure. The first stage is the production stage. The second stage is the treatment stage. The only link between the two stages is the intermediate pollutants. In fact, although such a structure is widely used in existing research, many special network structures should be considered. Therefore, in the future study, we should select the specific structure according to the specific problem. Second, this paper improves the SBM model based on extreme size. The distance that the improved SBM model proposed in this paper focuses on is the distance in which the invalid unit achieves Pareto efficiency. In fact, adding the factor of price can better reflect the goal of cost minimization in real production. Third, in the two-stage structure, only industrial wastewater discharge is considered as the intermediate output. However, there are many kinds of industrial pollutants. The proportion of pollutants produced by various industrial systems is different. Therefore, a more comprehensive pollutant index can be adopted in a follow-up study. Meanwhile, for the input in the treatment stage, future studies can consider adding special environmental protection manpower and equipment, which would be beneficial to more comprehensively examine efficiency and productivity.

Author Contributions

Conceptualization, F.L.; methodology, B.D. and Q.W.; validation, Q.W.; formal analysis, Q.W.; investigation, F.L.; data curation, F.L. and B.D.; writing—original draft preparation, F.L. and B.D.; writing—review and editing, Q.W. All authors have read and agreed to the published version of the manuscript.

Funding

This research was funded by the Youth Foundation of Social Science and Humanity of China’s Ministry of Education (Grant No. 19YJC630074), the National Natural Science Foundation of China (Grant No. 91846301; 71672194), the Philosophy and Social Science Foundation of Hunan Province (Grant No. 17YBQ100), the Scientific Research Foundation of Hunan Evaluation Committee of Social Science Results (Grant No. XSP21YBC477), and the Innovation-Driven Foundation of Hunan University of Technology and Business (Grant No. 2020QD02).

Institutional Review Board Statement

Not applicable.

Informed Consent Statement

Not applicable.

Data Availability Statement

Not applicable.

Acknowledgments

The authors would like to thank the editors for their hard work and the reviewers who dedicated their time for providing valuable and constructive comments.

Conflicts of Interest

The authors declare no conflict of interest.

Appendix A

Table A1. Descriptive statistics of the raw data.
VariablesUnitsMeanVarianceMaxMinSource
Industrial Production Process
Input(X1)Labour10,000 persons274.0696,310.701568.0012.00China Statistical Yearbook
CapitalCNY 100,000,0004896.3117,727,655.3321,781.92348.53China Statistical Yearbook
Energy consumption per industrial added valueTon/CNY 10,000 2.572.379.030.58China Industrial Economic Statistical Yearbook
Output(Y1)Industrial GDPCNY 100,000,00015,151.71321,448,650.8592,056.48473.06China Statistical Yearbook
Intermediate product(Z)Industrial wastewater emission10,000 tons80,163.444,842,511,262.4829,6318.005782.00China Industrial Economic Statistical Yearbook
Pollution Treatment Process
Input(X2)Pollution treatment investmentCNY 10,000156,016.6618,391,993,784.43844,159.003563.00China Environmental Statistical Yearbook
Output(Y2)Industrial wastewater emission on standard10,000 tons74,230.084,410,758,276.27288,936.003396.00China Environmental Statistical Yearbook
Comprehensive value from three-waste reutilisationCNY 10,000452,306.61271,598,713,023.712,863,867.205289.70China Environmental Statistical Yearbook
Table A2. System and process efficiencies during 2005–2010.
Item200520062007
SystemStage 1Stage 2SystemStage 1Stage 2SystemStage 1Stage 2
Beijing0.151.000.080.121.000.060.111.000.06
Tianjin0.171.000.090.171.000.090.161.000.09
Hebei0.370.570.300.440.610.370.460.650.39
Shanxi0.120.330.100.070.330.060.090.350.07
Neimenggu0.420.340.500.100.440.070.110.480.08
Liaoning0.210.570.160.130.580.090.150.600.11
Jilin0.450.460.440.640.480.790.600.570.61
Heilongjiang0.510.450.570.410.450.400.380.420.36
Shanghai0.451.000.290.551.000.380.601.000.43
Jiangsu0.621.000.450.921.000.840.841.000.72
Zhejiang0.650.820.560.910.821.000.950.901.00
Anhui0.630.460.860.620.500.760.700.510.92
Fujian0.271.000.160.431.000.270.441.000.28
Jiangxi0.460.490.440.540.610.500.620.680.59
Shandong0.261.000.150.251.000.140.301.000.18
Henan0.380.500.330.340.540.270.390.690.30
Hubei0.410.450.380.400.490.350.410.500.37
Hunan0.540.720.450.390.610.300.410.630.33
Guangdong0.441.000.280.491.000.320.511.000.35
Guangxi0.781.000.650.831.000.721.001.001.00
Hainan0.680.441.000.190.460.150.271.000.16
Chongqing0.840.711.000.850.721.000.710.570.90
Sichuan0.410.490.370.370.540.300.380.540.31
Guizhou0.160.320.140.090.320.070.090.340.07
Yunnan0.710.511.000.290.540.230.330.510.28
Shanxi0.170.420.140.300.400.260.380.440.35
Gansu0.170.390.140.080.390.060.090.440.07
Qinghai0.380.330.420.310.340.290.350.340.36
Ningxia0.420.400.440.220.440.180.250.430.21
Xinjiang0.270.460.230.240.510.190.270.480.22
Beijing0.151.000.080.271.000.160.241.000.14
Tianjin0.121.000.070.131.000.070.111.000.06
Hebei0.540.800.430.600.750.530.610.790.51
Shanxi0.070.420.050.080.360.060.110.430.08
Neimenggu0.110.540.080.171.000.090.221.000.12
Liaoning0.290.670.210.280.660.210.240.740.16
Jilin0.320.610.250.350.630.280.390.700.30
Heilongjiang0.340.490.290.240.450.200.390.450.36
Shanghai0.311.000.180.441.000.280.241.000.13
Jiangsu0.601.000.430.741.000.590.791.000.66
Zhejiang1.001.001.001.001.001.001.001.001.00
Anhui0.440.560.390.460.560.400.580.630.55
Fujian0.381.000.230.661.000.490.351.000.21
Jiangxi0.650.560.740.840.691.000.681.000.52
Shandong0.261.000.150.371.000.230.361.000.22
Henan0.390.750.290.540.670.470.530.770.43
Hubei0.410.600.350.260.560.200.230.650.16
Hunan0.470.730.370.520.710.420.430.720.33
Guangdong0.311.000.190.481.000.320.281.000.17
Guangxi0.591.000.410.691.000.530.641.000.47
Hainan1.001.001.001.001.001.000.671.000.50
Chongqing0.360.620.280.520.650.450.310.600.24
Sichuan0.360.650.280.610.610.610.500.570.46
Guizhou0.100.340.080.110.350.090.130.340.10
Yunnan0.310.520.260.280.500.230.220.480.18
Shanxi0.200.540.150.170.590.120.080.580.06
Gansu0.110.420.080.110.410.080.080.410.06
Qinghai0.330.370.310.130.390.100.340.380.32
Ningxia0.110.450.080.250.470.200.220.490.17
Xinjiang0.160.500.120.110.460.080.190.480.15
Table A3. (a) System Malmquist index value from 2005 to 2010; (b) Malmquist index value of production processes from 2005 to 2010; (c) Malmquist index value of treatment processes from 2005 to 2010.
(a)
Item2005–20062006–20072007–20082008–20092009–2010
SystemSystemSystemSystemSystem
MalmEffchTechMalmEffchTechMalmEffchTechMalmEffchTechMalmEffchTech
Beijing1.050.791.320.930.960.971.361.380.991.901.811.051.350.871.54
Tianjin1.841.001.840.810.940.860.930.791.181.131.061.061.310.851.54
Hebei1.501.201.251.181.051.121.171.161.011.171.131.041.351.011.34
Shanxi0.590.581.021.371.221.130.730.810.901.181.091.081.881.401.34
Neimenggu0.220.230.931.531.101.401.011.060.951.271.510.842.051.281.59
Liaoning0.800.641.251.401.151.222.021.871.081.010.981.031.220.861.42
Jilin1.491.431.041.140.931.220.570.541.041.161.091.071.461.111.32
Heilongjiang0.950.811.170.940.911.031.000.891.120.720.730.992.171.591.37
Shanghai1.501.221.221.401.081.290.660.521.281.361.440.940.870.531.65
Jiangsu1.561.481.061.080.911.180.750.721.041.331.241.081.391.071.31
Zhejiang1.291.390.931.191.041.141.411.061.340.851.000.851.581.001.58
Anhui1.030.981.051.221.121.090.690.641.091.061.031.041.691.271.33
Fujian1.981.581.251.141.021.111.480.861.721.641.750.940.790.531.50
Jiangxi1.381.191.171.231.161.071.181.041.141.331.291.030.950.811.17
Shandong1.120.951.181.271.221.040.810.840.971.661.461.141.360.961.41
Henan1.050.891.171.171.131.041.191.001.191.441.391.041.350.991.37
Hubei1.120.971.151.071.041.030.991.000.990.630.631.011.220.881.39
Hunan0.940.721.301.181.061.121.251.131.111.151.111.031.110.831.34
Guangdong1.241.111.121.171.051.110.880.611.441.371.530.890.910.591.54
Guangxi1.201.061.131.781.201.480.560.590.951.021.180.871.420.921.54
Hainan0.210.280.741.591.401.144.953.721.331.011.001.011.100.671.65
Chongqing1.611.001.610.610.840.720.550.501.091.411.440.980.840.591.41
Sichuan1.000.901.120.991.040.961.060.931.141.831.701.071.080.821.32
Guizhou0.660.551.190.950.970.971.041.140.911.181.091.091.431.181.21
Yunnan0.810.411.981.141.121.020.950.951.001.020.911.120.910.801.14
Shanxi2.761.701.621.491.291.150.640.541.190.800.830.960.740.491.52
Gansu0.560.481.151.241.131.101.121.170.961.130.991.140.820.691.18
Qinghai1.050.801.311.551.151.351.090.931.180.350.390.893.922.611.50
Ningxia0.630.531.181.161.131.020.620.431.452.132.300.931.350.891.51
Xinjiang0.890.910.981.201.101.100.660.601.100.720.711.012.381.691.40
(b)
Item2005–20062006–20072007–20082008–20092009–2010
Stage 1Stage 1Stage 1Stage 1Stage 1
MalmEffchTechMalmEffchTechMalmEffchTechMalmEffchTechMalmEffchTech
Beijing1.141.001.141.201.001.201.081.001.081.091.001.091.411.001.41
Tianjin1.131.001.131.081.001.081.131.001.130.951.000.951.451.001.45
Hebei1.051.080.971.081.061.021.111.240.900.930.931.001.301.071.22
Shanxi1.090.991.111.141.091.051.151.190.970.890.851.041.331.191.11
Neimenggu1.591.301.231.161.101.061.191.131.051.151.850.621.541.001.54
Liaoning1.051.021.031.111.051.061.021.120.911.030.981.051.301.121.15
Jilin0.931.050.891.291.191.091.101.061.041.071.031.041.261.111.13
Heilongjiang1.270.991.290.970.931.041.081.190.910.940.911.041.141.011.13
Shanghai1.071.001.071.191.001.191.121.001.120.941.000.941.401.001.40
Jiangsu0.971.000.971.021.001.020.831.000.831.091.001.091.121.001.12
Zhejiang1.031.001.031.121.091.030.941.120.840.931.000.931.341.001.34
Anhui1.101.091.011.061.031.031.121.091.031.061.011.051.171.121.05
Fujian0.991.000.991.071.001.071.081.001.080.881.000.881.211.001.21
Jiangxi1.111.250.891.241.121.110.760.830.921.251.231.011.421.450.98
Shandong1.051.001.051.111.001.111.081.001.081.101.001.101.271.001.27
Henan1.081.081.001.191.290.921.031.080.950.970.891.091.241.161.07
Hubei1.131.101.031.321.011.301.071.200.900.960.941.021.341.151.16
Hunan0.890.851.051.081.021.051.041.160.891.020.971.051.101.011.09
Guangdong0.901.000.901.121.001.121.001.001.000.891.000.891.121.001.12
Guangxi0.801.000.801.251.001.251.001.001.000.791.000.791.261.001.26
Hainan1.291.051.221.352.180.621.061.001.061.001.001.001.911.001.91
Chongqing0.981.010.970.910.801.151.061.090.971.051.051.000.990.911.09
Sichuan1.141.091.051.041.011.031.021.200.850.930.941.001.090.931.17
Guizhou1.041.011.031.131.061.061.061.001.060.991.010.981.100.981.12
Yunnan1.301.061.231.050.951.101.041.021.020.940.950.991.080.961.13
Shanxi1.070.931.141.161.121.041.091.220.901.121.101.021.120.971.15
Gansu1.041.011.041.201.141.061.010.951.060.940.970.971.121.001.12
Qinghai1.111.011.091.101.021.091.131.071.050.951.060.891.070.971.11
Ningxia0.961.100.881.110.991.121.081.041.040.951.050.901.131.041.09
Xinjiang1.161.111.051.030.931.101.121.041.080.890.930.961.191.041.14
(c)
Item2005–20062006–20072007–20082008–20092009–2010
Stage 2Stage 2Stage 2Stage 2Stage 2
MalmEffchTechMalmEffchTechMalmEffchTechMalmEffchTechMalmEffchTech
Beijing1.000.781.290.870.950.911.341.410.951.941.941.001.170.861.37
Tianjin1.811.001.810.770.940.820.880.771.141.161.071.081.110.841.32
Hebei1.581.241.271.181.051.121.161.101.061.281.241.031.320.971.36
Shanxi0.560.561.011.351.211.120.690.760.911.231.151.071.801.371.32
Neimenggu0.150.151.041.501.071.400.951.020.941.231.181.041.801.321.37
Liaoning0.780.601.291.381.141.202.151.951.101.000.991.011.120.791.42
Jilin1.691.790.941.060.781.360.480.411.171.161.091.061.441.081.34
Heilongjiang0.900.701.290.930.911.030.970.811.210.690.700.992.441.761.38
Shanghai1.531.311.171.381.121.230.590.431.371.461.560.940.720.471.53
Jiangsu1.801.880.961.100.851.290.750.601.251.421.381.031.531.111.38
Zhejiang1.371.780.771.181.001.181.761.001.760.801.000.801.771.001.77
Anhui1.000.881.131.331.221.090.570.421.371.061.041.011.911.361.40
Fujian2.081.741.201.111.031.081.500.831.801.972.120.930.670.431.56
Jiangxi1.401.151.231.221.181.031.471.251.181.401.351.030.720.521.39
Shandong1.110.941.181.251.260.990.770.820.941.701.561.091.260.951.32
Henan1.020.821.251.121.091.021.210.961.261.611.660.971.330.901.47
Hubei1.100.911.211.051.061.000.960.941.030.590.571.031.110.811.38
Hunan0.980.671.451.171.081.081.291.131.141.181.151.031.090.791.38
Guangdong1.351.141.191.131.071.050.860.541.601.531.700.900.840.521.61
Guangxi1.441.111.301.991.401.430.430.411.041.161.280.911.430.891.61
Hainan0.130.150.881.501.021.467.576.441.181.001.001.000.750.501.50
Chongqing2.371.002.370.440.900.480.450.321.441.491.570.950.800.531.51
Sichuan0.980.801.220.971.060.921.060.881.202.192.201.001.080.751.44
Guizhou0.630.521.210.920.960.961.021.150.891.201.091.101.441.201.20
Yunnan0.750.233.221.151.180.980.930.931.001.050.911.150.860.771.12
Shanxi2.921.881.551.501.351.110.580.441.340.760.780.970.690.461.49
Gansu0.530.451.181.201.091.101.121.200.931.161.011.160.780.681.15
Qinghai1.040.701.481.621.241.311.070.861.250.310.330.944.723.131.51
Ningxia0.600.411.461.141.170.980.580.381.552.322.520.921.350.861.57
Xinjiang0.840.850.981.221.151.060.610.541.120.730.701.042.441.771.38
Figure A1. Graphical illustration of the current paper.
Mathematics 09 02594 g0a1

References

  1. China National Bureau of Statistics. Available online: http://www.stats.gov.cn/ (accessed on 14 May 2021).
  2. Bian, Y. Eco-efficiency evaluation of non-cooperative game two-stage production system. J. Manag. Sci. China 2012, 7, 11–19. [Google Scholar]
  3. Tu, Z.; Shen, R. Does environment technology efficiency measured by traditional method underestimate environment governance efficiency? From the evidence of China’s industrial provincial panel data using environmental directional distance function based on the network DEA. Econ. Rev. 2013, 5, 89–99. [Google Scholar]
  4. Wu, J.; Yin, P.; Sun, J.; Chu, J.; Liang, L. Evaluating the environmental efficiency of a two-stage system with undesired outputs by a DEA approach: An interest preference perspective. Eur. J. Oper. Res. 2016, 254, 1047–1062. [Google Scholar] [CrossRef]
  5. Charnes, A.; Cooper, W.W.; Rhodes, E. Measuring the efficiency of decision making units. Eur. J. Oper. Res. 1978, 2, 429–444. [Google Scholar] [CrossRef]
  6. Su, Q.; Chen, K.; Liao, L. The Impact of Land Use Change on Disaster Risk from the Perspective of Efficiency. Sustainability 2021, 13, 3151. [Google Scholar] [CrossRef]
  7. Seo, Y.; Umeda, S. Evaluating Farm Management Performance by the Choice of Pest-Control Sprayers in Rice Farming in Japan. Sustainability 2021, 13, 2618. [Google Scholar] [CrossRef]
  8. Tone, K.; Tsutsui, M. Network DEA: A slacks-based measure approach. Eur. J. Oper. Res. 2009, 197, 243–252. [Google Scholar] [CrossRef] [Green Version]
  9. Färe, R.; Grosskopf, S. Productivity and intermediate products: A frontier approach. Econ. Lett. 1996, 50, 65–70. [Google Scholar] [CrossRef]
  10. Lewis, H.F.; Sexton, T.R. Network DEA: Efficiency analysis of organizations with complex internal structure. Comput. Oper. Res. 2004, 31, 1365–1410. [Google Scholar] [CrossRef]
  11. Hwang, S.N.; Kao, T.L. Measuring managerial efficiency in non-life insurance companies: An application of two-stage data envelopment analysis. Int. J. Manag. 2006, 23, 699–720. [Google Scholar]
  12. Kao, C.; Hwang, S.-N. Efficiency decomposition in two-stage data envelopment analysis: An application to non-life insurance companies in Taiwan. Eur. J. Oper. Res. 2008, 185, 418–429. [Google Scholar] [CrossRef]
  13. Seiford, L.M.; Zhu, J. Profitability and Marketability of the Top 55 U.S. Commercial Banks. Manag. Sci. 1999, 45, 1270–1288. [Google Scholar] [CrossRef] [Green Version]
  14. Sexton, T.R.; Lewis, H.F. Two-Stage DEA: An Application to Major League Baseball. J. Prod. Anal. 2003, 19, 227–249. [Google Scholar] [CrossRef]
  15. Lo, S.-F.; Lu, W.-M. An integrated performance evaluation of financial holding companies in Taiwan. Eur. J. Oper. Res. 2009, 198, 341–350. [Google Scholar] [CrossRef]
  16. Huang, C.-W.; Chiu, Y.-H.; Fang, W.-T.; Shen, N. Assessing the performance of Taiwan’s environmental protection system with a non-radial network DEA approach. Energy Policy 2014, 74, 547–556. [Google Scholar] [CrossRef]
  17. Chen, Y.; Cook, W.D.; Kao, C.; Zhu, J. Network DEA pitfalls: Divisional efficiency and frontier projection. In Data Envelopment Analysis; Springer: Boston, MA, USA, 2014. [Google Scholar]
  18. Fukuyama, H.; Mirdehghan, S. Identifying the efficiency status in network DEA. Eur. J. Oper. Res. 2012, 220, 85–92. [Google Scholar] [CrossRef]
  19. Kao, C. Efficiency decomposition in network data envelopment analysis. In Data Envelopment Analysis; Springer: New York, NY, USA, 2014. [Google Scholar]
  20. Prieto, A.M.; Zofío, J.L. Network DEA efficiency in input–output models: With an application to OECD countries. Eur. J. Oper. Res. 2007, 178, 292–304. [Google Scholar] [CrossRef]
  21. Banker, R.D.; Charnes, A.; Cooper, W.W. Some models for estimating technical and scale inefficiencies in data envelopment analysis. Manag. Sci. 1984, 30, 1078–1092. [Google Scholar] [CrossRef] [Green Version]
  22. Färe, R.; Lovell, C.K. Measuring the technical efficiency of production. J. Econ. Theory 1978, 19, 150–162. [Google Scholar] [CrossRef]
  23. Pastor, J.T.; Ruiz, J.L.; Sirvent, I. An enhanced DEA Russell graph efficiency measure. Eur. J. Oper. Res. 1999, 115, 596–607. [Google Scholar] [CrossRef]
  24. Tone, K. A slacks-based measure of super-efficiency in data envelopment analysis. Eur. J. Oper. Res. 2002, 143, 32–41. [Google Scholar] [CrossRef] [Green Version]
  25. Hernández-Sancho, F.; Molinos-Senante, M.; Sala-Garrido, R. Energy efficiency in Spanish wastewater treatment plants: A non-radial DEA approach. Sci. Total Environ. 2011, 409, 2693–2699. [Google Scholar] [CrossRef] [PubMed]
  26. Kao, C. Efficiency decomposition for parallel production systems. J. Oper. Res. Soc. 2012, 63, 64–71. [Google Scholar] [CrossRef]
  27. Färe, R.; Grosskopf, S.; Roos, P. Productivity and quality changes in Swedish pharmacies. Int. J. Prod. Econ. 1995, 39, 137–144. [Google Scholar] [CrossRef]
  28. Christina, B.; George, H. Dynamics of productivity taking into consideration the impact of energy consumption and environmental degradation. Energy Policy 2018, 120, 276–283. [Google Scholar]
  29. Rath, B.N.; Akram, V.; Bai, D.P.; Mahalik, M.K. Do fossil fuel and renewable energy consumption affect total factor productivity growth? Evidence from cross-country data with policy insights. Energy Policy 2019, 127, 186–199. [Google Scholar] [CrossRef]
  30. Löthgren, M.; Tambour, M. Productivity and customer satisfaction in Swedish pharmacies: A DEA network model. Eur. J. Oper. Res. 1999, 115, 449–458. [Google Scholar] [CrossRef]
  31. Jahantighi, M.A.; Moghaddas, Z.; Ghasemi, M.V. Two-stage malmquist productivity index with intermediate products. Int. J. Ind. Math. 2012, 4, 31–40. [Google Scholar]
  32. Pouryusef, M.; Tohidi, G.; Razavian, S. Malmquist productivity index for decision making units with two-stage structure. Proc. World Acad. Sci. Eng. Technol. 2011, 80, 317–319. [Google Scholar]
  33. Kao, C.; Hwang, S.-N. Multi-period efficiency and Malmquist productivity index in two-stage production systems. Eur. J. Oper. Res. 2014, 232, 512–521. [Google Scholar] [CrossRef]
  34. Degl’Innocenti, M.; Kourtzidis, S.A.; Sevic, Z.; Tzeremes, N.G. Bank productivity growth and convergence in the European Union during the financial crisis. J. Bank. Finance 2016, 75, 184–199. [Google Scholar] [CrossRef] [Green Version]
  35. Lotfi, F.H.; Jahanshahloo, G.R.; Vaez-Ghasemi, M.; Moghaddas, Z. Evaluation progress and regress of balanced scorecards by multi-stage Malmquist Productivity Index. J. Ind. Prod. Eng. 2013, 30, 345–354. [Google Scholar] [CrossRef]
  36. Fukuyama, H.; Weber, W.L. Measuring bank performance with a dynamic network Luenberger indicator. Ann. Oper. Res. 2015, 250, 85–104. [Google Scholar] [CrossRef]
  37. Kao, C. Measurement and decomposition of the Malmquist productivity index for parallel production systems. Omega 2017, 67, 54–59. [Google Scholar] [CrossRef]
  38. Wu, J.; Li, M.; Zhu, Q.; Zhou, Z.; Liang, L. Energy and environmental efficiency measurement of China’s industrial sectors: A DEA model with non-homogeneous inputs and outputs. Energy Econ. 2019, 78, 468–480. [Google Scholar] [CrossRef]
  39. An, Q.; Tao, X.; Dai, B.; Li, J. Modified Distance Friction Minimization Model with Undesirable Output: An Application to the Environmental Efficiency of China’s Regional Industry. Comput. Econ. 2019, 55, 1047–1071. [Google Scholar] [CrossRef]
  40. Chen, F.; Zhao, T.; Wang, J. The evaluation of energy–environmental efficiency of China’s industrial sector: Based on Super-SBM model. Clean Technol. Environ. Policy 2019, 21, 1397–1414. [Google Scholar] [CrossRef]
  41. Zhou, Z.; Liu, W. DEA models with undesirable inputs, intermediates, and outputs. In Data Envelopment Analysis: A Handbook of Models and Methods; Zhu, J., Ed.; Springer: New York, NY, USA, 2015; pp. 415–446. [Google Scholar]
  42. Charnes, A.; Cooper, W.W. Programming with linear fractional functionals. Nav. Res. Logist. Q. 1962, 9, 181–186. [Google Scholar] [CrossRef]
  43. Pastor, J.T.; Lovell, C.K. A global Malmquist productivity index. Econ. Lett. 2005, 88, 266–271. [Google Scholar] [CrossRef]
  44. Liu, H.; Yang, R.; Wu, D.; Zhou, Z. Green productivity growth and competition analysis of road transportation at the provincial level employing Global Malmquist-Luenberger Index approach. J. Clean. Prod. 2021, 279, 123677. [Google Scholar] [CrossRef]
  45. Lv, C.; Shao, C.; Lee, C.C. Green technology innovation and financial development: Do environmental regulation and innovation output matter? Energy Econ. 2021, 98, 105237. [Google Scholar] [CrossRef]
  46. Bian, Y.; Yan, S.; Xu, H. Efficiency evaluation for regional urban water use and wastewater decontamination systems in China: A DEA approach. Resour. Conserv. Recycl. 2014, 83, 15–23. [Google Scholar] [CrossRef]
  47. Wu, H.-Q.; Shi, Y.; Xia, Q.; Zhu, W.-D. Effectiveness of the policy of circular economy in China: A DEA-based analysis for the period of 11th five-year-plan. Resour. Conserv. Recycl. 2014, 83, 163–175. [Google Scholar] [CrossRef]
  48. Capusneanu, S.; Topor, D.I.; Hint, M.S.; Ionescu, C.A.; Coman, M.D.; Paschia, L.; Nicolau, N.L.G.; Ivan, O.R. Mathematical model for identifying and quantifying the overall environmental cost. J. Bus. Econ. Manag. 2020, 21, 1307–1328. [Google Scholar] [CrossRef]
  49. Yang, Z. A two-stage DEA model to evaluate the overall performance of Canadian life and health insurance companies. Math. Comput. Model. 2006, 43, 910–919. [Google Scholar] [CrossRef]
  50. Malik, M.; Efendi, S.; Zarlis, M. Data Envelopment Analysis (DEA) Model in Operation Management. In Proceedings of the 4th International Conference on Operational Research (InteriOR), Medan, Indonesia, 21–23 August 2017. [Google Scholar]
  51. Stefko, R.; Gavurova, B.; Kocisova, K. Healthcare efficiency assessment using DEA analysis in the Slovak Republic. Health Econ. Rev. 2018, 8, 6. [Google Scholar] [CrossRef] [PubMed]
Figure 1. The structure of the industrial system, with two-stage processes.
Mathematics 09 02594 g001
Figure 2. The structure of a general network system.
Mathematics 09 02594 g002
Figure 3. Graphical illustration of the global Malmquist index (MI).
Mathematics 09 02594 g003
Figure 4. (a) System efficiency from 2005 to 2010. (b) Average production process efficiency from 2005 to 2010. (c) Average treatment process efficiency from 2005 to 2010. (d) Average system efficiency from 2005 to 2010.
Mathematics 09 02594 g004aMathematics 09 02594 g004b
Figure 5. (a) System and process efficiencies in 2005. (b) System and process efficiencies in 2006. (c) System and process efficiencies in 2007. (d) System and process efficiencies in 2008. (e) System and process efficiencies in 2009. (f) System and process efficiencies in 2010.
Mathematics 09 02594 g005aMathematics 09 02594 g005b
Figure 6. (a) Average MI index from 2005 to 2010. (b) Average Effch index from 2005 to 2010. (c) Average Tech index from 2005 to 2010.
Mathematics 09 02594 g006aMathematics 09 02594 g006b
Figure 7. (a) Average system efficiency and system GM index from 2005 to 2010. (b) Average system efficiency and system GM index from 2005 to 2010.
Mathematics 09 02594 g007aMathematics 09 02594 g007b
Publisher’s Note: MDPI stays neutral with regard to jurisdictional claims in published maps and institutional affiliations.