Article

Sustainable Development Model of EU Cities Compliant with UN Settings

1
Faculty of Computing, University of Latvia, LV-1586 Riga, Latvia
2
Faculty of Business, Management and Economics, University of Latvia, LV-1050 Riga, Latvia
*
Author to whom correspondence should be addressed.
Mathematics 2021, 9(22), 2888; https://doi.org/10.3390/math9222888
Submission received: 21 September 2021 / Revised: 30 October 2021 / Accepted: 9 November 2021 / Published: 13 November 2021
(This article belongs to the Special Issue Sustainability Issues and Mathematical Models of Digital Technologies)

Abstract

:
Nowadays, the globally accepted UN concept of sustainable development (SD) is gradually transferred to the city level, including small and medium-sized cities. The implementation of SD settings requires regular measurement of developmental progress to monitor the level achieved in statics and dynamics, and to make strategic decisions for the next period. The existing urban SD indicator systems and indices are not well-suited for the monitoring of specific cities. Benchmarking algorithms and mathematical modelling procedures were applied to create a methodology and mathematical model for measuring the achieved urban SD level and to ensure the most objective selection and proportions of key performance indicators (KPIs) to be included in the model. The model (1) complies with the UN concept, (2) is usable for any EU city, (3) reflects the level of quality of life achieved, and (4) includes a limited number of KPIs related to municipal functionality. Mathematical computation of the (1) causality between the KPIs, (2) selection and proportions of KPIs, and (3) the general level of urban SD, as well as the reasonable combination of universality, accuracy, stability, and simplicity are strong advantages of the model. Using the published mathematical expressions of the model, calculation of the SD level does not require specific skills; the performed stability test also confirms that annual calibration of the model is not necessary. The index will help municipalities in planning and managing SD, and in the rational use of their usually limited resources. As a pilot project, SD level values are calculated for several cities.

1. Introduction

The concept of sustainable development (SD) was institutionalized by the UN as the core of global development in the 21st century [1]. It was noted from the very beginning that limiting it to “environmental issues only would have been a grave mistake. The environment does not exist as a sphere separate from human actions, ambitions, and needs” [2]. The concept is based on three independent and mutually reinforcing pillars—economic, social, and environmental. As an elaboration of the global development program “Agenda 2030” [3], the concept has been expanded by setting 17 Sustainable Development Goals (SDGs) and 169 targets for the period up to 2030.
Knowledge, which is certainly the main resource of SD, has a necessity and tendency to concentrate; it supports existing knowledge to create and attract new knowledge: “knowledge, professional skills, creativity and technological inventions have never been evenly distributed in space” [4]. A knowledge-based SD process has become a catalyst for worldwide urbanization; more and more knowledge and economic and social resources and activities are concentrated in cities, including small and medium-sized cities (see, e.g., [5]). “The 19th century was a century of empires. The 20th century was a century of nation states. The 21st century will be a century of cities” [6]. The concept of SD, both the benefits and the problems, is actually transferred at the city level: “In the 21st century cities are at the centre of all key demographic, environmental and socio-economic trends” [7].
The implementation of SD settings requires regular measurement of developmental progress to monitor the achieved level in statics and dynamics, as well as to make strategic decisions for the next period. In order to reflect the situation in various aspects, the UN SDG recommendations offer 242 narrow-profile indicators; numerical values of 100 SD indicators are available in the most comprehensive Eurostat database.
However, direct measurement of many individual indicators cannot show the overall progress of the multi-dimensional SD program due to complicated crosslinks, and the integrity and interplay of dimensions. To assess the progress of SD, a composite index is needed that covers all dimensions: “Indicators corresponding to the future SDGs are most important for monitoring future progress, but they will need to be complemented by composite indices of sustainable development progress” [8].
Experts are working on the perfection of a methodological basis for measuring urban SD (e.g., [9,10]); a number of indicator systems and integrated indices have been created to assess urban SD (see, e.g., [11,12,13,14]). However, the published methodologies for indices calculation are too general, incomplete, unspecified, and non-transparent (as opposed to, e.g., the available HDI methodology [15]); it is cumbersome to analyze and systematize the proposed models, and there is not enough information to repeat the calculations.
The set goals are generally quite similar, relatively close to an increase in the quality of life in the long run (e.g., [16]), although they are defined differently, such as a sustainable city (e.g., [17,18,19,20,21,22,23,24,25,26,27]), competitive city (e.g., [28,29,30,31,32,33]), liveable city (e.g., [34,35]), green city/eco-city (e.g., [36,37,38]), or smart city (e.g., [38,39,40,41,42,43,44]), while emphasizing the priority of knowledge (e.g., [45,46,47]) or ICT (e.g., [48,49]) in some proposals. Narrow-profile tools are also available for use in a specific branch (e.g., [50,51,52,53,54,55]) or country/city (e.g., [56,57,58,59]).
Unfortunately, the proposed indices and the methodologies of their creation are not very suitable for municipalities for data-driven planning and implementing SD in specific cities.
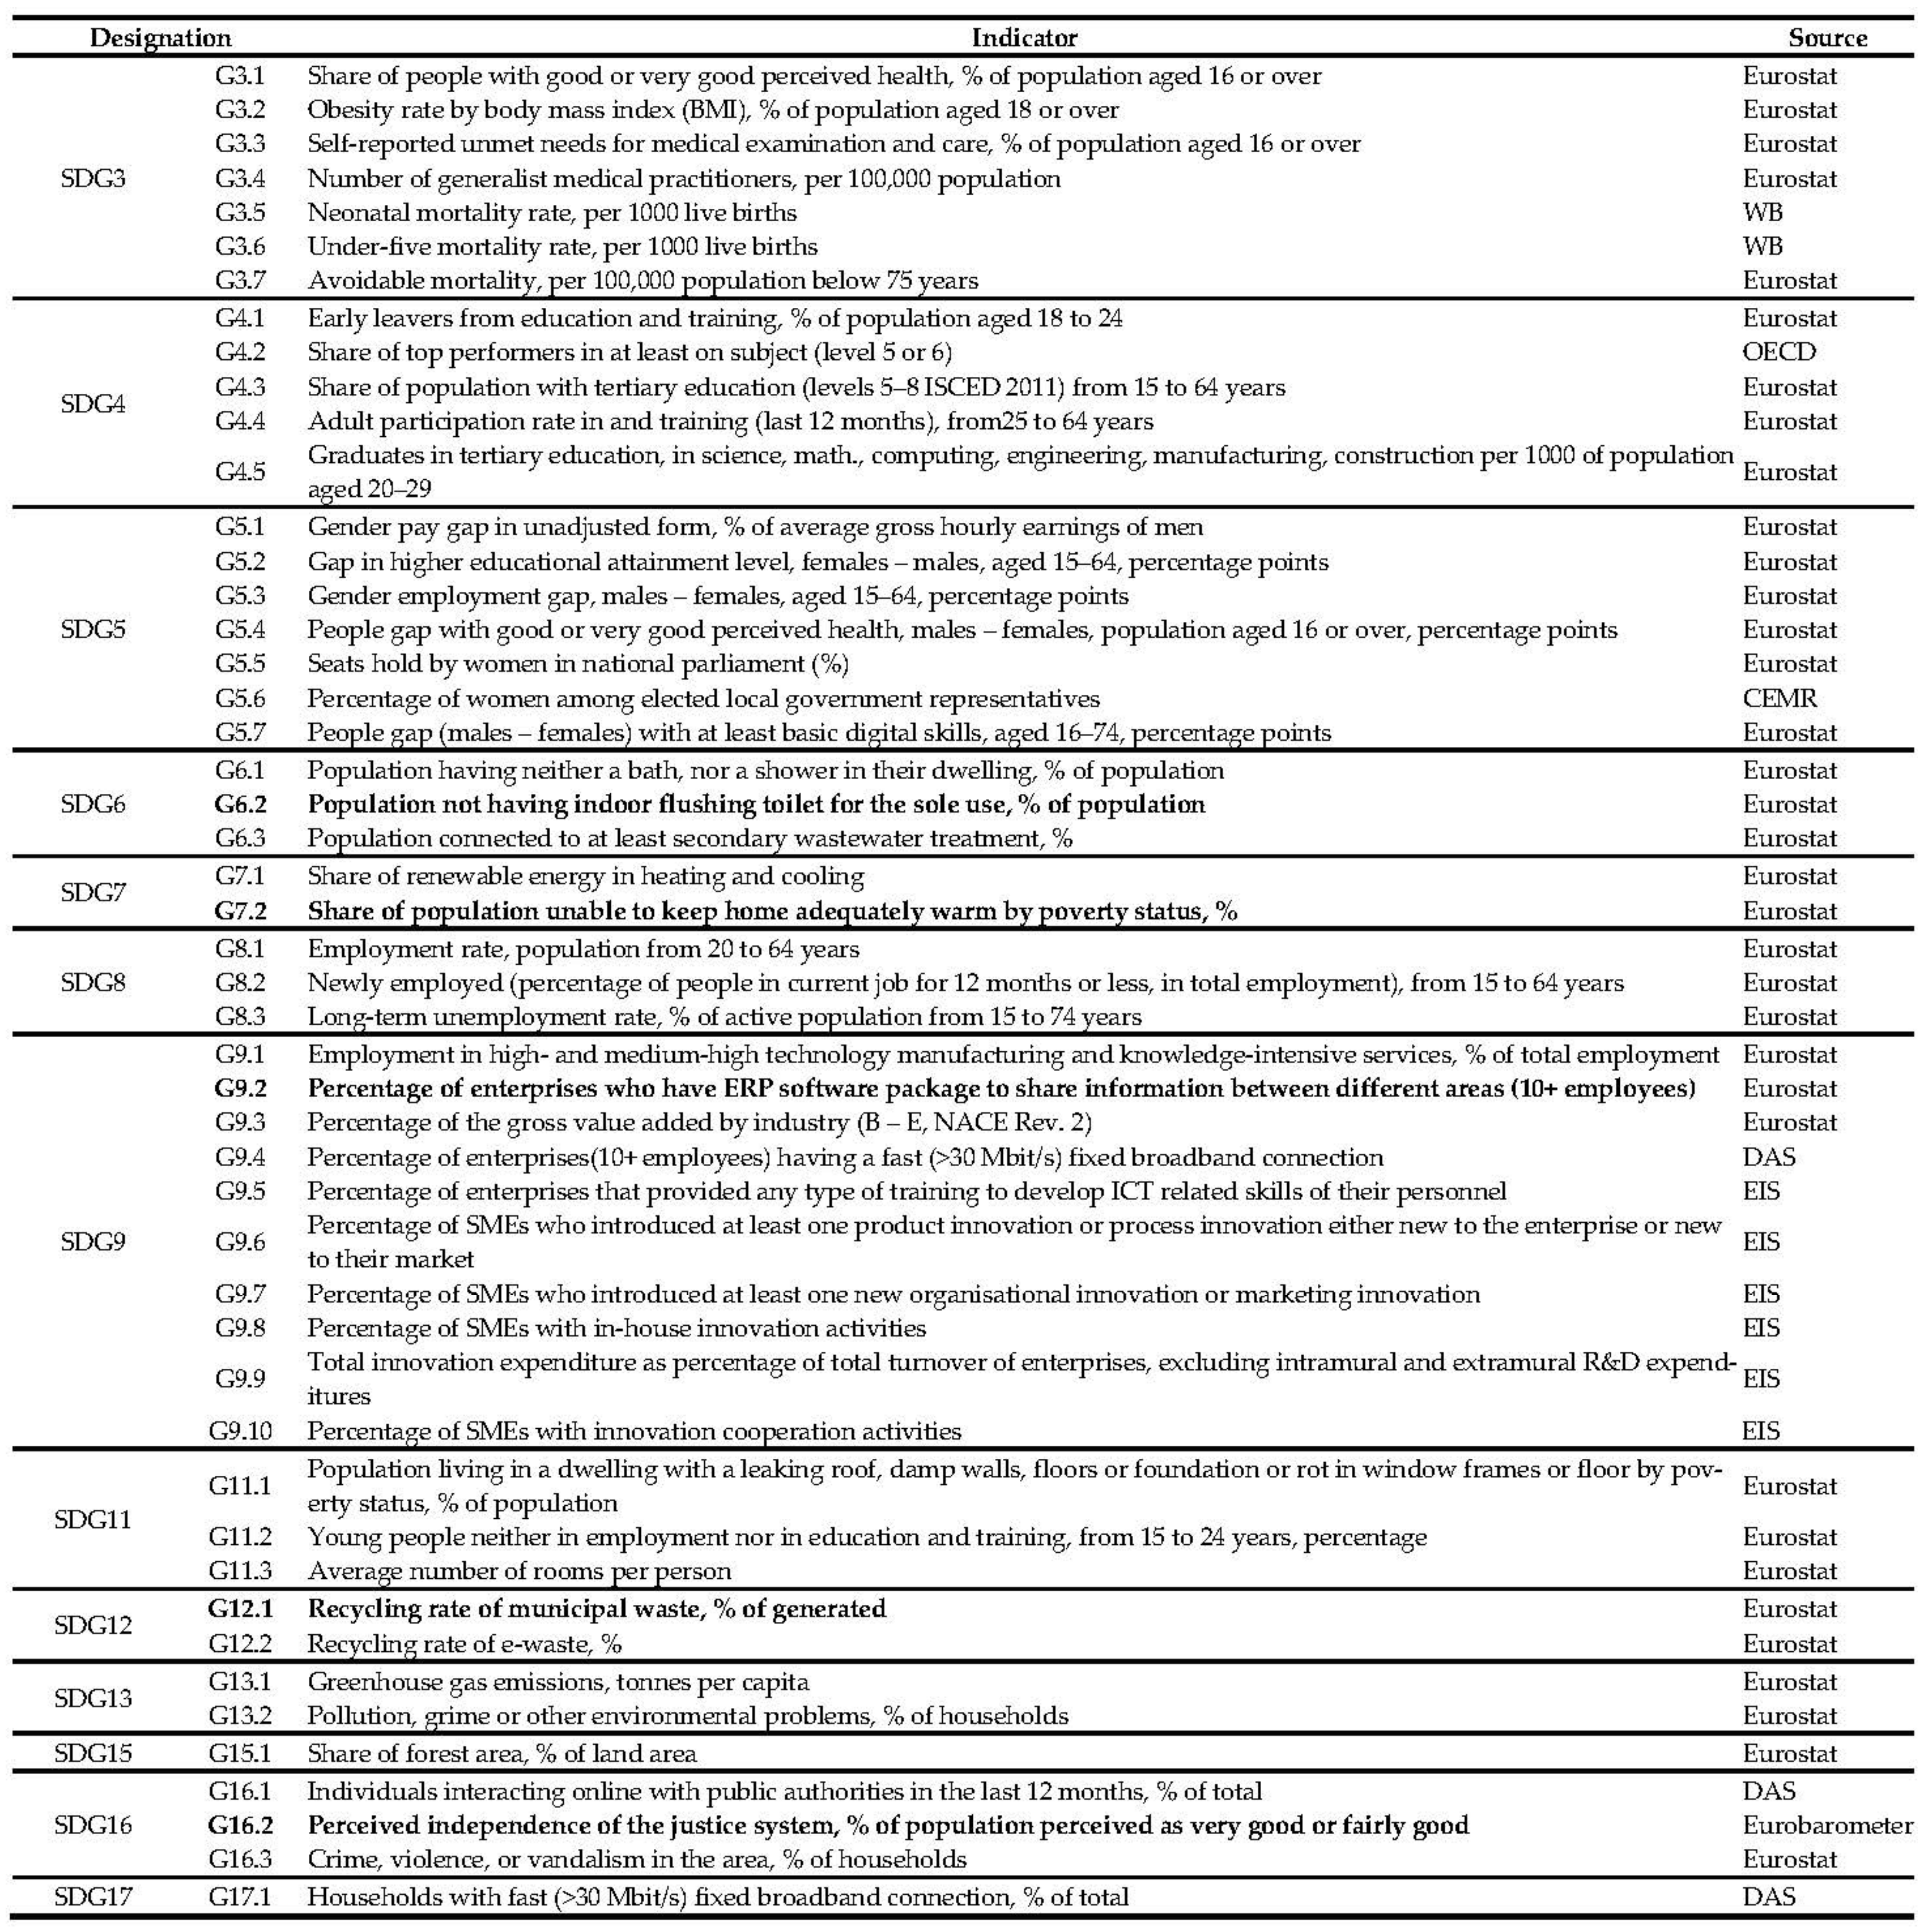
  • The selected sets of indicators are as follows:
    • They are selected voluntarily in all proposals; it is not justified whether these choices are the best possible;
    • They do not fully conform to the globally accepted UN SD paradigm and SDGs, and the obtained indices cannot be compliant with the UN SD vision; only indicator sets in the proposals [17,27] adequately reflect the UN concept; some confusion is caused by the fact that even in the last version of UN-Habitat (2019–2020) [26], SDGs are mentioned but not used;
    • All indicator sets contain a huge number of indicators (tens and even hundreds), which corresponds to an even larger number of action lines to be performed; the municipalities also do not have sufficient capacity and resources for their simultaneous implementation;
    • They contain indicators which do not relate to the functionality of municipalities, including national (e.g., e-government development index [19], level of censorship [31]), business (e.g., patent applications to the EPO [42], on-time flight departures [24]), and even geographical (e.g., natural catastrophe exposure, including drought, earthquake and extreme temperature [18]) indicators; the municipality cannot influence such indicators; in addition, some of them directly depend on the size of the city (e.g., length of the bicycle network [50]);
    • They contain indicators specific to megacities only (e.g., university appearances in rankings [17], world’s top 500 companies located [29]); such indicators are not applicable even for relatively large cities.
  • The calculated complex indices are as follows:
    • Only a few methodologies use mathematical algorithms to determine indicator proportions [21,22,42,56,57]; in other indices, the proportions of the indicators (weighting) are chosen voluntarily, and the proportions are not justified;
    • Only methodologies containing the use of mathematical algorithms are taking mutual relationships into account, as well as the interplay of the parameters and developmental dimensions; this has not been done in the creation of other indices;
    • The key performance indicators (KPIs) are not defined in any proposal; the municipalities have no recommendations for priority action lines.
The indices are practically unusable for municipalities to perform calculations on their cities.
The COVID-19 pandemic has significantly damaged urban development: “The overall global average liveability score has fallen by seven points” [35]. The follow-up long recovery period significantly increases the importance of sustainability in global, national, and city policy-making, in both the short and long term. While the pandemic is still continuing, there is a risk that the long-term SD trend will not be supported by short-term post-COVID recovery activities.
The aim of the study is to develop a mathematical model of city SD, a methodology for calculating the achieved level of SD, and the corresponding city sustainable development index (CSDI), which meet the following criteria:
  • They are usable for any EU city, including small and medium-sized ones:
    • They correspond to the functionality of the city municipality regulation and administration in sectors of local government autonomous functions and delegated public administration tasks, provision of services that are financed or co-financed by the budget and paid services, maintenance and development of public infrastructure, promotion of the civil society, and business development;
    • The municipality of a small city can also manage and improve performance results.
  • They reflect the level of the city’s inhabitants’ quality of life;
  • They are consistent with the UN SD’s vision;
  • They include a limited number of key performance indicators;
  • They ensure the most objective selection and proportions of KPIs in the model.
The methodology of the CSDI development is described in Section 2. Section 3 is devoted to the linear and non-linear modelling processes. Section 4 discusses the results obtained, and Section 5 presents conclusions and recommendations for introducing the CSDI in practice for civil servants, experts, and politicians.

2. Methodology

2.1. Data Mining Algorithms as a Research Tool

Today, there is no direct theoretical calculation’s possibility for the SD model function and the subsequent measurement of SD progress. Therefore, to achieve the aim, adapted data-mining methods were used, which are well-suited to discover and generate knowledge about the existing regularities in various data sets. Algorithms of regression analysis and benchmarking were applied to explore cause-and-effect relationships, to identify the best-performing leaders, and to determine how those that are currently less successful and lagging behind could progress faster. The authors’ previous experiences in using modelling procedures to simulate various socio-economic processes confirms the perspective of such an approach [60,61].
Benchmarking modelling means searching for a mathematical model based on observations of specific cases (see, e.g., [62]). For our task, the modelling determined the relationships between the indicators, which describe some aspects of SD as independent (input) variables (predictors), and some SD indicator that is fully compliant with the UN settings as the dependent (target) variable; its increased value reflects the progress achieved. If the impact of external factors on all cases is similar, benchmarking provides a comparative assessment of the SD level; in this way, we determined the impact of various indicators on the SD level and extracted the most significant ones (KPIs), reducing a large number of predictors.
These algorithms can be applied using complete data sets that are already known; unfortunately, they are not available at the urban level. To overcome this shortcoming, we had to use a detour for the computations, basing the benchmarking modelling on statistical data at the EU27 country level, because of the homogeneous environment with EU cities. The available EU27-level data sets include a lot of indicators on countries of different sizes with different populations, including relatively small countries with small populations (e.g., Luxembourg, Malta). There are indicators that are neutral in relation to the size of the area covered (e.g., percentage of the total population, enterprises, area). The linking of indicators to specific countries may be in no way defined and/or used in the development of the mathematical model. In general, this means that the mathematical expression found can also be used to estimate the SD of cities.

2.2. Choice of Dependent Variable

The dependent (target) variable for the data mining should be fully consistent with the SD vision of Agenda 2030 and politically accepted by the UN globally, with the balance and integrity of economic, social, and environmental dimensions. We considered that the UN expertise and political authority formed an adequate basis that must be fully respected when developing such a variable. A suitable tool, the Advanced Human Development Index (AHDI), was created by supplementing the globally accepted Human Development Index (HDI) with the multidimensional Environmental Performance Index (EPI) according to the Agenda 2030 vision [63]; the methodology for elaborating it ensures the necessary consistency. We used the AHDI as the target variable for modelling.

2.3. Selection of Independent Variables

Direct transfer of global headline indicators (independent variables of the AHDI) to the urban level is neither possible nor targeted, as they cover national economic, regulatory, and other aspects that are determined and widely used at a high political level. They cannot be defined at the level of an individual city (e.g., gross national income, purchasing power standard, schooling years), and a municipality cannot influence them with activities, the results of which would be disclosed and evaluated. For the motivated development of a city, the input data set should include indicators related, at least in part, to the competence of the municipality, enabling its activities to improve the overall SD level (see also [64]).
In fact, the set of SDGs already detail the UN’s understanding of the SD format, while related indicators show progress towards the achievement of a concrete SDG target as the result of performed activities. This means that the selected indicators should correspond to one (or several) SDGs in order to maintain compliance with the UN vision.
There is a stand-alone goal SDG11 in Agenda 2030 [3] related to cities and urban development. Several of its targets related to housing, basic public services, healthcare, and pollution are more detailed in SDG3, SDG5, SDG6, SDG7, SDG12, SDG13, and SDG15. There is also recognition of the cross-cutting nature of urban issues, which are interlinked “with a number of other SDGs, including SDG6, SDG7, SDG8, SDG9, SDG12, SDG15, and SDG17 among others” [7]. We also considered SDG4 (quality education) and SDG16 (peace, justice and strong institutions) as important for the urban level.
In turn, we did not include several SDGs as being inconsistent with the functionality of municipalities in the study:
  • SDG14 does not correspond to the city level;
  • Poverty and hunger (SDG1, SDG2), as understood by the UN, are not relevant in the EU27;
  • The key target of SDG10 (reducing inequality) is achievable only as a result of national political settings and decisions—minimum income level, minimum wage level, distribution of benefits through the tax system, and so forth.
Thus, 13 of 17 SDGs relate fully or partly to the functionality of the city council and municipality. This means that the municipality should work simultaneously on many different action lines to achieve progress in SD. It is absolutely clear that no municipality can perform all of them, even partly, due to both insufficient capacity and resources to cover the whole very wide spectrum, and the inability to invest simultaneously in all action lines. Prioritizing the action lines is an essential, sometimes even critical factor for many municipalities.
To obtain relatively abundant data sets at the EU27 country level, we used not only statistical data from Eurostat as independent variables for data mining and modelling, but also data from other databases: the Organisation for Economic Cooperation and Development, the World Bank, the Council of European Municipalities and Regions, the Digital Agenda Scoreboard, the European Innovation Scoreboard, and the Eurobarometer. These data are processed according to unified methodologies and regularly updated; their quality is sufficient for modelling.

2.4. Determination of Research Plan

The methodological principles described above show that several sequential steps were required to create the model (Figure 1).
The modelled AHDI (AHDIm) was defined as a multi-parameter function (f) of the set (Π) of n KPIs (pn):
AHDIm = f(Π) = f {p1, p2, …, pn}.
The KPIs in the modelling process were computed from the gathered broad set of indicators. To achieve objective selection of the KPIs, as many quantitative indicators (related to the municipalities) as were accessible were selected and tested for each SDG (49 indicators in total, see Appendix A). The achieved level of compliance of the model’s target values AHDIm to the real values AHDI (mutual correlation) served as a quality criterion in the modelling procedure. The determination coefficient R2 was used as the unit of correlation during the modelling.
The KPIs found for EU countries will be no different from those for EU cities, due to defined principles for selecting indicators and an analogue SD treatment. The found mathematical expression of the AHDIm (with respect to the specific weights of the KPIs as well) can be transposed at the urban level and used for calculating the CSDI with respect to the SD level of the city.

3. Modelling Process

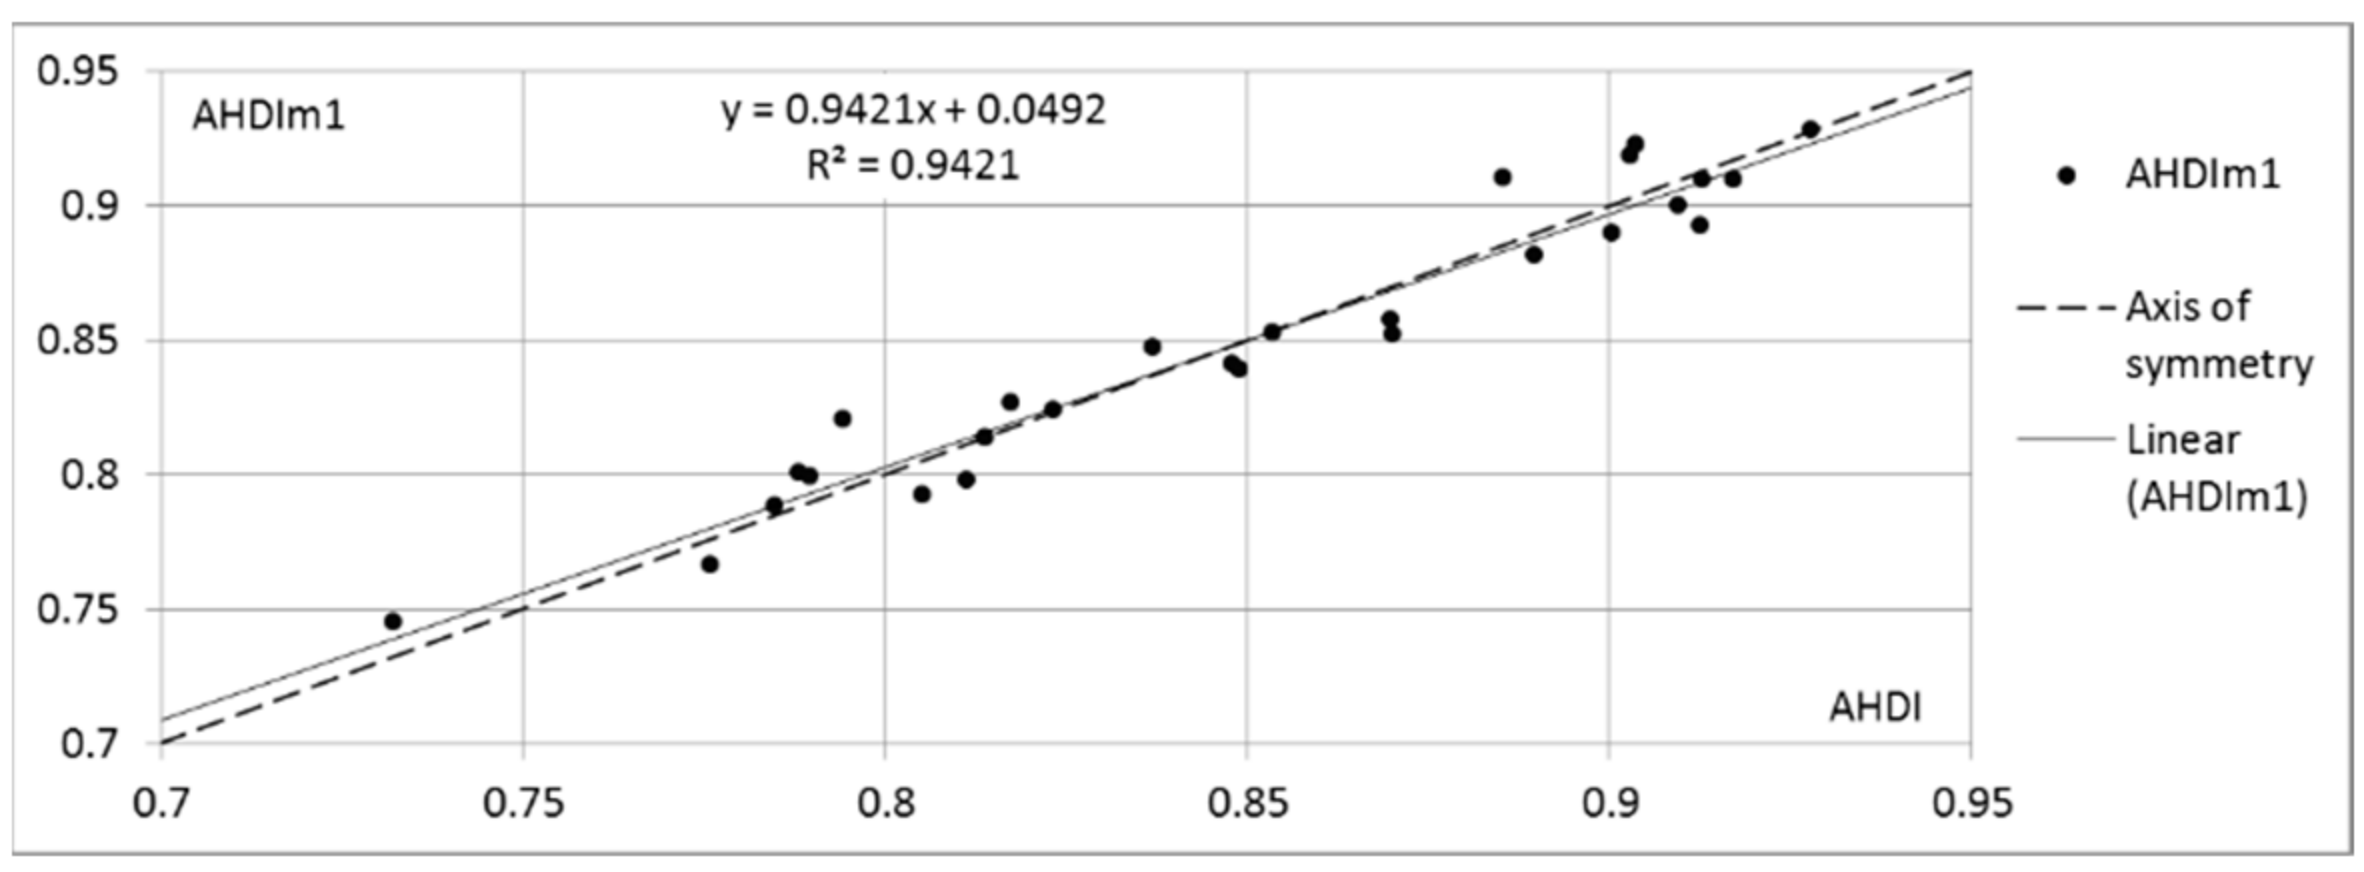
3.1. Linear Modelling

The choice of the optimal modelling algorithm tools was determined by the requirements set by the task to be solved: (1) the mode and tool of modelling should allow easy repeatability of the modelling if data and/or indicators change, and (2) the model should be implementable, recalculable and adaptable to a specific city by a person with mediocre programming skills.
We started modelling by using the linear regression algorithm, because (1) it is mathematically the simplest method, (2) there is a simple and clear interpretation of the model, and (3) general knowledge in mathematics and programming is sufficient for model computation. Initial ad hoc experiments with creating a linear regression model showed good results, so it was decided to use linear modelling. Post-modelling analysis will show the need for and purposefulness of non-linearities to obtain stronger causal relationships.
By the linear algorithm, the benchmarking model (1) was expanded into a linear mathematical expression:
AHDIm 1 = + β 1 × p 1 + β 2 × p 2 + + β n × p n
where α is the intercept and βn is the modelled proportion of KPI pn in the linear model AHDIm1.
Several general and specialized programming languages are suitable for our task. Among them is the R language, which is specialized for data analysis; it has a number of advantages that are important to our study: (1) open access to the most popular operating systems; (2) a qualitative connected open integrated development environment (IDE) RStudio; (3) an interpretation mode that speeds up program development; (4) many open access external libraries for data analysis and display, and (5) simple and easy-to-learn syntax.
R allows for interactive execution of commands on the fly and an immediate display of the result; this speeds up the ad hoc analysis of data. It is possible to create complex data analysis programs. RStudio is a user-friendly environment for development that allows users to interact with, as well as develop and operate complex applications. For these reasons, we chose to use the well-developed R and the associated RStudio for data analysis and modelling. The general algorithms and standard software package needed to be adapted and supplemented to perform our specific tasks.
The gathered indicators should associate with one of the 13 SDGs related to city-level performance. To achieve the most objective mathematical selection of KPIs by the modelling process, as many quantitative indicators as were accessible were gathered (see the full list of indicators in Appendix A). Thirteen separate groups of indicators related to one of the SDGs were created; each group of SDGx consisted of a series of indicators (Nx indicators Gx.Kx, see Figure 2) that were used for modelling as independent variables.
To obtain reliable modelling results based on the causal relationships between the P independent variables and the dependent variable and to exclude individual deviations, T >> P is required, where T is the number of cases (27 countries in our study). The stronger this inequality, a more accurate causal relationship (from the point of view of general causality) can be created. If T ≤ P, we could certainly find several relationships that perfectly cover all T data points, but without the possibility of further generalization (which is needed to transfer the results to cities).
On the other hand, according to the UN’s vision of balanced SD, all SDGs should be evenly represented in the search for KPIs in the modelling process. Together, this means that only one indicator Gx.Kx from the set of indicators of each SDGx can be used as the predictor in each modelling procedure (P = 13 in our study, providing T >> P).
Obviously, the highest obtained efficiency of the SD process will be achieved if all terms in expression (2) are compatible, and the progress of all predictors used had a positive effect on the progress of the target variable AHDI. To determine such good combinations of predictors, it was necessary to model all possible combinations in which a single indicator from each SDGx indicator set was used as the predictor; more than 1.7 million models for subsequent testing were created in total. Each modelling procedure was supplemented with a compatibility test to check the mutual compatibility of the specific indicators’ combinations, and 232 “good” combinations were identified; they were analyzed to determine statistically significant indicators.
Of the 49 indicators, 15 were found to be statistically significant in at least one of the good combinations, even using a low threshold for evaluating the significance of predictors: the probability of rejection of the null hypothesis (p-value) was less than 0.1. These indicators were divided into two drastically different groups by the intensity of their inclusions in the “good” combinations: 11 indicators were represented fewer than 10 times each, while for 6 indicators, more than 25 times each (Table 1; indicator numbering from Appendix A).
Using only these six indicators as predictors, we performed an individual modelling procedure by creating the mathematical expression of the six predictors’ linear model, AHDIm1 (3):
AHDIm 1 = 0.6527891 + 0.0012563 × G 3.1 0.001596 × G 6.2 0.0019518 × G 7.2 + + 0.0013329 × G 9.2 + 0.0006729 × G 12.1 + 0.0010646 × G 16.2
The modelled linear expression (3) reflects reality with high accuracy. The determination coefficient R2 indicates a very strong correlation between the actual AHDI and modelled AHDIm1 (Figure 3), while the p-value is extremely low (Table 2). The adjusted determination coefficient R2adj shows that more than 90% of variability in the data is explained by the model. All predictors are of high statistical significance; the small p-values of the predictors show their decisive role in the model’s regularity. This clearly means that they are the searched KPIs; action lines, which lead to progress in these KPIs, can be recommended to municipalities to increase the sustainability of their cities.

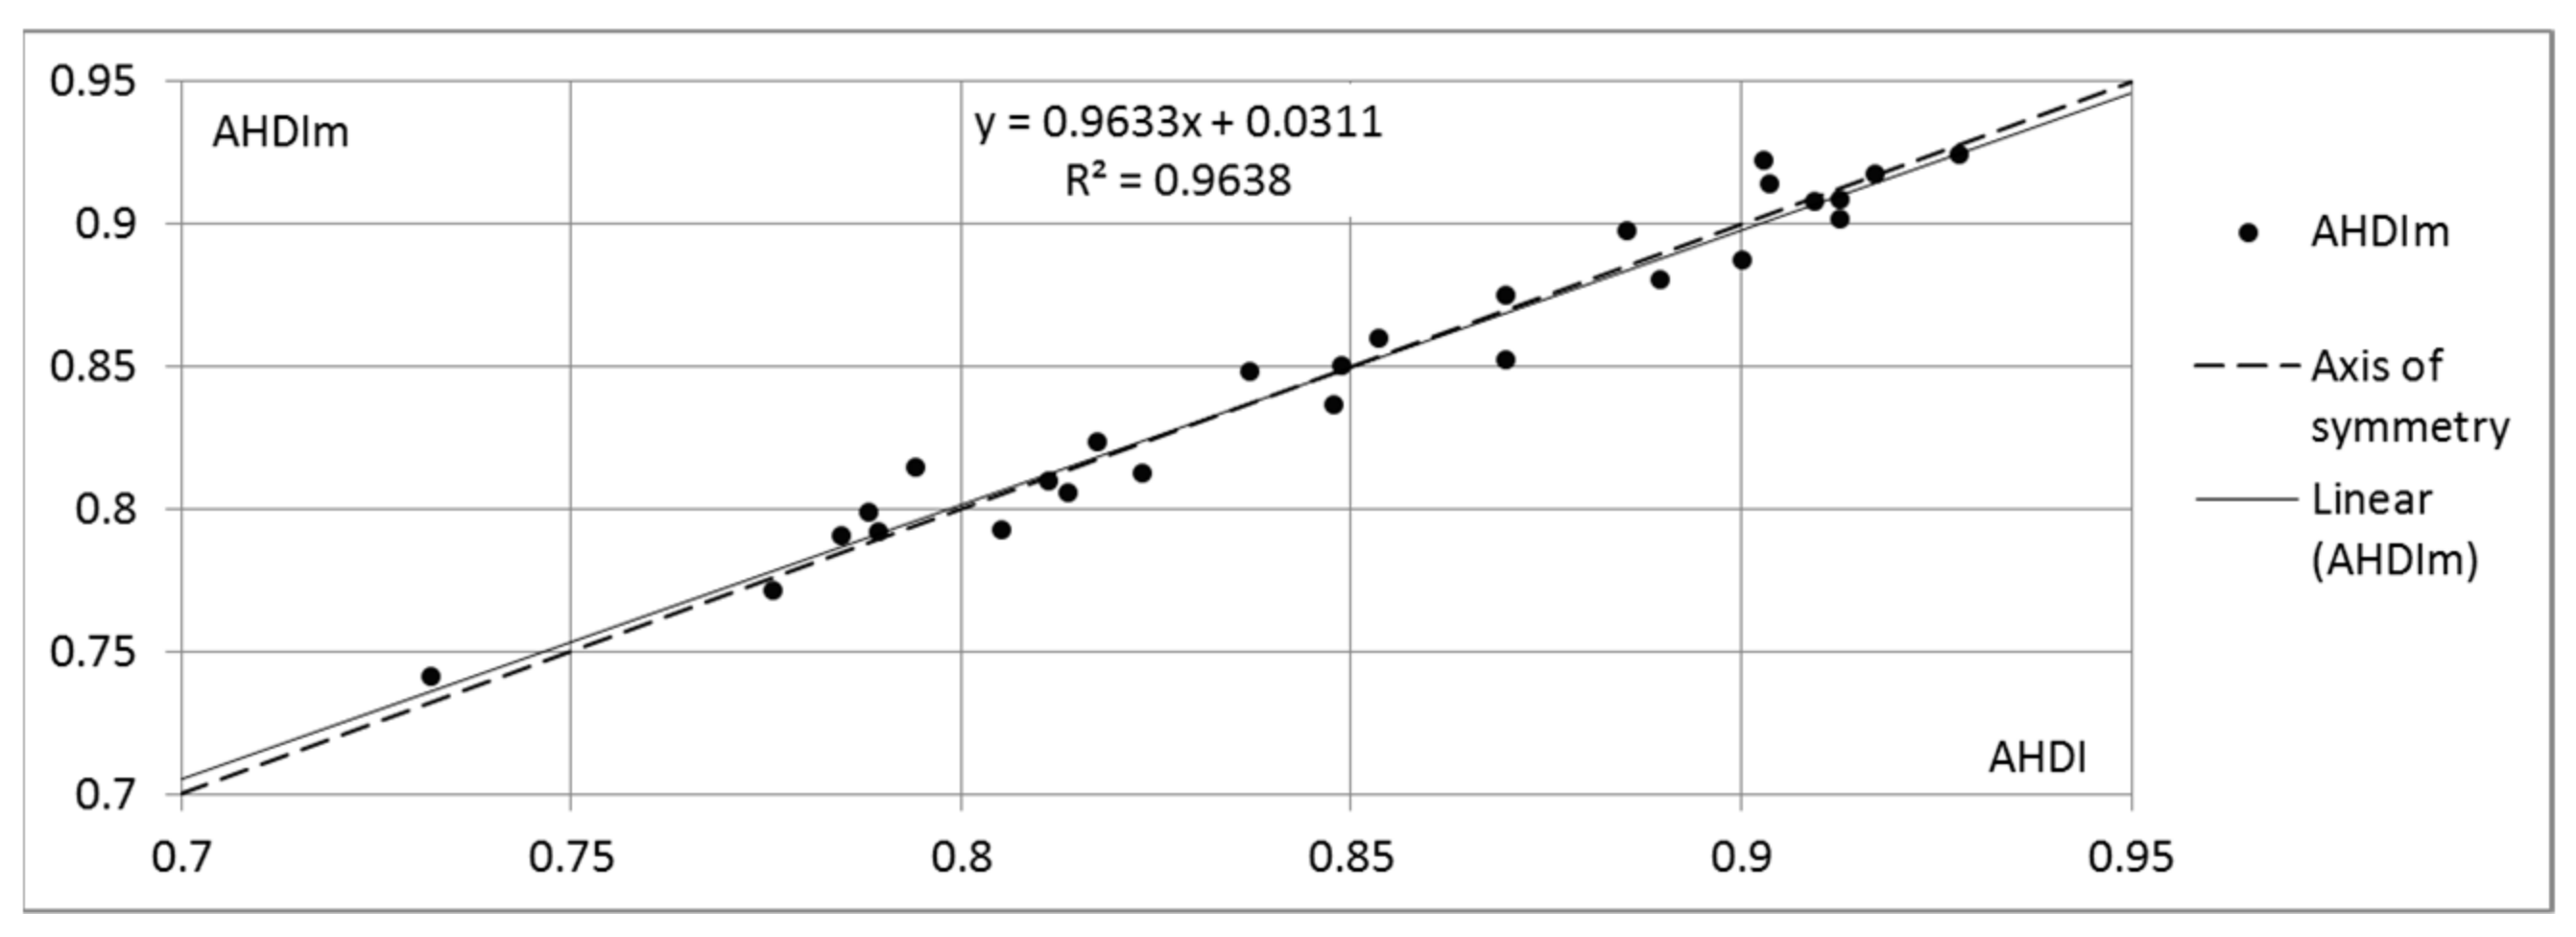
3.2. Non-Linear Modelling

Despite the excellent numerical characteristics of the model, a detailed analysis also shows the possibilities for further improvement. The R diagnostic plot (Figure 4a) shows that residuals are not quite evenly spread around a horizontal line (especially at high fitted values). This indicates that the linear model does not fully capture the existing non-linear causal relationships. Further, the plot (Figure 4b) identifies data point 23, which sits behind the threshold, the so-called “Cook’s distance”. This data point is not an outlier; nevertheless, in model (3), it can become influential against general regularity. A reduction of residuals would also be desirable. Together, these point to a challenge to add some non-linearity to the model in order to further improve the compliance of the modelled target variable AHDIm with the actual AHDI. This was done at both the level of individual predictors and the level of the mathematical expression of the model.
To process the level of predictors, we checked the individual causal relationships between each predictor and the target variable AHDI. The real impact of each individual predictor on AHDI is, of course, different from the individual regularity (e.g., due to some mutual impact of predictors). Nevertheless, the qualitative differences among the six individual regularities provide some comparative indication. Five of the six regularities show weaker or stronger proportionality. However, the sixth regularity (G6.2 versus AHDI) is obviously very far from linear (Figure 5a); this, of course, reduces the quality of the linear model.
By means of the RStudio function NLS, we modeled several non-linear functions to transform the G6.2 data set into a new data set NG6.2, achieving a stronger linear relationship between NG6.2 and AHDI:
AHDI   ~ a + b × G 6.2 c AHDI   ~ a × ln b × G 6.2 + c AHDI   ~ a G 6.2 + c + b
The strongest correlation (Figure 5b), using the correlation correl(NG6.2:AHDI) as the quality criterion, was achieved by modelling the inverse proportionality expression (4), obtaining the NG6.2 expression (5):
NG 6.2 = 0.76488 + 0.13606 G 6.2 + 0.91652
By repeating the linear modelling, we obtained intermediate model M6:
M 6 = 0.3781410 + 0.0005767 × G 3.1 + 0.3869453 × NG 6.2 0.0017305 × G 7.2 + + 0.0011321 × G 9.2 + 0.0006888 × G 12.1 + 0.0009180 × G 16.2  
A scatterplot (Figure 3) shows that the linear trendline of the data points is slightly skewed with respect to the axis of symmetry. As a result, smaller fitted values of AHDIm1 are generally slightly above the corresponding AHDI values, while large fitted values are below. Such shifts indicate that the sigmoidal function is best-suited for improving the model. We modeled several S-shaped functions:
AHDI   ~ + β × ( a × atan tanh M 6 b ) AHDI   ~ + β × ( a × tan tanh M 6 b ) AHDI   ~   α + β     ( a     tan ( b     M 6 ) ) AHDI   ~ + β × ( a × tanh b × M 6 ) AHDI   ~ + β × ( a × atan b × M 6 ) AHDI   ~ + β × ( a b + e M 6 ) AHDI   ~ + β × ( 1 + e M 6 ) b AHDI   ~ + β × ( a × M 6 b + M 6 2 ) .
The strongest correlation was achieved by modelling expression (7), obtaining the final AHDIm expression (8):
AHDI   ~ 6.329 + 8.4701 × ( 1 + e M 6 ) 0.46443
It can be seen that AHDIm can be calculated sequentially using expressions (5), (6), and (8).

4. Results and Discussion

The achieved accuracy of model AHDIm and its coincidence with the real AHDI clearly demonstrates the correctness of the trend of the current study and its perspective. One can see that the final non-linear model AHDIm coincides much better with the actual AHDI values compared with the linear model AHDIm (Figure 6). All numerical characteristics (R2, R2adj, p-value) were further improved (Table 2). The analysis of results (Figure 6) shows that all 27 data points are located in the corridor ±2.5%, while 24 of them are in the corridor ±1.5%. The formula of the linear trendline shows reduced deviation of the data points from the axis of symmetry.
R diagnostic plots (Figure 7) show good behaviour of the residuals. They are quite equally spread around the horizontal zero line (Figure 7a); no data point is even near Cook’s distance (Figure 7b).
In order to more accurately reflect reality, the statistical raw data used as predictors, in addition to their justified changes, are typically revised repeatedly and updated by data holders. We checked if and how these data changes affect the model AHDIm, with respect to whether the model is stable against such data variability. Several AHDIm 5% control models were computed using the modified data, with 5% chosen as the maximum level of random variability of the input data; 5% is close to the median change in EU27 data over the previous 3 years. Of course, these changes have a corresponding effect on the modelled assessment of each individual country; however, the shift using models AHDIm and AHDIm 5% is negligible; it does not exceed 0.2% across the EU27 countries. This means that for practical applications, annual calibrations of model AHDIm are not necessary.
The quality of the obtained modelling result, which is confirmed by the excellent correlation with AHDI and the statistical significance of all predictors, assures that six mathematically selected predictors (Table 1) can be defined as SD KPIs. The results obtained could be applied to cities of the EU27 countries because (1) benchmarking modelling has to be performed and it was performed in the relatively homogeneous (politically, normatively, socially, economically) territory of the EU27 countries and cities (CSDI is therefore limited to EU cities), (2) all six KPIs are neutral relative to the scale of the issue covered, and (3) KPIs, at least in part, relate to the competence of the city municipality. This means:
AHDIm → CSDI.
when transferring the results at the city level, these KPIs show the priorities for the municipalities of the EU cities, while the changes in the CSDI show the progress achieved.
The developed urban SD model has a number of advantages over the existing offers. For the first time in the practice of creating urban SD indexes and indicator systems, the CSDI:
  • Is created as a mathematical model of SD; the causality between the indicators of various development aspects, selection and proportions of KPIs, and the general level of urban SD are mathematically calculated; and the quality (accuracy) of the model is quantified. Currently, in all proposals, indicators are selected voluntarily; it is not justified whether these choices are the best possible. Only a few methodologies use mathematical algorithms to determine indicator proportions [21,22,42,56,57]; however, this process has remained at a conceptual level, and no proposal has published the obtained values and mathematical expressions of the models, from which the SD level of the specific city can be calculated. In all other proposals, the proportions of the indicators (weighting) are chosen voluntarily, and the proportions are not justified. Model validations are not published.
  • Is compliant with the UN vision on SD, created by high-level experts and accepted by the UN General Assembly as the global development strategy; we consider that the UN expertise and political authority are crucial in defining SD substance as the integrity and balance of social, economic, and environmental dimensions. Existing proposals have more or less deviated from the UN concept. Currently, only indicator sets in the proposals [17,27] adequately reflect the UN concept. The last version of UN-Habitat [26] only mentions SDGs, without using them to select indicators. Sets of indicators in all other models do not fully conform to the globally accepted UN SD paradigm and SDGs, therefore the obtained indices cannot be compliant with the UN SD vision.
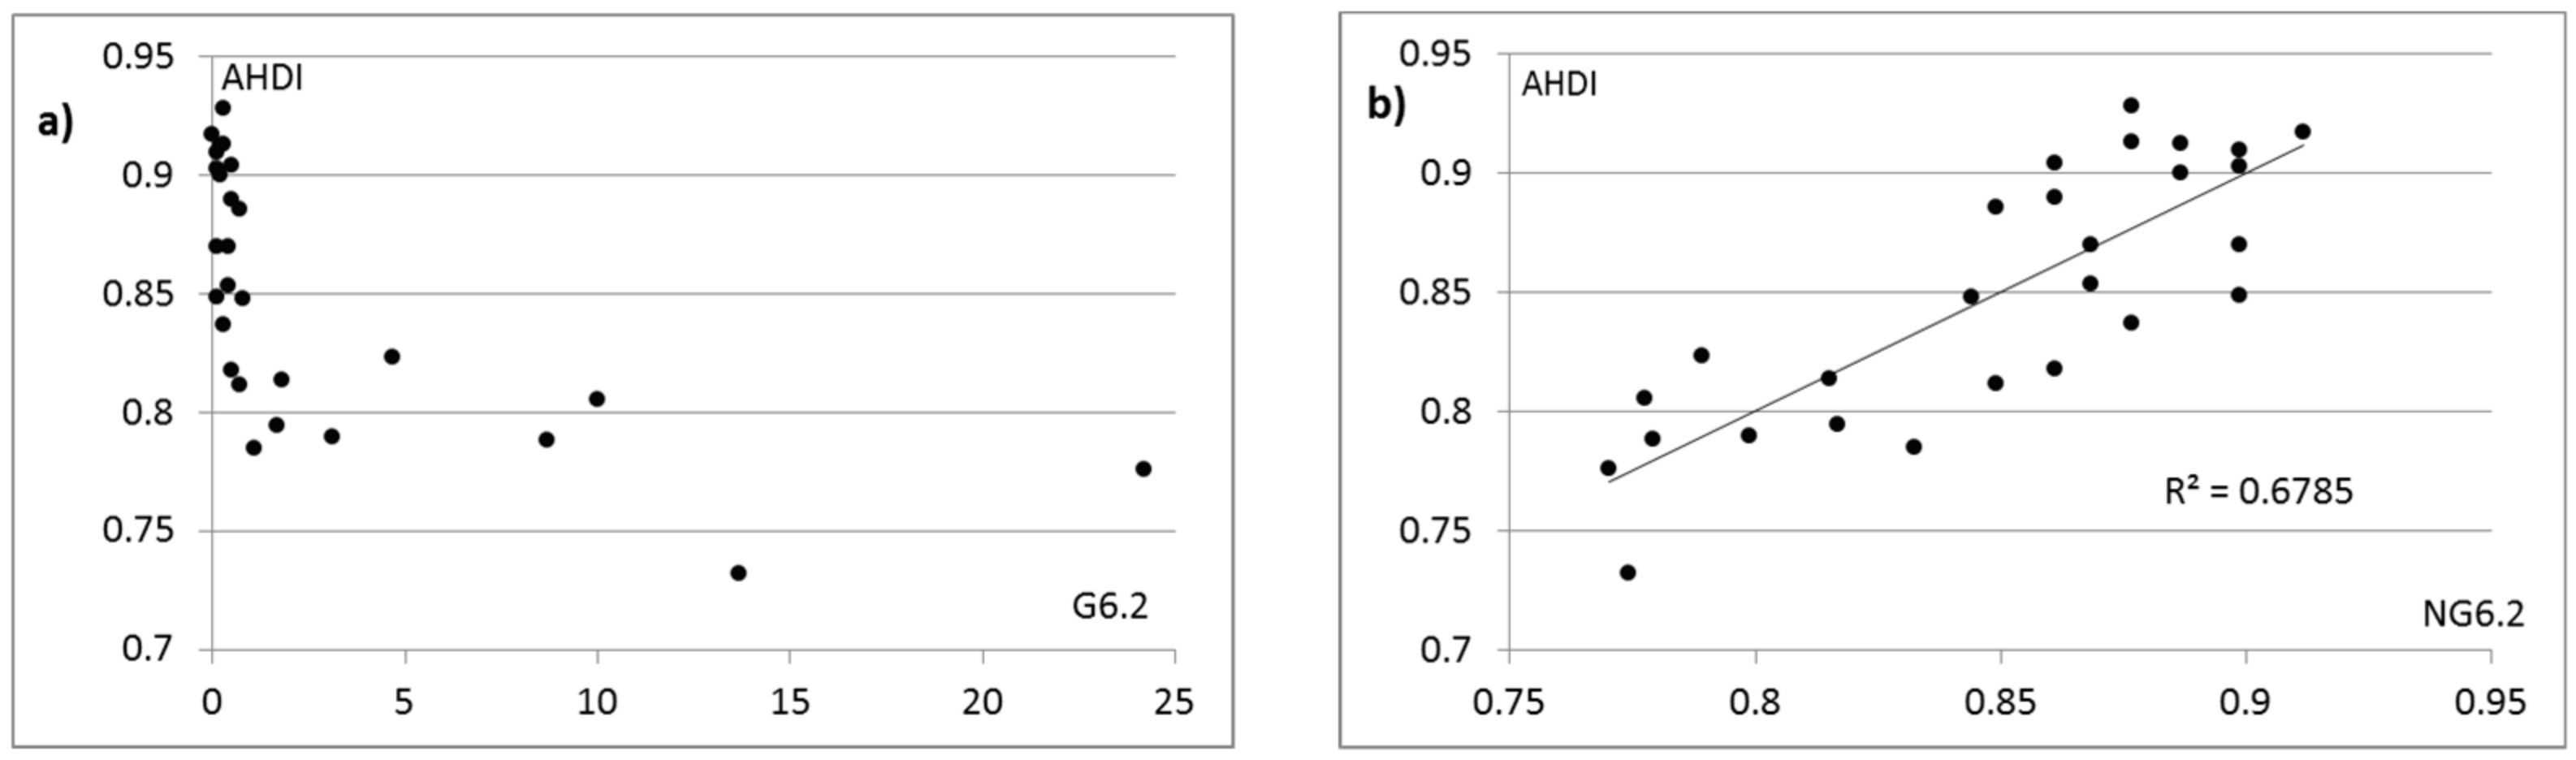
  • Is applicable for any EU city, including small and medium-sized ones, because for all used independent variables, all six KPIs (1) are neutral relative to the scale of the issue covered (only share or percentage of population, households, area, enterprises, etc. is applied), in contrast to existing models, which also use indicators that are directly dependent on the size of the city (e.g., length of bicycle network [50]); and (2) at least in part, relate to the competence of the city municipality; it was not used at a national level (as, e.g., e-government development index [19], level of censorship [31]), business (as, e.g., patent applications to the EPO [42], on-time flight departures [24]) and even geographical (as, e.g., natural catastrophe exposure, including drought, earthquake and extreme temperature [18]) indicators; also indicators that can characterize only metropoles are not used (as, e.g., university appearances in rankings [17], world’s top 500 companies located [29]). The municipality cannot influence such indicators.
  • Is based on the limited number of KPIs that were mathematically selected maintaining the quality of the model from a huge set of independent variables corresponding to the municipal functionality. The KPIs are not defined in any existing proposal; no recommendations are provided to municipalities on priority action lines. Actually, municipalities have a lack of capacity and resources to work simultaneously in a huge number of action lines, and prioritization of action lines (resp. related KPIs) is an advantage of the CSDI. It should be mentioned that KPIs, which are drivers of the model, are at the peak of the pyramid; in fact, they reflect the quality of life of urban communities in the broad sense of the term, integrating many aspects.
  • Is also considering complicated crosslinks, and the integrity and interplay of separate actions; this had become possible due to the simultaneous mathematical processing of all predictors in the modelling process as opposed to the traditional mechanical summation of indicator values. Only a few existing methodologies, containing use of mathematical algorithms for the simultaneous processing of all indicator data, can take into account mutual relationships and the interplay of the parameters and development dimensions (as, [21,22,42,56,57]); this cannot been done in the creation of all other indices.
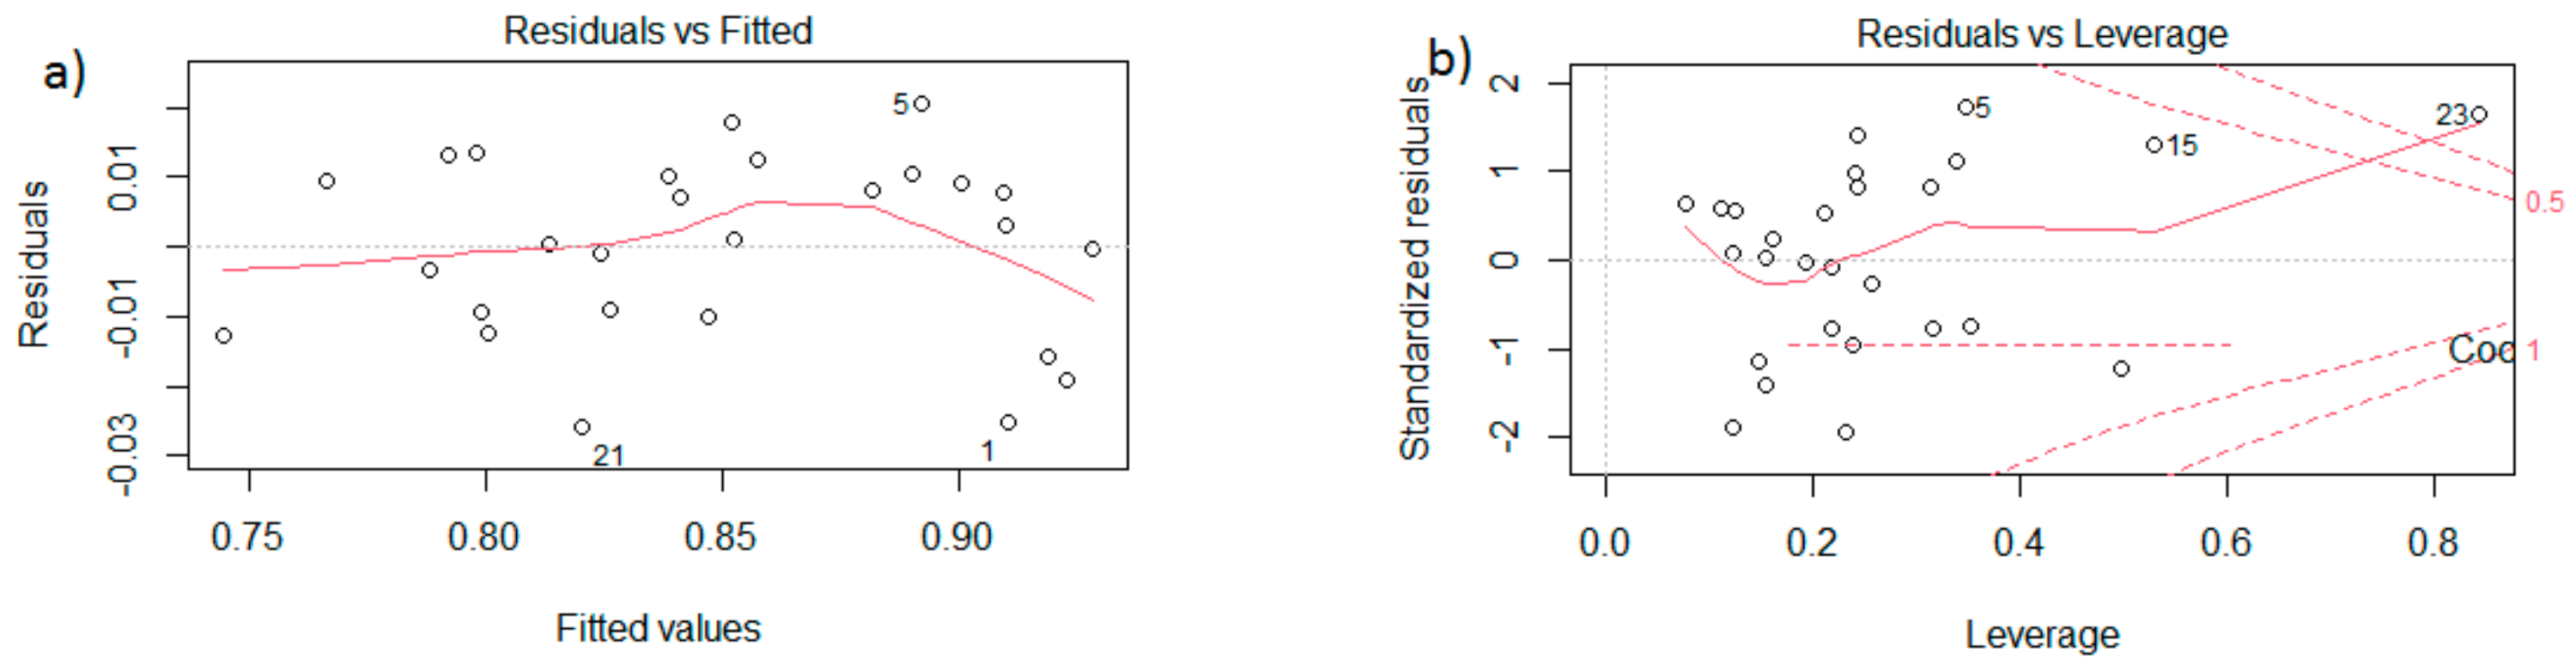
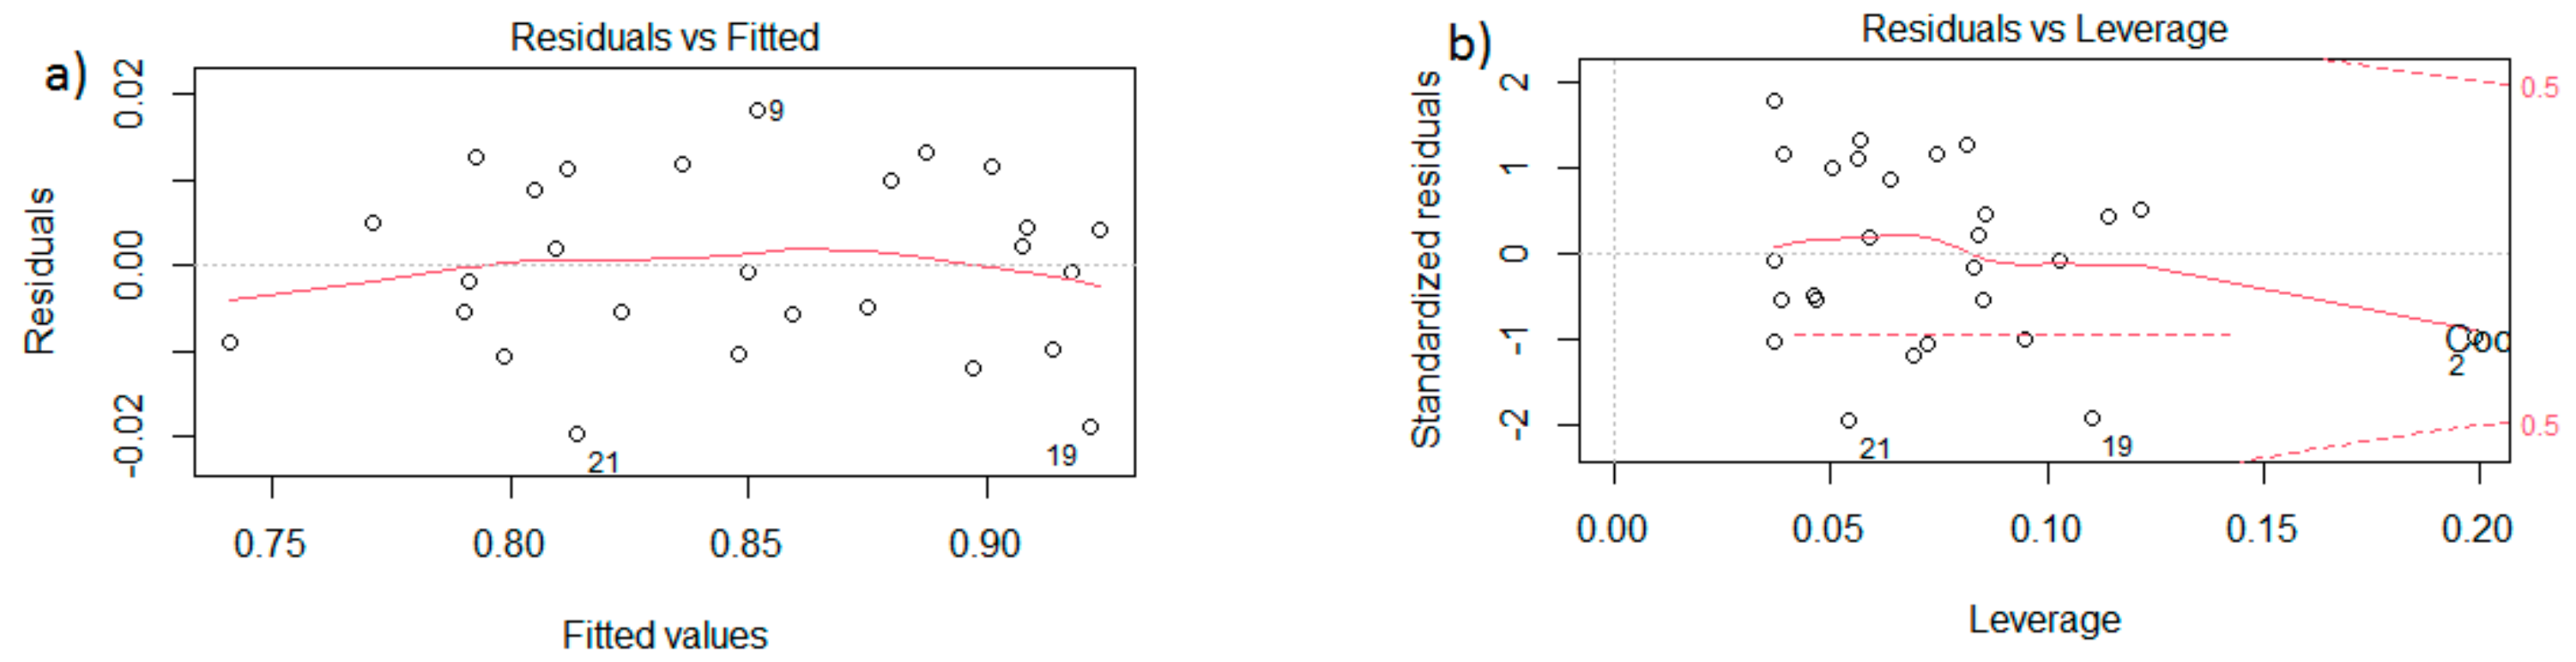
  • Is computed by achieving an overall reasonable combination of universality (the applicability of the index to each EU city has been achieved), accuracy (confirmed by excellent numerical characteristics (R2, R2adj, p-value) and R diagnostic plots), stability (shown by the stability test), and simplicity (only six KPIs are used; using the published mathematical expressions of the model, any municipality can easily calculate the SD level of its city using only a calculator) that are strong contributing factors to the practical application of the model.
As a pilot project, CSDI values were calculated for several Latvian cities (Figure 8); their populations range from 20,000 to 620,000. The widespread perception that Riga, the capital, has the highest level of sustainability among the country’s cities is not confirmed. Valmiera (23,000 inhabitants) and Ventspils (34,000 inhabitants) received the highest scores, clearly indicating the sustainability resources in smaller cities.

5. Conclusions and Recommendations

There is serious scientific novelty that has been achieved in the modelling and measuring of SD and in creating methodology and tools for urban municipalities in planning and managing the city SD. The mathematical model, CSDI, of urban SD was created; the causality between the indicators of various development aspects, selection, and proportions of KPIs and the general level of urban SD found in this way was mathematically computed, and its quality (accuracy) was quantified. The model is compliant with the UN vision of SD, and applicable for any EU city, including small and medium-sized ones; it is based on a limited number of KPIs that were mathematically selected from a huge set of indicators corresponding to the municipal functionality. An achieved reasonable combination of universality, accuracy, stability, and simplicity of the model are strong advantages over existing proposals using the subjectively selected set of indicators and their proportions in the complex index.
The transparent project methodology and open access to mathematical expressions provide an opportunity for municipalities to put the project results into practice to monitor the achieved SD level in statics and dynamics, to see progress and backwardness in separate aspects, and take it into account when making policy planning and strategic decisions, as well as programming the municipal budget; it will undoubtedly make a significant contribution to the SD process. For CSDI:
  • The planning process shows the priority action lines for increasing the SD level, and justifies the distribution of the budget and the need and priorities for investments (local, national, EU);
  • It supports SD management, monitors the implementation of the SD concept and plans, shows the achieved progress and the SD level, as well as the compliance of the medium-term development program with the goals and strategy of SD, and evaluates the achievements and weak points in statics and dynamics;
  • For selecting new projects/initiatives for the current year’s budget, it gives an opportunity to compare projects in different sectors, calculating project’s efficiency, which is a target function in the project tendering;
  • It provides an opportunity, which is based on objective data, for dialogue with public administration institutions in the scope of local government functionality and for contribution to national SD programs;
  • It improves communication with the population/voters by clearly explaining the municipality’s plans, priorities, and activities, showing how the specific actions of the municipality affects the overall SD level, increasing confidence in the municipality.
Using the published mathematical expressions of the model, any municipality can easily calculate the SD level of its city using only a calculator. The methodology, which is described in detail, makes it possible to test the purposefulness of using new indicators; it requires only mediocre programming skills. All research results have been transferred to a data technology company to actively disseminate study results after the completion of the research and to help municipalities in usage of the model for the SD planning and managing.
The above aspects of the use of CSDI are gaining in importance in the context of the challenges posed by the COVID-19 pandemic. The ability of the municipality to react sharply to opportunities and use short-term recovery benefits in the city’s SD is of great importance. For example, the inevitable decline in the level of globalization of processes and changes in value chains, the growing importance of self-sufficiency at the national level poses a challenge for EU countries to attract companies located far beyond the EU’s borders. However, not all companies promote urban SD; CSDI shows which companies are desirable to attract: energy-efficient companies with modern and transparent business transactions (G9.2) generating little pollution and waste (G3.1) in the production process.
Another example is the prudent use of the substantial funding that is being allocated by Recovery and Resilience Facility regulations [65]: €672.5 billion “to mitigate the economic and social impact of the coronavirus pandemic and make European economies and societies more sustainable”. Each Member State has to spend 37% of the funding for climate policy objectives. The key issue for reduction of greenhouse gas (GHG) emissions is massive renovation of urban heating systems that clearly shows the strong involvement of local governments. The municipality must overcome the understandable temptation to focus on such fragmented building insulation projects that have the greatest immediate effect, while losing the overall long-term vision (cherry-picking). CSDI shows that sensible implementation of the renovation program provides an opportunity to increase the level of urban SD, reducing household heating costs (G7.2) and improving the health of the population (G3.1), if the possible increase in corruption due to high cash flow is prevented (G16.2).
The scientific team is planning to continue and expand research using the knowledge and experience gained in creating the SD model.
To minimize GHG emissions (i.e., heat consumption) in the city, it will be needed to combine many projects that include the large-scale renovation of buildings as well as district and local heat production, transmission, and distribution systems also beyond 2030. There will be varied stochastic financing options with different conditions and target variables; each option must be quickly responded with a competitive project that meets the specific conditions to the maximum.
On the other hand, implementation of medium- and short-term climate projects must not conflict with territorial and business SD, with economic and energy sustainability in the area, as well as with reducing the burden of the heat costs on municipal and household budgets. That would be the effect of unreasoned project selection and execution. The goal of the following research will be studying and developing easy-to-use methodology and an appropriate innovative tool for sustainable management of the urban heating system, which would allow for rapid and sufficiently accurate and objective analysis at the pre-design stage regarding the potential and benefits of the various heating system renovation projects’ variants in a given area, as well as comparisons of them according to their efficiency and impact on SD. The application for such a research project has been submitted to the Latvian Council of Science.

Author Contributions

Conceptualization and methodology, E.K.; data analysis, E.K., G.K., J.B. and M.P.; writing—original draft preparation, E.K., J.B., G.K. and M.P.; writing—review and editing, E.K., G.K., J.B. and M.P.; visualization, E.K. and G.K.; resources, supervision and project administration, G.K.; funding acquisition, E.K., G.K., J.B. and M.P. All authors have read and agreed to the published version of the manuscript.

Funding

This research was funded by the Latvian Council of Science grant no. lzp-2020/2-0073 “Sustainable urban development model compliant with UN settings”, University of Latvia no. LZP2020/69.

Institutional Review Board Statement

Not applicable.

Informed Consent Statement

Not applicable.

Data Availability Statement

Data are publicly available from the indicated sources.

Conflicts of Interest

The authors declare that they have no known competing financial interests or personal relationships that could have appeared to influence the work reported in this paper.

Appendix A

Figure A1. Selected indicators for the modelling of urban SD. Sources: CEMR—The Council of European Municipalities and Regions; DAS—The Digital Agenda Scoreboard; EIS—The European Innovation Scoreboard; OECD—The Organisation for Economic Cooperation and Development; WB—The World Bank.
Mathematics 09 02888 g0a1

References

  1. Purvis, B.; Mao, Y.; Robinson, D. Three pillars of sustainability: In search of conceptual origins. Sustain. Sci. 2018, 14, 681–695. [Google Scholar] [CrossRef] [Green Version]
  2. World Commission on Environment and Development. Our Common Future. Available online: https://sustainabledevelopment.un.org/content/documents/5987our-common-future.pdf (accessed on 15 September 2021).
  3. UN General Assembly. Transforming Our World: The 2030 Agenda for Sustainable Development. Available online: https://www.un.org/ga/search/view_doc.asp?symbol=A/RES/70/1&Lang=E (accessed on 15 September 2021).
  4. Meusburger, P. The spatial concentration of knowledge. Some theoretical considerations. Erdkunde 2000, 54, 352–364. [Google Scholar] [CrossRef]
  5. Qi, H.; Liu, S.; Qi, W.; Liu, Z. Geographical Concentration of Knowledge- and Technology-Intensive Industries and City Innovation in China. Sustainability 2019, 11, 4840. [Google Scholar] [CrossRef] [Green Version]
  6. Smart City Hub. Smart Cities: Facts and Figures, Drivers and Solutions. Available online: https://smartcityhub.com/governance-economy/smart-cities-facts-and-figures-drivers-and-solutions (accessed on 15 September 2021).
  7. UN Department of Economic and Social Affairs. Sustainable Cities and Human Settlements. Available online: https://sustainabledevelopment.un.org/topics/sustainablecities (accessed on 15 September 2021).
  8. United Nations Department of Economic and Social Affairs, Division for Sustainable Development. Measuring Progress. In Prototype Global Sustainable Development Report. Available online: http://sustainabledevelopment.un.org/globalsdreport/2014 (accessed on 15 September 2021).
  9. Simon, D. Sustainable cities in sustainable societies. In Rethinking Sustainable Cities: Accessible, Green and Fair; Simon, D., Ed.; Policy Press, University of Bristol: Bristol, UK, 2016; pp. 1–10. Available online: https://library.oapen.org/handle/20.500.12657/32166 (accessed on 15 September 2021).
  10. Robinson, J.; Cole, R.J. Theoretical underpinnings of regenerative sustainability. Build. Res. Inf. 2014, 43, 133–143. [Google Scholar] [CrossRef]
  11. Sessa, K. Urban sustainability indicator systems in the EU. In State of the Art Report: Sustainability Dimension of Urban Infrastructure and Services; Bina, O., Balula, L., Ricci, A., Zhong, M.A., Eds.; URBACHINA Project Report no. D4.1; Instituto de Ciencias Sociais (ICS); Institute of Studies for the Integration of Systems (ISIS); People’s University (RENDA): Lisbon, Portugal, 2013; pp. 99–107. Available online: https://www.researchgate.net/publication/257125530_State_of_the_Art_Report_Sustainability_dimension_of_urban_infrastructure_and_services (accessed on 15 September 2021).
  12. Sharifi, A. A typology of smart city assessment tools and indicator sets. Sustain. Cities Soc. 2020, 53. [Google Scholar] [CrossRef]
  13. Yakoub, W.A.; Mahmoud, M.F.; Eleinen, O.M.A.; Elrayies, G.M. Urbanism as it should be: An overview of Environmental Urban Movements and Initiatives towards Sustainability. In Proceedings of the Second International Conference (Tenth Conference of Sustainable Environmental Development), Sharm El Sheikh, Egypt, 16–20 March 2019; Available online: https://www.researchgate.net/publication/332159023_Urbanism_as_it_should_be_An_overview_of_Environmental_Urban_Movements_and_Initiatives_towards_Sustainability (accessed on 15 September 2021).
  14. Sáez, L.; Heras-Saizarbitoria, I.; Rodríguez-Núñez, E. Sustainable city rankings, benchmarking and indexes: Looking into the black box. Sustain. Cities Soc. 2019, 53, 101938. [Google Scholar] [CrossRef]
  15. Human Development Report 2019; Technical Notes. Available online: http://hdr.undp.org/sites/default/files/hdr2019_technical_notes.pdf (accessed on 29 October 2021).
  16. Numbeo. Europe: Quality of Life Index by City 2021 Mid-Year. Available online: https://www.numbeo.com/quality-of-life/region_rankings.jsp?title=2021-mid®ion=150 (accessed on 29 October 2021).
  17. Sustainable Development Solutions Network. European Cities SDG Index; Prototype Version. Available online: https://euro-cities.sdgindex.org/#/ (accessed on 15 September 2021).
  18. Arcadis. Citizen Centric Cities; the Sustainable Cities Index. Available online: https://www.arcadis.com/media/1/D/5/%7B1D5AE7E2-A348-4B6E-B1D7-6D94FA7D7567%7DSustainable_Cities_Index_2018_Arcadis.pdf (accessed on 15 September 2021).
  19. IESE. Cities in Motion Index 2020. Available online: https://media.iese.edu/research/pdfs/ST-0542-E.pdf (accessed on 29 October 2021).
  20. Yang, Y.; Huang, P. Can an improved city development index explain real development? A case study of Xian, one of the four ancient civilizations of the world. Sci. Total. Environ. 2020, 730, 139095. [Google Scholar] [CrossRef] [PubMed]
  21. Estrada, M.A.R.; Park, D. The Application of the Gross City Development Index (GCD-Index) in Tokyo, Japan. Econ. Anal. Policy 2018, 62, 37–46. [Google Scholar] [CrossRef]
  22. UN-Habitat. City Development Index. Global Urban Indicators Database; Version 2. Available online: https://unhabitat.org/sites/default/files/download-manager-files/Global%20Urban%20Indicators%20Database.pdf (accessed on 29 October 2021).
  23. UN-Habitat. State of the World’s Cities 2012/2013; Prosperity of Cities. Available online: https://sustainabledevelopment.un.org/content/documents/745habitat.pdf (accessed on 29 October 2021).
  24. PwC. Cities of Opportunity 6. Available online: https://www.pwccn.com/en/cities-of-opportunity/cities-of-opportunity-6.pdf (accessed on 29 October 2021).
  25. The Urban Sustainability Index: A New Tool for Measuring China’s Cities. Available online: https://urbanchinainitiative.typepad.com/files/usi.pdf (accessed on 29 October 2021).
  26. UN-Habitat. Global Urban Competitiveness Report (2019–2020). Available online: https://unhabitat.org/sites/default/files/2020/10/global_urban_competitiveness_report_2019-2020_the_world_300_years_of_transformation_into_city.pdf (accessed on 29 October 2021).
  27. Sustainable Development Solutions Network. 2019 SDG Index and Dashboards Report; European Cities (Prototype Version). Available online: https://s3.amazonaws.com/sustainabledevelopment.report/2019/2019_sdg_index_euro_cities.pdf (accessed on 29 October 2021).
  28. Ichikawa, H.; Yamato, N.; Dustan, P. Competitiveness of Global Cities from the Perspective of the Global Power City Index. Procedia Eng. 2017, 198, 736–742. [Google Scholar] [CrossRef]
  29. Institute for Urban Strategies. Global Power City Index 2020. Available online: https://mori-m-foundation.or.jp/pdf/GPCI2020_summary.pdf (accessed on 29 October 2021).
  30. 2Thinknow. Innovation Cities Index 2021. Available online: https://www.innovation-cities.com/city-rankings-2021/ (accessed on 29 October 2021).
  31. Global Sherpa. Global Cities Index. Available online: http://globalsherpa.org/world-rankings/global-cities-index/ (accessed on 29 October 2021).
  32. Berube, A.; Trujillo, J.; Ran, T.; Parilla, J. Global Metro Monitor. Available online: https://www.brookings.edu/research/global-metro-monitor/ (accessed on 29 October 2021).
  33. Kearney, A.T. Global Cities index 2020. Available online: https://www.kearney.com/global-cities/2020 (accessed on 29 October 2021).
  34. Sasanpour, F. Livable city one step towards sustainable development. Contemp. Urban Aff. 2017, 1, 13–17. [Google Scholar] [CrossRef] [Green Version]
  35. The Economist Intelligence Unit. The Global Liveability Index 2021. Available online: https://pages.eiu.com/rs/753-RIQ-438/images/global-liveability-index-2021-free-report.pdf?mkt_tok=NzUzLVJJUS00MzgAAAF9j7zv1yd6L0CbgW-lymzHYZWBK0zM4dUpS7T5wmBllfMLvM9-iEEV1aEhHr6WWX1c5H_3uIjZ2JJFoUTIrR0vIh8UJxcLAQBppVaItXdYRQM (accessed on 15 September 2021).
  36. Bulkeley, H.; Marvin, S. Urban Governance and Eco-cities: Dynamics, Drivers and Emerging Lessons. In Eco-Cities: Sharing European and Asian Best Practices and Experiences; Hofmeister, W., Rueppel, P., Fook, L.L., Eds.; Konrad-Adenauer-Stiftung: Singapore; European Union Centre: Brussels, Belgium, 2014; pp. 19–34. [Google Scholar]
  37. Oxford Sustainability Index; Report 2016. Available online: https://www.oxford.gov.uk/downloads/file/2655/oxford_sustainability_index_2016 (accessed on 29 October 2021).
  38. Economist Intelligence Unit/Siemens. The European Green City Index. Available online: https://assets.new.siemens.com/siemens/assets/api/uuid:fddc99e7-5907-49aa-92c4-610c0801659e/european-green-city-index.pdf (accessed on 29 October 2021).
  39. Bee Smart City. Building the Smart City: Advancing in Six Fields of Action. Available online: https://hub.beesmart.city/en/smart-city-indicators (accessed on 15 September 2021).
  40. CITYkeys. CITYkeys Indicators for Smart City Projects and Smart Cities. Available online: https://nws.eurocities.eu/MediaShell/media/CITYkeysD14Indicatorsforsmartcityprojectsandsmartcities.pdf (accessed on 15 September 2021).
  41. IMD. IMD Smart City Index. Available online: https://www.imd.org/research-knowledge/reports/imd-smart-city-index-2019/ (accessed on 15 September 2021).
  42. Akande, A.; Cabral, P.; Gomes, P.; Casteleyn, S. The Lisbon ranking for smart sustainable cities in Europe. Sustain. Cities Soc. 2018, 44, 475–487. [Google Scholar] [CrossRef]
  43. Abu-Rayash, A.; Dincer, I. Development of integrated sustainability performance indicators for better management of smart cities. Sustain. Cities Soc. 2021, 67, 102704. [Google Scholar] [CrossRef]
  44. Antwi-Afari, P.; Owusu-Manu, D.-G.; Ng, S.T.; Asumadu, G. Modeling the smartness or smart development levels of developing countries’ cities. J. Urban Manag. 2021. [Google Scholar] [CrossRef]
  45. Molinaro, R.; Najjar, M.K.; Hammad, A.W.A.; Haddad, A.; Vazquez, E. Urban Development Index (UDI): A Comparison between the City of Rio de Janeiro and Four Other Global Cities. Sustainability 2020, 12, 823. [Google Scholar] [CrossRef] [Green Version]
  46. Yigitcanlar, T.; Lönnqvist, A. Benchmarking knowledge-based urban development performance: Results from the international comparison of Helsinki. Cities 2013, 31, 357–369. [Google Scholar] [CrossRef] [Green Version]
  47. López-Ruiz, V.-R.; Alfaro-Navarro, J.-L.; Nevado-Peña, D. Knowledge-city index construction: An intellectual capital perspective. Expert Syst. Appl. 2014, 41, 5560–5572. [Google Scholar] [CrossRef]
  48. Escolar, S.; Villanueva, F.J.; Santofimia, M.J.; Villa, D.; del Toro, X.; López, J.C. A Multiple-Attribute Decision Making-based approach for smart city rankings design. Technol. Forecast. Soc. Chang. 2018, 142, 42–55. [Google Scholar] [CrossRef]
  49. Stratigea, A.; Papadopoulou, C.-A.; Panagiotopoulou, M. Tools and Technologies for Planning the Development of Smart Cities. J. Urban Technol. 2015, 22, 43–62. [Google Scholar] [CrossRef]
  50. Bojković, N.; Petrović, M.; Parezanović, T. Towards indicators outlining prospects to reduce car use with an application to European cities. Ecol. Indic. 2018, 84, 172–182. [Google Scholar] [CrossRef]
  51. Sheng, N.; Tang, U.W. The first official city ranking by air quality in China—A review and analysis. Cities 2016, 51, 139–149. [Google Scholar] [CrossRef]
  52. Altamirano-Avila, A.; Martínez, M. Urban sustainability assessment of five Latin American cities by using SDEWES index. J. Clean. Prod. 2020, 287, 125495. [Google Scholar] [CrossRef]
  53. International Centre for Sustainable Development of Energy, Water and Environment Issues. SDEWES Index. Available online: https://www.sdewes.org/sdewes_index.php (accessed on 29 October 2021).
  54. Nylund, P.A.; Brem, A.; Agarwal, N. Innovation ecosystems for meeting sustainable development goals: The evolving roles of multinational enterprises. J. Clean. Prod. 2020, 281, 125329. [Google Scholar] [CrossRef]
  55. Dwivedi, A.; Agrawal, D.; Jha, A.; Gastaldi, M.; Paul, S.K.; D’Adamo, I. Addressing the Challenges to Sustainable Initiatives in Value Chain Flexibility: Implications for Sustainable Development Goals. Glob. J. Flex. Syst. Manag. 2021, 1–19. [Google Scholar] [CrossRef]
  56. Li, X.; Fong, P.S.; Dai, S.; Li, Y. Towards sustainable smart cities: An empirical comparative assessment and development pattern optimization in China. J. Clean. Prod. 2019, 215, 730–743. [Google Scholar] [CrossRef]
  57. Chen, Y.; Zhang, D. Evaluation and driving factors of city sustainability in Northeast China: An analysis based on interaction among multiple indicators. Sustain. Cities Soc. 2021, 67, 102721. [Google Scholar] [CrossRef]
  58. Mokarrari, K.R.; Torabi, S.A. Ranking cities based on their smartness level using MADM methods. Sustain. Cities Soc. 2021, 72, 103030. [Google Scholar] [CrossRef]
  59. Avetisyan, S. Who Cares about City Development: Determinants of City Development. Available online: https://papers.ssrn.com/sol3/papers.cfm?abstract_id=3284707 (accessed on 29 October 2021).
  60. Karnitis, G.; Karnitis, E. Sustainable growth of EU economies and Baltic context: Characteristics and modelling. J. Int. Stud. 2017, 10, 209–224. [Google Scholar] [CrossRef]
  61. Karnitis, G.; Virtmanis, A.; Karnitis, E. Key Drivers of Digitalization; EU Context and Baltic Case. Balt. J. Mod. Comput. 2019, 7. [Google Scholar] [CrossRef]
  62. Moriarty, J.P. A theory of benchmarking. Benchmarking: Int. J. 2011, 18, 588–611. [Google Scholar] [CrossRef] [Green Version]
  63. Karnitis, E.; Bicevskis, J.; Karnitis, G. Measuring the Implementation of the Agenda 2030 Vision in Its Comprehensive Sense: Methodology and Tool. Energies 2021, 14, 856. [Google Scholar] [CrossRef]
  64. Karnitis, E.; Pukis, M.; Bicevskis, J.; Karnitis, G.; Turnis, R.; Bicevska, M. Action Lines of Municipalities to Improve the Sustainable Development of Small and Medium-sized Cities in the EU. J. Int. Sci. Publ. Econ. Bus. 2021, 15, 49–60. Available online: https://www.scientific-publications.net/en/article/1002229/ (accessed on 13 October 2021).
  65. European Commission. Recovery and Resilience Facility. Available online: https://ec.europa.eu/info/business-economy-euro/recovery-coronavirus/recovery-and-resilience-facility_en (accessed on 13 October 2021).
Figure 1. Creation of SD model; methodology. Developed by authors.
Mathematics 09 02888 g001
Figure 2. Linear modelling process. Developed by authors.
Mathematics 09 02888 g002
Figure 3. Regularity of linear model AHDIm1 vs. AHDI. Developed by authors.
Mathematics 09 02888 g003
Figure 4. Residual characteristics of linear model (printout). Developed by authors.
Mathematics 09 02888 g004
Figure 5. (a) Regularity G6.2. vs. AHDI and (b) regularity NG6.2 vs. AHDI. Developed by authors.
Mathematics 09 02888 g005
Figure 6. Regularity of the final non-linear model AHDIm vs. AHDI. Developed by authors.
Mathematics 09 02888 g006
Figure 7. Residual characteristics of non-linear model (printout). Developed by authors.
Mathematics 09 02888 g007
Figure 8. CSDI for cities of Latvia. Developed by authors.
Mathematics 09 02888 g008
Table 1. Key performance indicators.
NoKey Performance Indicators
G3.1Share of people with good or very good perceived health, % of population aged 16 or over
G6.2Population not having indoor flushing toilet for the sole use, % of population
G7.2Share of population unable to keep home adequately warm by poverty status, %
G9.2Percentage of enterprises who have ERP software package to share information between different functional areas (10+ employees)
G12.1Recycling rate of municipal waste, % of generated
G16.2Perceived independence of the justice system, % of population perceived as very good or fairly good
Table 2. Numerical characteristics of linear model AHDIm1 and non-linear model AHDIm.
ModelR2R2adjp-ValueMax
Residual
Residual
Standard Error
Number of Residuals
>2.5%1.5–2.5%
AHDIm1 (3)0.94210.92472.502 × 10−110.02588940.0147228
AHDIm (8)0.96380.9622<2.2 × 10−160.01970300.0104203
Publisher’s Note: MDPI stays neutral with regard to jurisdictional claims in published maps and institutional affiliations.

