Article

Period of Arrhythmia Anchored around an Infarction Scar in an Anatomical Model of the Human Ventricles

by
Daria Mangileva
1,2,
Pavel Konovalov
1,
Arsenii Dokuchaev
1,
Olga Solovyova
1,2,* and
Alexander V. Panfilov
2,3,4,*
1
Institute of Immunology and Physiology, Ural Branch of Russian Academy of Sciences, 620049 Ekaterinburg, Russia
2
Laboratory of Computational Biology and Medicine, Ural Federal University, 620075 Ekaterinburg, Russia
3
Department of Physics and Astronomy, Ghent University, 9000 Ghent, Belgium
4
World-Class Research Center ‘Digital Biodesign and Personalized Healthcare’, Sechenov University, 119146 Moscow, Russia
*
Authors to whom correspondence should be addressed.
Mathematics 2021, 9(22), 2911; https://doi.org/10.3390/math9222911
Submission received: 6 October 2021 / Revised: 10 November 2021 / Accepted: 10 November 2021 / Published: 15 November 2021
(This article belongs to the Special Issue Mathematical Modelling in Biomedicine II)

Abstract

:
Rotating nonlinear waves of excitation in the heart cause dangerous cardiac arrhythmias. Frequently, ventricular arrhythmias occur as a result of myocardial infarction and are associated with rotation of the waves around a post-infarction scar. In this paper, we perform a detailed in silico analysis of scroll waves in an anatomical model of the human ventricles with a generic model of the infarction scar surrounded by the gray zone with modified properties of the myocardial tissue. Our model includes a realistic description of the heart shape, anisotropy of cardiac tissue and a detailed description of the electrical activity in human ventricular cells by a TP06 ionic model. We vary the size of the scar and gray zone and analyze the dependence of the rotation period on the injury dimensions. Two main regimes of wave scrolling are observed: the scar rotation, when the wave rotates around the scar, and the gray zone rotation, when the wave rotates around the boundary of the gray zone and normal tissue. The transition from the gray zone to the scar rotation occurs for the width of gray zone above 10–20 mm, depending on the perimeter of the scar. We compare our results with simulations in 2D and show that 3D anisotropy reduces the period of rotation. We finally use a model with a realistic shape of the scar and show that our approach predicts correctly the period of the arrhythmia.

1. Introduction

Rotational activity of excitation waves in the heart is the most important mechanism of the dangerous cardiac arrhythmias. Such rotational activity, which in cardiology is called reentry, can be of two main types: anatomical and functional reentry. Anatomical reentry is a rotation of a wave around a compact region in the heart, which may be an inexcitable obstacle (scar), a large blood vessel or another anatomical structure. Functional reentry is a rotation around a functional obstacle which is created by the wave itself and is not associated with tissue heterogeneity or anatomical structures.
From mathematical point of view, excitation waves in the heart belong to a large class of non-linear waves in the reaction–diffusion equations, where anatomical reentry is the rotation of wave around an obstacle and functional reentry is normally referred to as a rotating spiral (or scroll) wave. In mathematical biology, anatomical reentry in most of the cases was considered in generic 2D formulations [1,2,3,4,5,6]. These studies revealed important characteristics of the waves, such as non-monotonic dependency of the period of rotation on obstacle size [1], dynamical instabilities [6], anchoring [2], and transitions from anatomical to functional reentry [1,3]. However, application of these results in cardiology is not straightforward. This is because real anatomical obstacles in the heart have a complex structure [7]. For example, in atria, obstacles such as cardiac valves and pulmonary veins are surrounded by cardiac fibers with a complex anisotropy [8]. In the ventricles of the heart, the situation is even more complicated, as wave rotation there is three-dimensional. In addition, in most of the cases obstacles related to ventricular arrhythmias occur as a result of myocardial infarction. In that case such obstacles contain a compact scar which is fully inexcitable region, surrounded by so called gray zone—a region where properties of cardiac tissue are different from the properties of the normal myocardium [9].
In current literature, rotational activity in myocardium with post-infarction injury is mainly studied using bio-engineering approach where patient specific models of the heart are created, and researchers try to mimic clinical procedures of induction of arrhythmias and their possible management by ablation [10,11,12]. There are also studies [13] which address the role of infarction scar dimension in the repolarization properties and contribution of the anisotropic structure of the border zone around the scar in initiation of arrhythmia. Another paper [14] studies the role of dynamical instabilities in the gray zone as the triggers of arrhythmia. All these studies mainly address a very important question of initiation of arrhythmias. However, they do not analyze in a consistent way dynamic properties of arrhythmia evaluation in time.
We have recently performed an extensive study of the dynamics of wave rotating around an obstacle surrounded by heterogeneous tissue in 2D, which is a generic model of the myocardial infarction scar [15]. We found how the period of rotation depends on the size of the scar and gray zone and revealed two possible regimes of wave rotation either around the scar: scar rotation, or around the gray zone: gray zone rotation. We also identified the factors which determine the transition between the regimes.
The main aim of this paper was to extend this study to a realistic anatomical model of the human ventricles with a post-infarction injury of various size. We created more than 60 models in which, similar to the work in [15], we varied the size of the scar and gray zone, found periods of the scroll waves, and classified the rotation regimes. Compared to the paper in [15], these models have a realistic three-dimensional shape of the ventricles and account for anisotropy of cardiac tissue, which substantially affects the velocity of wave propagation. We found in the anatomical models both a scar rotation regime and also the gray zone rotation regime. We estimated characteristic sizes of the obstacle and gray zone for which change in the rotation regime occurs. We found that dependency of the period of the arrhythmia on the geometry of the scar can be qualitatively understood from the results obtained in [15]. However, quantitative values are substantially affected by the anisotropy and 3D nature of the model. We quantified these effects.
Finally, we performed simulations in a patient-specific model with a post-infarction scar and found that dependencies in our study quantitatively correctly predict the period of arrhythmia in that case.

2. Materials and Methods

2.1. Model of the Ventricular Geometry

In this study, we used an anatomical bi-ventricular model derived from a four-chamber heart model from an available dataset [16] with Creative Commons Attribution 4.0 International license. The geometric model contains information on the myocardial fiber field and universal ventricular coordinates [17] assigned. To form the bi-ventricular model, we removed (cut off with a plane) atrial geometries from the original model. The size of the resulting finite-difference grid was 43 × 65 × 55 mm 3 . Figure 1 shows the final ventricular geometry used further for electrophysiological simulations. To convert a finite-element tetrahedral model into a finite-difference hexagonal model, a finite-element mesh was overlaid with a 3D regular Cartesian grid. For each tetrahedron of the finite-element model, a sphere which circumscribed this element was constructed and all voxels of the finite-difference grid within this sphere were marked as myocardium.

2.2. Infarction Scar Construction

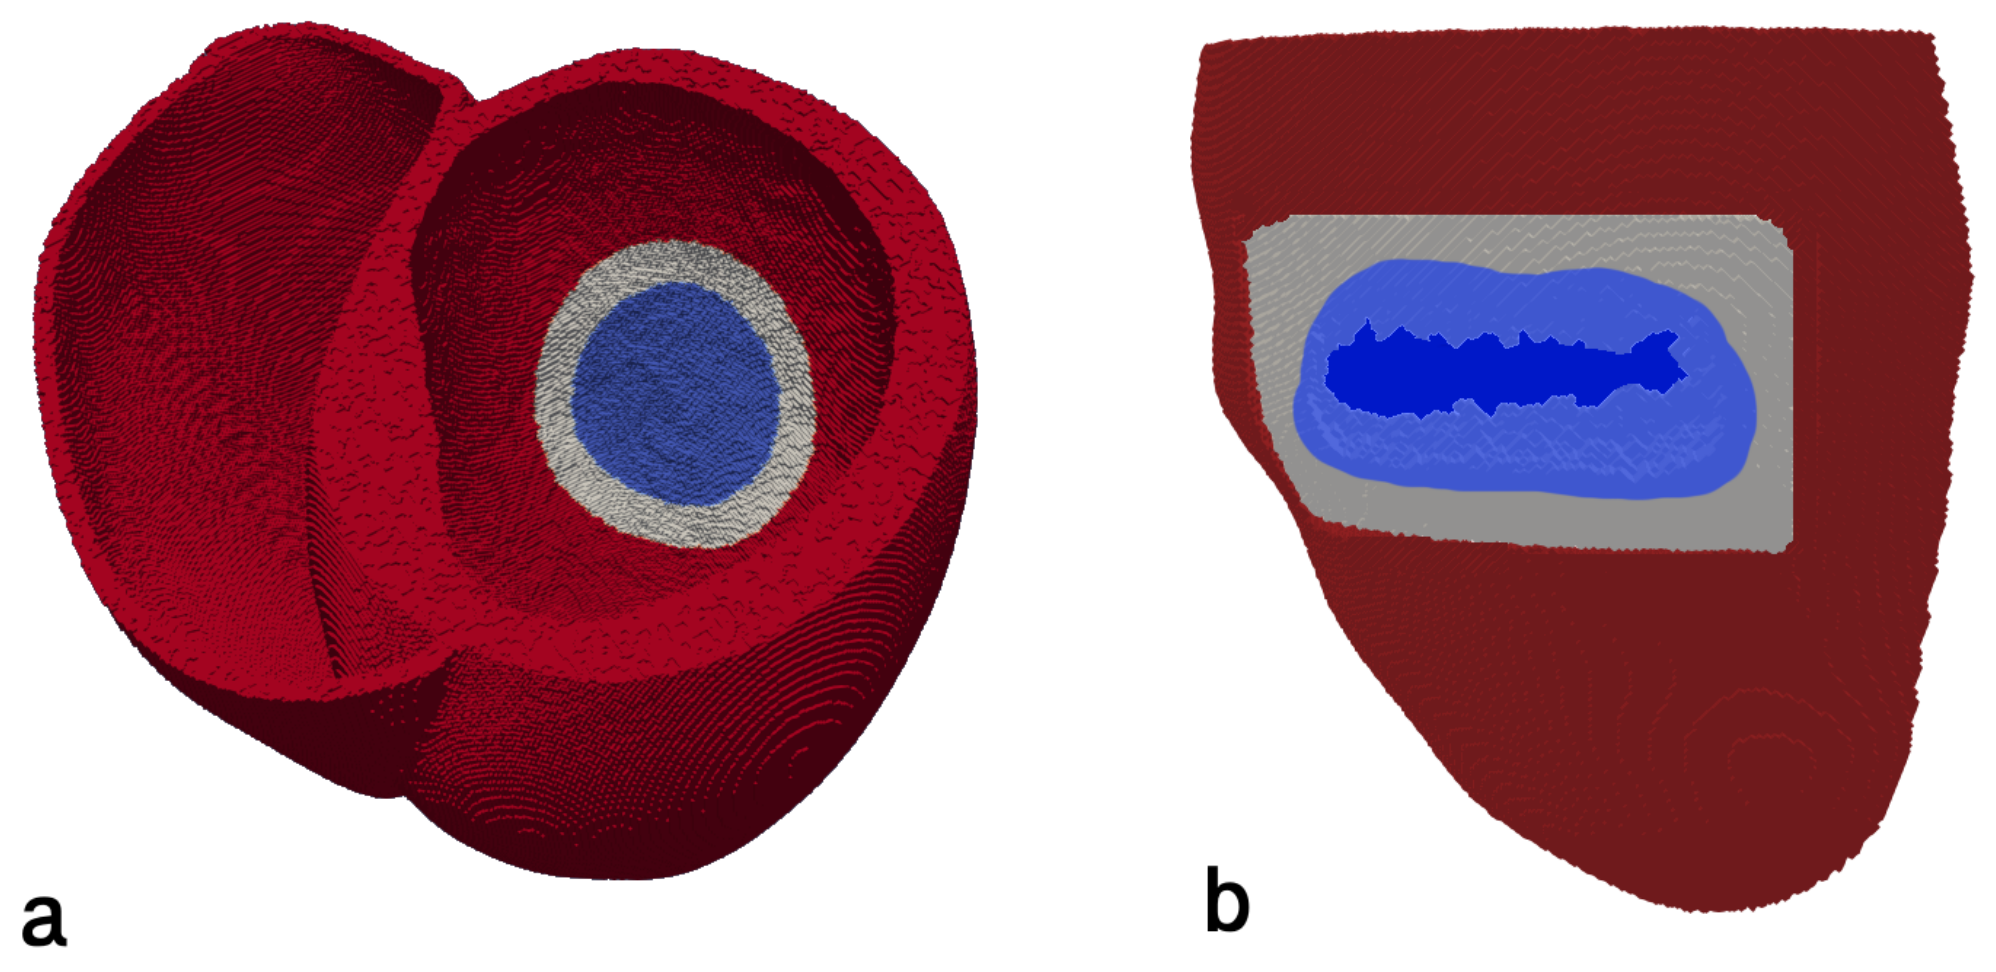
Post-infarction scars of various sizes and corresponding border zones around the scar were incorporated into a personalized geometric model of heart ventricles. We simulated a transmural post-infarction scar of an idealized circular shape (Figure 2a). The radius of the scar vary from 14 to 34 mm, ranging from 2.5% to 15% of the total myocardium volume of the left ventricle with a step of 2.5% of myocardial volume. Corresponding perimeters of the infarct scar on epicardium varied from 89 to 214 mm. The volume of the border zone range from 2.5% to 25% of the total myocardium volume of the left ventricle with a step of 2.5%. The corresponding width of the border zone varies between 3 and 30 mm for the smallest scar radius of 14 mm, and between 1 and 19 mm for the largest scar radius of 34 mm. Figure 2a shows an example of a scar with the border zone.
We have also generated a model with realistic shape of post-infarction scar (Figure 2b) based on clinical CT recordings from an open dataset [18] with ODC-BY 1.0 license. Three samples of the gray zone with various widths on the epicardial surface were built around the scar (see an example in Figure 2b).

2.3. Electrophysiological Model of Healthy Myocardium and Gray Zone

To describe propagation of the excitation wave in the myocardial tissue we used a 3-dimensional monodomain formulation [4]:
C m V t = D V I i o n ,
where V is the transmembrane potential; D is a electro-diffusion tensor for anisotropic tissue; I i o n is a sum of all transmembrane ionic currents, described in a biophysically detailed cellular ionic TP06 model [19] of action potential in human ventricular cardiomyoytes:
I i o n = I N a + I K 1 + I t o + I K r + I K s + I C a L + I N a C a + I N a K + I p C a + I p K + I b N a + I b C a ,
where I N a is the N a + current, I K 1 is the inward rectifier K + current, I t o is the transient outward current, I K r is the delayed rectifier current, I K s is the slow delayed rectifier current, I C a L is the L-type C a 2 + current, I N a C a is the N a + / C a 2 + exchanger current, I N a K is the N a + / K + ATPhase current, I p C a and I p K are plateau C a 2 + and K + currents, and I b N a and I b C a are background N a + and C a 2 + currents. Specific details about each of those currents can be found in the original paper [19]. In general, equations for each current normally have the following form:
I = G g α g β ( V m V ) ,
where
g i t = g i ( V m ) g i τ i ( V m ) , i = , ,
Here, a hypothetical current I has a maximal conductivity of G = const, and its value is calculated from expression (3). The current is zero at V m = V , where V is the so-called Nernst potential, which can be easily computed from concentration of specific ions outside and inside the cardiac cell. The time dynamics of this current is governed by two gating variables g , g to the power α , β . The variables g , g approach their voltage-dependent steady state values g i ( V m ) with characteristic time τ i ( V m ) . Thus integration of model Equations (1)–(4)) involves a solution of a parabolic partial differential Equation (1) and of many ordinary differential Equations (3) and (4). For our model the system (1)–(4) has 18 state variables.
An important part of the model is the electro-diffusion tensor D. We considered myocardial tissue as an anisotropic medium, in which the electro-diffusion tensor D is orthogonal 3 × 3 matrix with eigen values D f i b e r and D t r a n s v e r s e which account for electrical coupling along the myocardial fibers and in the orthogonal directions. In our simulations D f i b e r = 0.154 mm 2 /ms and ratio D f i b e r / D t r a n s v e r s e of 4:1 which is within the range of experimentally recorded ratios [20]. It gives a conduction velocity of 0.7 mm/ms along myocardial fibers and 0.28 mm/ms in the transverse direction, which corresponds to anisotropy of the human heart.
To find electro-diffusion tensor D for anatomical models, we used the following methodology. Electro-diffusion tensor at each point was calculated from fiber orientation filed at this point using the following equation [13]:
D i , j = ( D f i b e r D t r a n s v e r s e ) a i a j + D t r a n s v e r s e δ i j
where a i is a unit vector in the direction of the myocardial fibers, δ i j is a the Kronecker delta, and D f i b e r and D t r a n s v e r s e are the diffusion coefficients along and across the fibers, defined earlier.
Fiber orientations were a part of the open datasets [18]. Three fiber orientations at each node were determined using an efficient rule-based approach developed in [21]. Fiber orientations were determined from the individual geometry of the ventricles. For that, a Laplace–Dirichlet method was applied [21,22,23]. The method involves computing the solution of Laplace’s equation at which Dirichlet boundary conditions at corresponding points or surfaces were imposed. Based on that potential, a smooth coordinate system inside the heart is constructed to define the transmural and the orthogonal (apicobasal) directions inside the geometry domain. The fiber orientation was calculated depending on the transmural depth of the given point between the endocardial and epicardial surfaces normalized from 0 to 1. The main idea here is that there is a rotational anisotropy in the heart, i.e., the fiber angle smoothly changes from epicardial to endocardial surface [24]. Such rotation was introduced and the method was validated on experimentally measured data in [21]. All additional details on the method can be also found in [21]. The original finite element geometry from publicly available dataset [16] contains about 2 · 10 6 tetrahedrons, which is comparable to the number of elements in computational finite-difference heart domain. For the transfer of fiber orientation vectors to the computational geometry, we used nearest neighbor interpolation method, which reassigned fibers from centers of individual tetrahedrons of initial mesh to each voxel of computational finite difference model.
Initial conditions for voltage were set as the rest potential V = V r e s t for the cardiac tissue and steady state values for gating variables. Boundary conditions were formulated as the no flux through the boundaries:
n D V = 0 ,
where n is the normal to the boundary.
For each type of ventricular myocardial tissue (healthy myocardium, post-infarction scar, and gray zone), its own electrophysiological properties were set.
Baseline parameter values of TP06 [19] ionic model were used to simulate a healthy myocardium. Post-infarction scar elements were simulated as non-conducting inexcitable obstacles and considered as internal boundaries (no flux) for the myocardial elements. To simulate the electrical activity of the border zone, the cellular model was modified in accordance with [25]. The maximal conductances of the several ionic channels were reduced, particularly, INa by 15%, ICaL by 20%, IKr by 30%, IKs by 80%, IK1 by 70 %, and Ito by 90%.

2.4. Spiral Wave Initiation

A standard S1-S2 protocol [26] was implemented (Figure 3) for ventricular stimulation. The S2 stimulus was applied 465 ms after the S1 stimulus.

Numerical Methods

To solve the monodomain model we used a finite-difference method with 18-point stencil discretization scheme as described in [26] with 0.45 mm for the spatial step and 0.02 ms for the time step. Our estimates on 2D grids showed that such spatial discretization is sufficient to reproduce all important rotation regimes (Table S1 and Figure S1 in the Supplementary Materials). The Laplacian was evaluated at each point ( i , j , k ) in the human ventricular geometry:
( i , j , k ) = i ( D i j V m X j )
It was descritized by finite difference method which can be represented by the following equation:
L ( i , j , k ) = w 1 V m ( l )
where L is an index running over the 18 neighbors of the point ( i , j , k ) and the point itself, and w l are the weights defined for each neighboring point l which defines contribution of voltage at that point to to the Laplacian. The method for weights calculation is described in detail in [27]. Next, Equation (1) was integrated using explicit numerical scheme:
V n ( i , j , k ) = V n 1 ( i , j , k ) + h t L n 1 ( i , j , k ) / C m h t I i o n n 1 ( i , j , k ) / C m ,
where h t is the time integration step, V n ( i , j , k ) and V n 1 ( i , j , k ) are the values of the variable V at grid point ( i , j , k ) at time moments n and n 1 , and L n 1 ( i , j , k ) and I i o n n 1 ( i , j , k ) are values of the Laplacian and ion current at node ( i , j , k ) at moment n 1 .
For the solution of ordinary differential equations for gating variables, the Rush–Larsen algorithm was used [28]. For gating variable g described by Equation (4) it is written as
g n ( i , j , k ) = g + ( g n 1 ( i , j , k ) g ) e h t / τ g
where g denotes the asymptotic value for the variable g, and τ g is the characteristic time-constant for the evolution of this variable, h t is the time step, g n 1 and g n are the values of g at time moments n 1 and n. All calculations were performed using an original software developed in [27]. Simulations were performed on clusters “URAN” (N.N. Krasovskii Institute of Mathematics and Mechanics of the Ural Branch of the Russian Academy of Sciences) and “IIP” (Institute of Immunology and Physiology of the Ural Branch of the Russian Academy of Sciences, Ekaterinburg). The program uses CUDA for GPU parallelization and is compiled with a Nvidia C Compiler “nvcc”. Computational nodes have graphical cards Tesla K40m0. The software described in more detail in study by De Coster [27].

3. Results

We studied ventricular excitation patterns for scroll waves rotating around a post-infarction scar. Figure 3 shows an example of such excitation wave. In most of the cases, we observed stationary rotation with a constant period. We studied how this period depends on the perimeter of the compact infarction scar ( P i z ) and the width of the gray zone ( w g z ). We also compared our results with 2D simulations from our recent paper [15].

3.1. Rotation Period

Figure 4a,b shows the dependency of the rotation period on the width of the gray zone w g z for six values of the perimeter of the infarction scar: P i z = 89 mm (2.5% of the left ventricular myocardium volume), 114 mm (5%), 139 mm (7.5%), 162 mm (10%), 198 mm (12.5%), and 214 mm (15%). We see that all curves for small w g z are almost linear monotonically increasing functions. For larger w g z , we see transition to horizontal dependencies with the higher asymptotic value for the larger scar perimeter. Note that in Figure 4a,b, and Figure 5, and subsequent similar figures, we also show different rotation regimes by markers, and it will be discussed in the next subsection.
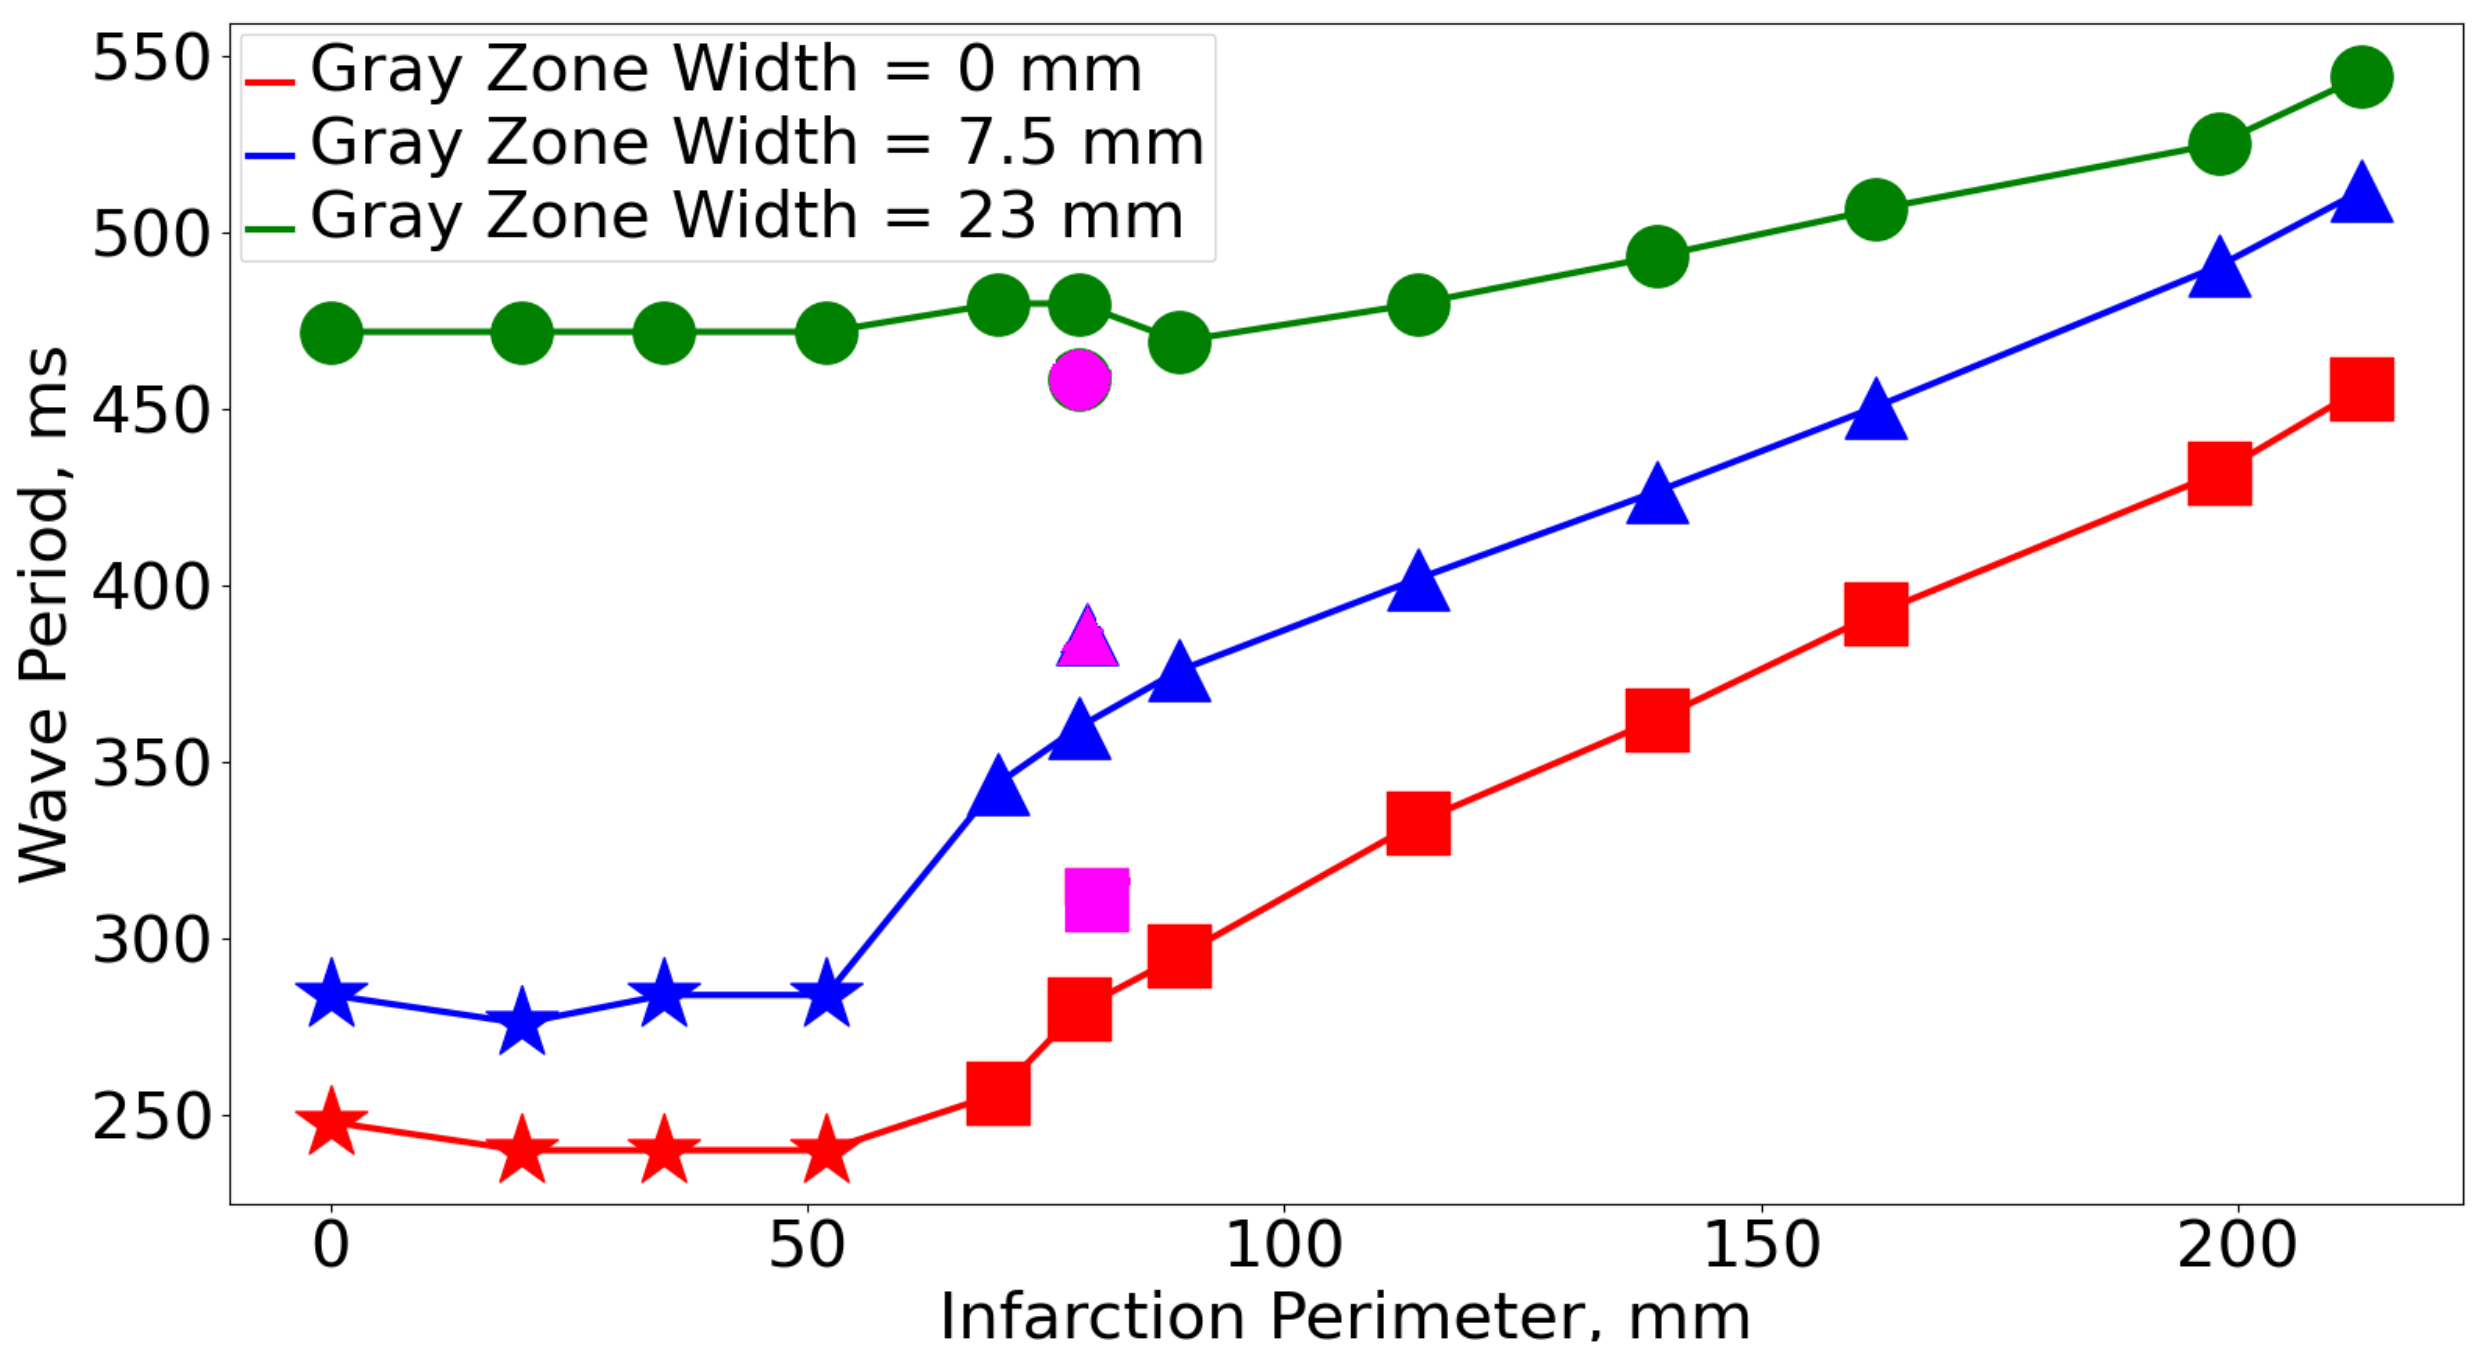
Figure 5 shows dependency of the wave period on the perimeter of the infarction scar P i z for three widths of the gray zone w g z = 0, 7.5, and 23 mm. All curves show similar behaviour. For small size of the infarction scar the dependency is almost horizontal. When the size of the scar increases, we see transition to almost linear dependency. We also observe that for largest width of the gray zone the slope of this linear dependency is smallest: for w g z = 23 mm the slope of the linear part is 3.66, while for w g z = 0, and 7.5 mm the slopes are 7.33 and 7.92, correspondingly.
We also performed simulations for a realistic shape of the infarction scar (perimeter is equal to 72 mm, Figure 2b) for three values of the gray zone width: 0, 7.5, and 23 mm. The periods of wave rotation are shown as pink points in Figure 5. We see that simulations for the realistic shape of the scar are close to the simulations with idealized circular scar shape.
Note that qualitatively all dependencies are similar to those found in 2D tissue models in [15]. We will further compare them in the subsequent sections.
The results of all numerical experiments are presented in Table 1.

3.2. Wave Rotation Regimes

In [15], we classified the wave patterns into two main rotation regimes depending on the scar perimeter and gray zone width: the scar rotation, where the wave rotation edge follows the boundary of the scar, and the gray zone rotation, where the wave rotation edge follows the boundary of the gray zone and normal tissue. In these regimes the period is determined by the perimeter of the scar or the gray zone, correspondingly. Additional regime of functional rotation reported in [15] occurs where the period of rotation does not depend on the size of the scar. It was observed only for small scars and is a transition from anatomical to functional reentry. Let us use this classification to analyze the ventricular excitation patterns which we observed in the 3D anatomical model.
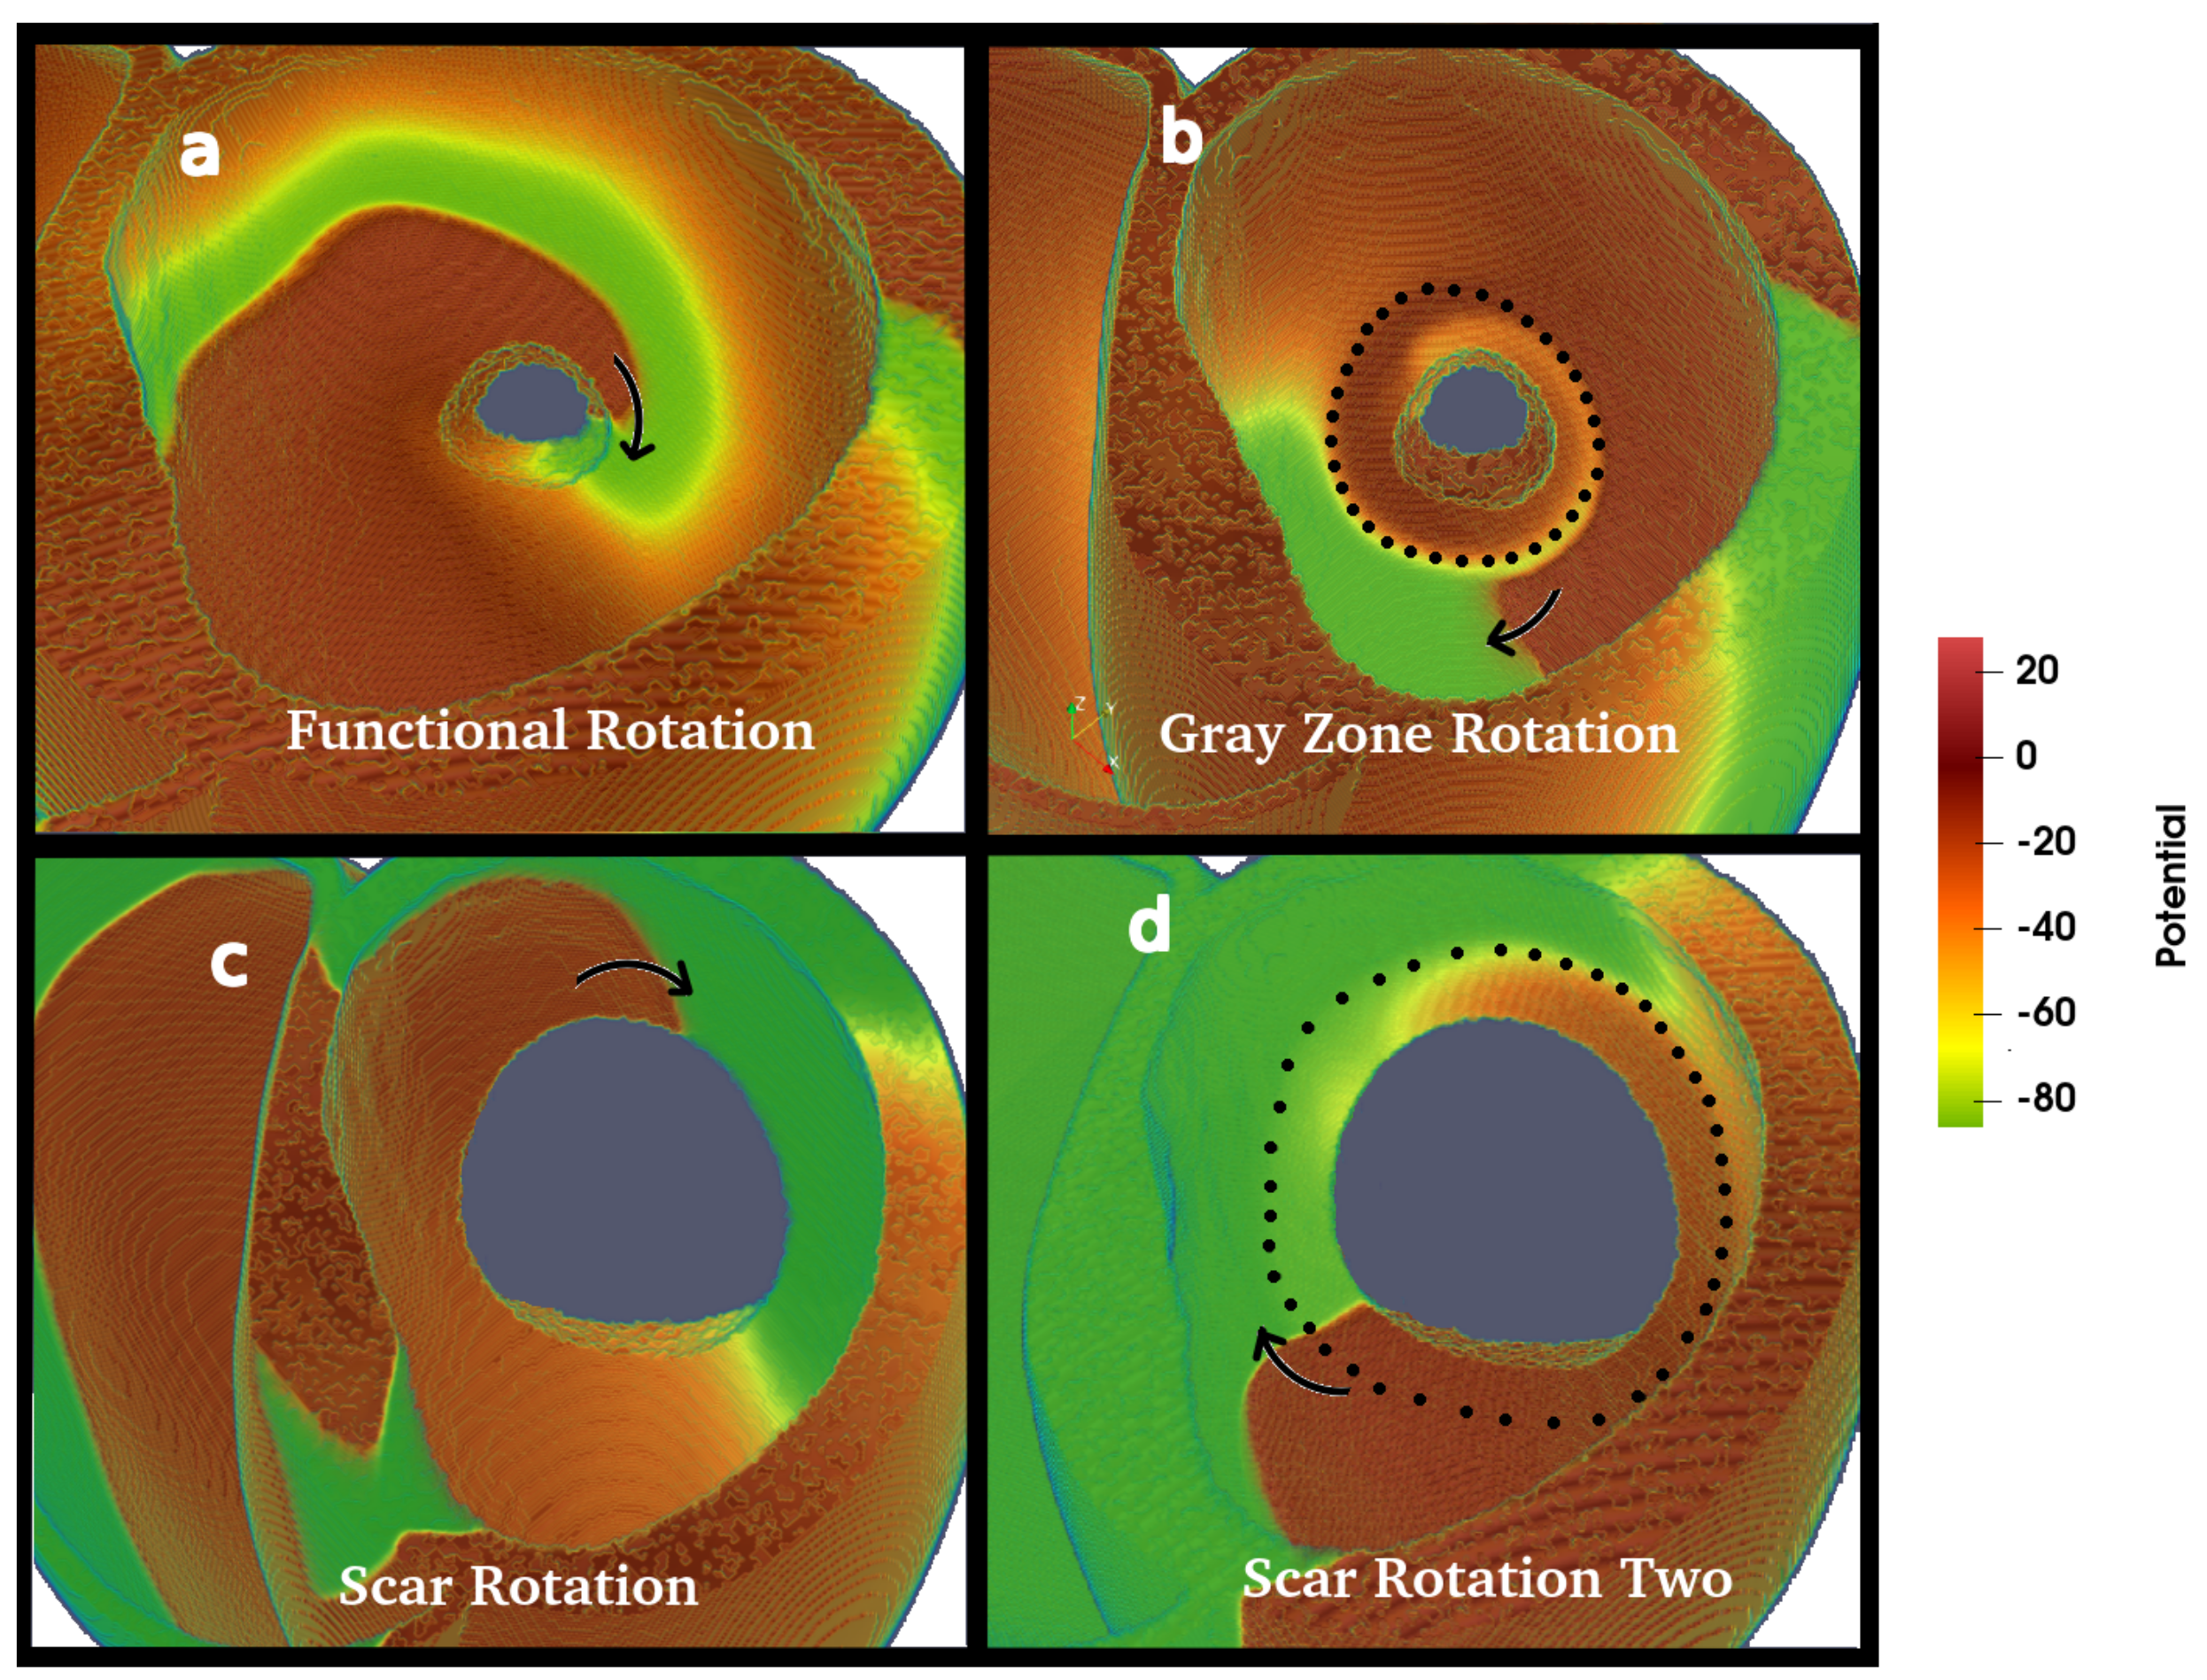
In Figure 5, for small scars we see a flat dependency of the period on the scar perimeter for each fixed gray zone width. For all curves it approximately occurs for the scar perimeters P i z =< 50 mm. Here, the waves rotate in the functional rotation regime. An example of such wave pattern is shown in Figure 6a. We see the rotation effectively occurs around a circle with the radius larger than the size of the scar and thus size of the scar does not affect the rotation period. Similar wave behaviour in the functional rotation regime at small scar sizes we observed in 2D simulations [15].
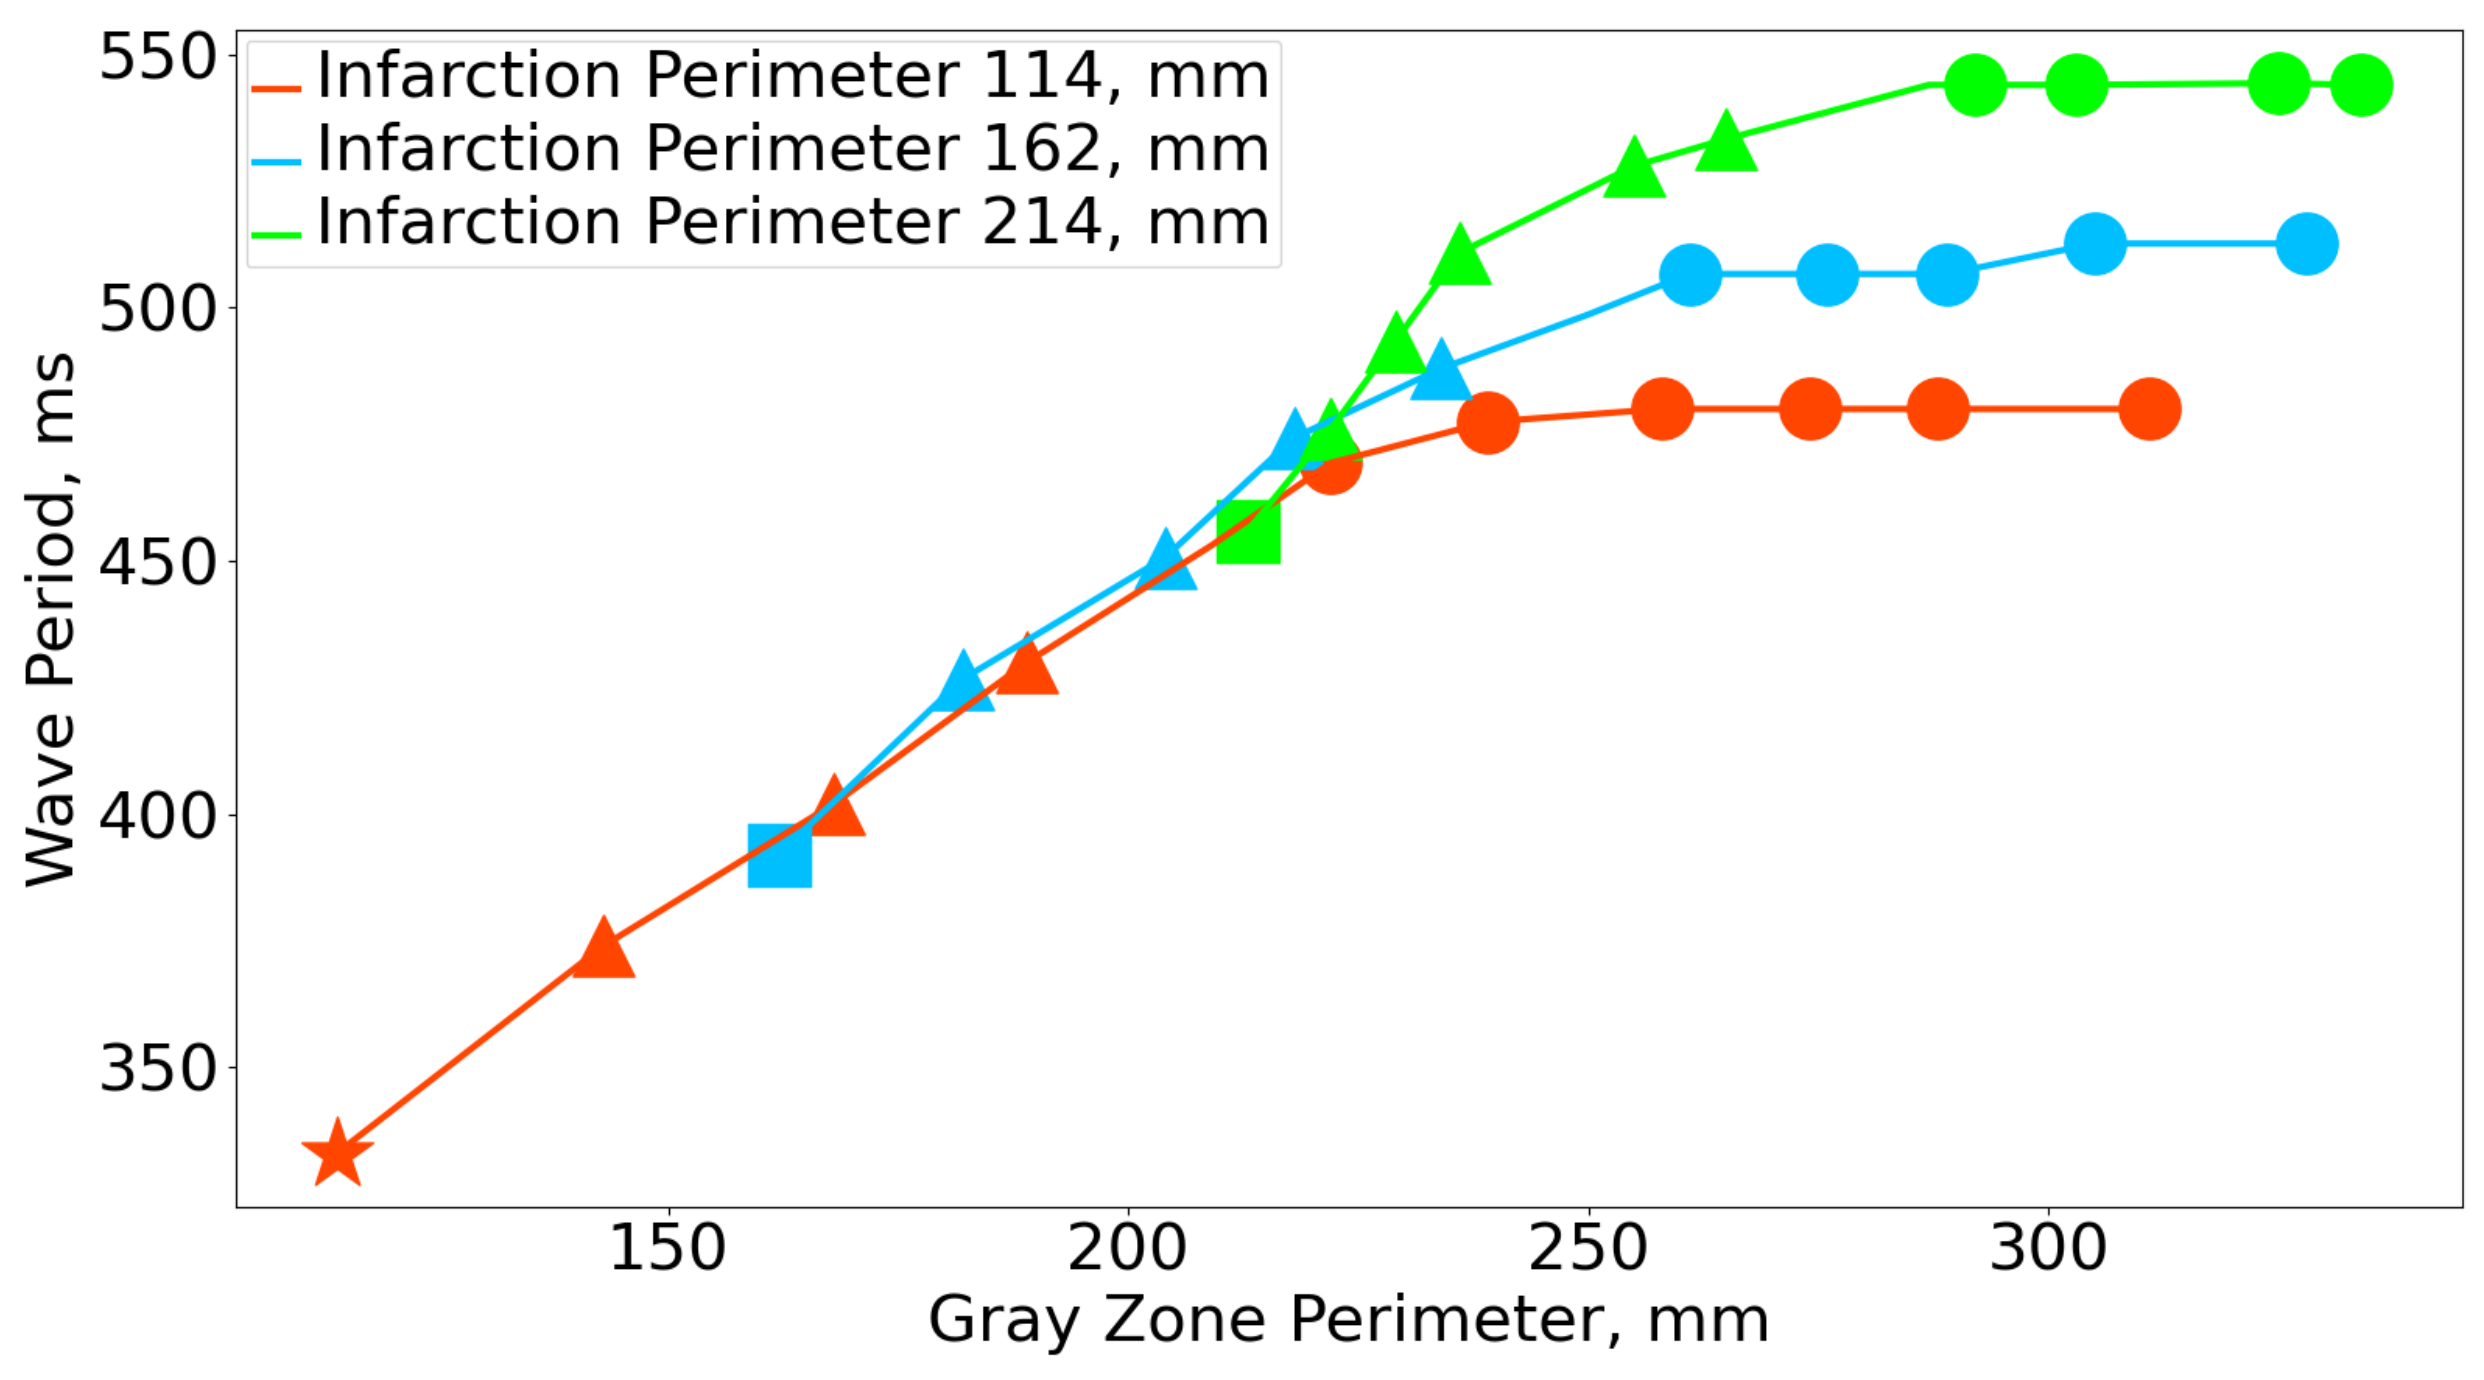
Another important regime we found in the ventricular model is gray zone rotation. Figure 6b shows an example of such wave pattern. We clearly see that the wave rotates around the outer border of the gray zone. One of the hallmarks of gray zone rotation is that the period depends only on the perimeter of the gray zone, independently on the size of the compact scar inside it. Thus, if we plot dependencies of the wave period on the perimeter of the gray zone for different values of P i z all curves should be close to each other. Indeed, we see (Figure 7) that all curves, corresponding to different perimeters of the infarction scar, almost perfectly match each other in the range of the perimeter of gray zone P G Z < 220 mm, thus we expect the gray zone rotation regime in such parameter range.
For large gray zone width w G Z , in the anatomical ventricular model we observe wave rotation around the scar inside the gray zone named as scar rotation two regime. We illustrate this wave pattern in Figure 6d. It is characterized by a flat dependency of the period on the size of the gray zone (Figure 4a,b). It occurred for w G Z > 10 mm for the largest scar perimeter of 214 mm and for w G Z > 18 mm for the smallest scar perimeter of 114 mm. Thus, the transition to the scar rotation two regime occurs at more narrow border zone for a larger scar. These observations are qualitatively in line with 2D results reported in [15].

3.3. Comparison with 2D

Now, let us compare the dependencies found in our anatomical model with those in 2D case and quantify 3D effects. For that, we performed additional 2D simulations in which we studied rotation around the scar of the same perimeter of P I Z = 162 mm as one used in Figure 4a (the blue line). We implemented two cases of 2D model simulations: isotropic cardiac tissue (the diffusion coefficients ratio 1:1) and anisotropic tissue with the anisotropy ratio of 4:1; the latter is as that in our anatomical model. In the anisotropic case, we considered parallel fibers directed along the horizontal axis of the tissue sheet. The results derived from 3D and 2D simulations at various gray zone widths are shown in Figure 8. We see that the all curves show qualitatively similar initial linear growth and further saturation of the period with gray zone width increase. However, quantitatively, the dependency in 3D (the blue curve) lies in between the curves for 2D isotropic and anisotropic cases. Moreover, we clearly see that the 3D case is closer to the 2D isotropic case than the 2D anisotropic case. To quantify it, we calculated the ratio of periods in 2D to that in 3D for both 2D cases. We see that if we compare 2D isotropic case with 3D then the ratio of periods is around 0.86 (−14% relative difference) for the gray zone width of 7.5 mm and 0.94 (−6%) for gray zone of 18 mm. If we compare the periods in 2D anisotropic model against the 3D, we see that here the period ratio is larger: 1.35 (+35%) for the gray zone of 7.5 mm, and 1.13 (+13%) for gray zone of 18 mm.
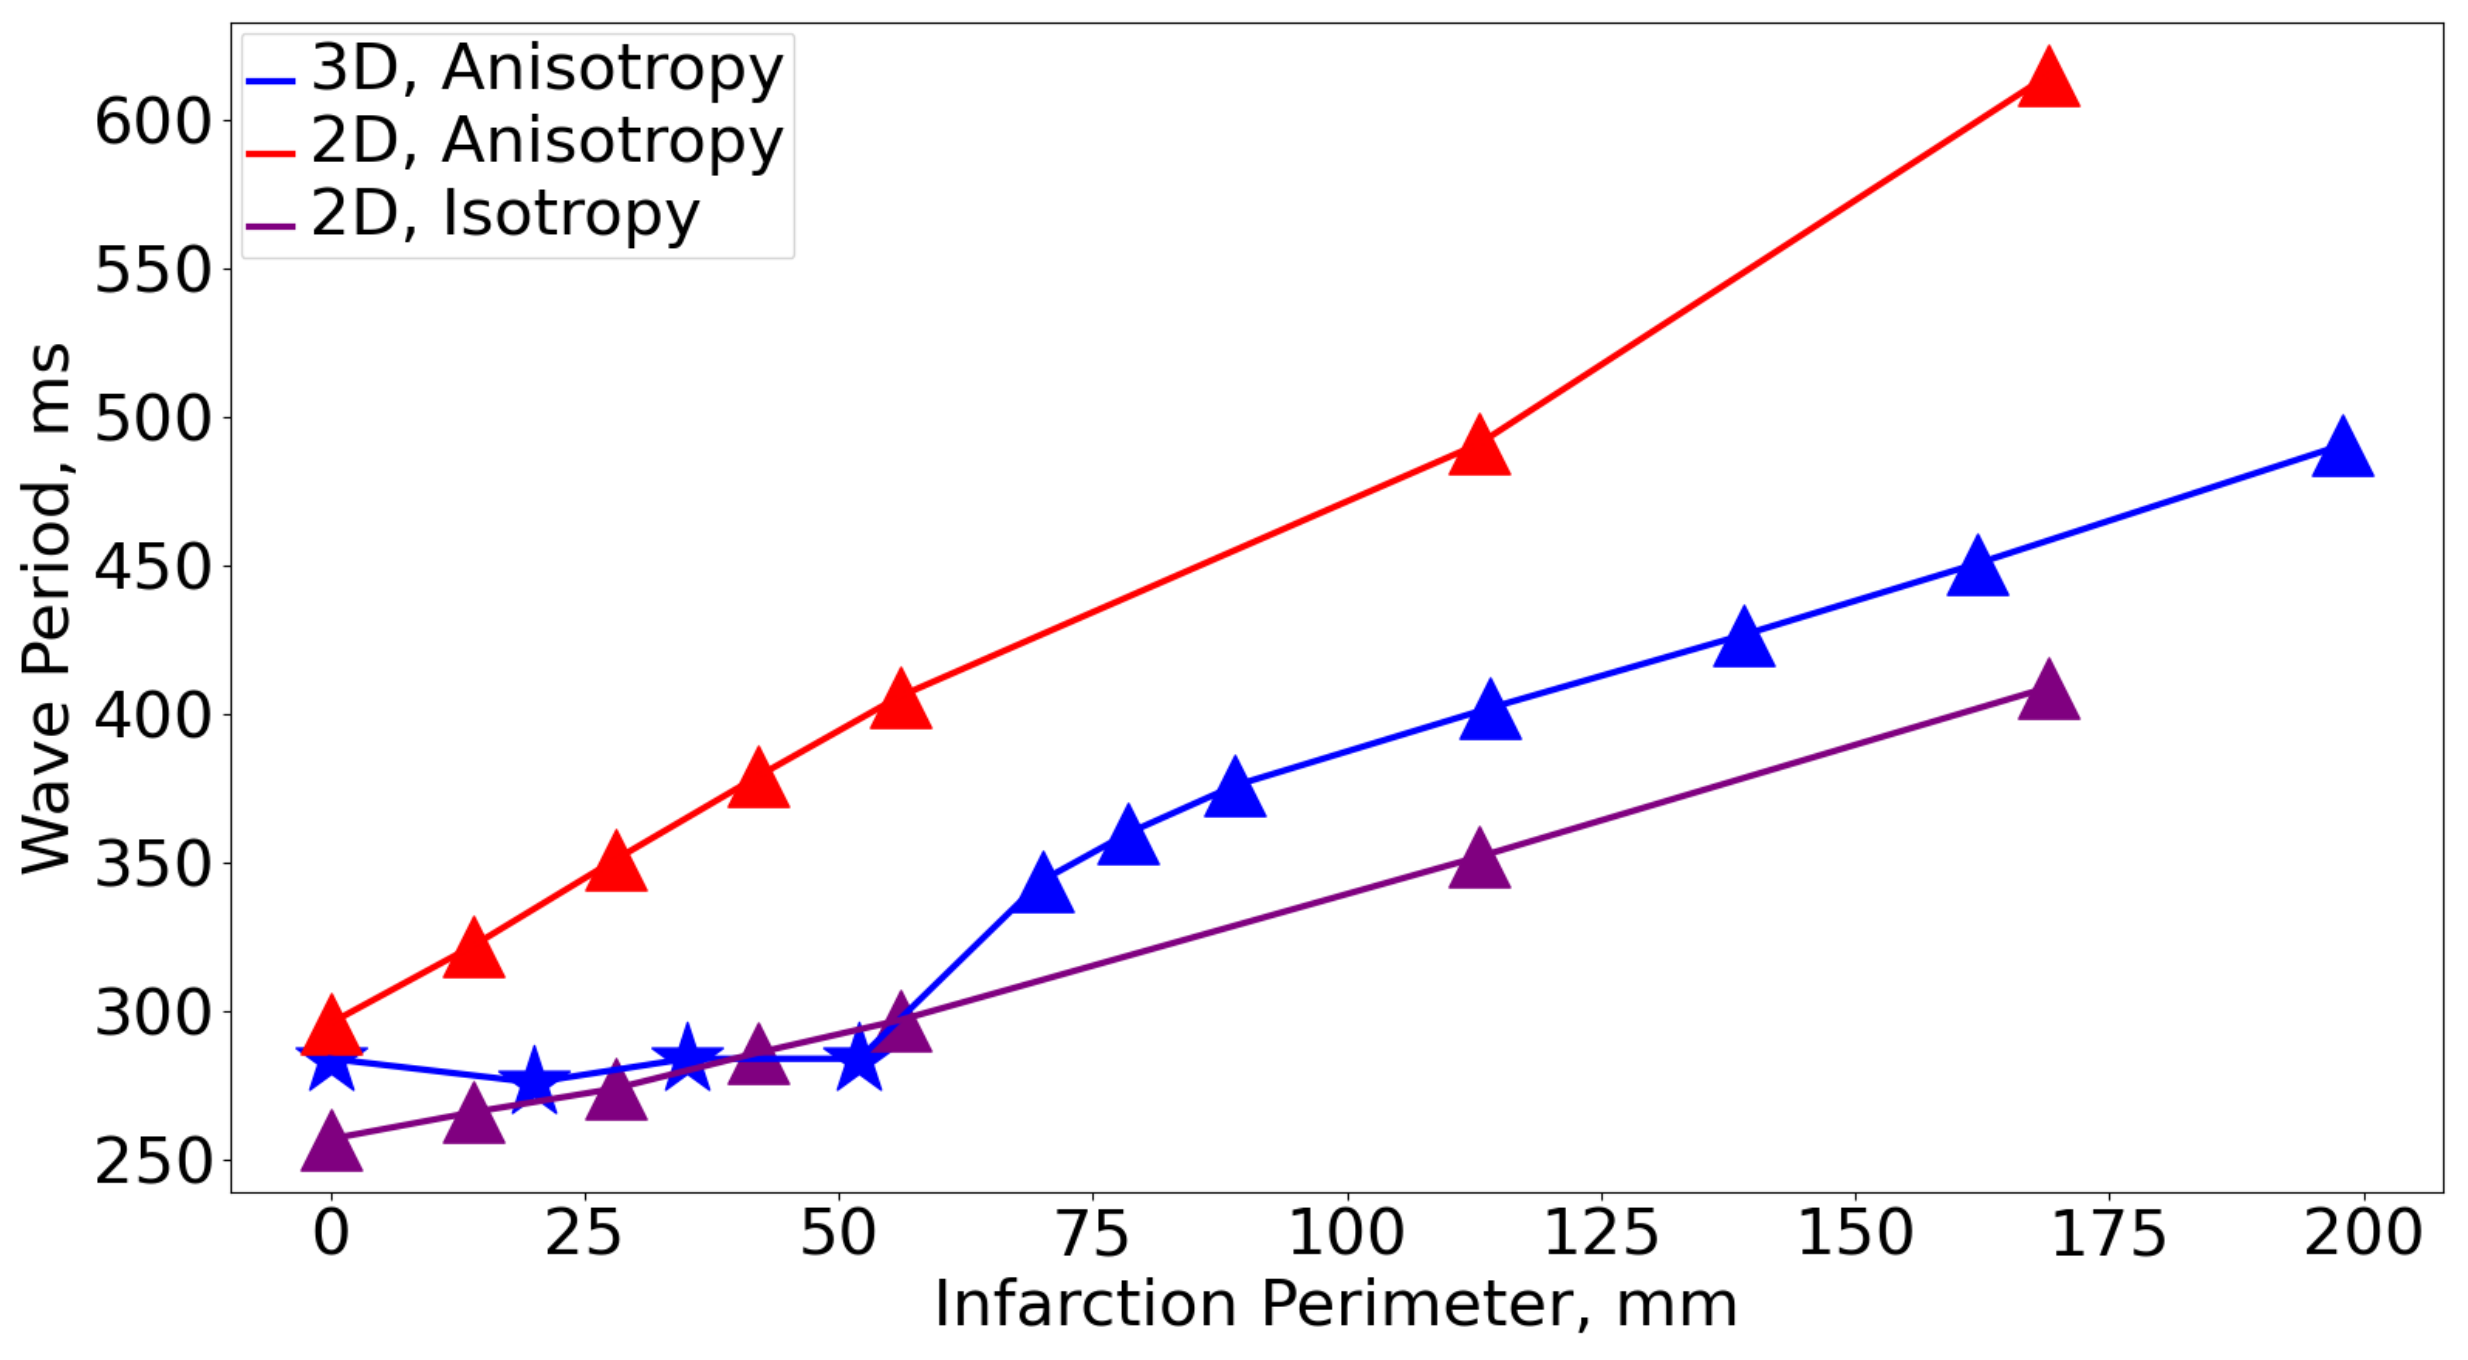
In another series of simulations (see Figure 9), we compared dependencies of the wave period on the scar perimeter derived from 3D anatomical model and 2D tissue simulations. Again, we see qualitatively similar behaviour of the curves, and the period in 3D model is smaller than that in the 2D anisotropic case, but larger than that in the 2D isotropic case except for a few points at small scar size. For these small infarction scar perimeters (22–54 mm in Figure 9), 3D and 2D isotropic cases are close to each other: the ratio of periods is approximately equal to 1. With further decrease in the scar perimeter (0–22 mm), 3D dependency has a horizontal segment, while for both 2D cases we see a decrease in the period. As a result, the periods in the 2D anisotropic tissue become closer to that in the ventricles.
The main difference of 2D and 3D anisotropy is that in 3D the ventricular myocardium has a rotational anisotropy, when the fiber orientation rotates to up to 150 degrees through the myocardial wall [24]. In 2D, we consider the case of constant fiber orientation. Thus, we can make the following conclusion: Although anisotropy with constant fiber direction increases the period compared with 2D isotropic tissue, the rotation of the fibers in 3D reduces the effect of anisotropy and the wave rotation occurs almost as if we have an isotropic medium with the diffusion coefficient corresponding to the maximal eigen value of the diffusion matrix in Equation (1), which showed that the rotational anisotropy increases wave propagation velocity and the velocity approaches the fastest possible propagation velocity in the tissue.

4. Discussion

In this paper, we performed a comprehensive study of the factors affecting the period of rotational activity in the ventricles of the human heart in the presence of post-infarction scar. We represented an infarction injury area by a compact scar region and gray zone around it and used a generic circular geometry for the domains, and state-of-the-art model for cardiac cells [19]. Moreover, we used also the geometry of human heart obtained from the patient MRI data [16] to compare with generic models. This study is a direct continuation of our previous research of the same phenomena in 2D myocardial tissue [15]; however, it includes essential additional features of the system, which are a realistic 3D shape of the ventricles, and realistic anisotropy of the cardiac tissue. We showed that in the realistic 3D model we also observe two main rotation regimes: the scar rotation and the gray zone rotation. We also observed two scar rotation regimes: scar rotation which occurred at a very small or absent gray zone and scar rotation two which occurred at a larger gray zone. However, because an infarction scar is usually surrounded by a substantial gray zone, only the scar rotation two regime, i.e., rotation inside the gray zone, can have practical importance.
Note that mathematical methods are widely used in various applications in cardiology, such as in the basic study of arrhythmia sources [29], correlation of cardiovascular risk markers [30], to support and optimize the relevant choices in cardiac surgery via building us mathematical models [31], and to develop novel ways of assessment of properties of the heart via ultrafast shear wave imaging based on multiphysics platform which includes modeling parts [32].
For the transition from the gray zone to the scar rotation two regime we found the following. For scars of a small perimeter (114 mm or less, see Figure 4a, red line), we observed the transition from gray zone rotation to the scar rotation two regime at the widths of the gray zone of about 20 mm. For the larger size of the scar (the perimeter above 190 mm, see Figure 4a, green line and Figure 4b aquamarine line ) the transition to the scar rotation two regimes occurred for lower gray zone widths of approximately 10–15 mm. Such difference can be explained based on our 2D simulations [15] as follows. The transition from the gray zone to scar rotation two regime occurs, when the period of rotation of the wave around the scar is smaller than the period of rotation around the gray zone. The period in turn is determined by the velocity of wave propagation, thus important here is a relation between the velocity of wave propagation inside the gray zone versus the normal tissue. For larger scars (where period of wave rotation around scar is greater), this difference in the wave speed between the normal and gray zone tissue is smaller (see restitution curves, i.e., the wave speed against the cycling period, in the normal tissue and gray zone in Figure 5 in [15]). Thus, the transition between the rotation regimes occurs for a smaller width of the gray zone as compared with that for small scars. Note that in comparison with the work in [15], our case (3D model) is much more complex. First, the 3D wave rotation here is a result of 2D rotations in transmural layers with different perimeters of scar and thus there is no single value of velocity of wave rotation which determines the period as in 2D simulations. In addition, in 3D models the tissue is anisotropic, thus even during the rotation in a given ventricular layer, the velocity will change due to anisotropy. However, our study shows that general qualitative relationships found in 2D can still qualitatively correctly predict the observed 3D results.
We performed a direct comparison of our 3D results with two types of 2D simulations using isotropic and anisotropic cardiac tissue. We found that the period of rotation in 3D is closer to 2D isotropic tissue in most of the cases. The main idea of the mechanism of this phenomenon can be explained as follows. The main determinant of the period is the velocity of wave propagation. Let us compare the velocities of the wave propagating in 3D anisotropic tissue, 2D isotropic, and 2D anisotropic tissue. In 2D isotropic tissue, the velocity of wave propagation in all directions is the same. In 2D anisotropic tissue with parallel fibers, the velocity of wave propagation depends on the direction. Let us denote the velocity of wave along the fibers as v f , across the fibers as v t , and in other directions the velocity v will be v t < v < v f . Now, let us consider wave propagation in 3D anisotropic tissue. 3D anisotropy of the heart is a rotational anisotropy, which can be qualitatively explained as follows. Let us consider a line which is extended through the myocardial wall and is (approximately) orthogonal to the inner and outer surfaces. If we now consider fiber directions at different depth along this line, we find that the direction of the fibers rotates counterclockwise when we go from the epicardial to the endocardial surface, and total rotation angle is approximately 120–150 degrees [24]. (The most widely used generic mathematical model for such anisotropy is a 3D slab with thickness Z, where at each layer orthogonal to Z we have parallel fibers and the direction of these fibers rotates with the thickness [33].) As in 2D, we assume that in 3D the wave velocity along the fibers is v f and across the fibers is v t . Now, let us consider what will be the velocity of the wave propagation between two points A and B, which are located sufficiently far from each other. This problem was studied in [34]. It was shown that if the total rotation angle is 180 degrees or more, then the velocity of the wave in any direction will be close to v f . Thus, the 3D wave velocity will be close to the wave velocity in 2D isotropic tissue. The reason for that is the following. Because the total rotation angle is 180 degrees, there always be a fiber which orientation coincides with the direction of the line connecting point A and B (more accurately with the projection of this line to the horizontal plane). Thus, there exists the following path from point A to B. It goes first from point A to the plane where the fiber is directed to the point B, then along the fibers to the projection of point B to that plane, and then from this point to the point B. If points A and B are sufficiently far from each other, the main part of this path will be along the fibers where wave travels with a velocity v f and overall travel time will be determined by the velocity v f , independently on the direction. Thus it is similar to propagation in isotropic tissue with the velocity v f . Similar process was also studied in [35].
In the case studied in our paper, we have a slightly different situation. We have rotation of the wave and also the real rotation of fibers in the heart is normally in less than 180 degrees. However, if we consider the results in [34,35] qualitatively, we can conclude that 3D rotational anisotropy accelerates the wave propagation. Because of that, the period of rotation in 3D is smaller than that in 2D anisotropic tissue, what we clearly see in Figure 9. Furthermore, the observed proximity of the 3D dependency to 2D dependency for isotropic tissue with velocity v f indicates that effect of acceleration is sufficiently large and is close to that found in [34]. It would be interesting in investigate that relation in more details. Here, it would be good to study wave rotation in a 3D rectangular slab of cardiac tissue with fibers located in parallel horizontal planes, and in such system find where the leading edge of the wave is located and if its position changes during rotation.
In our paper, we were mainly interested in the factors which determine the period of the source. However, the other extremely important question is how such a source can be formed. This problem was addressed in many papers based on the patient specific models [10,11] and also in papers which address in details the mechanisms of formation of such sources. In [13], the authors study the role of infarct scar dimension, repolarization properties and anisotropic fiber structure of scar tissue border zone on the onset of arrhythmia. The authors performed state-of-the-art simulations using a bidomain model of myocardial electrical activity and excitation propagation, finite element spatial integration, and implicit-explicit finite differences approach in time domain. They studied the infarction with a scar region extending transmurally across the ventricular wall, from sub-endocardial to sub-epicardial surface, as in our paper. They also considered additional case when the scar is not fully transmural, and there is a gray zone region shaped as a central sub-epicardial isthmus. The authors showed that initiation of arrhythmias strongly depends on the injury geometry. For example, it is much easier to evoke arrhythmia in a very narrow rather than wide epicardial gray zone region and the sustainability of arrhythmia depends on the stimulation site and tissue anisotropy. In view of this paper, it will be interesting to extend our study in several aspects. First, it would be interesting to study not only fully transmural scars, but also a scar which does not extend completely from endo to epirardial surface. This can affect not only the induction and sustanability of arrhythmia, but will definitely effect on its period. Furthermore, the gray zone geometry in the form of sub-epicardial channel is the definitely interesting and important geometric configuration. Finally, it would be interesting to see if using of the bidomain model for cardiac tissue can affect the results of simulations.
Furthermore, in [14], the authors study the mechanisms underlying the onset of arrhythmias in a three-dimensional computational model of acute regional ischaemia, when an already non-conductive scar and a gray zone are formed. The authors found the arrhythmia is formed here as a result of alternating conduction blocks in the gray zone. They observed 2:1 conduction blocks lead to discordant APD alternans, which in turn lead to wave breaks and formation of the arrhythmia. The heterogeneity in the gray zone in [14] is different from that used in our paper as we were aiming to reproduce a chronic infarction scar and not acute ischemia. In [14], the modulation of cellular activity is characterized by a decreased APD, while in our case APD in the gray zone is longer than in normal tissue. It will be interesting to study wave rotation for the tissue heterogeneity used in [14] and investigate if the same rotation regimes can also be obtained there. Furthermore, a prolonged APD in the border zone can facilitate the onset of early after depolarizations, which can lead to arrhythmias [36] and also affect the wave propagation regime. It would be interesting to study if such effects can be found in our model if we further increase the duration of APD in the gray zone.
The main aim of our paper is the fundamental study of processes which determine the period of arrhythmia due to rotation of wave around infraction scar. Although our study is generic and thus is a simplification of real clinical cases, we see the following potential clinical application of our results. The period of arrhythmia is very easy to measure from ECG and it is always done during clinical procedures (so called R–R interval). In our study, we show that during arrhythmia in the infarcted hearts the wave, in most of the cases, rotates around the gray zone, thus it actually propagates outside the infarcted area. Thus, we claim that the measured period most likely reflects the size of the whole damaged region and not the size of the compact scar. This finding, in our view, provides a new way to interpret wave propagation patterns inside the heart. In many cases, the most efficient way to remove cardiac arrhythmias is so-called cardiac ablation [37]. This is a procedure in which catheters are inserted inside the heart through the veins or arteries. Using these catheters, cardiologists can map electrical activity on the endocardial surface of the heart and then using heat or cold create tiny scars in the heart to block abnormal wave propagation and stop cardiac arrhythmias. Our findings show that in case of gray zone rotation, mapping of the wave can reflect not only the boundary of the scar, but also the boundary of the gray zone, and it can potentially affect the planning of the ablation procedure. Of course, for more practical recommendations, more studies are necessary which will use realistic shapes of infarction scars and also reproduce local electrograms recoded by cardiac mapping systems [38,39].

5. Conclusions

We showed that in an anatomical model of the ventricles with the infarction scar surrounded by the gray zone, we can observe two main regimes of wave rotation: the scar rotation regime, i.e., when wave rotates around a scar inside the gray zone, and gray zone regime, when the wave rotates around the gray zone on the border of the normal tissue. The transition to the scar rotation occurs if the gray zone width is larger than 10–20 mm, depending on the perimeter of the scar. A comparison of an anatomical 3D ventricular model with generic 2D myocardial models revealed that rotational anisotropy in the depth of ventricular wall accounts for faster wave propagation as compared with 2D anisotropic case without rotation, and thus leads to ventricular arrhythmia periods closer to isotropic tissue.

Supplementary Materials

The following are available online at https://www.mdpi.com/article/10.3390/math9222911/s1, Figure S1: Dependence of the wave rotation period on the perimeter of gray zone at different space step, Table S1: Dependence of the wave rotation period on the perimeter of the gray zone at different space step.

Author Contributions

Conceptualization, A.V.P., D.M. and O.S.; formal analysis, D.M. and P.K.; methodology, A.V.P. and P.K., D.M.; software A.D. and D.M.; supervision, A.V.P. and O.S.; visualization, D.M. and A.D.; writing—original draft preparation, D.M., A.D., A.V.P., and O.S.; writing—review and editing, D.M., A.D., P.K., A.V.P., and O.S. All authors have read and agreed to the published version of the manuscript.

Funding

A.V.P., P.K., D.M., A.D., and O.S. was funded by the Russian Foundation for Basic Research (#18-29-13008). P.K., D.M., A.D., and O.S. work was carried out within the framework of the IIF UrB RAS theme No AAAA-A21-121012090093-0.

Data Availability Statement

Data related to this study can be provided by the corresponding authors on request.

Acknowledgments

We are thankful to Arcady Pertsov for a valuable discussion.

Conflicts of Interest

The authors declare no conflict of interest.

Abbreviations

The following abbreviations are used in this manuscript:
CVConduction Velocity
FRFunctional Rotation
GZGray Zone
GZRGray Zone Rotation
ISPost-infarction Scar
NTNormal Tissue
SRScar Rotation
SR2Scar Rotation Two

References

  1. Pertsov, A.M.; Ermakova, E.A.; Panfilov, A.V. Rotating spiral waves in a modified Fitz-Hugh-Nagumo model. Phys. D Nonlinear Phenom. 1984, 14, 117–124. [Google Scholar] [CrossRef]
  2. Davidenko, J.M.; Pertsov, A.V.; Salomonsz, R.; Baxter, W.; Jalife, J. Stationary and drifting spiral waves of excitation in isolated cardiac muscle. Nature 1992, 355, 349–351. [Google Scholar] [CrossRef] [PubMed]
  3. Gao, X.; Feng, X.; Li, T.C.; Qu, S.; Wang, X.; Zhang, H. Dynamics of spiral waves rotating around an obstacle and the existence of a minimal obstacle. Phys. Rev. E 2017, 95, 052218. [Google Scholar] [CrossRef] [PubMed] [Green Version]
  4. Panfilov, A.V.; Holden, A.V. Computer simulation of re-entry sources in myocardium in two and three dimensions. J. Theor. Biol. 1993, 161, 271–285. [Google Scholar] [CrossRef]
  5. Xie, F.; Qu, Z.; Garfinkel, A. Dynamics of reentry around a circular obstacle in cardiac tissue. Phys. Rev. E Stat. Phys. Plasmas Fluids Relat. Interdiscip. Top. 1998, 58, 6355. [Google Scholar] [CrossRef]
  6. Courtemanche, M.; Glass, L.; Keener, J.P. Instabilities of a propagating pulse in a ring of excitable media. Phys. Rev. Lett. 1993, 70. [Google Scholar] [CrossRef] [PubMed]
  7. Balaban, G.; Halliday, B.P.; Bai, W.; Porter, B.; Malvuccio, C.; Lamata, P.; Rinaldi, C.A.; Plank, G.; Rueckert, D.; Prasad, S.K.; et al. Scar shape analysis and simulated electrical instabilities in a non-ischemic dilated cardiomyopathy patient cohort. PLoS Comput. Biol. 2019, 15, e1007421. [Google Scholar] [CrossRef]
  8. Nattel, S.; Burstein, B.; Dobrev, D. Atrial remodeling and atrial fibrillation: Mechanisms and implications. Circ. Arrhythmia Electrophysiol. 2008, 1, 62–73. [Google Scholar] [CrossRef] [Green Version]
  9. Schmidt, A.; Azevedo, C.F.; Cheng, A.; Gupta, S.N.; Bluemke, D.A.; Foo, T.K.; Gerstenblith, G.; Weiss, R.G.; Marbán, E.; Tomaselli, G.F. Infarct tissue heterogeneity by magnetic resonance imaging identifies enhanced cardiac arrhythmia susceptibility in patients with left ventricular dysfunction. Circulation 2007, 115, 2006–2014. [Google Scholar] [CrossRef]
  10. Arevalo, H.J.; Vadakkumpadan, F.; Guallar, E.; Jebb, A.; Malamas, P.; Wu, K.C.; Trayanova, N.A. Arrhythmia risk stratification of patients after myocardial infarction using personalized heart models. Nat. Commun. 2016, 7. [Google Scholar] [CrossRef]
  11. Arevalo, H.; Plank, G.; Helm, P.; Halperin, H.; Trayanova, N. Tachycardia in Post-Infarction Hearts: Insights from 3D Image-Based Ventricular Models. PLoS ONE 2013, 8, e68872. [Google Scholar] [CrossRef] [Green Version]
  12. Lopez-Perez, A.; Sebastian, R.; Izquierdo, M.; Ruiz, R.; Bishop, M.; Ferrero, J.M. Personalized cardiac computational models: From clinical data to simulation of infarct-related ventricular tachycardia. Front. Physiol. 2019, 10, 580. [Google Scholar] [CrossRef] [PubMed] [Green Version]
  13. Colli-Franzone, P.; Gionti, V.; Pavarino, L.F.; Scacchi, S.; Storti, C. Role of infarct scar dimensions, border zone repolarization properties and anisotropy in the origin and maintenance of cardiac reentry. Math. Biosci. 2019, 315, 108228. [Google Scholar] [CrossRef] [PubMed]
  14. Bernus, O.; Zemlin, C.W.; Zaritsky, R.M.; Mironov, S.F.; Pertsov, A.M. Alternating conduction in the ischaemic border zone as precursor of reentrant arrhythmias: A simulation study. Europace 2005, 7, S93–S104. [Google Scholar] [CrossRef]
  15. Konovalov, P.; Mangileva, D.; Dokuchaev, A.; Solovyova, O.; Panfilov, A. Rotational Activity Around an Obstacle in 2D Cardiac Tissue in Presence of Cellular Heterogeneity. bioRxiv 2021. [Google Scholar] [CrossRef]
  16. Strocchi, M.; Augustin, C.M.; Gsell, M.A.F.; Karabelas, E.; Neic, A.; Gillette, K.; Razeghi, O.; Prassl, A.J.; Vigmond, E.J.; Behar, J.M.; et al. A Publicly Available Virtual Cohort of Four- chamber Heart Meshes for Cardiac Electro-mechanics Simulations. PLoS ONE 2020, 15, e0235145. [Google Scholar] [CrossRef]
  17. Bayer, J.; Prassl, A.J.; Pashaei, A.; Gomez, J.F.; Frontera, A.; Neic, A.; Plank, G.; Vigmond, E.J. Universal ventricular coordinates: A generic framework for describing position within the heart and transferring data. Med. Image Anal. 2018, 45, 83–93. [Google Scholar] [CrossRef]
  18. Mendonca Costa, C.; Neic, A.; Kerfoot, E.; Gillette, K.; Porter, B.; Sieniewicz, B.; Gould, J.; Sidhu, B.; Chen, Z.; Elliott, M.; et al. A Virtual Cohort of Twenty-four Left-Ventricular Models of Ischemic Cardiomyopathy Patients. 2020. Available online: https://www.researchgate.net/publication/343574702_A_Virtual_Cohort_of_Twenty-four_Left-ventricular_Models_of_Ischemic_Cardiomyopathy_Patients (accessed on 13 August 2021). [CrossRef]
  19. Tusscher, K.H.T.; Panfilov, A.V. Alternans and spiral breakup in a human ventricular tissue model. Am. J. Physiol. Heart Circ. Physiol. 2006, 291, H1088–H1100. [Google Scholar] [CrossRef]
  20. Taggart, P.; Sutton, P.M.; Opthof, T.; Coronel, R.; Trimlett, R.; Pugsley, W.; Kallis, P. Inhomogeneous transmural conduction during early ischaemia in patients with coronary artery disease. J. Mol. Cell. Cardiol. 2000, 32, 621–630. [Google Scholar] [CrossRef]
  21. Bayer, J.D.; Blake, R.C.; Plank, G.; Trayanova, N.A. A novel rule-based algorithm for assigning myocardial fiber orientation to computational heart models. Ann. Biomed. Eng. 2012, 40, 2243–2254. [Google Scholar] [CrossRef] [Green Version]
  22. Bayer, J.D.; Beaumont, J.; Krol, A. Laplace–Dirichlet energy field specification for deformable models. An FEM approach to active contour fitting. Ann. Biomed. Eng. 2005, 33, 1175–1186. [Google Scholar] [CrossRef] [PubMed]
  23. Bishop, M.J.; Boyle, P.M.; Plank, G.; Welsh, D.G.; Vigmond, E.J. Modeling the role of the coronary vasculature during external field stimulation. IEEE Trans. Biomed. Eng. 2010, 57, 2335–2345. [Google Scholar] [CrossRef] [PubMed] [Green Version]
  24. Streeter, D. Handbook of Physiology. Sec. 2. Vol. I. The Heart. In Gross Morphology and Fiber Geometry of the Heart; American Physiology Society: Bethesda, MD, USA, 1979; pp. 61–112. [Google Scholar]
  25. Decker, K.F.; Rudy, Y. Ionic mechanisms of electrophysiological heterogeneity and conduction block in the infarct border zone. Am. J. Physiol. Heart Circ. Physiol. 2010, 299. [Google Scholar] [CrossRef] [Green Version]
  26. Keldermann, R.H.; Tusscher, K.H.T.; Nash, M.P.; Bradley, C.P.; Hren, R.; Taggart, P.; Panfilov, A.V. A computational study of mother rotor VF in the human ventricles. Am. J. Physiol. Heart Circ. Physiol. 2009, 296. [Google Scholar] [CrossRef] [Green Version]
  27. De Coster, T. The Role of Adipose Tissue in Arrhythmogenesis: An In Silico Study. Ph.D. Thesis, Ghent University, Ghent, Belgium, 2019. [Google Scholar]
  28. Rush, S.; Larsen, H. A Practical Algorithm for Solving Dynamic Membrane Equations. IEEE Trans. Biomed. Eng. 1978, BME-25. [Google Scholar] [CrossRef] [PubMed]
  29. Liu, L.Y.; Yun, C.H.; Kuo, J.Y.; Lai, Y.H.; Sung, K.T.; Yuan, P.J.; Tsai, J.P.; Huang, W.H.; Lin, Y.H.; Hung, T.C.; et al. Aortic Root Remodeling as an Indicator for Diastolic Dysfunction and Normative Ranges in Asians: Comparison and Validation with Multidetector Computed Tomography. Diagnostics 2020, 10, 712. [Google Scholar] [CrossRef]
  30. Pravdin, S.; Konovalov, P.; Dierckx, H.; Solovyova, O.; Panfilov, A.V. Drift of Scroll Waves in a Mathematical Model of a Heterogeneous Human Heart Left Ventricle. Mathematics 2020, 8, 776. [Google Scholar] [CrossRef]
  31. Nappi, F.; Carotenuto, A.R.; Avtaar Singh, S.S.; Mihos, C.; Fraldi, M. Euler’s elastica-based biomechanics of the papillary muscle approximation in ischemic mitral valve regurgitation: A simple 2d analytical model. Materials 2019, 12, 1518. [Google Scholar] [CrossRef] [Green Version]
  32. Caenen, A.; Pernot, M.; Kinn Ekroll, I.; Shcherbakova, D.; Mertens, L.; Swillens, A.; Segers, P. Effect of ultrafast imaging on shear wave visualization and characterization: An experimental and computational study in a pediatric ventricular model. Appl. Sci. 2017, 7, 840. [Google Scholar] [CrossRef] [Green Version]
  33. Berenfeld, O.; Pertsov, A.M. Dynamics of intramural scroll waves in three-dimensional continuous myocardium with rotational anisotropy. J. Theor. Biol. 1999, 199, 383–394. [Google Scholar] [CrossRef]
  34. Young, R.J.; Panfilov, A.V. Anisotropy of wave propagation in the heart can be modeled by a Riemannian electrophysiological metric. Proc. Natl. Acad. Sci. USA 2010, 107, 15063–15068. [Google Scholar] [CrossRef] [Green Version]
  35. Bernus, O.; Wellner, M.; Pertsov, A. Intramural wave propagation in cardiac tissue: Asymptotic solutions and cusp waves. Phys. Rev. E 2004, 70, 061913. [Google Scholar] [CrossRef]
  36. Vandersickel, N.; Kazbanov, I.V.; Nuitermans, A.; Weise, L.D.; Pandit, R.; Panfilov, A.V. A study of early afterdepolarizations in a model for human ventricular tissue. PLoS ONE 2014, 9, e84595. [Google Scholar] [CrossRef] [Green Version]
  37. Stevenson, W.G.; Soejima, K. Catheter ablation for ventricular tachycardia. Circulation 2007, 115, 2750–2760. [Google Scholar] [CrossRef]
  38. Codreanu, A.; Odille, F.; Aliot, E.; Marie, P.Y.; Magnin-Poull, I.; Andronache, M.; Mandry, D.; Djaballah, W.; Régent, D.; Felblinger, J.; et al. Electroanatomic characterization of post-infarct scars: Comparison with 3-dimensional myocardial scar reconstruction based on magnetic resonance imaging. J. Am. Coll. Cardiol. 2008, 52, 839–842. [Google Scholar] [CrossRef] [PubMed]
  39. Vigmond, E.; Pashaei, A.; Amraoui, S.; Cochet, H.; Hassaguerre, M. Percolation as a mechanism to explain atrial fractionated electrograms and reentry in a fibrosis model based on imaging data. Heart Rhythm 2016, 13, 1536–1543. [Google Scholar] [CrossRef] [PubMed]
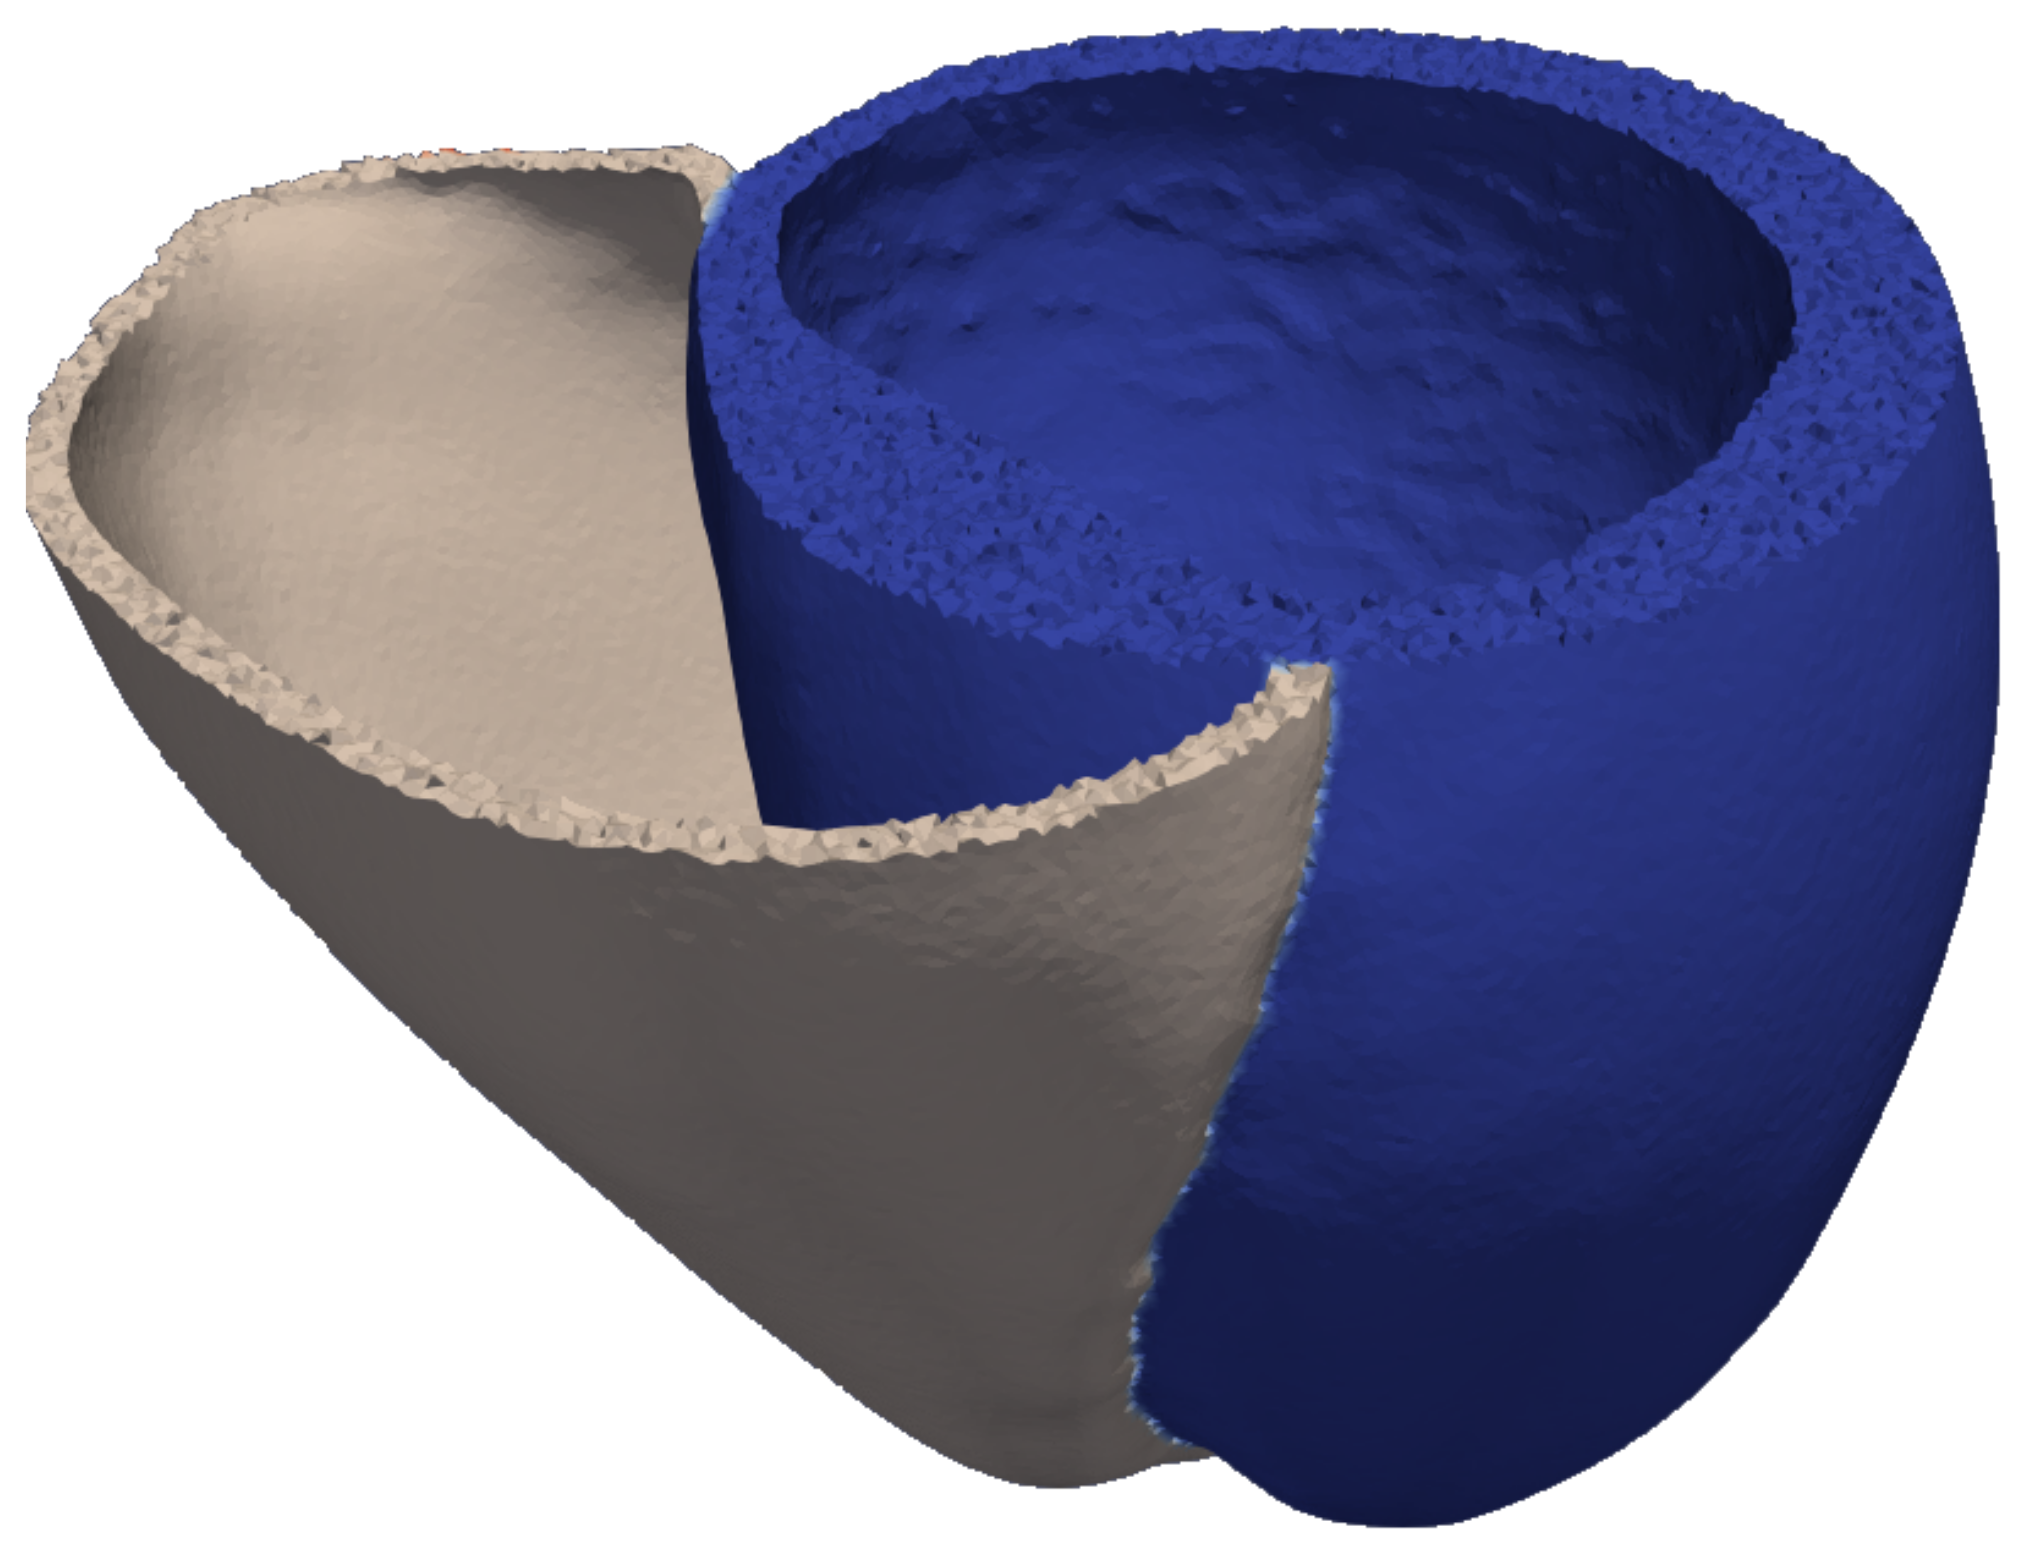
Figure 1. Anatomical model of the left (blue) and right (white) ventricles from the human heart. (The image was generated by the authors from the open data set from file 01.tar.gz which can be found at https://doi.org/10.5281/zenodo.3890034, (accessed on 13 August 2021) in a supplement for paper [16]). There are 405382 points on the image.
Mathematics 09 02911 g001
Figure 2. View of the post-infarction scars (blue) and gray zone (gray) around it. Healthy area is shown in red. (a) Post-infarction scar and gray zone has an ideal circular shape. Radius of the scar is 18 mm (perimeter of 114 mm), width of the border zone is 5 mm. There are 381612 points for healthy tissue, 8109 points for the gray zone tissue, and 15661 points for the scar tissue. (b) Post-infarction scar of realistic shape derived from a CT clinical infarction image. There are 161783 points on the image. (The image was generated by the authors from open data source from the file 1-mesh-uvc.vtk which can be found at https://doi.org/10.18742/RDM01-570, (accessed on 13 August 2021) in a supplement for the paper in [18]). The scar perimeter is 72 mm and gray zone width is 7.5 mm. Light blue color displays the scar on the epicardial surface and dark blue color displays the scar on the endocardial surface.
Mathematics 09 02911 g002
Figure 3. Initiation of the rotational activity using S1–S2 protocol: S1 stimulus (A), S2 stimulus (B), and wave rotation around a scar (C,D). Arrows show direction of the wave rotation. There are 397273 points in a geometry on the image.
Mathematics 09 02911 g003
Figure 4. Dependence of the wave rotation period on the width of the gray zone in simulations with various perimeters of infarction scar. Here, and in the figures below, various symbols indicate wave of period at points where simulations were performed. A star indicates functional rotation, a triangle indicates gray zone rotation, a square indicates scar rotation, and a circle indicates scar rotation two. (a) Dependence for infarction perimeter 114 mm, 162 mm, and 214 mm. (b) Dependence for infarction perimeter 89 mm, 139 mm, and 198 mm.
Mathematics 09 02911 g004
Figure 5. Dependence of the wave rotation period on the perimeter of the infarction scar at various gray zone width. A pink points indicate the results for realistic shape infarct. A star indicates functional rotation, a triangle indicates gray zone rotation, a square indicates scar rotation, and a circle indicates scar rotation two.
Mathematics 09 02911 g005
Figure 6. Examples of different rotation regimes (inside view of the left ventricle): (a) functional rotation, (b) gray zone rotation, (c) scar rotation, and (d) scar rotation two. Arrows indicate wave direction. Dots show the border of the gray zone. Gray color means the scar. The infarction perimeter for (a,b) is 35 mm, for (c,d) is 162 mm. The gray zone perimeter for (a,d) is 0 mm, for (b,d) is 7.5 mm. There are 398922 points on the images (a,b), and 366962 points on the images (c,d).
Mathematics 09 02911 g006
Figure 7. Dependence of the wave rotation period on the perimeter of the gray zone for different perimeters of the infarction scar. A star indicates functional rotation, a triangle indicates gray zone rotation, a square indicates scar rotation, and a circle indicates scar rotation two.
Mathematics 09 02911 g007
Figure 8. Comparison of dependencies of the wave period on the gray zone width in 3D anatomical model (blue line) and 2D tissue simulations (isotropic case, purple line; anisotropic case, red line). The perimeter of the infarction scar in all models is 162 mm. A triangle indicates gray zone rotation, a square indicates scar rotation, and a circle indicates scar rotation two.
Mathematics 09 02911 g008
Figure 9. Comparison of dependencies of the wave period on the perimeter of the infarction scar in 3D anatomical model (blue line) and 2D tissue simulations (isotropic case, purple line; anisotropic case, red line). The width of the gray zone for all models is 7.5 mm. A star indicates functional rotation and a triangle indicates gray zone rotation.
Mathematics 09 02911 g009
Table 1. Wave rotation period (in milliseconds) for different gray zone size (horizontally), and for different size of the scar (vertically) expressed as the percentage of healthy tissue.
GZ Scar0%2.5%5%7.5%10%12.5%15%17.5%20%22.5%25%
2.5%295346376404427448464469469469472
5%333374400417448469469480504480480
7.5%362402427451467483483488493493493
10%392427451474488499499507513513513
12.5%432442469491504516516523525525524
15%456464493511528533533544549544544
Publisher’s Note: MDPI stays neutral with regard to jurisdictional claims in published maps and institutional affiliations.