Article

Numerical Study of Powder Flow Nozzle for Laser-Assisted Metal Deposition

by
Romuald Petkevič
1,*,
Giedrius Jočbalis
2,
Ada Steponavičiūtė
1,
Karolis Stravinskas
1,
Aleksej Romanov
3,
Rimantas Kačianauskas
2,
Sergejus Borodinas
2 and
Genrik Mordas
1
1
Center for Physical Sciences and Technology, LT-02300 Vilnius, Lithuania
2
Department of Applied Mechanics, Vilnius Gediminas Technical University, LT-10223 Vilnius, Lithuania
3
PĮ “J.&A. Romanovų”, LT-10283 Vilnius, Lithuania
*
Author to whom correspondence should be addressed.
Mathematics 2021, 9(22), 2913; https://doi.org/10.3390/math9222913
Submission received: 8 October 2021 / Revised: 11 November 2021 / Accepted: 11 November 2021 / Published: 16 November 2021
(This article belongs to the Special Issue Numerical Analysis and Scientific Computing)

Abstract

:
Metal additive manufacturing has received much attention in the past few decades, and it offers a variety of technologies for three-dimensional object production. One of such technologies, allowing large-sized object production, is laser-assisted metal deposition, the limits of which are determined by the capabilities of the positioning system. The already-existing nozzles have either a relatively low build rate or a poor resolution. The goal of this work is to develop a new nozzle with a centered particle beam at high velocity for the laser-assisted metal additive manufacturing technologies. Scientific challenges are addressed with regards to the fluid dynamics, the particle-substrate contact, and tracking of the thermodynamic state during contact. In this paper, two nozzles based on the de Laval geometry with Witoszynski and Bicubic curves of convergence zone were designed; the results showed that the average flow velocity in a Bicubic outlet curve nozzle is around 615 m/s and in Witoszynski this is 435 m/s. Investigation of particle beam formation for the Bicubic curve geometry revealed that small particles have the highest velocity and the lowest total force at the nozzle outlet. Fine particles have a shorter response time, and therefore, a smaller dispersion area. The elasto-plastic particle-surface contact showed that particles of diameter limited up to 3 μm are able to reach experimentally obtained critical velocity without additional heating. For particle sizes above 10 μm, additional heating is needed for deposition. The maximum coefficient of restitution (COR) is achieved with a particle size of 30 μm; smaller particles are characterized by the values of COR, which are lower due to a relatively high velocity. Particles larger than 30 μm are scalable, characterized by a small change in velocity and a rise in temperature as their mass increases.

1. Introduction

In recent decades, the additive manufacturing (AM) technology, used to fabricate physical models, prototypes, or functional gradient components directly from 3D computer-aided design (CAD) data using the layered approach [1,2], has been evolving rapidly. In particular, the laser additive manufacturing (LAM) [3] demonstrates the advantage of printing large metal components and having a complex internal structure, as well as opens many new applications. The most popular LAM methods include selective laser sintering/melting (SLS [4]/SLM [5]) and directed energy deposition (DED) [6]. Compared to SLS/SLM methods, DED represents the potential of different processes, especially in the repair of worn components [7] and in the preparation of functional gradient materials [8].
One of the AM classes belonging to the DED class is the Laser Powder Fed Additive Manufacturing Process (LPF-AM). LPF-AM functionality has attracted several industries to customize its coating, repair, and component manufacturing features from one or more materials. In LPF-AM, the powder nozzle feeds the powder into a melt pool supported by the laser beam. As the laser beam moves forward along with the powder jet, a weld path is formed, which forms a coating or 3D portion along with several other overlapping weld paths. This process is also known as laser metal deposition (LMD).
LMD technology allows printing 3D objects in large sizes, the limits of which are determined by the capabilities of the positioning system. Using LMD technologies, the printing of 3D objects can be combined with metal processing processes and products with places that are not accessible for processing. Due to their complex shape, surface treatment can be performed at the selected printing stage. Another advantage of LMD technology is the recovery of damaged metal objects and the gradual coating of the surface with other metals [9].
LMD systems use three types of printheads, namely off-axial nozzle, discrete coaxial nozzle, and continuous coaxial nozzle. In the last two, the flow of powder fed from the sides interacts with the laser beam and attenuates the intensity of the beam, resulting in more laser power being used than required by the metal melting process. Laser-heated powder particles in such heads fall into the melt pool at different angles, which ensures freedom of the printing directions of the head but reduces the deposition rate of the metal due to the peculiarities of the metal powder flow. The first type of LMD print head off-axial nozzle has a high metal deposition speed, which leads not only to time savings, but also to a better adaptability in the repair of damaged metal parts. The main disadvantages of such heads are single-direction print and lower resolution than those of off-axial nozzle heads. If the first problem can be solved by simply tilting the head with a print direction, then nozzle optimization is required to increase the resolution [10,11].
In the off-axial nozzle heads used, the flow of metal powder expands as it exits the nozzle and is in the shape of an expanding cone [12]. Moreover, in such nozzles, the metal powder is evenly mixed with the carrier gas and as an abrasive destroys the nozzle output, which changes the printing parameters over time [13].
The additional gas flow around the metal powder flow helps to regulate and maintain the powder flow evenly along the axis of fall [14]. Such a solution is suitable for low gas flow rates, and de Laval nozzles are used to increase the gas and powder flow rate. Usually, de Laval nozzles are used in Cold spray systems, where the powder flow rate is a critical parameter for effective surface covering [15].
The particles are usually fed into a laser-heated spot, where a melt is formed, which suddenly hardens as the laser beam travels onward [16]. One of the main disadvantages is the low resolution of the melted material and the formed track, which results in a high surface roughness. This can be reduced by using a smaller melt pool and a thinner layer thickness, but this can have a negative effect on the speed of the process. Another negative aspect is the relatively low efficiency of the trapped powder, which in some cases can be as low as 8% [17]. Recently, several concepts of metal particle positioning heads have been introduced to increase particle deposition efficiency, reduce particle scattering, etc. [18]. These are usually coaxial flow heads in which the laser radiation passes through the central axis of the head and the particles are fed from the sides [19,20]. Commonly, they consist of two matched cones that form an annular powder outlet. However, such already-existing nozzles have either a relatively low build rate or a poor resolution. Better resolution cannot be achieved because a better focused particle beam cannot be formed due to the limitations of the geometry (the laser beam is positioned in the center of the nozzle).
Heads with a coaxial particle flow and a non-centered laser beam exist as well [21]. The main differences are how the particles are fed—whether separate sprays are used [22], whether it is coaxial injection, or whether there are additional gas streams that better focus the particle flow and laser radiation. However, there is no nozzle with a centered particle beam at high velocity. Our approach is different from the already-existing nozzles, namely, the high velocity particle flow is formed in the center of the nozzle with a few laser beams positioned around it. In this way, better resolution can be achieved.
The goal of this work is to develop a new nozzle with a centered particle beam at high velocity for the laser-assisted metal additive manufacturing technologies. For that, we attain the following aims:
  • To design and to investigate two nozzles (based on the de Laval geometry with Witoszynski and Bicubic curves of convergence zone) having a centered capillary for the particle beam and sheath compressed gas flow around the capillary.
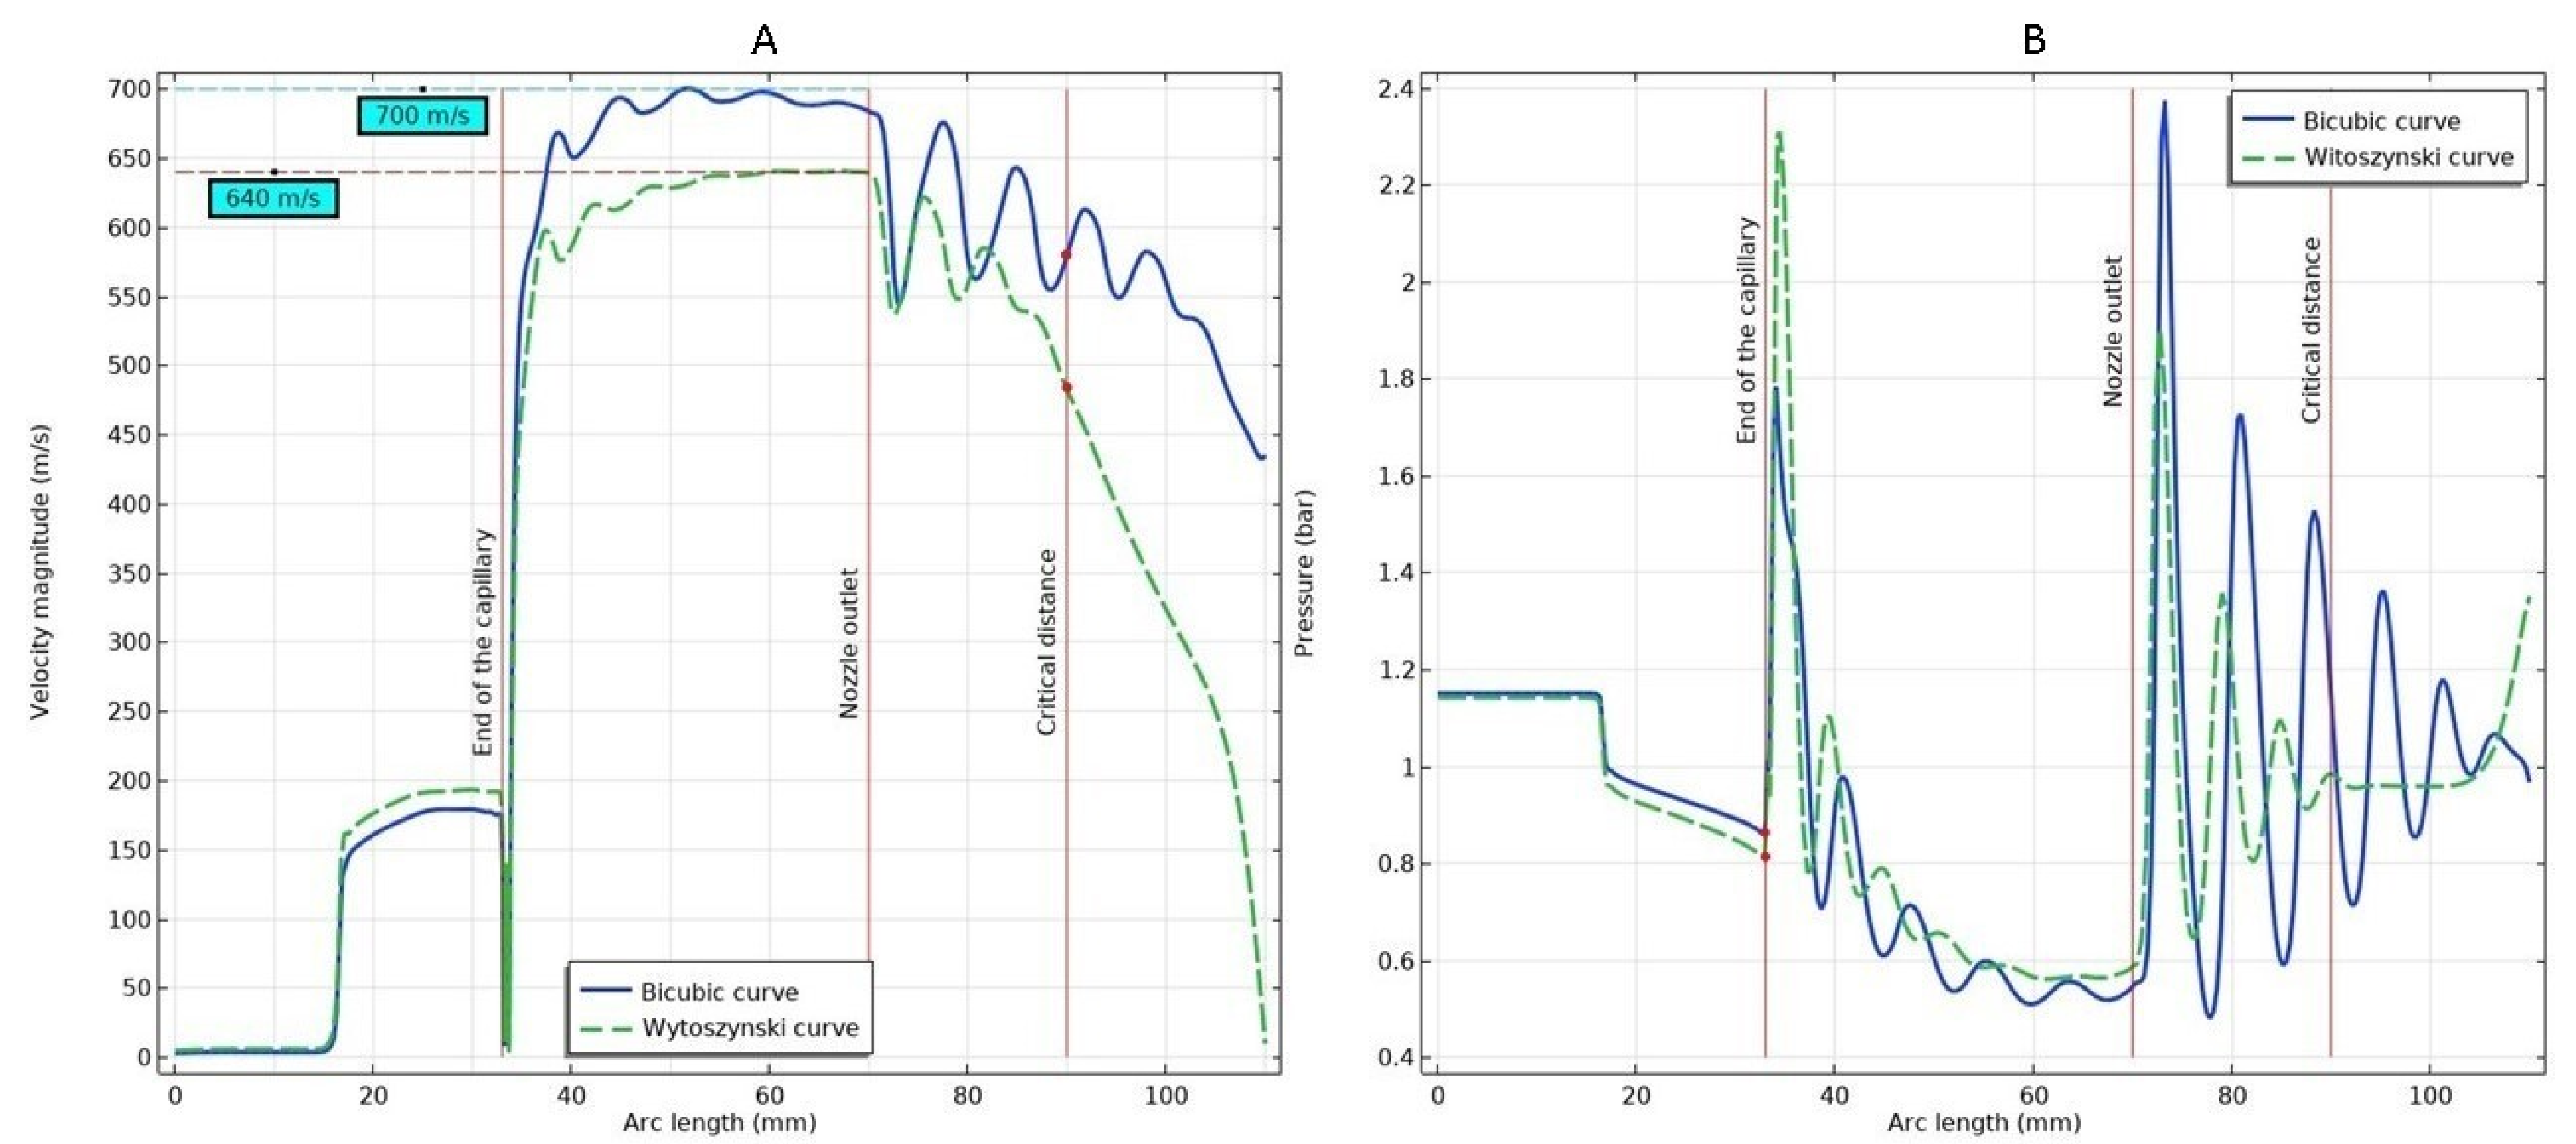
  • To determine optimal Witoszynski and Bicubic curve parameters for the nozzle, which are characterized by high gas velocity (>500 m/s), lower pressure at the end of the capillary, and the smallest gas flow velocity fluctuations in the first 20 mm after exiting the outlet of the nozzle.
  • To investigate particle beam formation for optimal printing resolution.
  • To determine relationship between particle sizes and coefficients of restitution, by performing particle-substrate thermo-mechanical elastic-plastic contact analysis.
In this work, scientific challenges are addressed with regards to the fluid dynamics (chapters 3.1 and 3.3), the particle-substrate contact (chapter 3.4), and tracking of the thermodynamic state during contact (chapter 3.5). Such an approach leads to the optimal design of a nozzle. Our technology works a little bit differently than most directed energy deposition (DED) technologies and has similarities with the cold spray technology. In our case, we are developing a technology where the powder particles attach to a solid surface (substrate or an already-existing layer) while still being in solid state. Only after their sticking to the existing layer, the newly deposited particles are melted by a laser beam. For this reason, the calculations of the described impact effect of a solid particle against a solid surface are significant in our study. We expect our technology to be more precise than the already-existing DED, LMD, or laser cladding technologies.

2. Methods

De Laval nozzles consist of four parts, namely the straight part, the convergent part, the throat, and the spread part (Figure 1). The flow of compressed gas (Table 1) has a high degree of turbulence, which is not conducive to gas shrinkage in the convergent section of the nozzle. Therefore, a straight section is established in front of the convergent part of the nozzle to ensure an even distribution of the flow inlet velocity.

2.1. Convergent Section

The shrinkage part is an important part of the supersonic nozzle, which evenly accelerates air flow, reduces turbulence, and improves the stability of gas flow. There are currently many types of shrinkage design curves, the most common types of curves being a double parametric curve and its modifications, a Witoszynski curve and its modifications, and a straight line. The best parameters of speed and stability have been shown by the double parametric curve and the Witoszynski curve [23,24].

2.1.1. Bicubic Parametric Curve

The Bicubic parametric curve is a family of curves with the parameter xm. By selecting the xm position, a number of contraction surfaces can be obtained. The tapering profile R is calculated by the Equation (1):
R = R c + ( 1 1 x m 2 ( x L 1 ) 3 ) ,   where   ( x L 1 x m ) R = R c + ( 1 ( 1 x m ) 2 ) ( 1 x L 1 ) 3 ( R i n R c ) ,   w h e r e   ( x L 1 x m ) }
where xm is the coordinate of the point of intersection of the two curves (defining the end of the first curve and the beginning of the second curve). The value of xm in this paper is in the range of 0.2–0.9 (Table 2). The choice is explained in Section 3.1.

2.1.2. Witoszynski Parametric Curve

The Witoszynski curve is used for an ideal, uncompressed, and axially symmetric flow that can be used to obtain a well-distributed and stable gas flow. The Witoszynski curve is obtained according to the described Equation (2):
R = R c / 1 [ 1 ( R c R i n ) 2 ] × ( 1 x 2 k 1 L 1 2 ) 2 ( 1 + x 2 k 2 L 1 2 ) 3
where Rin is the radius of the inlet, Rc is the radius of the nozzle throat, and Rx denotes the radius of the nozzle cross-section in any x along the convergence section. L1 is the length of the convergence section and coefficients k1 and k2 are used to describe the sharpness of the narrowing of the Witoszynski curve. In this paper, the values of k1 and k2 are in the range of 10–900 (Table 2). The choice is explained in Section 3.1.

2.2. Divergent Section

To select the geometry of the divergence section, a Quadratic Bezier curve was used to describe it [25]. The Quadratic Bezier curve can uniformly describe the most commonly used geometry of a divergence section and their variations in a convex parabola and cone.
Quadratic Bezier curve equation is defined by a set of control points P0, P1, and P2 through Pn, where n refers to the order of the curve (n = 1 for linear, 2 for quadratic, etc.). The first and last control points are always the endpoints of the curve; however, the intermediate control points generally do not lie on the curve. The equation of the quadratic Bezier curve is Equation (3):
P ( t ) = ( 1 t ) 2 P 0 + 2 t ( 1 t ) P 1 + t 2 P 2
where:
P 0 = ( x 0 , y 0 ) ,   P 1 = ( x 1 , y 1 ) ,   P 2 = ( x 2 , y 2 ) ,   t = ( 0 , 1 )
Given the coordinates of control points Pn, the first control point has coordinates P1 = (x1, y1), the second P2 = (x2, y2), etc., the curve coordinates are described by the equation that depends on the parameter t from the segment P0 = (0, Rc), P1 = (4, 2), and P3 = (L2, Rout).

3. Results and Discussion

3.1. Parametrization of the Nozzle Geometry

The de Laval nozzle is used to accelerate the powder coming out of the capillary, so the central part of the nozzle has a holder fixating the capillary tube in the central axis. The geometry calculations were carried out using COMSOL Multiphysics 5.6 software applying the formulas listed above.
The High Mach Number flow, Spalart-Allmaras (RANS model) interface is used for the proposed geometries calculation. Fully compressible Navier-Stokes equations are used for a simple compressible fluid. The physics interface assumes that the fluid is an ideal gas. This is necessary for the formulation of the Consistent Inlet and Outlet Conditions. The total pressure of the internal inlet is 1 bar, while the total pressure of the external inlet is 13 bar. Nitrogen dynamic viscosity, specific gas constant, and heat capacity at constant pressure are given as a piecewise function dependent on the temperature. Density as an analytic function is temperature-dependent. The viscosity and thermal conductivity of an ideal gas can be accurately approximated using Sutherland’s Law. Sutherland’s formula is an approximation for how the viscosity of gases depends on the temperature. This law is based on an idealized intermolecular-force potential. Nitrogen’s Sutherland constants are given in Table 1.
Table 1. Sutherland’s law parameters.
Temperature K For Dynamic ViscosityFor Thermal Conductivity
Dynamic Viscosity N · s / m 2 Sutherland Constant K Thermal Conductivity W / ( m · k ) Sutherland Constant K
T 0 μ 0 S μ k 0 S k
273 1.663 · 10 5 107 0.0242 150
The nozzle parameters used for the calculations and their limits are presented in Table 2. The parameter ranges listed in Table 2 were determined by the geometry limits. Parameter values out of the chosen ranges would cause geometry overlaps. The values for L1, L2, and Rin were chosen as they ensure the production of the most compact nozzle.
Variation steps for k1 and k2 were 10, for P1x–1 mm, for Rc, P1y, and Rout–0.1 mm for each test of the Witoszynski curve geometry. The total number of tests was 124. For each test of the Bicubic curve geometry, the variation steps were as follows: Xm–0.1, P1x–1 mm, Rc, P1y, and Rout–0.1 mm. The total number of tests was 124.
Table 2. Parameters used for numerical calculations.
Witoszynski CurveBicubic Parametric Curve
NameParameter RangesUnitsDescriptionNameParameter RangesUnitsDescription
Convergent Section
k110–900 Coef. describing the Witoszynski curveXm0.2–0.9 Bicubic parametric curve control point
k210–900
Rc0.8–1.5mmradius of the
nozzle throat
Rc0.8–1.5mmradius of the nozzle throat
L114mm L120mm
Rin10mm Rin10mm
Divergent Section
P1x3–5mmQuadratic Bezier control pointP1x3–5mmQuadratic Bezier control point
P1y1.6–2mmP1y1.6–2mm
Rout1.5–2.5mmradius of the
nozzle outlet
Rout1.5–2.5mm
L240mm L240mm
By changing the sets of parameters listed in Table 2, different gas flow parameters (velocity and pressure along the central axis of the nozzle) were calculated, as illustrated graphically in Figure 2. Figure 2 qualitatively illustrates the influence of different parameters of Witoszynski and Bicubic nozzle geometry on gas flow pressure and velocity. It can be observed from the graphs that Witoszynski and Bicubic geometries react differently to the change of parameters. Each variable is presented in Figure 2 by a family of curves.
Comparing the gas flow pressure shift of Witoszynski (Figure 2A) and Bicubic (Figure 2C) curve nozzle geometry, we see that the Witoszynski geometry responds to changes in parameters more than Bicubic. The Bicubic curve geometry proves to be very sensitive to the radius of the nozzle throat parameter, while the Witoszynski curve geometry shows a larger gas flow pressure drop in the capillary tube, a smoother transition between parameters, and lower fluctuations in the nozzle outlet. By comparing the velocity parameter shift of Witoszynski (Figure 2B) and Bicubic (Figure 2D) curve nozzle geometry, we see that Witoszynski geometry shows higher velocities in the capillary tube, but lower velocities in the divergent section and a sharper decay than the Bicubic curve geometry.
While trying to determine the optimal parameters for the convergent part of the Witoszynski curve nozzle, it was established that the coefficient k1 has a bigger impact on the gas flow velocity compared with k2. The optimal value k1 = 100 was chosen in consideration of sufficient gas flow velocity in the powder delivery capillary and little flow velocity fluctuations after exiting the nozzle outlet. When the said value is below 100, the flow velocity starts increasing inside the nozzle and decreases drastically upon exiting the outlet. When k1 > 100, the gas flow in the capillary decreases rapidly resulting in less efficient powder delivery. Similar gas flow dependence on the value of the coefficient k2 can be observed, and the optimal value for k2 is the same as k1 (k2 = 100).
While trying to determine the optimal parameters for the convergent part of the Bicubic curve nozzle, it was established that the coefficient Xm and the coefficients k1 and k2 in the Witoszynski case have a similar effect on the gas flow velocity. The optimal value for the coefficient Xm is 0.7. When Xm < 0.7, gas flow increases inside the capillary but decreases in the divergent zone and at the outlet. Similar results are observed when Xm > 0.7.
The radius of the thinnest part of the de Laval geometry (Rc) is 1 mm. The same value was chosen for both Witoszynski and Bicubic curve nozzles. When Rc < 1, gas flow increases inside the capillary but decreases at the outlet. When Rc > 1, gas flow velocity maintains stability for a longer time upon exiting the outlet. However, flow velocity in the capillary decreases rapidly and negatively affects the efficiency of powder delivery.
The parameters for the divergence part of the nozzle were chosen the same for Witoszynski and Bicubic curve nozzles, except for the parameter P1y. It was determined from CFD calculations that the gas flow is less turbulent when the P1y value is 1.7 mm for Witoszynski and 2.0 mm for Bicubic.
It is suspected that the difference is due to an uneven narrowing of the convergent part in the Witoszynski and Bicubic curves; in the case of Witoszynski it has a constant tapered form, in the case of the Bicubic it has a sudden narrowing. The radius of the nozzle outlet (Rout) determines gas flow velocity of the divergent part of the nozzle. The highest flow velocity is observed when Rout = 2 mm. When Rout < 2 mm, velocity increases inside the nozzle but sharply decreases at the outlet. When Rout > 2 mm, the drop in gas flow velocity inside the capillary is significantly larger compared to the optimal Rout value.

3.2. Determination of the Nozzle Geometry

The criteria for the optimum of a nozzle are the maximum gas flow velocity at the critical distance (from the nozzle outlet to the substrate) and the minimum pressure at the end of the capillary. One Witoszynski and one Bicubic curve corresponding to these criteria were used to choose an optimal geometry for the nozzle development. Curve parameter values obtained from numerical calculations are listed in Table 3.
To choose which nozzle geometry to use, a comparison of velocity and pressure has been carried out. Calculation results of the central nozzle axis are provided in Figure 3. The flow is accelerated in the convergent section of the nozzle and a velocity of 180–200 m/s is reached in Witoszynski and Bicubic curve nozzles (Figure 3A). Upon entering the divergent section, the flow is accelerated to 640 m/s in the Witoszynski and 700 m/s in the Bicubic curve nozzle. Velocities in the same range (600–1000 m/s) are used in extremely high speed laser metal deposition technologies [9]. When the flow reaches the nozzle outlet, a decrease of its velocity can be observed from the graph. The critical distance from the nozzle outlet to the substrate is 20 mm and it is crucial to maintain an accelerated and stable particle flow until the particles reach the surface.
The average flow velocity in the critical distance after exiting the outlet of the Bicubic curve nozzle is around 615 m/s. For the Witoszynski curve nozzle, the velocity is around 435 m/s. Fluctuations in velocity can be observed in both nozzles upon exiting the outlet. Despite being more apparent in the Bicubic curve nozzle, the average flow velocity is maintained higher in the distance from the outlet to the critical 20 mm point compared to the Witoszynski curve nozzle.
To ensure high flow velocity and avoid particle clogging, it is crucial to create subatmospheric pressure. Said subatmospheric pressure is achieved at the end of the capillary, as seen in Figure 3B. After this point, a rapid increase of pressure helps accelerate the particle flow in the divergent section of the nozzle. It can be seen from the graphs in Figure 3B that the pressure drop for the Witoszynski curve geometry is larger compared with the Bicubic. However, the pressure drop difference is not as significant as the difference in gas flow velocity. Thus, the Bicubic curve geometry is more suitable for the laser-assisted metal deposition application.

3.3. Particle Beam Formation

Particle tracing for fluid flow interface is used to simulate the motion of particles in a background fluid. We are specifying the particle density and diameter in our numerical calculation. It is known that the velocity decreases with the increase of particle size. Three different sizes of copper particles are used in our simulation: 1 μm, 10 μm, and 40 μm (Figure 4). The 1 μm particle was chosen as a particle with maximum velocity, 10 μm with half velocity, and 40 μm with low velocity. Particles larger than 40 μm have similar low velocity as well; therefore, 40 μm was chosen as the maximum particle size.
Particle release and propagation formulation is Newtonian. When particles contact with a wall, we can determine the bounce wall condition, where kinetic energy of the particles is conserved and the particles specularly reflect from the wall. Two forces are used on particles in a fluid: drag force and lift force. The drag force is defined as the Stokes drag law:
F d = ( 1 τ p ) m p ( u v )
where τ p is the particle velocity response time, v is the velocity of the particle, and u is the fluid velocity as the particle’s position. The validity of a given drag law depends on the relative Reynolds number and the particle velocity response time:
R e r = ρ | u v | d p μ
τ p = 4 ρ p d p 2 3 μ C d R e r
The standard drag correlation is used in our simulation with defined drag coefficient as a piecewise function of the relative Reynolds number, which can reach up to 1.6 · 10 4 in our numerical calculation. The drag coefficient for Reynolds number in the range of 1.2 · 10 4 < R e r 4.4 · 10 4 is defined as:
l o g C d = 1.9181 + 0.6370 w 0.0636 w 2
where d p is the particle diameter, ρ p is the density of the fluid, and μ is the dynamic viscosity of the fluid.
Fluid flow in our system is nonuniform because we assume to add lift force on particles in a fluid. The wall-induced lift force in Newtonian formulations is applied to account for the effects of the nearby walls as particles move through the channel. The wall-induced lift force FL is given by:
F L = ρ r p 4 D 2 β ( β G 1 ( s ) + γ G 2 ( s ) ) n
where:
β = | D ( n · ) u p |
γ = | D 2 2 ( n · ) 2 u p |
u p = ( I ( n n ) ) u
In Equation (8) r p is the particle radius, u is the fluid velocity, I is the identity matrix, n is the wall normal at the nearest point on the reference wall, D is the distance between the channel walls, s is the distance from the particle to the reference wall, and G 1 and G 2 are functions of the nondimensionalized wall distance s . The number of particles used in the simulation is 3 × 10³ (three particles are released into the modeling domain every 10 ns). The difference between the highest and lowest values of the particle‘s size in our investigation is greater than 10 μm (from 1 to 40 μm). When statistical analysis is applied to particle size distributions, it is routinely based on lognormal distributions, where the data range of the particle’s size is greater than about 10 μm. There is no real theoretical reason as to why lognormal distribution is used in this case, it is merely empirically the best fit. The number of particles released at the same time is based on the geometric standard deviation of the lognormal distribution. The diameter of the circle channel in our investigation is 410 μm. In the ideal case, nine particles with the diameter of 40 μm can be released at the same time. According to the lognormal distribution, a more statistical case would be six particles at the same time. CFD and particle tracing module used the plane symmetry geometry, as shown in Figure 4. It means that half of the maximum possible particle numbers can be released at the same time. We are assuming three particles for the largest particle size.
The particle velocity magnitude and trajectory dispersion for three different particle sizes, i.e., 1 μm, 10 μm and 40 μm, are shown in Figure 4. Large datasets of particle trajectories are visualized as a phase portrait to plot the particle position on the X-Y axes and colors represent the response time of the particle velocity. Fine particles have a shorter response time, and therefore, a smaller dispersion area. By default, the position of the particle is taken as the distance from the origin (0, 0).
As can be seen in Figure 4, the dispersion of 10 µm particles is about 3.5 mm. For comparison, the already-existing results of cold spray nozzles with a centered particle beam have a dispersion from 3.5 to 7.0 mm for 20 µm particles [14]. Here, the researchers developed a nozzle with a centered particle beam; however, the particles enter the nozzle in the convergent zone. As a result, particles reach a higher velocity (471 m/s for 20 µm particles) and can cause erosion at the nozzle throat. Although the nozzle proposed in our paper has a lower particle beam velocity (360 m/s for 10 µm particles), it has a smaller particle trajectory dispersion. Additionally, due to the particles entering the nozzle in the divergent zone, the throat erosion is eliminated.
The developed fluid model was applied for the evaluation of particle impact velocities. Particle tracing trajectory model was coupled with a high Mach number flow interface. The results of CFD simulation allowed to generate required velocities for differently sized powder particles. Figure 5 presents particle velocity before contact with substrate obtained for particles with different diameters (1, 5, 10, 20, 30, 40, 70, and 100 μm).

3.4. Particle-Substrate Impact Analysis

Deformation behavior of particle impacting substrate is a very important point of the laser-assisted metal deposition technology process. For this reason, we provide a series of numerical experiments with copper particles impacting copper substrate with prescribed velocities, as shown in Figure 5.
A characteristic feature of the contact analysis is that contact between the micrometer-scale particles and the flat metal surfaces is investigated at high velocities ranging from 229 to 668 m/s, resulting in characteristic strain rates from 2.3 × 10⁶ s−1 to 6.68 × 10⁸ s−1, respectively.
A numerical particle-substrate impact experiment is conducted in the following manner. The micron-sized copper particle is represented by the sphere of radius r striking the plane surface of the solid copper substrate with impact velocity vim. Simulation of a particle impacting the substrate is formulated as an elastic-plastic interaction of two solid bodies under high velocities.
The yielding of metals is defined by the von Mises yield criterion limiting stress values, where the stress level is defined by a material constant—the yield stress σ y . In case of high velocities, yield stress is a quantity dependent not only on strain, but also on strain rate and temperature. A review of common plasticity models can be found in [26]. The emphasis on strain rate-dependent models is given in review paper [27].
The plasticity model is the product of three functions expressing strain hardening, strain rate hardening, and thermal softening. The first function σ 0 s ( ε ) reflects isotropic strain hardening, referred to as the Ludwik plasticity model [28]. It represents a classical yield criterion and describes an increase of initial yield strength σ 0 due to plastic strain:
σ 0 s ( ε ) = σ 0 + B ε n .
where B is the strain hardening coefficient, ε is the equivalent plastic strain, and n is the strain hardening exponent.
For the evaluation of the strain rate, Cowper-Symonds [29] and Johnson-Cook [30] models are commonly used. The increasing contribution of the strain rate is better described by exponential model; therefore, the Cowper-Symonds model was used:
g ( ε ˙ ) = 1 + D ( ε ˙ ε ˙ 0 ) k
where D is the strain rate hardening coefficient, ε ˙ is the strain rate, ε ˙ 0 is the reference strain rate, and k refers to the strain rate hardening exponent.
An empirical model of Johnson-Cook [30] was used in order to predict the dependence of the material yielding on the material temperature:
h ( T ) = 1 ( T * ) m
where m refers to the temperature softening exponent, and T * is a relative temperature change calculated as:
T * = T T r e f T m e l t T r e f
where T is material temperature, Tmelt is the melting temperature, Tref is the reference/room temperature.
Combining the particular models defined by Equations (9)–(12) leads to the final expression of the yield criterion:
σ y ( ε ,   ε ˙ ,   T ) = ( σ 0 + B ε n ) ( 1 + D ( ε ˙ ε ˙ 0 ) k ) ( 1 ( T * ) m )
The relationship in Equation (13) expresses a rather general variation of the yield strength that is further applied in the contact analysis.
The mathematical model of the impact problem combines a dynamic equation of motion and heat transfer. The coupled non-linear thermo-mechanical problem is formulated on the basis of the Lagrangian approach. Coupling is governed by the bilateral contribution; additional heat due to plastic dissipation contributes to the heat balance, while the change of mechanical properties due to temperature shifts contributes to the dynamic behavior. Previous research has shown that the fraction η of dissipate energy converted to heat reaches 0.9 in the case of a plastically deformed system [31].
The above-described thermomechanical model was implemented in the COMSOL Multiphysics finite element software. During the simulation, the analysis of the normal contact begins at zero time instant of the local time scale with the impact velocity vimp. It continues to follow numerical motion and deformation of the particle and substrate during the loading until maximum indentation. As a result, the state of the deformed metallic particle and substrate undergoes changes through elastic-plastic deformation until full yielding. Simulation ends after unloading until full detachment.
The copper material parameter values for Ludwik and Johnson-Cook models were selected from particle impact simulations of [32,33]. Full list of material parameters used in this paper are presented in Table 4.
The impact problem is described in Cartesian coordinates, the origin of which is located in the center of a spherical particle. The particle moves along the vertical axis Oy and impacts the surface. Since normal impact is considered, particle rotation is ignored and 2D axisymmetric model is used to simplify the simulation of the particle impacting the wall in the normal direction. A mesh consisting of 12k triangular quadratic serendipity elements was used for the simulation.

3.5. Coefficient of Restitution

The main results of numerical simulations are characterized by the coefficient of restitution (COR) and substrate indentation. The COR is defined as a ratio between the rebound and impact velocities (here, the average velocity of particle mass after rebound obtained by CFD simulation is considered as the rebound velocity). The energetic interpretation of COR is used to define the loss of energy during the impact. The experimental results presented in [34] show that the decreasing of COR below 0.1 leads to the particle sticking to the substrate. Our obtained variation of COR of different diameter particles is shown in Figure 6. COR has the highest value for the particle diameter of 30 μm. Smaller particles have a higher velocity, which reduces COR due to the increase in kinetic energy of the impact. Particles larger than 30 μm reduce COR due to their increased mass.
Nondimensional indentation is defined as a ratio of the indentation of substrate and the impacting particle diameter. It shows the scalability of the model for differently sized particles. The main advantage of using this parameter is that it is an experimentally observable parameter independent from particle sticking or rebound [35]. Nondimensional indentation shown in Figure 7 closely resembles the particle velocity graph (Figure 5). However, the difference between these graphs is that while particle velocity slightly decreases with particle size, while indentation slightly increases for particle sizes above 40 μm.
The graphs plotted in Figure 6 and Figure 7 allow to distinguish two regions of particle size. The first region varying between 1 to 30 μm illustrates strong variation of indentation dependent on the particle size. The second region varying between 30 to 100 μm is practically insensitive to particle diameter. Consequently, the three impacts of particle diameter, 1, 30, and 100 μm, representing the region boundaries, are further discussed.
The color plot of the induced plastic strain is shown in Figure 8, whereas the resulting temperatures are presented in Figure 9. For the first region, with an increase of particle diameter, a considerable reduction of strain is observed (Figure 8a), whereas the variation of plastic strain in the second region is indistinguishable (Figure 8b,c).
The plot shown in Figure 9 illustrates the particle size-dependent temperature distribution. The temperature in small particles has enough time to permeate the material during contact, while larger particles display more localized temperatures that closely resembles strain distribution.
The obtained results were compared to experimental and simulation results presented by [34]. Our results indicate stiffer response, characterized by higher strain rate-dependent yield strength values. This difference may be explained by using different experimental data for the plasticity model calibration. Our model data are based on the experimental data of Hassani [36], while in Razavipour [34], lower values of yield strength are reported as compared to Tong [37] and Meyers [38].

4. Conclusions

Based on the numerical simulation results, the new suggested laser-assisted metal deposition system potential abilities of particle deposition, the following conclusions are formulated:
  • A comparison of the geometry of Bicubic and Witoszynski nozzles showed that the nozzle with the Bicubic curve geometry reaches a higher maximum velocity at the nozzle outlet. Moreover, Bicubic curve geometry has less apparent velocity fluctuations than the nozzle with the Witoszynski curve geometry. For these reasons, the nozzle with the Bicubic curve was most suitable for our further study.
  • It was found that the geometry of the nozzle described by the Bicubic curve allows to reach the higher maximum velocity at the nozzle outlet compared to that of the Witoszynski curve. Moreover, the bicubic curve geometry has less apparent velocity fluctuations than the nozzle with the Witoszynski geometry.
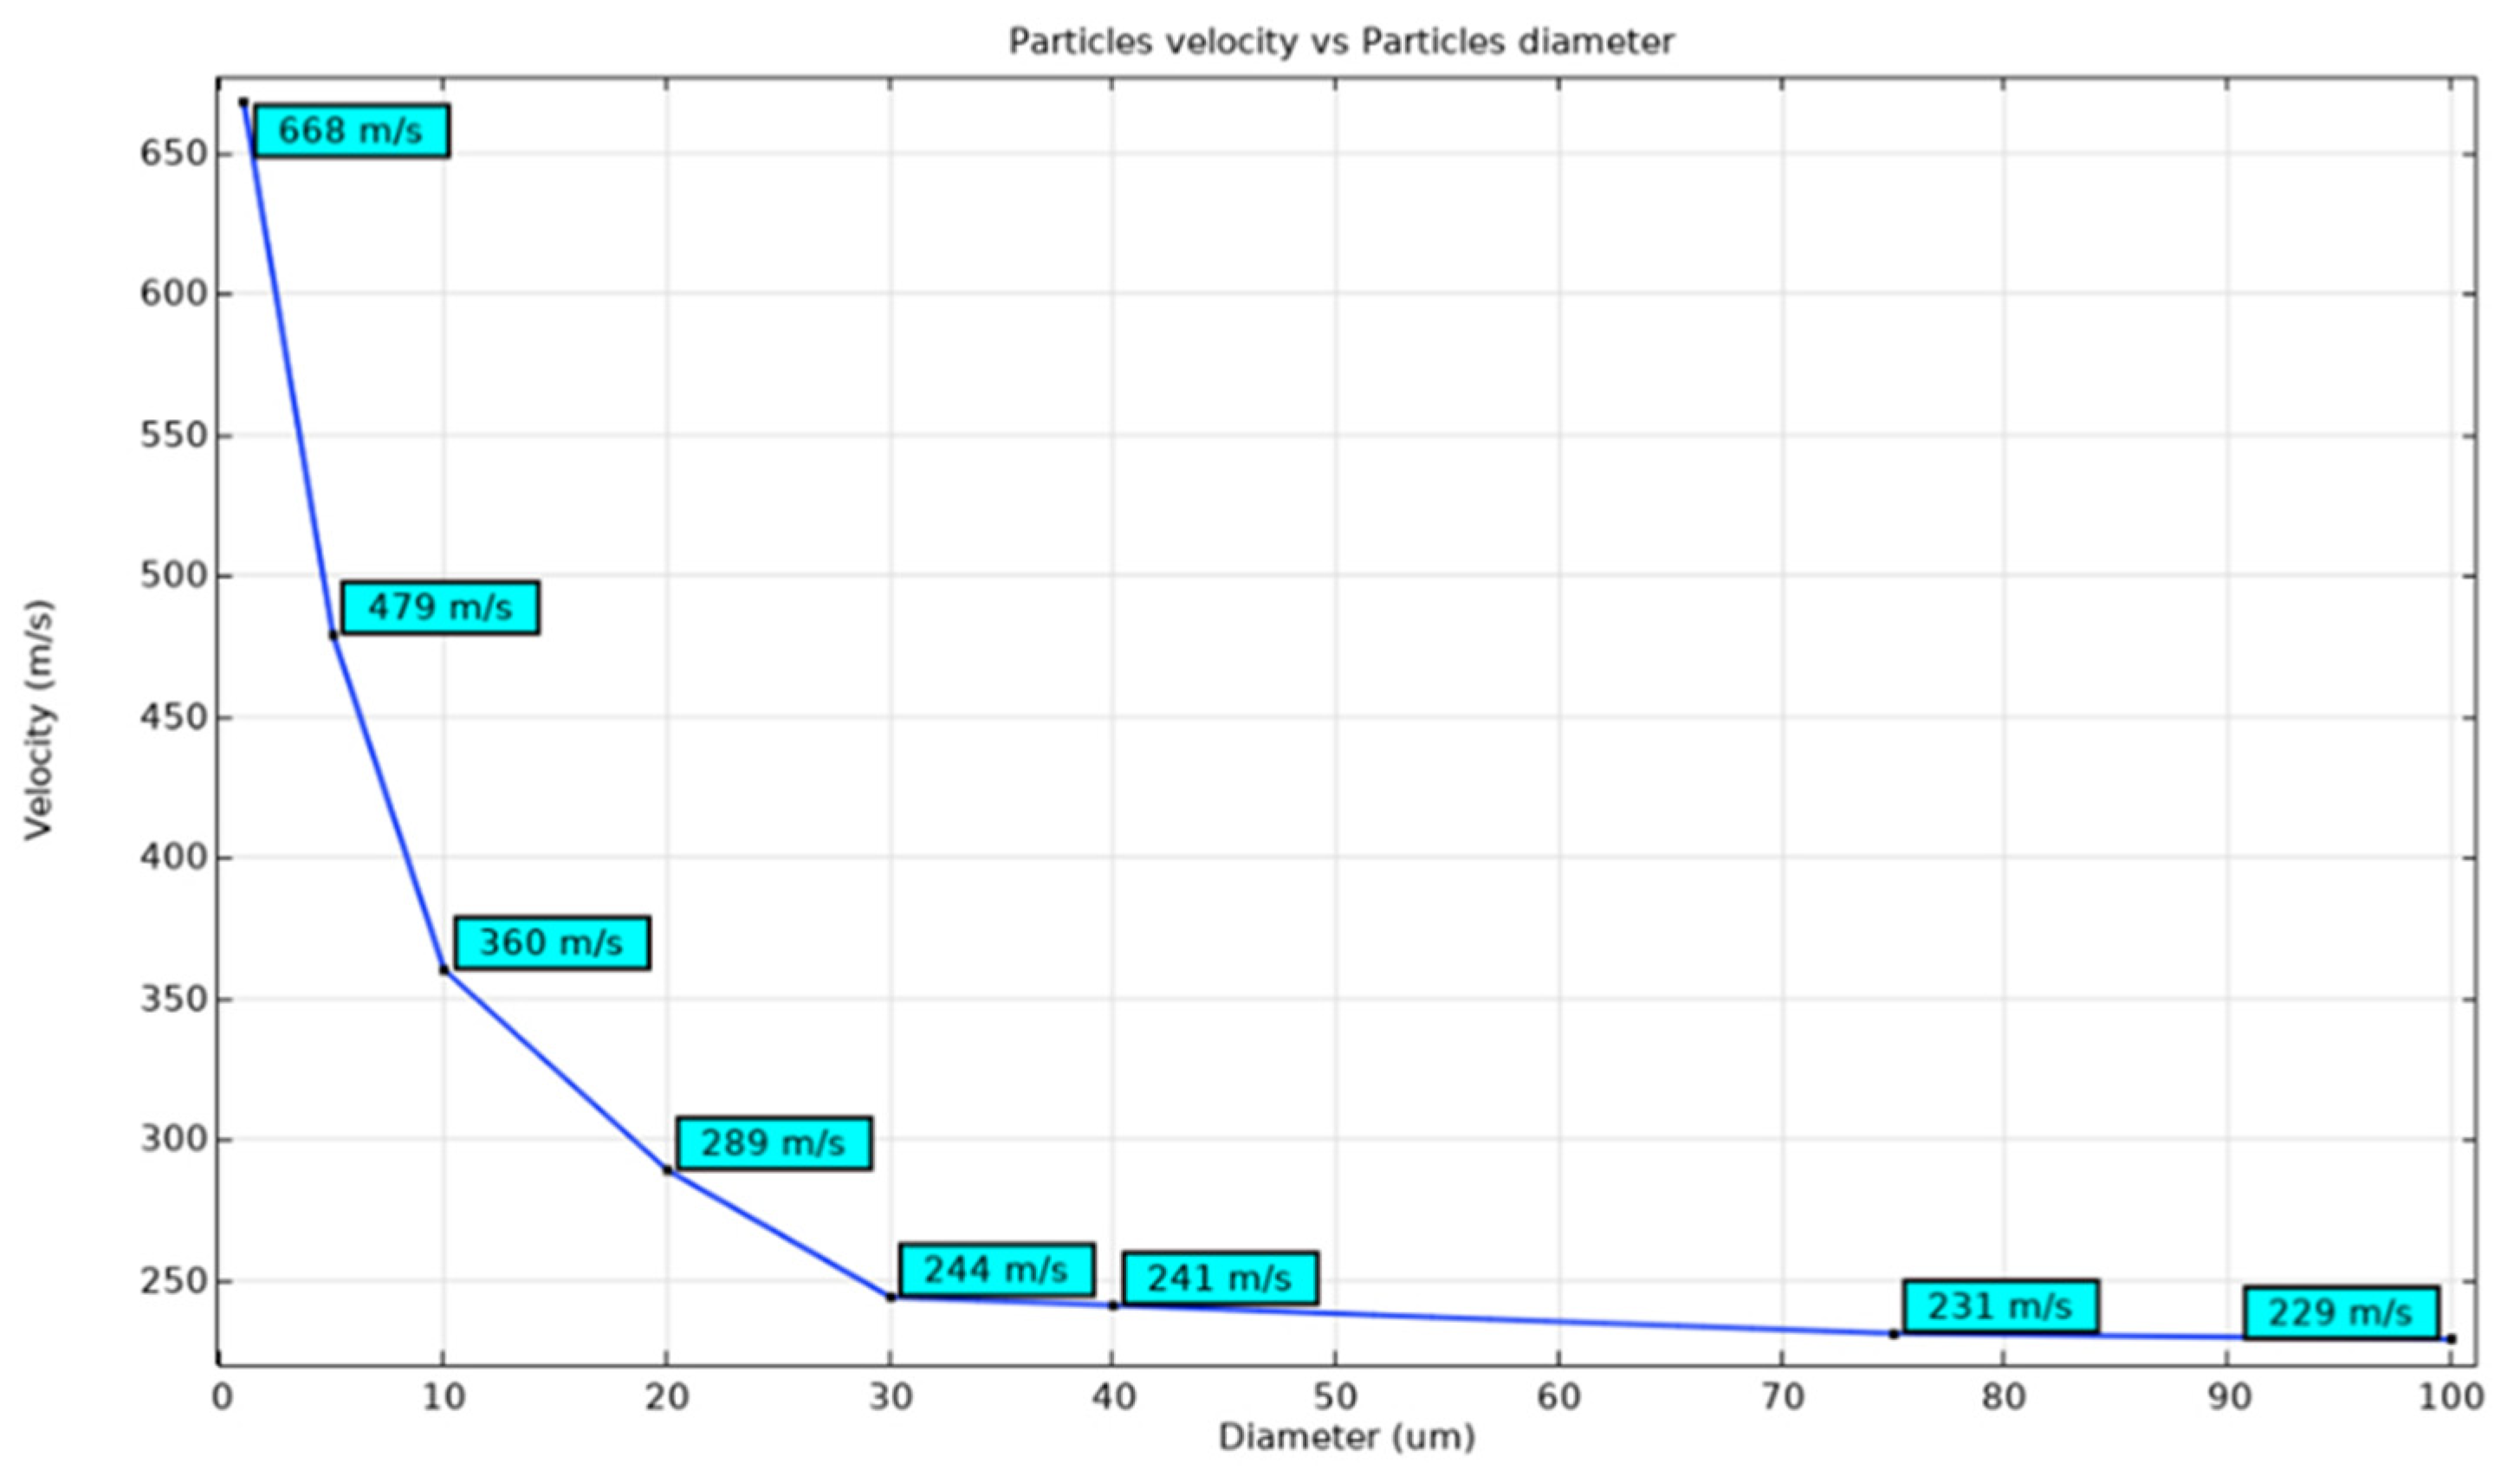
  • The results of CFD simulation allowed us to evaluate limitations of the designed nozzle to generate required deposition velocities for differently sized powder particles.
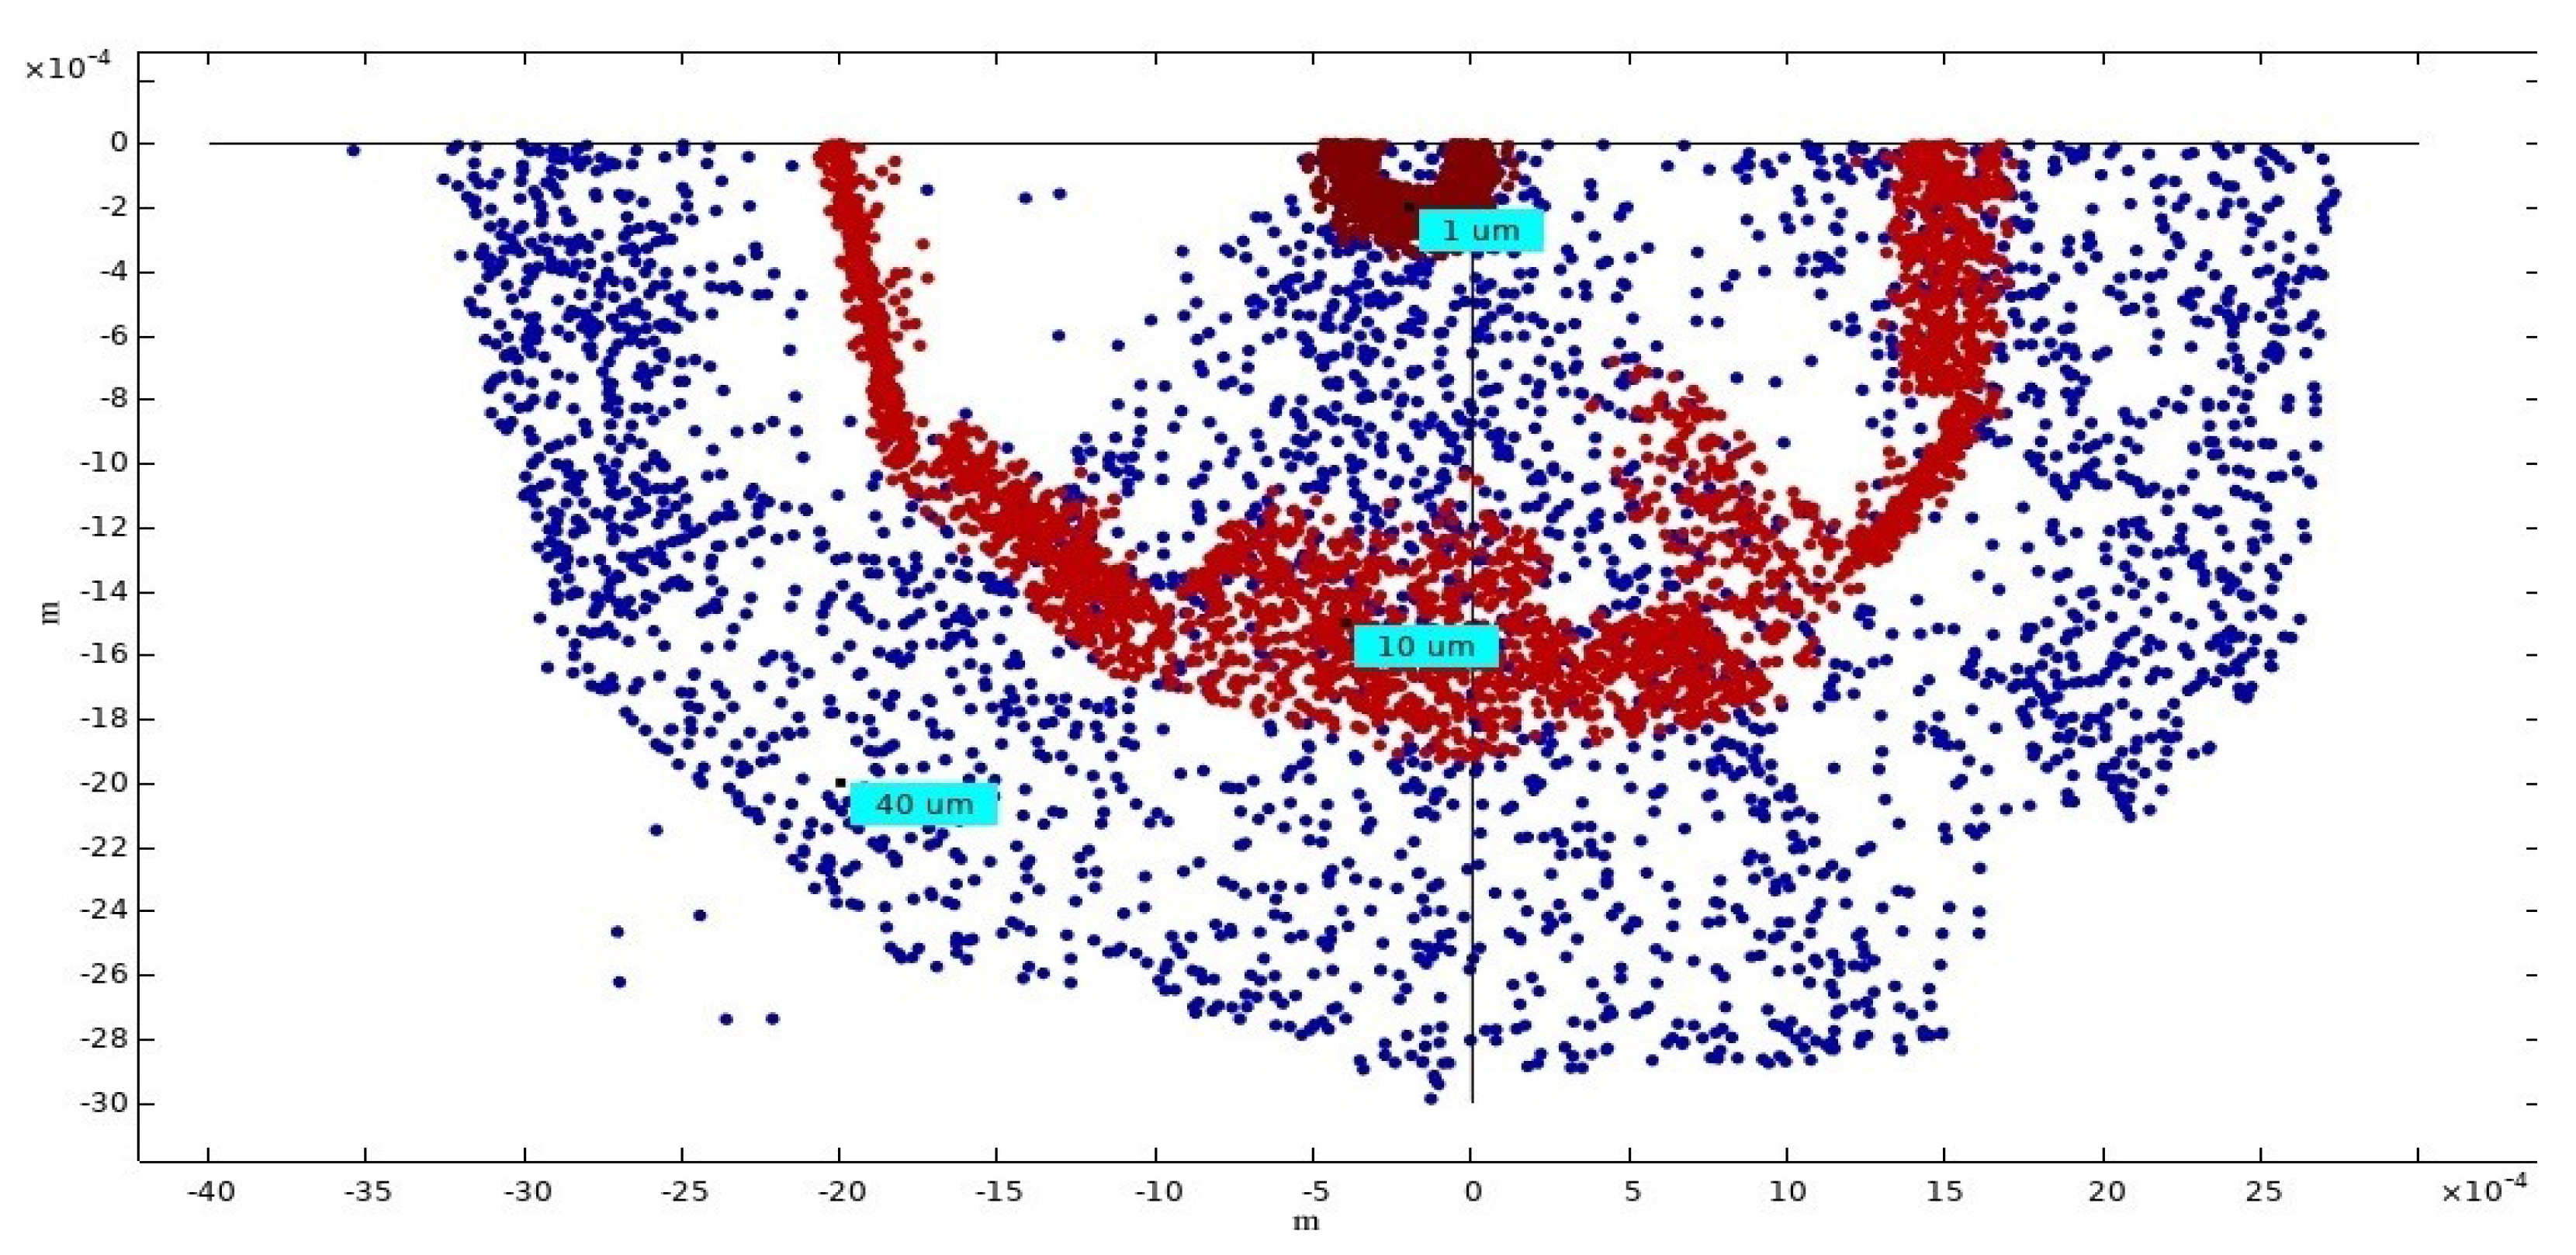
  • The results obtained revealed that small particles have the highest velocity and the lowest total force at the outlet of the nozzle. Fine particles have a shorter response time, and therefore, a smaller dispersion area.
  • It was determined that particles with a diameter limited up to 3 μm are able to reach experimentally obtained critical velocity without additional heating. The remainder of particle sizes requires additional energy for sticking. These impact velocity results were further applied by simulating the particle-substrate interaction. It was found that for particle sizes above 10 μm, additional heating is needed; therefore, future investigation of laser heating is necessary.
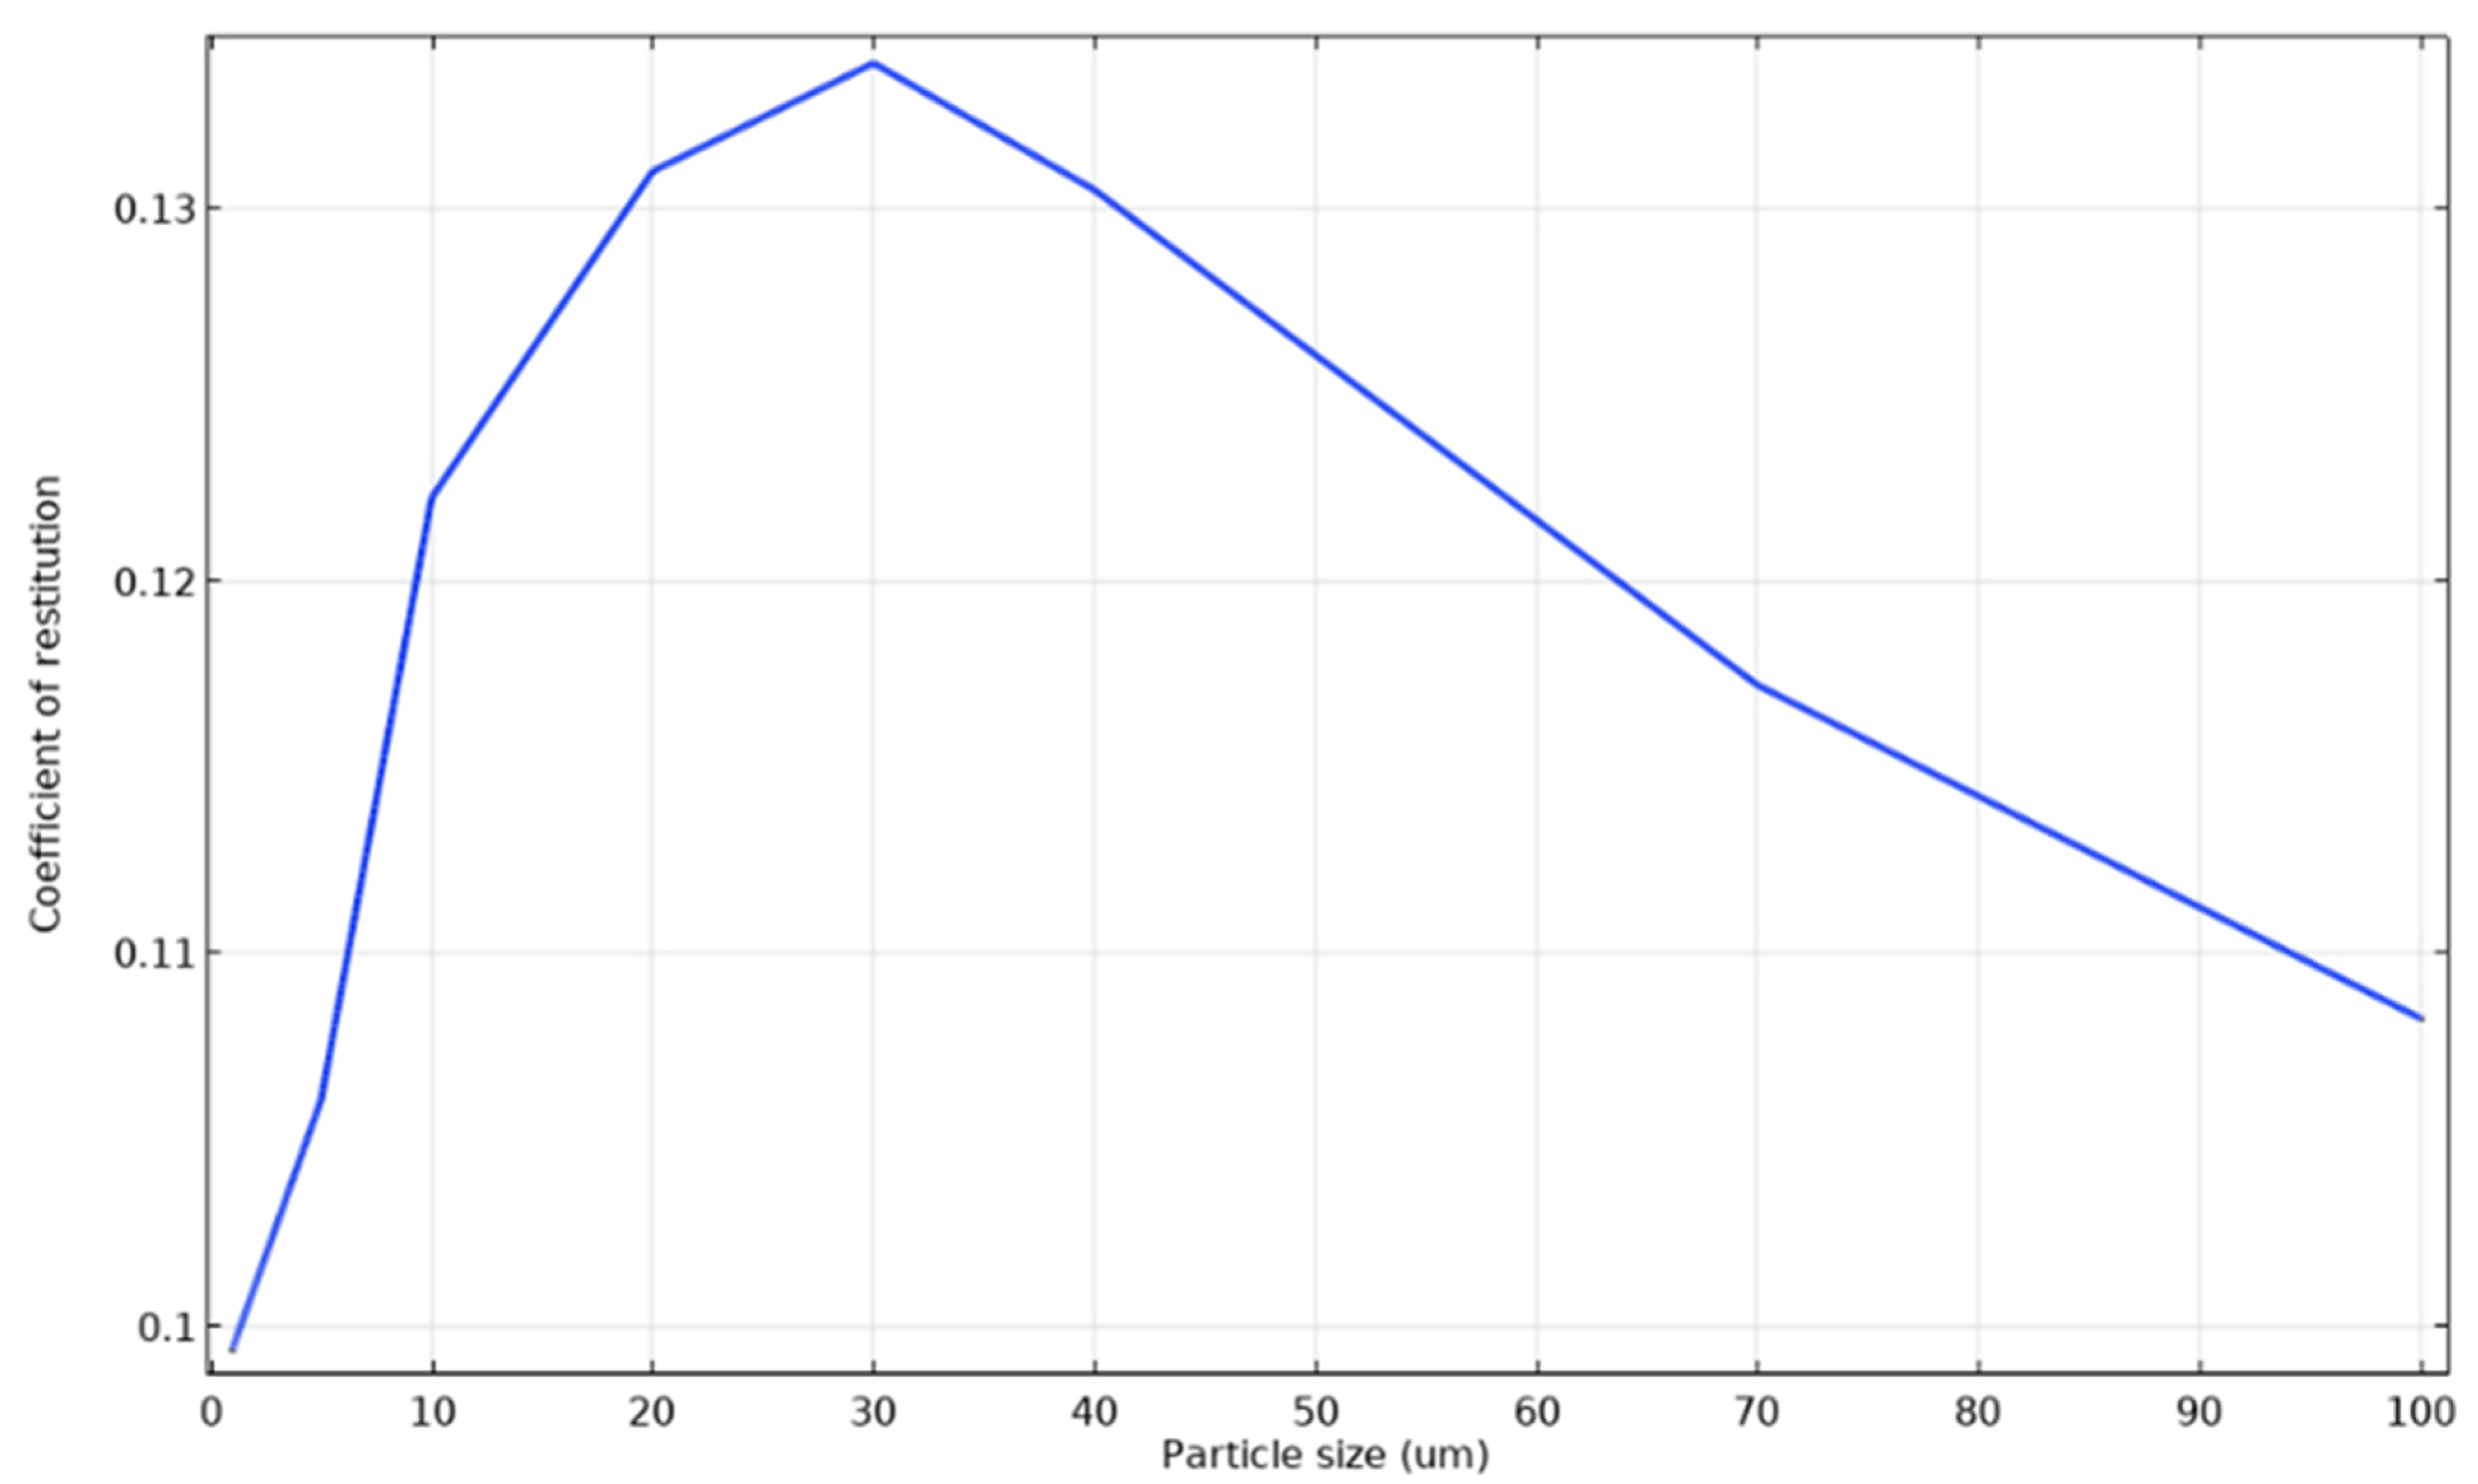
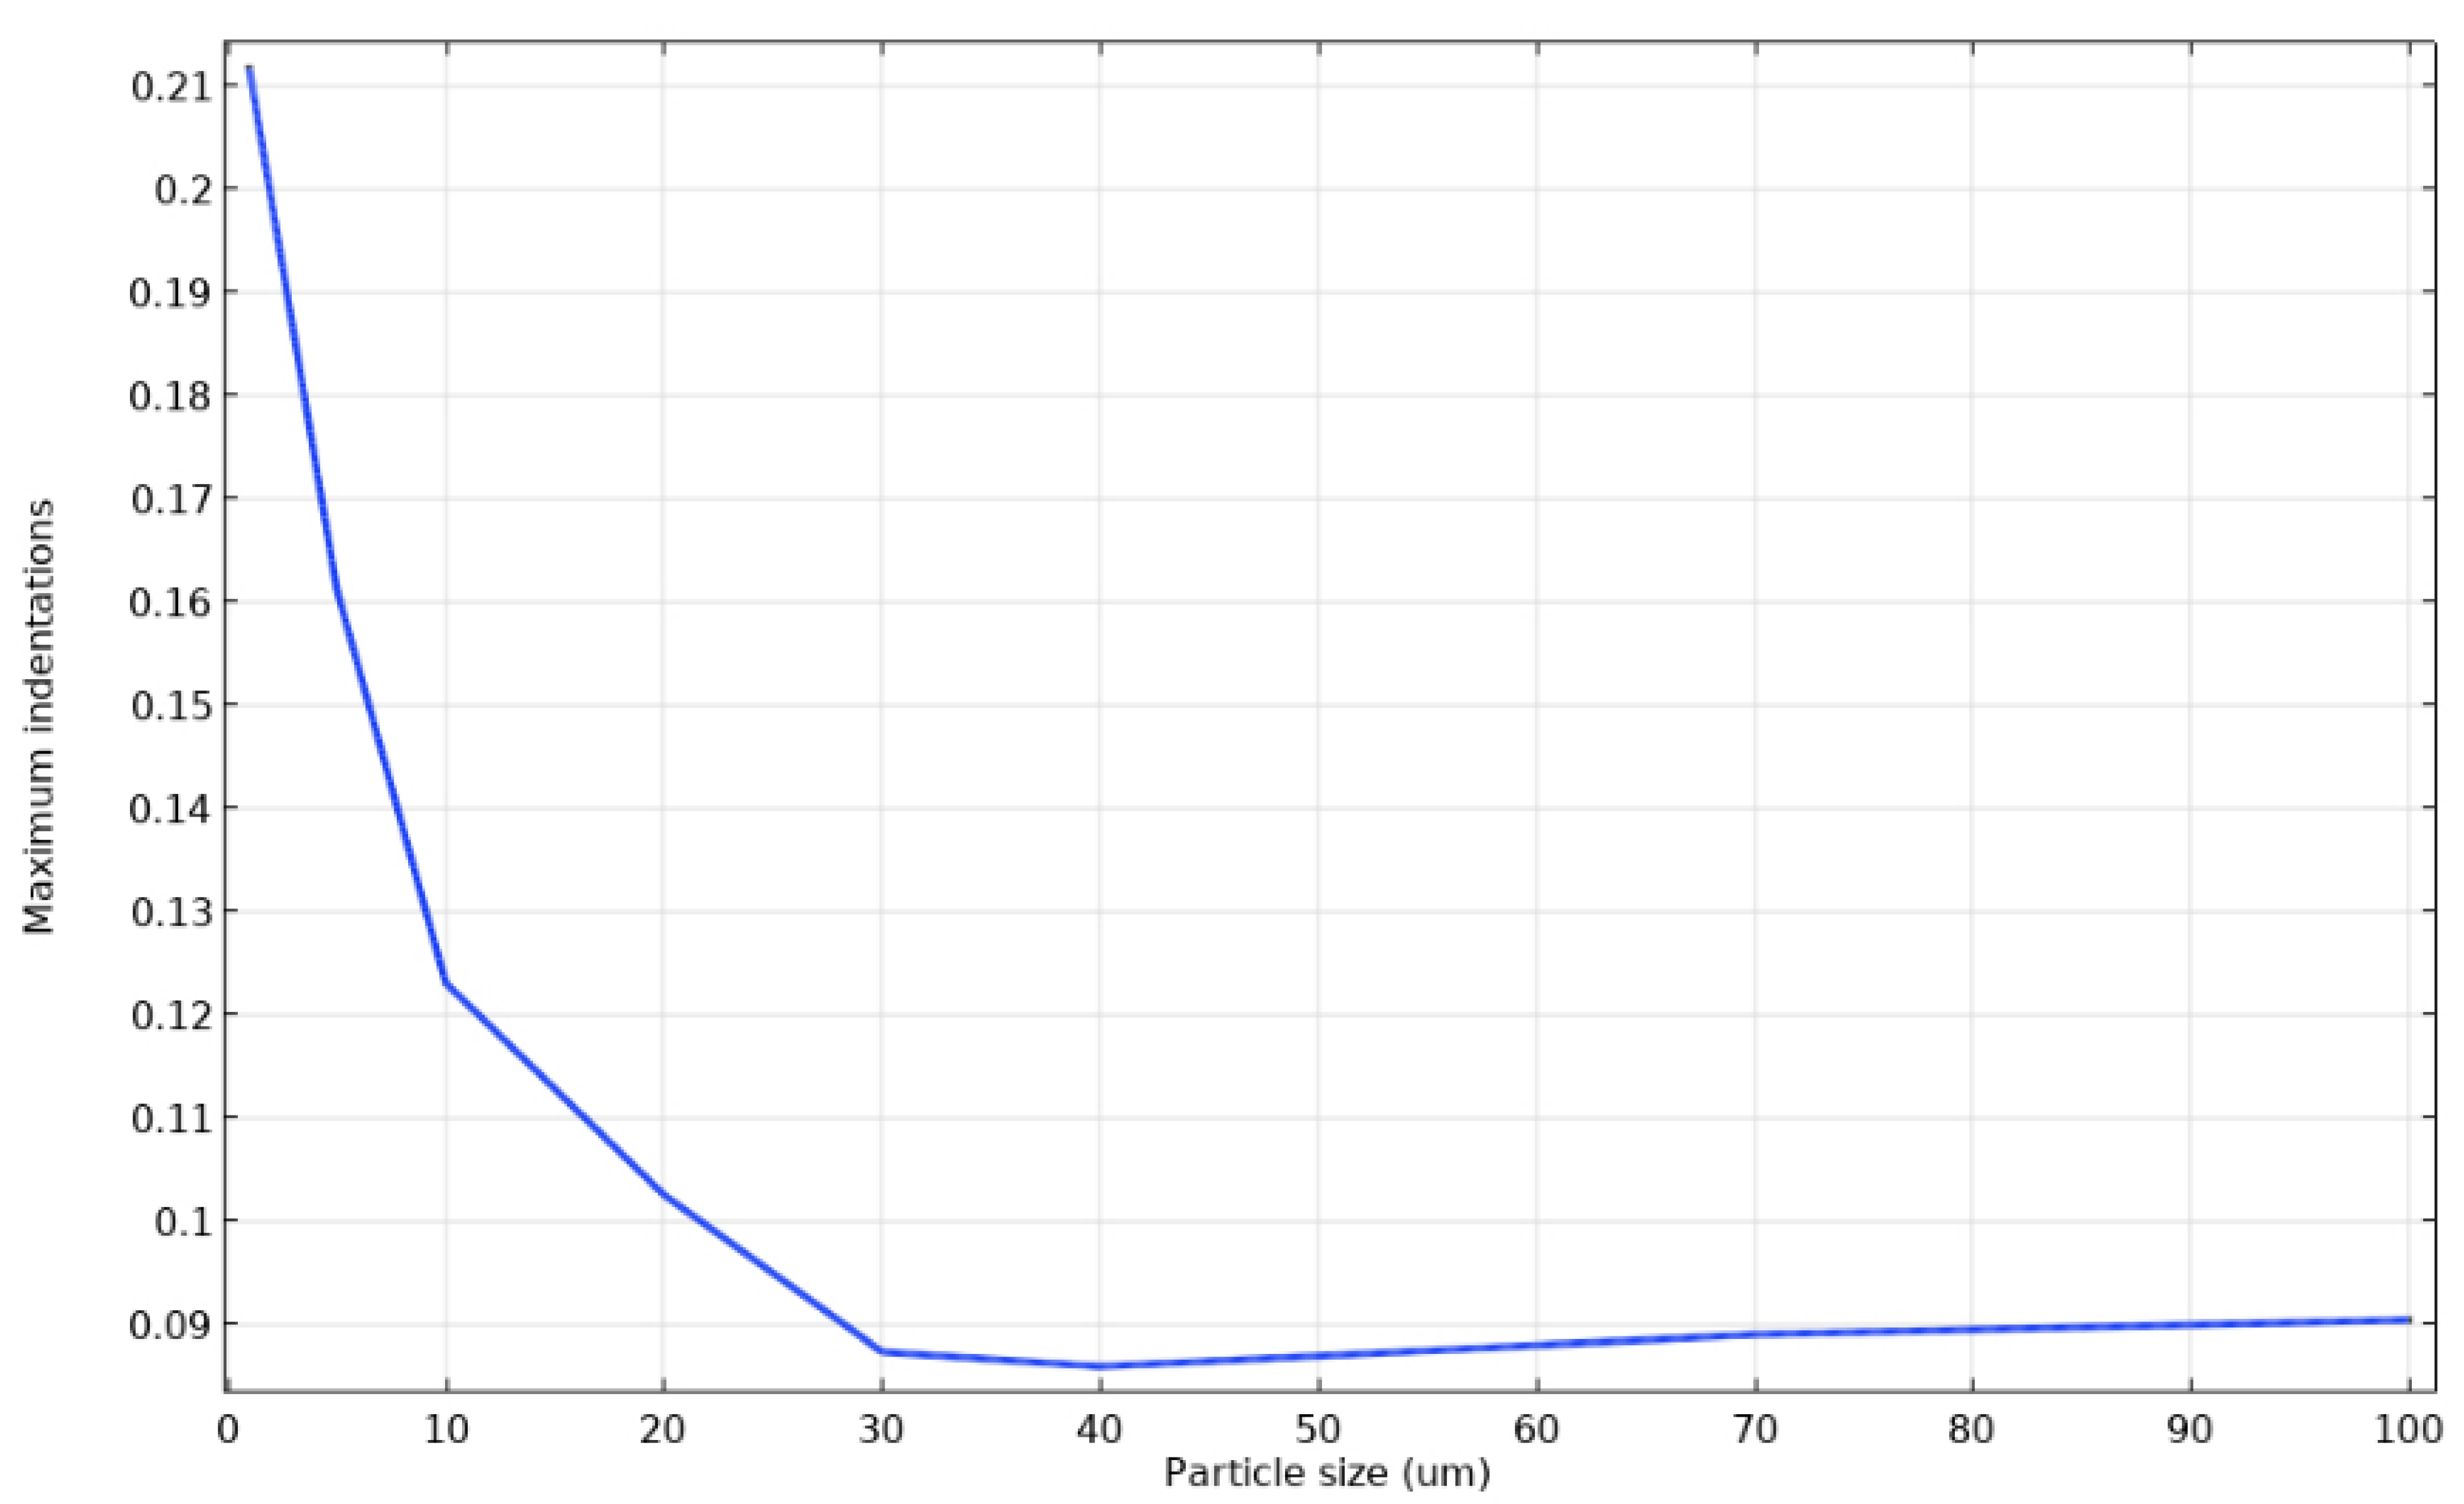
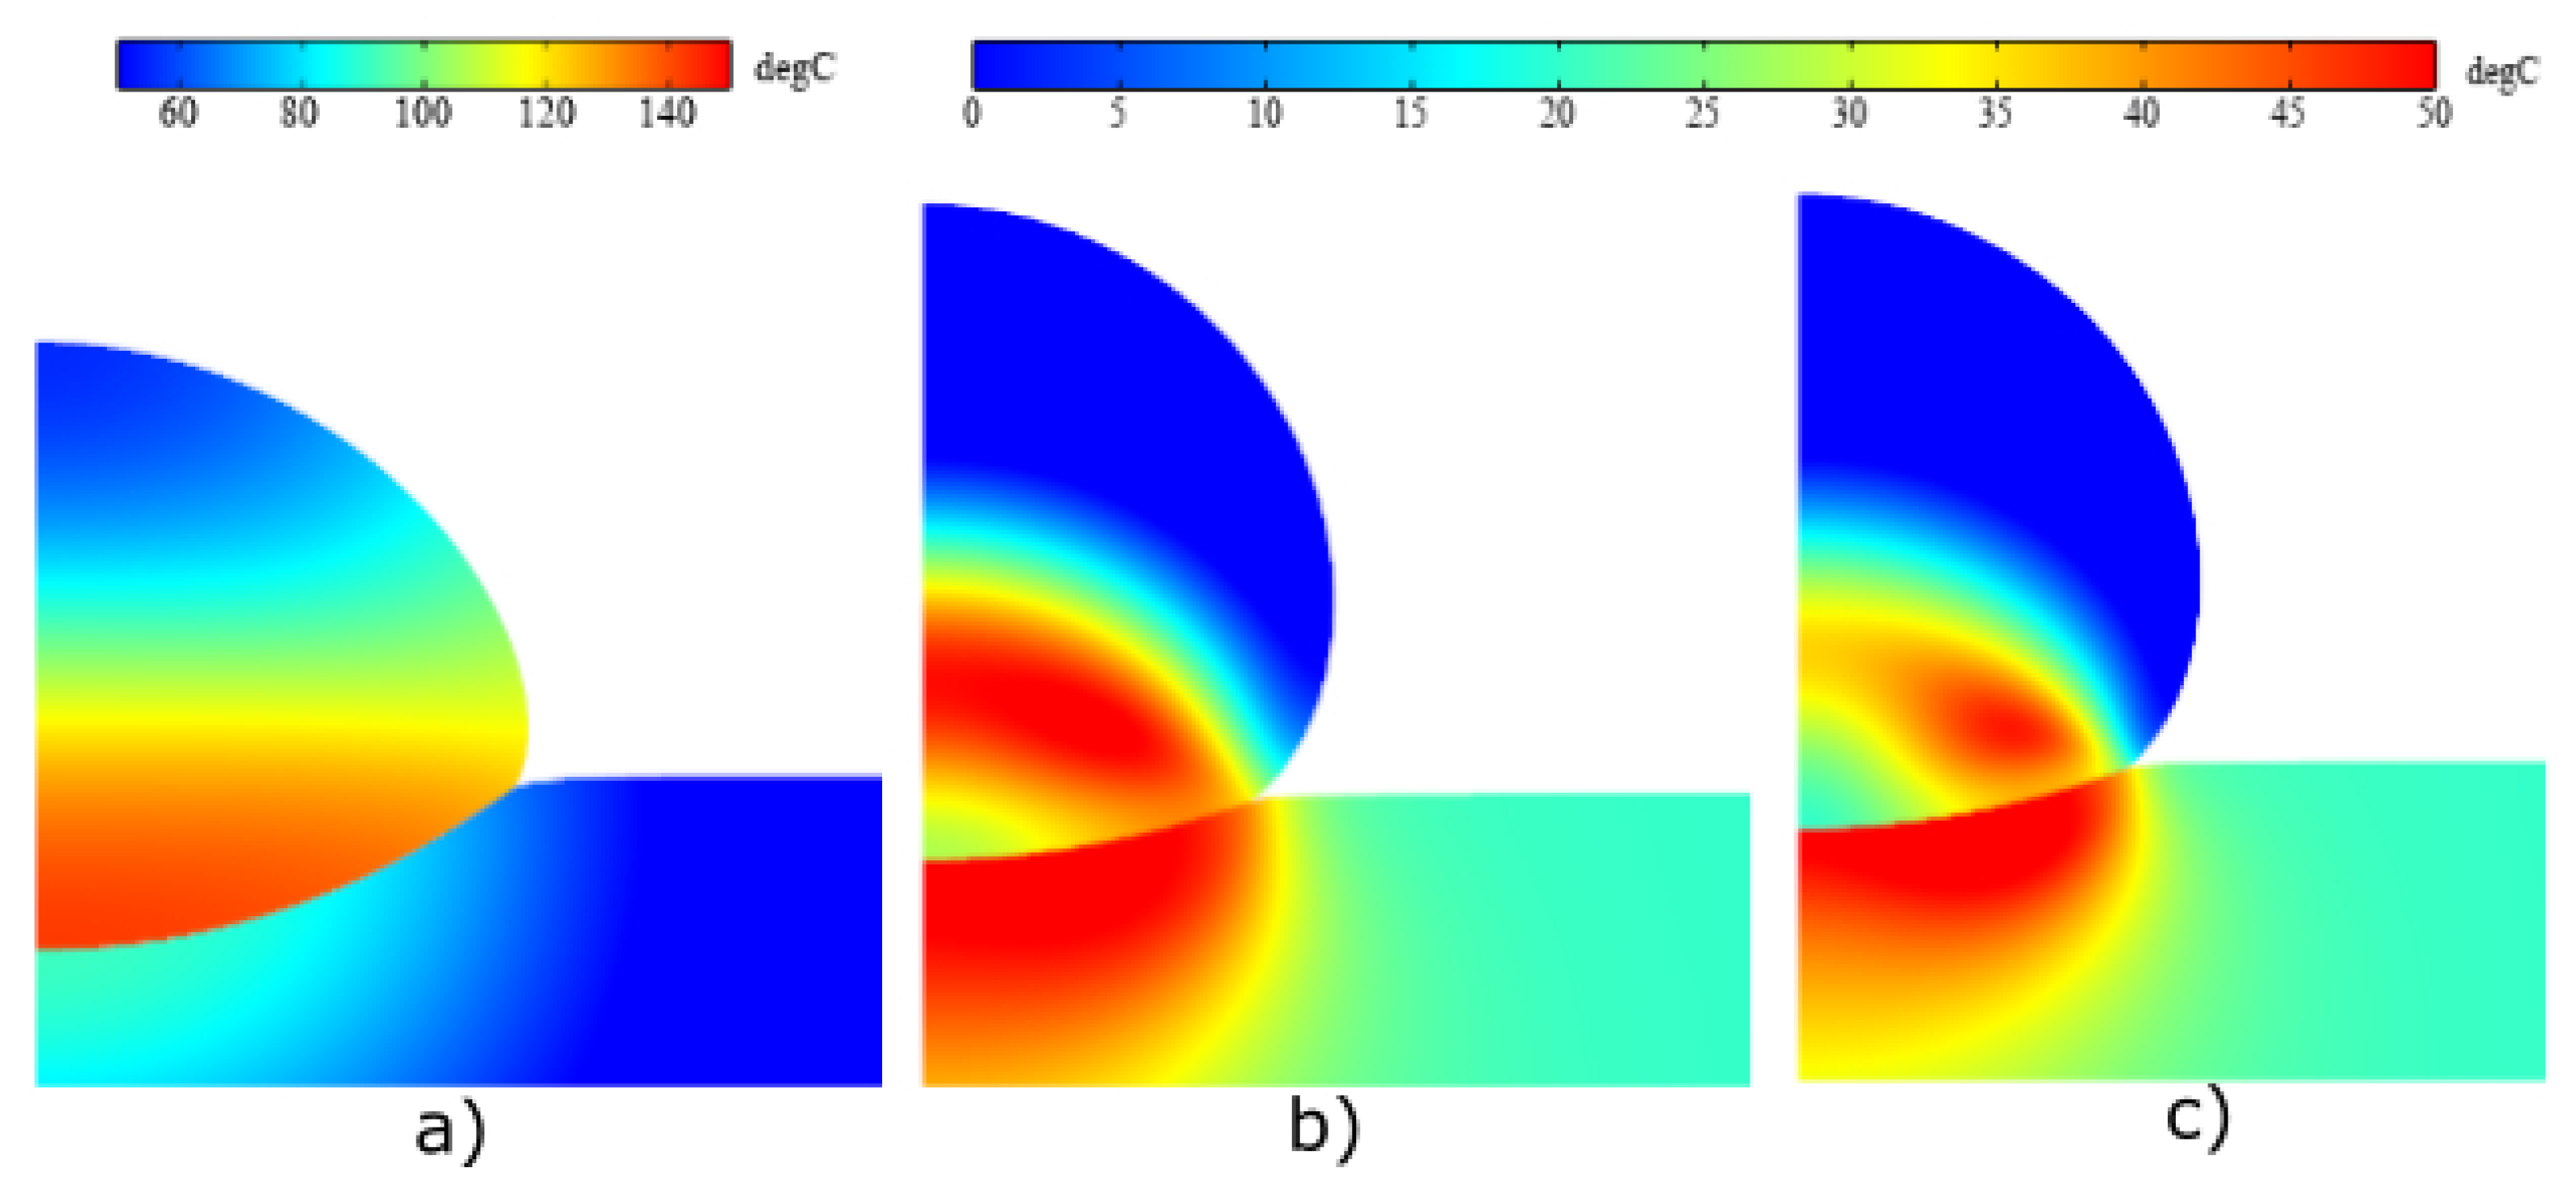
  • The COR, indentation, and temperature obtained by the elasto-plastic particle-substrate impact analysis was used to evaluate the potential of adhesion of the different powder sizes. The lowest adhesion potential was observed for particles of 30 μm in diameter. The region of smaller particles is characterized by the values of COR, which are lower due to a relatively high velocity. Particles larger than 30 μm are scalable, characterized by a small change in velocity and a rise in local temperature as their mass increases.
  • The current study focuses only on the development of a new powder flow nozzle geometry and flow formation. The results of numerical calculations, presented in this paper, can be helpful to improve the quality of laser-assisted metal deposition technologies. Choosing the gas velocity, particle size, and the nozzle geometry will lead to higher process resolution. Future work will include the interaction between the laser beam and metal powder particles in three different cases: when the laser beam is applied before particle deposition, during deposition, and after deposition. The process with the highest deposition efficiency will be used in various laser-assisted industrial fields, such as laser cladding, laser metal deposition, laser metal welding, and others.

Author Contributions

Conceptualization, R.P. and G.M.; Formal analysis, R.P., S.B. and G.J.; Investigation, R.P., G.J., R.K. and S.B.; Methodology, R.P., A.S. and G.M.; Resources, K.S. and A.R.; Supervision, G.M. and R.K.; Writing—original draft, R.P., S.B. and G.J.; Writing—review & editing, A.S., G.J. and R.K. All authors have read and agreed to the published version of the manuscript.

Funding

The research was funded by the Research Council of Lithuania under the project No. S-MIP-19-25.

Conflicts of Interest

The authors declare no conflict of interest.

References

  1. Cunningham, C.; Flynn, J.; Shokrani, A.; Dhokia, V.; Newman, S. Invited review article: Strategies and processes for high quality wire arc additive manufacturing. Addit. Manuf. 2018, 22, 672–686. [Google Scholar] [CrossRef]
  2. Bandyopadhyay, A.; Traxel, K.D. Invited review article: Metal-additive manufacturing—Modeling strategies for application-optimized designs. Addit. Manuf. 2018, 22, 758–774. [Google Scholar] [CrossRef]
  3. Schmidt, M.; Merklein, M.; Bourell, D.; Dimitrov, D.; Hausotte, T.; Wegener, K.; Overmeyer, L.; Vollertsen, F.; Levy, G.N. Laser based additive manufacturing in industry and academia. CIRP Ann. 2017, 66, 561–583. [Google Scholar] [CrossRef]
  4. Cerardi, A.; Caneri, M.; Meneghello, R.; Concheri, G.; Ricotta, M. Mechanical characterization of polyamide cellular structures fabricated using selective laser sintering technologies. Mater. Des. 2013, 46, 910–915. [Google Scholar] [CrossRef]
  5. Cain, V.; Thijs, L.; Van Humbeeck, J.; Van Hooreweder, B.; Knutsen, R. Crack propagation and fracture toughness of Ti6Al4V alloy produced by selective laser melting. Addit. Manuf. 2015, 5, 68–76. [Google Scholar] [CrossRef]
  6. Akbari, M.; Kovacevic, R. An investigation on mechanical and microstructural properties of 316LSi parts fabricated by a robotized laser/wire direct metal deposition system. Addit. Manuf. 2018, 23, 487–497. [Google Scholar] [CrossRef]
  7. Lai, Q.; Abrahams, R.; Yan, W.; Qiu, C.; Mutton, P.; Paradowska, A.; Soodi, M. Investigation of a novel functionally graded material for the repair of premium hypereutectoid rails using laser cladding technology. Compos. Part B Eng. 2017, 130, 174–191. [Google Scholar] [CrossRef]
  8. Yan, L.; Chen, Y.; Liou, F. Additive manufacturing of functionally graded metallic materials using laser metal deposition. Addit. Manuf. 2020, 31, 100901. [Google Scholar] [CrossRef]
  9. Schopphoven, T.; Gasser, A.; Backes, G. EHLA: Extreme High-Speed Laser Material Deposition. Laser Tech. J. 2017, 14, 26–29. [Google Scholar] [CrossRef] [Green Version]
  10. Huang, Y.; Khamesee, M.B.; Toyserkani, E. A comprehensive analytical model for laser powder-fed additive manufacturing. Addit. Manuf. 2016, 12, 90–99. [Google Scholar] [CrossRef]
  11. He, Y.; Wei, J.; Liu, J.; Wang, X.; Wang, Y.; He, L. Experimental study on the fabrication profile and mechanical properties by substrate-inclined angle using laser melting deposition (LMD) integrating with the substrate of stainless steel. Opt. Laser Technol. 2020, 125, 106038. [Google Scholar] [CrossRef]
  12. Liu, H.; Cao, W.; Xu, J.; Li, W.; Sun, Z. Dispersion mode of granular jet in a coaxial air jet. Powder Technol. 2012, 217, 566–573. [Google Scholar] [CrossRef]
  13. Tan, H.; Zhang, C.; Fan, W.; Zhang, F.; Lin, X.; Chen, J.; Huang, W. Dynamic evolution of powder stream convergence with powder feeding durations in direct energy deposition. Int. J. Mach. Tools Manuf. 2020, 157, 103606. [Google Scholar] [CrossRef]
  14. Lupoi, R.; O’Neill, W. Powder stream characteristics in cold spray nozzles. Surf. Coat. Technol. 2011, 206, 1069–1076. [Google Scholar] [CrossRef] [Green Version]
  15. Zahiri, S.H.; Gulizia, S.; Prentice, L. An overview of cold spray additive technology in Australia for melt-less manufacture of titanium. Matec Web Conf. 2020, 321, 03011. [Google Scholar] [CrossRef]
  16. Guan, X.; Zhao, Y.F. Numerical modeling of coaxial powder stream in laser-powder-based Directed Energy Deposition process. Addit. Manuf. 2020, 34, 101226. [Google Scholar] [CrossRef]
  17. Syed, W.U.H.; Pinkerton, A.; Li, L. A comparative study of wire feeding and powder feeding in direct diode laser deposition for rapid prototyping. Appl. Surf. Sci. 2005, 247, 268–276. [Google Scholar] [CrossRef]
  18. Kovalev, O.; Kovaleva, I.; Smurov, I.Y. Numerical investigation of gas-disperse jet flows created by coaxial nozzles during the laser direct material deposition. J. Mater. Process. Technol. 2017, 249, 118–127. [Google Scholar] [CrossRef]
  19. Guo, W. Compact Coaxial Nozzle for Laser Cladding. U.S Patent 7259353B2, 21 August 2007. Available online: https://patents.google.com/patent/US7259353B2/en?oq=US7259353B2 (accessed on 3 November 2021).
  20. Hu, Y. Coaxial Nozzle Design for Laser Cladding/Welding. U.S. Patent 20050056628A1, 17 March 2005. Available online: https://patents.google.com/patent/US20050056628A1/en?oq=US20050056628A1 (accessed on 3 November 2021).
  21. Aleshin, S. Coaxial Single Point Powder Feed Nozzle. U.S. Patent 5486676A, 23 January 1996. Available online: https://patents.google.com/patent/US5486676A/en?oq=US5486676A (accessed on 3 November 2021).
  22. Nozzle Particularly Suited to Direct Metal Deposition. U.S. Patent 6534745B1, 18 March 2003. Available online: https://patents.google.com/patent/US6534745B1/en?oq=US6534745B1 (accessed on 3 November 2021).
  23. Chen, J.; Jiang, W.; Han, C.; Liu, Y. Numerical study on the influence of supersonic nozzle structure on the swirling condensation characteristics of CO2. J. Nat. Gas Sci. Eng. 2021, 88, 103753. [Google Scholar] [CrossRef]
  24. Liu, Y.; Zhang, J.; Wei, J.; Liu, X. Optimum structure of a laval nozzle for an abrasive air jet based on nozzle pressure ratio. Powder Technol. 2020, 364, 343–362. [Google Scholar] [CrossRef]
  25. Newlands, R. The Thrust Optimised Parabolic Nozzle, Aspire Space Technical Papers. Available online: http://www.aspirespace.org.uk/downloads/Thrust%20optimised%20parabolic%20nozzle.pdf (accessed on 5 November 2021).
  26. Hor, A.; Morel, F.; Lebrun, J.-L.; Germain, G. Modelling, identification and application of phenomenological constitutive laws over a large strain rate and temperature range. Mech. Mater. 2013, 64, 91–110. [Google Scholar] [CrossRef] [Green Version]
  27. Al Salahi, A.A.; Othman, R. Constitutive Equations of yield stress sensitivity to strain rate of metals: A comparative study. J. Eng. 2016, 2016, 3279047. [Google Scholar] [CrossRef] [Green Version]
  28. Ludwik, P. Elemente der Technologischen Mechanik; Springer: Berlin/Heidelberg, Germany, 1909. [Google Scholar]
  29. Johnson, G.R.; Cook, W.H. Fracture characteristics of three metals subjected to various strains, strain rates, temperatures and pressures. Eng. Fract. Mech. 1985, 21, 31–48. [Google Scholar] [CrossRef]
  30. Cowper, G.R.; Symonds, P.S. Strain-hardening and strain-rate effects in the impact loading of cantilever beams. In Strain-Hardening and Strain-Rate Effects in The Impact Loading of Cantilever Beams; Defense Technical Information Center (DTIC): Fort Belvoir, VA, USA, 1957. [Google Scholar]
  31. Mebdoua, Y.; Fizi, Y.; Bouhelal, N. Cold sprayed copper coating: Numerical study of particle impact and coating characterization. Eur. Phys. J. Appl. Phys. 2016, 74, 24608. [Google Scholar] [CrossRef]
  32. Champagne, V.K.; Helfritch, D.J.; Trexler, M.D.; Gabriel, B.M. The effect of cold spray impact velocity on deposit hardness. Model. Simul. Mater. Sci. Eng. 2010, 18, 065011. [Google Scholar] [CrossRef]
  33. Li, G.; Wang, X.-F.; Li, W.-Y. Effect of different incidence angles on bonding performance in cold spraying. Trans. Nonferrous Met. Soc. China 2007, 17, 116–121. [Google Scholar] [CrossRef]
  34. Razavipour, M.; Jodoin, B. Material model for predicting dynamic response of copper and nickel at very high strain rates under cold spray conditions. J. Therm. Spray Technol. 2021, 30, 324–343. [Google Scholar] [CrossRef]
  35. Hassani, M.; Veysset, D.; Sun, Y.; Nelson, K.A.; Schuh, C.A. Microparticle impact-bonding modes for mismatched metals: From co-deformation to splatting and penetration. Acta Mater. 2020, 199, 480–494. [Google Scholar] [CrossRef]
  36. Hassani, M.; Veysset, D.; Nelson, K.A.; Schuh, C.A. Material hardness at strain rates beyond 106 s−1 via high velocity microparticle impact indentation. Scr. Mater. 2020, 177, 198–202. [Google Scholar] [CrossRef]
  37. Zheng, T.; Du, Z.; Cao, H.; Jiang, J.; Zheng, W.; Tang, S.; Wang, N.; Wang, P. Development of a novel mobile industrial-scale fluidized adsorption process for emergency treatment of water polluted by aniline: CFD simulation and experiments. Adv. Powder Technol. 2016, 27, 1576–1587. [Google Scholar] [CrossRef] [Green Version]
  38. Meyers, M.; Gregori, F.; Kad, B.; Schneider, M.; Kalantar, D.; Remington, B.; Ravichandran, G.; Boehly, T.; Wark, J. Laser-induced shock compression of monocrystalline copper: Characterization and analysis. Acta Mater. 2003, 51, 1211–1228. [Google Scholar] [CrossRef]
Figure 1. De Laval nozzle geometry components.
Mathematics 09 02913 g001
Figure 2. Numerical calculation results using different parameters listed in Table 2. (A) gas flow pressure and (B) gas flow velocity for Witoszynski curve nozzle geometry; (C) gas flow pressure and (D) gas flow velocity for Bicubic curve nozzle geometry.
Mathematics 09 02913 g002
Figure 3. Comparison of the velocity (A) and pressure (B) of Bicubic and Witoszynski curve nozzles.
Mathematics 09 02913 g003
Figure 4. Final distribution of differently-sized particles (1, 10 and 40 μm) on the substrate.
Mathematics 09 02913 g004
Figure 5. Particle impact velocity for different particle sizes.
Mathematics 09 02913 g005
Figure 6. Variation of coefficient of restitution against particle size.
Mathematics 09 02913 g006
Figure 7. Variation of nondimensional indentations h/d against particle size.
Mathematics 09 02913 g007
Figure 8. Equivalent plastic strain at the moment of maximum indentation for particle sizes (a) 1 μm, (b) 30 μm, and (c) 100 μm.
Mathematics 09 02913 g008
Figure 9. Temperature at the time instance of the maximum indentation for particle sizes (a) 1 μm, (b) 30 μm, and (c) 100 μm.
Mathematics 09 02913 g009
Table 3. Optimal nozzle geometry parameters.
Witoszynski CurveBicubic Parametric Curve
NameParameter RangesUnitsDescriptionNameParameter RangesUnitsDescription
Convergent Section
k1100 Coef. describing the Witoszynski curveXm0.7 Bicubic parametric curve control point
k2100
Rc1.0mmradius of the nozzle throatRc1.0mmradius of the nozzle throat
L114mm L120mm
Rin10mm Rin10mm
Divergent Section
P1x4mmQuadratic Bezier control pointP1x4mmQuadratic Bezier control point
P1y1.7mmP1y2.0mm
Rout2.0mmradius of the nozzle outletRout2.0mm
L240mm L240mm
Table 4. Copper material parameters.
Parameter, UnitsSymbolValue
Density, kg/m3 ρ 8700–8950
Elastic modulus, GpaE105–125
Poisson’s ratio, 1Ν0.335
Specific heat, J / ( kg · K ) C385–425
Thermal conductivity, W / ( m · K ) h395
Coefficient of thermal expansion, K 1 a1.65–1.8 ( 10 5 )
Yield strength, MpaA90
Hardening coefficient, MpaB292
Strain-hardening exponentn0.31
Material constants used for Cowper-Symonds criterion (selected by authors) ε ˙ 0 1
D0.19
k0.18
Thermal softening exponentm1.09
Melting temperature, KTm1358
Reference temperature, KTr293
Publisher’s Note: MDPI stays neutral with regard to jurisdictional claims in published maps and institutional affiliations.

