Abstract
Thermoelectric generation systems (TEGSs) are used to convert temperature difference and heat flow into DC power based on the Seebeck theorem. The basic unit of TEGS is the thermoelectric module (TEM). TEGSs have gained increasing interest in the research fields of sustainable energy. The output power from TEM is mostly reliant on differential temperature between the hot and cold sides of the TEM added to the value of the load. As such, a robust MPPT strategy (MPPTS) is required to ensure that the TEGS is operating near to the MPP while varying the operating conditions. Two main drawbacks may occur in the conventional MPPTSs: low dynamic response, such as in the incremental resistance (INR) method, and oscillations around MPP at steady state, such as in the hill climbing (HC) method. In the current research work, an optimized fractional MPPTS is developed to improve the tracking performance of the TEGS, and remove the two drawbacks of the conventional MPPTSs. The proposed strategy is based on fractional order control (FOC). The main advantage of FOC is that it offers extra flexible time and frequency responses of the control system consent for better and robust performance. The optimal parameters of the optimized fractional MPPTS are identified by a manta ray foraging optimization (MRFO). To verify the robustness of the MRFO, the obtained results are compared with ten other algorithms: particle swarm optimization; whale optimization algorithm; Harris hawks optimization; heap-based optimizer; gradient-based optimizer; grey wolf optimizer; slime mould algorithm; genetic algorithm; seagull optimization algorithm (SOA); and tunicate swarm algorithm. The maximum average cost function of 4.92934 kWh has been achieved by MRFO, followed by SOA (4.5721 kWh). The lowest STD of 0.04867 was also accomplished by MRFO. The maximum efficiency of 99.46% has been obtained by MRFO, whereas the lowest efficiency of 74.01% was obtained by GA. Finally, the main findings proved the superiority of optimized fractional MPPTS compared with conventional methods for both steady-state and dynamic responses.
1. Introduction
A massive part of heat energy consumption is mostly wasted by the industrial sectors and transportation. Thus, the recovery system of wasted heat gives a significant portion of the daily needs from energy, specifically for the transportation sector [1,2]. The recovery of the wasted heat can be accomplished by utilizing thermoelectric generation (TEG) technology [3]. Thermoelectric generators convert heat directly into electricity. They are solid-state devices. Having no moving parts makes them very reliable. TEGs do not require any greenhouse gases to operate, and do not have restrictions on fuels that can be used to generate the needed heat. Lately, various applications have been presented for TEG systems [4,5] and/or by amalgamating them with distinct sources [6,7,8].
The main drawback of the TEG system (TEGS) is the low energy conversion efficiency. Therefore, different attempts have been made to solve this issue. The basic unit of TEGS is the thermoelectric module (TEM). TEGSs have gained increasing interest in the research fields of sustainable energy. The output power from TEM is mostly reliant on differential temperature between hot and cold sides of the TEM added to the value of the load. Thus, a robust MPPT strategy (MPPTS) is required to ensure that the TEGS is operating near to the MPP while varying the operating conditions.
Hill climbing (HC), and perturb and observe tracking (P&O) are the frequently used approaches for TEG systems in the literature [9,10,11], thanks to their simplicity in implementation. The main drawback of such approaches is the high fluctuations around the MPP at steady-state condition. P&O MPPT was introduced in [12], utilizing a Cuk converter, and measuring the current and load voltage. The P&O MPPT has been employed in [13] TEG applications with a hysteresis controller. Actually, the P&O and HC operation in TEG applications is sensitive for the chosen value of the fixed step. From another side, the incremental resistance and conductance (INC) methods were established for TEG applications to remove the shortcomings of the P&O and HC methods [14]. The INC approach gives steadier tracking from the MPP when compared to HC by removing the oscillations around the MPPT. However, the drawback of INC is the low dynamic response.
From another side, many MPPT approaches were suggested in the literature for PV and fuel cell systems, involving artificial neural networks, fuzzy logic, ANFIS, recent optimization methods, etc. [15,16,17,18]. In [15], the implementation of fuzzy logic-based MPPT applications was presented. The fuzzy type-2 was developed for MPPT in [19]. In [20], a fractional order fuzzy was suggested for TEG applications. The suggested approach uses the advantages of fractional control to accomplish a fast dynamic for MPP. However, a small number of advanced MPPT approaches have been developed for TEG systems. Consequently, the applications of TEG systems still require extra research for enhancing the tracking of MPPT approaches. There are some more efficient evolutionary computation algorithms, such as evolutionary algorithms and gradient search [21], and global evolutionary algorithms with a gradient-based method [22].
According to the no free lunch (NFL) theory, there is no one algorithm that is able to solve all and different objective functions. NFL introduced the motivation for researchers in scientific fields to develop new algorithms to solve various problems. Therefore, this paper presents a new optimized fractional MPPT strategy (OFMPPTS) to maximize the harvested energy from the TEGSs. The proposed approach is integrating the INC with fractional order control (FOC). The proposed OFMPPTS has three unknown parameters: integration gain; proportional gain; and fraction order. These parameters are determined using one of the promising optimization algorithms called the manta ray foraging optimizer (MRFO), which is a recent algorithm that has begun to attract attention for solving constrained engineering optimization problems. MRFO has been proven to be efficient in solving real-world optimization problems in the literature. The MRFO algorithm is easy to implement because of its basic concept, simple formula, and small number of parameters. MRFO can generate better solutions, promises fast convergence speed towards the origin, and is immune to the unbalanced exploration and exploitation phases that lead to being trapped into the local optimum. Throughout the optimization operation, three unknown parameters are selected to be the decision variables, but the cost function that is necessary to be maximum is the harvested energy (kWh) of the TEGS. To verify the robustness of the MRFO, the obtained results are compared with particle swarm optimization (PSO), whale optimization algorithm (WOA), Harris hawks optimization (HHO), heap-based optimizer (HBO), gradient-based optimizer (GBO), grey wolf optimizer (GWO), slime mould algorithm (SMA), genetic algorithm (GA), seagull optimization algorithm (SOA), and tunicate swarm algorithm (TSA). The main findings proved the superiority of optimized fractional MPPTS compared with conventional methods for both steady-state and dynamic responses.
The main contributions in this paper are outlined as follows:
- A new OFMPPTS to maximize the harvested the energy of the TEG system is developed. The developed approach utilizes the fractional control that offers better and robust performance.
- A new application of the MRFO algorithm is proposed for determining the optimal parameters of OFMPPTS. The suggested design by using integrated features of the MRFO, and fractional order control introduces a promising solution of MPPT in TEG systems.
- Improved efficiency of the TEG system for different applications is suggested in this research paper through simple and effective FOMPPTS by using only electrical measured signals from the TEG source. Compared to the other existing methods, reduced output power fluctuations in output power, voltage, in addition to current waveforms from the TEG system, are taken by the suggested FOMPPTS.
The rest of the paper is arranged as following. Section 2 presents the modelling of the thermoelectric generator. The manta ray foraging optimization and the suggested optimized fraction MPPT are detailed in Section 3 and Section 4, respectively. The results and discussions for different tested operating points and case studies are introduced in Section 5. Lastly, Section 6 presents the main findings of the research paper.
2. Modelling of Thermoelectric Generator
Thermoelectric generator semiconductor devices use the Seebeck effect to produce a DC voltage. The generated voltage drives electrical current, and produces useful DC power at a load. The general view of the TEG is shown in Figure 1a. The fundamental building block of the TEG is a thermocouple that includes p-type and n-type semiconductors, as demonstrated in Figure 1b. To form a TEG module, some of the p-type and n-type groups are combined in series to raise the DC voltage and, accordingly, the output power. Simultaneously, these groups are thermally in parallel to reduce the thermal resistance [23,24]. The couples are planted between two parallel ceramic plates. These plates create a hot side and cold side, as described in Figure 1b, and give structural rigidity, a flat surface for mounting, and a dielectric layer to prevent electrical short circuits.
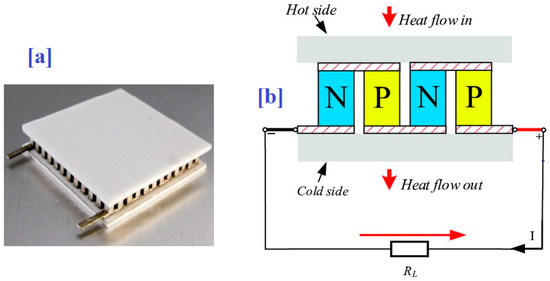
Figure 1.
General structure of the TEG. (a) general view, and (b) circuit.
When a temperature difference is occurred across the hot and cold sides, a voltage potential will appear based on the Seebeck effect. The Seebeck effect occurs due to the movement of charge carriers within the semiconductors. Figure 2 presents the equivalent-circuit of the TEG unit. The open circuit voltage as a source (VO.C) is series connected with an internal resistance (Rint) [23,24].
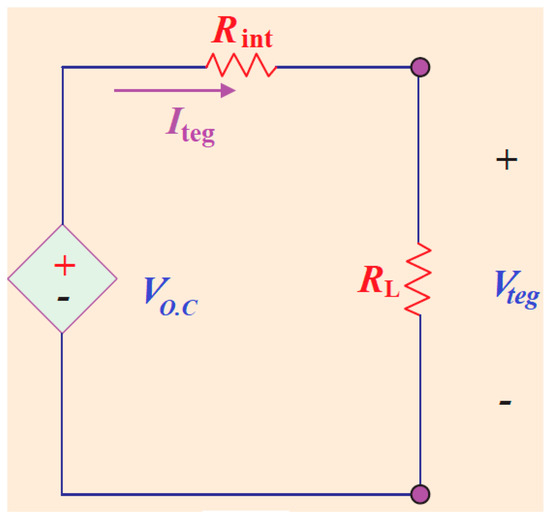
Figure 2.
Simple equivalent-circuit of the TEG unit.
The value of open-circuit voltage is mainly dependent on the temperature difference (ΔT) across of the two sides of the TEG. It can be estimated using the following relation:
where denotes the Seebeck coefficient, and denote the hot and cold side temperatures, respectively.
Based on the heat-energy-equilibrium theory [25], the heat flow from the high-temperature-side () to the low-temperature-side () can be estimated as follows:
where K denotes the thermal-conductivity coefficient.
The TEG output power, Pteg, is mainly dependent on the difference of the heat energy on both sides of the TEG. It can be calculated by the following equation:
Considering Figure 2, and applying KVL, the output voltage of the TEG, , can be expressed by the following relation:
In sum, the TEG output power, Pteg, can be expressed as follows:
3. MRFO Algorithm
Zhao et al. [26] proposed manta ray foraging optimization (MRFO) as an innovative technique. MRFO mimicked the manta ray’s foraging tactic when catching their food. The creatures follow three stages until they reach their preys, including chain, cyclone, and somersault foraging. The chain foraging is the first step that may be followed, where the creatures target to find highly concentrated plankton positions. Therefore, each agent of the creatures moves toward the food location. Zhao et al. [26] modelled this stage mathematically as described below:
where represents the creature location at iteration , is a random number, is the best position obtained so far, N is total creature number, and the symbol of is a weighting factor, that is given by Equation (8) as below:
Considering Equation (7), the position for creature, except that of the first one, is reliant on the position from agent and the best one ().
While the manta ray creatures recognize the position of the plankton spot, they amalgamate, forming long chains, then swim in the direction of the prey in a spiral shape, and towards the manta ray in front of them. That stage is called cyclone foraging. Zhao et al. [26] mathematically described the spiral shaped as below:
where refers to a random number, the mathematical formula of the cyclone stage is modelled as below:
where is a weighting operator that is given below:
where and are the current and total number of iterations, respectively. The symbol of refers to a random number.
Zhao et al. [26] added an auxiliary equation to enhance the exploration stage of the MRFO optimizer. During the auxiliary equation, the agents were forced to discover a new random location in the search landscape. The auxiliary formula is described as below:
where and denote the upper and lower limits, denotes a random position.
For the third and last stage of somersault foraging, every creature swims around the food back and forth, and somersault (tumble) to new position, as expressed below:
where is a factor of somersault utilized to assign the manta rays somersault range, and are random values.
In MRFO’s final stage, every individual can move to any location in the search space between its current position and an asymmetrical one around the food. Thus, the distance between the manta ray and the food location is minimized throughout this stage, which refers to a convergence process to the optimal solution. Consequently, the factor range is adaptively dismissed through the iterations. The main steps of MRFO applied in the maximization procedure are demonstrated in Algorithm 1.
| Algorithm 1 Pseudo code of the proposed MRFO |
| 1: Input: set the MRFOs’ parameters: maximum number of iterations and agents. |
| 2: Compute the initial population with N solutions randomly |
| 4: Valuate the objective function of and assign the best solution (). |
| 5: for I = 1 : N do |
| 6: if rand <0.5 then |
| 7: if t/T < rand then |
| 8: Apply Equation (10) to update . |
| 9: else |
| 10: Apply Equation (13) to update . |
| 11: end if |
| 12: else |
| 13: Apply Equation (7) to update . |
| 14: end if |
| 15: end for |
| 16: for i = 1 : N do |
| 17: Apply Equation. (14) to update . |
| 18: end for |
| 19: t = t + 1. |
| 20: until Stop criteria is met |
| 21: Return the best solution . |
4. Optimized Fractional MPPT Strategy
To improve the dynamic tracking behavior of the incremental conductance (INC) method, a fraction control is implemented. The mathematical model of the INC method is extracted from the fact that the derivative of the TEG power related to the TEG voltage (dP/dV) is zero at the MPP. Therefore, the slope of the TEG power characteristics is zero at the MPP, positive for values located on the left side of the MPP, and negative for amounts located on the right side. Consequently, the error signal can be defined by the following relation:
where V and I denote the instant voltage and current, respectively, and n is the increment time.
The INC method can be implemented using a discrete integrator with the error signal as the input.
The optimized fractional MPPTS executes a fractional PI as an alternative of an integer integrator, as presented in Figure 3. Fractional order control includes a non-integer order that has some merits, including flexibility in design and high robustness. The fractional PI transfer function can be defined as follows [27]:
where represents the controller transfer function, the integral and proportional are, respectively, , and is the fractional order.
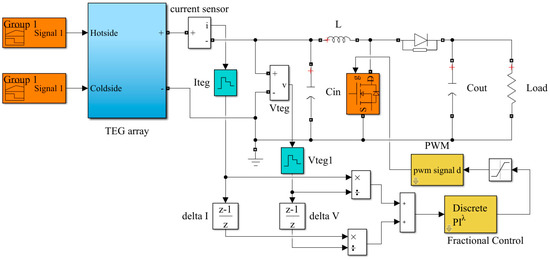
Figure 3.
MATLAB model of OFMPPTS.
5. Results and Discussion
To investigate the TEG power of altering the temperature differences, a computer MATLAB program software was developed. The TEG model of TEG1‒12611‒6.0 is used in the simulations. For a single TEG, the nominal current, voltage, and power are 3.4 A, 4.2 V, and 14.6 W, respectively, at a hot side temperature of 300 °C, and a cold side temperature of 30 °C. Figure 4a displays the power versus current of the TEG through changing the hot side temperature by maintaining the cold side at a temperature of 30 °C. Referring to this figure, the estimated datasets and manufacturing datasets are extremely satisfying. Furthermore, the location of MPP mostly varies with the difference temperature between both cold and hot sides of the TEG. Power versus current of the TEG with a changing cold side temperature at a fixed hot side temperature of 300 °C is given in Figure 4b. Figure 5 shows the matched load parameters (power, current, voltage, and resistance) when varying the hot side and cold side temperature values.

Figure 4.
Power versus current of the TEG: (a) changing the hot side temperature by maintaining the cold side at a temperature of 30 °C; (b) changing the cold side temperature by maintaining the hot side at a temperature of 300 °C.
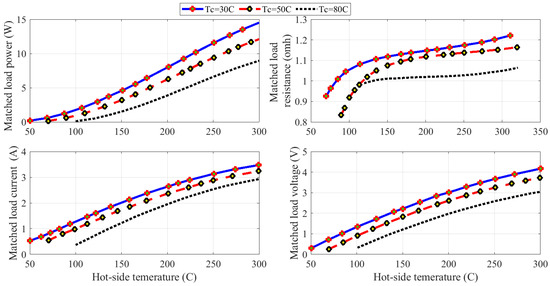
Figure 5.
Matched load parameters when varying the hot and cold side temperature values.
5.1. Evaluation of MRFO
Ten optimization algorithms: WOA; HHO; SMA; PSO; HBO; GBO; GA; GWO; SOA; and TSA were used in comparison with the proposed MRFO to identify the best parameters of OFMPPTS. For the duration of the optimization process, the parameters of OFMPPTS, including integration gain, proportional gain, and fraction order, were selected to be the decision variables, but the cost function that is necessary to be maximum is the harvested energy (kWh) of the TEG. For fair comparison, the population size, and the max. no. of iterations for all optimization algorisms are set to 10 and 25, respectively. In addition, in this paper, the default parameter settings for the MRFO and counterparts are utilized, which is a fair and appropriate practice. The optimal parameters of OFMPPTS using different optimization algorithms are given in Table 1. To confirm the consistency of the considered algorithms, everyone executed 30 runs. The statistical analysis of these optimizers is also shown in Table 2.

Table 1.
Optimal parameters of optimized fractional MPPTS and statistical evaluation (30 runs).

Table 2.
Details of 30 runs using different algorithms.
Referring to Table 1, the performance of MRFO is the best among all considered algorithms. The average cost function values varied between 4.92934 kWh and 3.59264 kWh. The maximum average cost function of 4.92934 kWh has been achieved by MRFO, followed by SOA (4.5721 kWh). The STD values varied between 0.04867 and 1.18114. The lowest STD was also accomplished by MRFO. Regarding the efficiency, the maximum efficiency of 99.46% has been obtained by MRFO, whereas the lowest efficiency of 74.01% was obtained by GA. The details of 30 runs using different algorithms are presented in Table 2. Using these data, a Wilcoxon sign rank test and Friedman rank test were computed, as illustrated in the last lines of Table 2. Referring to the number of ranks where the MRFO outperforms the other peers (R+) and the reverse (R−), one can observe that the MRFO has a remarkable performance. The p-values based on the Wilcoxon sign rank are less than 0.05, therefore, the null hypothesis is rejected (h = No), meaning there exists a significant difference between optimizers in favor of MRFO (R+ > R−). The average rank based on the Friedman rank test is reported at the last time to order the algorithms—as it is obvious the MRFO has the least mean rank, therefore, it has the first rank as a final classification. The GWO occupies the second position as a final rank with a Friedman average rank of 4.6833, and subsequently, MRFO is considered the most reliable and consistent optimizer. For further evaluation of the MRFO performance, Figure 6 shows the cost function variation using different algorithms.
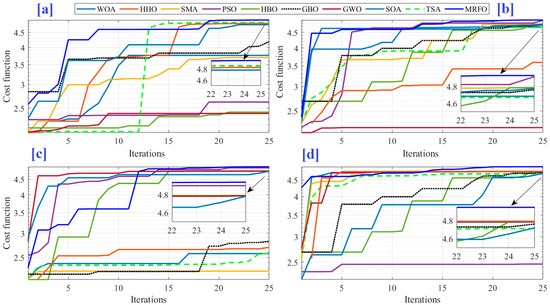
Figure 6.
Cost function variation using different algorithms: (a) run no. 1; (b) run no. 9; (c) run no. 16; and (d) run no. 19.
On the other hand, an analysis of the variance test (ANOVA) has been done to verify the consistency of the MRFO in determining the parameters of OFMPPT and the design problematic. ANOVA test results are presented in Table 3, and distribution of the observations through the number of runs is presented in Figure 7. From these results, the p-value is much higher than the F value, which confirms the difference between the provided performances. As illustrated in Figure 7, the MRFO can provide the best results in terms of mean fitness. Moreover, it has the lowest variation range, where the fitness function is varied from 4.75 to 4.95, on the other hand, the SOA has outliers over a wide range from 2.2 to 4.89. Accordingly, the results demonstrate the MRFO robustness and consistency.

Table 3.
ANOVA test results.
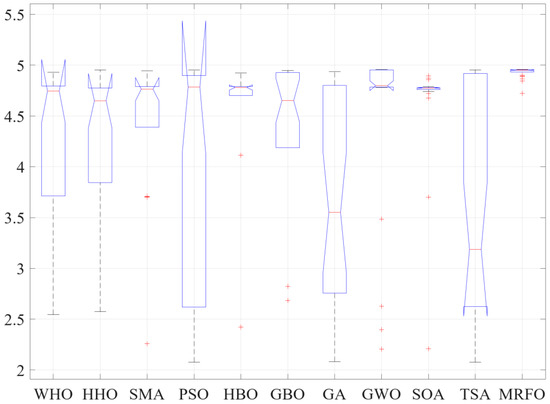
Figure 7.
Observations through the independent runs based on ANOVA test.
To confirm the results obtained by the ANOVA test, and to approve the high performance of the proposed algorithm, a Tukey’s HSD (honestly significant difference) test, which is used to confirm significant differences between the results means for each optimizer, has been performed. The results are presented in Figure 8, and, similar to the findings of the ANOVA test, the MRFO provides the higher mean fitness, thus, it has the ability to solve this kind of problem more efficiently.
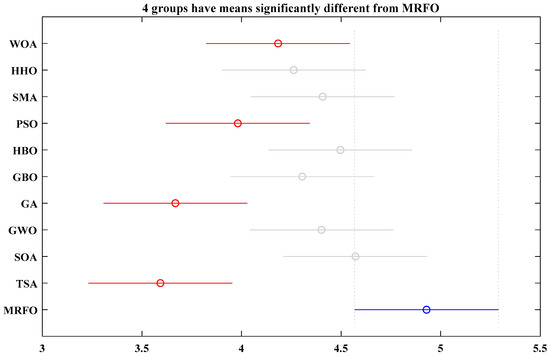
Figure 8.
Tukey’s test.
To validate the superiority of the MRFO-based OFMPPTS, the tracking performance is compared with incremental conductance and hill climbing approaches. For the incremental conductance, gain of the discrete integrator is assumed to be 0.7. But for OFMPPTS, parameters of fractional order PI are 00.03526, 7.03875, and 0.98753, respectively, for proportional gain, integral gain, and fractional order as determined using MRFO, and provided in Table 1. A layout of the TEG system is presented in Figure 9. The TEG system consists of five series connected TEG units, a DC converter working in the continuous current mode with 30 kHz as the switching frequency, an input inductance with 1 mH, and an output capacitor with 47 μF. The load value is 15 Ω. The location of MPP is mainly dependent on the difference in temperature of the two sides of the TEG, in addition to the load demanded, so five different operating scenarios are considered to test the performance of OFMPPTS. These scenarios include varying the temperature for the hot side, varying the temperature for the cold side, and varying the load value. The details parameters for the investigated scenarios are presented in Table 4.
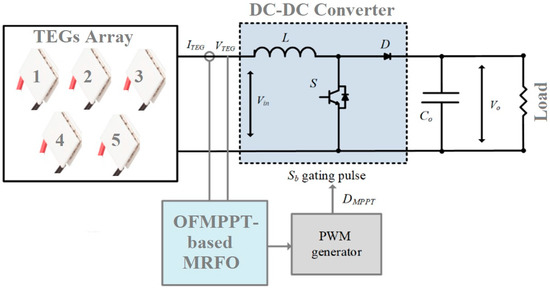
Figure 9.
A complete TEG system diagram.

Table 4.
The details parameters for the investigated scenarios.
5.2. 1st Scenario
In this scenario, as presented in Table 4, two different values of the difference temperature (ΔT) between the hot and cold sides of the TEG are used: 270 °C and 220 °C. The load resistance and cold side temperature are 15 Ω and 30 °C, respectively, for both cases. The hot side temperature values are 300 °C and 250 °C, respectively. Under these conditions, the power, voltage, and current from the TEG at MPP are 73 W, 21 V, and 3.4 A, respectively, for a difference temperature of 270 °C, whereas the power, voltage, and current are: 57.86 W; 18.36 V; and 3.14 A, respectively, for a difference temperature of 220 °C. The tracking system must preserve the maximum power regardless of the load value. The tracking performance using OFMPPTS, HC, and INC methods is presented in Figure 10a for a difference temperature of 270 °C, whereas in Figure 10b, for a difference temperature of 220 °C. At the beginning, for both cases, the suggested OFMPPTS achieves a fast response to achieve the maximum power. It needs around 0.02 s to catch the MPP, whereas the INC requires more than 0.2 s. As such, thanks to the proposed OFMPPTS, the dynamic tracking performance has been improved. Another superior criterion for the suggested OFMPPTS represents the low fluctuations under the steady-state condition compared with the HC method. Therefore, the dynamic tracking performance of OFMPPTS is superior when compared with INC and HC approaches for the fast tracking, as well as the diminished fluctuation at steady-state conditions.
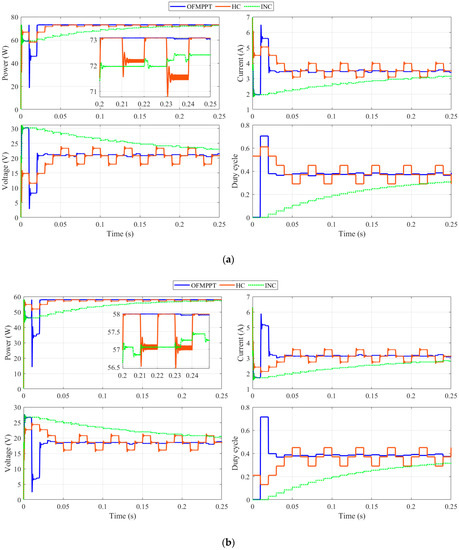
Figure 10.
Dynamic tracking performance using OFMPPTS, HC, and INC methods for 1st scenario; (a) At 270 °C difference temperature; (b) At 220 °C difference temperature.
5.3. 2nd Scenario
In the second scenario, the cold side temperature and the value of the load are maintained at 30 °C and 15 Ω, respectively. On the other side, the hot side temperature is reduced from 300 °C to 250 °C at a time of 0.6 s. Under such a condition, TEG power is decreased from 73 W to 57.86 W, due to the decreasing of the temperance difference between both the two TEG sides from 270 °C to 220 °C. The dynamic tracking performance using OFMPPTS, HC, and INC methods for the second scenario is demonstrated in Figure 11. After the sudden change in the hot side temperature, the suggested OFMPPTS reaches the maximum power of 57.86 W rapidly, and with the lowest fluctuations compared with the INC and HC. The INC needs a large time to come back to the optimal operating point, and still the HC suffers from the high oscillations around the MPP under steady-state.

Figure 11.
Dynamic tracking performance using OFMPPTS, HC, and INC methods for 2nd scenario.
5.4. 3rd Scenario
In the third scenario, the temperature for the hot side and the value of the load are maintained at 300 °C and 15 Ω, respectively. The temperature for the cold side is raised from 30 °C to 50 °C at a time of 0.6 s. Under such condition, TEG power is reduced from 73 W to 60.57 W, due to the decreasing of the temperance difference between both two TEG sides from 270 °C to 250 °C. The dynamic tracking performance using OFMPPTS, HC, and INC methods for the third scenario is presented in Figure 12. The suggested OFMPPTS is capable of reaching the maximum power (60.57 W) rapidly after 0.02 s, but the INC still needs more time for updating the duty cycle, and returns to the optimal operating point.

Figure 12.
Dynamic tracking performance using OFMPPTS, HC, and INC methods for 3rd scenario.
5.5. 4th Scenario
In this scenario, there is a sudden change simultaneously for the hot side temperature and the cold side temperature, respectively, when keeping the load constant at 15 Ω. At 0.6 s, the cold side temperature is increased from 50 °C to 80 °C, and, at the same time, the hot side temperature is increased from 250 °C to 300 °C. With this scenario, TEG power is decreased from 47 W to 44.85 W. The dynamic tracking performance using OFMPPTS, HC, and INC methods for the fourth scenario is given in Figure 13. After considering the sudden change in the temperature, the suggested OFMPPTS rapidly succeeded to catch the maximum power of 44.85 W after 0.02 s, but the INC still needs around 0.2 s to reach to the same point. The high oscillations around the MPP are very clear when using the HC method. Such oscillations are removed thanks to using the OFMPPTS.
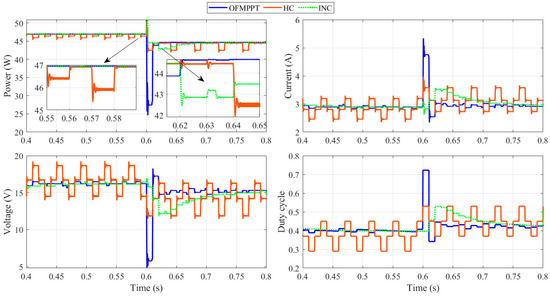
Figure 13.
Dynamic tracking performance using OFMPPTS, HC, and INC methods for 4th scenario.
5.6. 5th Scenario, Change in the Load
Evaluating the tracking performance is important when a sudden change occurs in the load demand. In the fifth scenario, the temperature values for both hot and cold sides are fixed to 300 °C and 80 °C, respectively. In this case, the nominal values for voltage current and power are 15.2 V, 2.93 A, and 44.85 W, respectively. At a time of 0.4 s, a sudden change in the load demand is implemented. An additional resistance of 25 Ω is connected in parallel with the refence load of 25 Ω. The dynamic tracking performance using OFMPPTS, HC, and INC methods for the fifth scenario is given in Figure 14. Following the sudden change in the load, the suggested OFMPPTS rapidly succeeded to catch the maximum power of 44.85 W after 0.01 s, but the INC still needs around 0.2 s to reach to the same point of 44.85 W. The high oscillations around the MPP are very clear when using the HC method. Such oscillations are removed thanks to using the OFMPPTS.
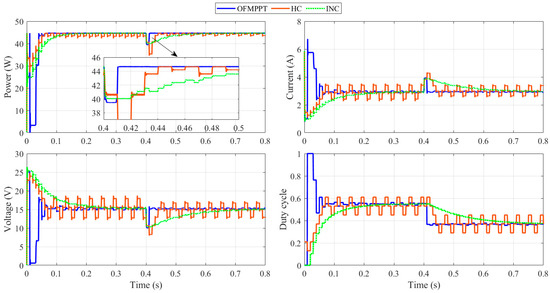
Figure 14.
Dynamic tracking performance using OFMPPTS, HC, and INC methods for 5th scenario.
6. Conclusions
To improve the transient response of incremental conductance-based MPPT, and remove the steady-state fluctuations of the hill climbing approach, an optimized fractional MPPT strategy (OFMPPTS) has been developed to maximize the harvested energy from thermoelectric generator systems. The suggested OFMPPTS utilizes the fractional order control so that it provides more adjustable time and frequency responses of the control system, allowing better and more robust performance. The best parameters of the OFMPPTS have been determined firstly using MRFO. Ten optimization algorithms: WOA; HHO; SMA; PSO; HBO; GBO; GA; GWO; SOA; and TSA were used in comparison with the proposed MRFO to identify the best parameters of OFMPPTS. The main finding proved that the performance of MRFO is the best among all considered algorithms. The average cost function values varied between 4.92934 kWh and 3.59264 kWh. The maximum average cost function of 4.92934 kWh has been achieved by MRFO, followed by SOA (4.5721 kWh). The STD values varied between 0.04867 and 1.18114. The lowest STD was also accomplished by MRFO. Regarding the efficiency, the maximum efficiency of 99.46% has been obtained by MRFO, whereas the lowest efficiency of 74.01% has been obtained by GA. Also, two tests were performed to demonstrate the robustness of MRFO: analysis of the variance test (ANOVA) and Tukey’s (HSD). Finally, to validate the superiority of the MRFO-based OFMPPTS, the tracking performance was compared with incremental conductance and hill climbing approaches. Five different operating scenarios were considered to test the performance of OFMPPTS. These scenarios included varying the hot side temperature, varying the cold side temperature, and varying the load value. The results emphasized the superiority of the optimized fractional MPPTS compared with conventional methods for both steady-state and dynamic responses. Future studies should employ the MRFO algorithm to address the hardware validation of the proposed MPP algorithm. Furthermore, the authors should consider the newest meta-heuristics for red fox optimization algorithm, polar bear algorithm, and black widow optimization algorithm to solve the problem of partial shading of the PV array surface.
Author Contributions
Supervision, conceptualization, writing—review and editing, methodology, software, formal analysis, H.R. and E.H.H.; Methodology, software, validation, formal analysis, writing—review and editing, A.F. and D.Y.; Resources, data curation, investigation, formal analysis, methodology, software, validation, writing—original draft preparation, R.M.G. All authors have read and agreed to the published version of the manuscript.
Funding
This work was funded by the Deanship of Scientific Research at Jouf University under grant No (DSR-2021-02-0316).
Institutional Review Board Statement
Not applicable.
Informed Consent Statement
Not applicable.
Data Availability Statement
Not applicable.
Conflicts of Interest
The authors declare no conflict of interest.
References
- Shen, Z.-G.; Tian, L.-L.; Liu, X. Automotive exhaust thermoelectric generators: Current status, challenges and future prospects. Energy Convers. Manag. 2019, 195, 1138–1173. [Google Scholar] [CrossRef]
- Liu, X.; Deng, Y.; Li, Z.; Su, C. Performance analysis of a waste heat recovery thermoelectric generation system for automotive application. Energy Convers. Manag. 2015, 90, 121–127. [Google Scholar] [CrossRef]
- Champier, D. Thermoelectric generators: A review of applications. Energy Convers. Manag. 2017, 140, 167–181. [Google Scholar] [CrossRef]
- Tang, S.; Wang, C.; Liu, X.; Su, G.; Tian, W.; Qiu, S.; Zhang, Q.; Liu, R.; Bai, S. Experimental investigation of a novel heat pipe thermoelectric generator for waste heat recovery and electricity generation. Int. J. Energy Res. 2020, 44, 7450–7463. [Google Scholar] [CrossRef]
- Patowary, R.; Baruah, D.C. Thermoelectric conversion of waste heat from IC engine-driven vehicles: A review of its application, issues, and solutions. Int. J. Energy Res. 2018, 42, 2595–2614. [Google Scholar] [CrossRef]
- Jena, S.; Kar, S.K. Employment of solar photovoltaic-thermoelectric generator-based hybrid system for efficient operation of hybrid nonconventional distribution generator. Int. J. Energy Res. 2020, 44, 109–127. [Google Scholar] [CrossRef]
- Lekbir, A.; Hassani, S.; Mekhilef, S.; Saidur, R.; Ab Ghani, M.R.; Gan, C.K. Energy performance investigation of nanofluid-based concentrated photovoltaic / thermal-thermoelectric generator hybrid system. Int. J. Energy Res. 2021, 45, 9039–9057. [Google Scholar] [CrossRef]
- Liu, C.; Ye, W.; Li, H.; Liu, J.; Zhao, C.; Mao, Z.; Pan, X. Experimental study on cascade utilization of ship’s waste heat based on TEG-ORC combined cycle. Int. J. Energy Res. 2020, 45, 4184–4196. [Google Scholar] [CrossRef]
- Mamur, H.; Ahiska, R. Application of a DC–DC boost converter with maximum power point tracking for low power thermoelectric generators. Energy Convers. Manag. 2015, 97, 265–272. [Google Scholar] [CrossRef]
- Torrecilla, M.C.; Montecucco, A.; Siviter, J.; Knox, A.R.; Strain, A. Novel model and maximum power tracking algorithm for thermoelectric generators operated under constant heat flux. Appl. Energy 2019, 256, 113930. [Google Scholar] [CrossRef]
- Torrecilla, M.C.; Montecucco, A.; Siviter, J.; Strain, A.; Knox, A.R. Transient response of a thermoelectric generator to load steps under constant heat flux. Appl. Energy 2018, 212, 293–303. [Google Scholar] [CrossRef] [Green Version]
- Yu, C.; Chau, K.T. Thermoelectric automotive waste heat energy recovery using maximum power point tracking. Energy Convers. Manag. 2009, 50, 1506–1512. [Google Scholar] [CrossRef]
- Verma, V.; Kane, A.; Singh, B. Complementary performance enhancement of PV energy system through thermoelectric generation. Renew. Sustain. Energy Rev. 2016, 58, 1017–1026. [Google Scholar] [CrossRef]
- Twaha, S.; Zhu, J.; Li, B.; Yan, Y.; Huang, K. Parameter analysis of thermoelectric generator/dc-dc converter system with maximum power point tracking. Energy Sustain. Dev. 2017, 41, 49–60. [Google Scholar] [CrossRef]
- Rezk, H.; Aly, M.; Al-Dhaifallah, M.; Shoyama, M. Design and Hardware Implementation of New Adaptive Fuzzy Logic-Based MPPT Control Method for Photovoltaic Applications. IEEE Access 2019, 7, 106427–106438. [Google Scholar] [CrossRef]
- Reddy, K.J.; Sudhakar, N. ANFIS-MPPT control algorithm for a PEMFC system used in electric vehicle applications. Int. J. Hydrogen Energy 2019, 44, 15355–15369. [Google Scholar] [CrossRef]
- Mohamed, M.A.; Diab, A.A.Z.; Rezk, H. Partial shading mitigation of PV systems via different meta-heuristic techniques. Renew. Energy 2019, 130, 1159–1175. [Google Scholar] [CrossRef]
- Rezk, H.; Eltamaly, A.M. A comprehensive comparison of different MPPT techniques for photovoltaic systems. Sol. Energy 2015, 112, 1–11. [Google Scholar] [CrossRef]
- Bayat, P.; Baghramian, A. A novel self-tuning type-2 fuzzy maximum power point tracking technique for efficiency enhancement of fuel cell based battery chargers. Int. J. Hydrogen Energy 2020, 45, 23275–23293. [Google Scholar] [CrossRef]
- Kanagaraj, N.; Rezk, H.; Behiri, M.R.G. A Variable Fractional Order Fuzzy Logic Control Based MPPT Technique for Improving Energy Conversion Efficiency of Thermoelectric Power Generator. Energies 2020, 13, 4531. [Google Scholar] [CrossRef]
- Salomon, R. Evolutionary algorithms and gradient search: Similarities and differences. IEEE Trans. Evol. Comput. 1998, 2, 45–55. [Google Scholar] [CrossRef]
- Ariyarit, A.; Kanazaki, M.; Bureerat, S. An approach combining an efficient and global evolutionary algorithm with a gradi-ent-based method for airfoil design problems. Smart Sci. 2020, 8, 14–23. [Google Scholar] [CrossRef]
- Rezk, H.; Ali, Z.M.; Abdalla, O.; Younis, O.; Gomaa, M.R.; Hashim, M. Hybrid Moth-Flame Optimization Algorithm and Incremental Conductance for Tracking Maximum Power of Solar PV/Thermoelectric System under Different Conditions. Mathematics 2019, 7, 875. [Google Scholar] [CrossRef] [Green Version]
- Twaha, S.; Zhu, J.; Yan, Y.; Li, B.; Huang, K. Performance analysis of thermoelectric generator using dc-dc converter with incremental conductance based maximum power point tracking. Energy Sustain. Dev. 2017, 37, 86–98. [Google Scholar] [CrossRef]
- Shanmugam, S.; Eswaramoorthy, M.; Veerappan, A.R. Modeling and Analysis of a Solar Parabolic Dish Thermoelectric Generator. Energy Sources Part A Recovery Util. Environ. Eff. 2014, 36, 1531–1539. [Google Scholar] [CrossRef]
- Zhao, W.; Zhang, Z.; Wang, L. Manta ray foraging optimization: An effective bio-inspired optimizer for engineering applications. Eng. Appl. Artif. Intell. 2020, 87, 103300. [Google Scholar] [CrossRef]
- Al-Dhaifallaha, M.; Nassefa, A.M.; Rezka, H.; Nisar, K.S. Maximum Power Point Tracking Converter Based on the Open-Circuit Voltage Method for Thermoelectric Generators. Solar Energy 2018, 159, 650–664. [Google Scholar]
Publisher’s Note: MDPI stays neutral with regard to jurisdictional claims in published maps and institutional affiliations. |
© 2021 by the authors. Licensee MDPI, Basel, Switzerland. This article is an open access article distributed under the terms and conditions of the Creative Commons Attribution (CC BY) license (https://creativecommons.org/licenses/by/4.0/).